Abstract
The rise in greenhouse gases, particularly carbon dioxide (CO2) emissions, in the atmosphere is one of the major causes of global warming and climate change. The production of ordinary Portland cement (OPC) emits harmful CO2 gases, which contribute to sporadic heatwaves, rapid melting of glaciers, flash flooding, and food shortages. To address global warming and climate change challenges, this research study explores the use of a cement-less recycled aggregate concrete, a sustainable approach for future constructions. This study uses fly ash, an industrial waste of coal power plants, as a 100% substitute for OPC. Moreover, this research study also uses recycled coarse aggregates (RCAs) as a partial to complete replacement for natural coarse aggregates (NCAs) to preserve natural resources for future generations. In this research investigation, a total of 60 pull-out specimens were prepared to investigate the influence of steel bar diameter (9.5 mm, 12.7 mm, and 19.1 mm), bar embedment length, (4 and 6), and percentage replacements of NCA with RCA (25%, 50%, 75%, and 100%) on the bond stress behavior of cement-less RA concrete. The test results exhibited that the bond stress of cement-less RCA concrete decreased by 6% with increasing steel bar diameter. Moreover, the bond stress decreased by 5.5% with increasing bar embedment length. Furthermore, the bond stress decreased by 7.6%, 7%, 8.8%, and 20.4%, respectively, with increasing percentage replacements (25%, 50%, 75%, and 100%) of NCA with RCA. An empirical model was developed correlating the bond strength to the mean compressive strength of cement-less RCA concrete, which matched well with the experimental test results and predictions of the CEB-FIP model for OPC. The CRAC mixes exhibited higher costs but significantly lower embodied CO2 emissions than OPC concrete.
1. Introduction
OPC concrete is the most employed construction material globally. The construction sector contributes about 8% of the world’s total CO2 emissions, primarily from the yearly production of over 4 billion tons of cement []. Consequently, there has been an increasing demand for alternative supplementary cementitious materials (SCMs) to replace traditional binders in the production of concrete. In the existing research, fly ash (FA), ground granulated blast furnace slag (GGBS), metakaolin, rice husk ash, etc., have mainly been investigated as partial replacements for ordinary Portland cement (OPC) for sustainable infrastructure construction [].
Geopolymer concrete (GPC), a cement-less concrete, was first introduced in 1979 [,]. FA is a commonly used primary binder and an alternative to ordinary Portland cement (OPC) in GPC, as FA is rich in alumina and silica contents. The improved mechanical characteristics and up to 50% reduction in CO2 emissions have led researchers to investigate GPC as a viable alternative to OPC concrete in different structural components [,,,]. Notably, studies have revealed that GPC beams exhibit structural behavior similar to that of OPC concrete beams []. Moreover, GPC columns demonstrated a remarkable increase of up to 34% in their load-carrying capacity compared to equivalent OPC concrete columns [].
The rising concerns of depleting natural resources of aggregates and increasing construction and demolition (C&D) wastes have prompted researchers to investigate the mechanical properties of recycled coarse aggregate (RCA) concrete (RAC). RAC structures are considered sustainable as recycling offers numerous advantages such as reducing the extraction of natural sources, reducing the number of landfills, reducing the carbon footprint, and enhancing environmental conservation. In China, 1.6 billion tons of C&D wastes are generated annually []. In structural applications with normal-strength concrete (50 MPa at 28 days), RILEM permits 100% replacement, whereas the German standard (DIN) permits 90% replacement and the Australian standard (AS) and Italian standard permit 30% replacement of NCA with RCA. The Canadian standard does not permit RCA for structural applications. The ACI and Chinese standards permit 95% and 100% replacement of NCA with RCA, respectively [].
The performance of the reinforced concrete (RC) is mainly dependent on the adequate bond stress between the concrete and the reinforcing steel bar. The bond stress is a localized shearing stress, which originates from the mutual adhesion and shear interlocking between reinforcing steel and the surrounding concrete. Bond stress is the function of the compressive strength of concrete and is directly proportional to compressive strength up to 20 MPa []. Numerous studies in the existing literature have reported the influences of different parameters, i.e., types of concrete, compressive strength of concrete, embedment length of bar, diameter of bar, and deformations on the reinforcing bar on the bond stress behavior of concrete.
Sarker [] investigated the influence of concrete type (OPC vs. GPC) on the bond stress of FA-based GPC. The study reported that heat-cured GPC specimens resisted a higher bond stress than OPC concrete specimens due to the higher splitting tensile strength of GPC. Similarly, Castel and Foster [] studied the influence of concrete type (OPC vs. GPC) on bond stress. It was reported that, for an equivalent compressive strength, the bond strength of heat-cured GPC (FA + GGBS) was 10% greater than that of OPC concrete.
Shen et al. [] reported increased bond stress and a reduction in the corresponding slip with an increase in compressive strength from 52.6 MPa to 62.6 MPa. Boopalan et al. [] reported that ambient-cured GPC pull-out specimens attained about 50% higher early chemical adhesive bond strengths at 7 days than OPC pull-out specimens. Hosseini et al. [] explored the influences of percentage replacements of FA (5%, 15%, and 25%) with OPC and curing durations (7, 28, and 90 days) on bond stress. The results showed that a 15% replacement of FA with OPC resulted in an increased bond stress by 13% and 21%, respectively, at 28 and 90 days. Waqas et al. [] investigated the influence of slag content (10%, 20%, 30%, and 50%), the sodium silicate (NS) to sodium hydroxide (NH) ratio (NS/NH = 2.0, 2.5, and 3.0), and sodium hydroxide molarity (10 M, 12 M, and 14 M). The test results revealed that compressive strength increased with the increasing molarity of the NaOH solution and slag content.
Sarker [] reported the influence of compressive strength on the bond stress of FA-based GPC. The study reported that bond stress increased by 26.5% with increasing compressive strength from 30 MPa to 39.5 MPa. Vinothini et al. [] reported the influence of varying compressive strengths, i.e., 25.8 MPa, 39.2 MPa, and 56.4 MPa, on the bond stress of ambient-cured GPC (FA + GGBS). The bond stress of GPC was increased by 8.5% with increasing compressive strength. Shen et al. [] reported the influence of high-strength concrete on early age bond stress. It was observed that the early age bond stress increased by about 151% from Day 1 to Day 3. Le et al. [] investigated the influence of varying grades, i.e., 20 MPa, 30 MPa, and 40 MPa of GPC, on the bond stress behavior of GPC. The study reported that bond stress increased by about 1.97 to 2.56 times with an increasing grade of concrete. Ganesan et al. [] investigated the influence of varying the percentage of fibers (0.25%, 0.50%, 0.75%, and 1%) on the bond stress of heat-cured GPC. The study noted that pull-out specimens reinforced with 0.75% of steel fibers by mass exhibited the maximum bond stress.
Ganesan et al. [] investigated the influence of varying diameters of embedded steel bar (10 mm, 12 mm, and 16 mm) on the bond stress of heat-cured GPC. The study noted that pull-out specimens with a 10 mm embedded steel bar failed by yielding, whereas 12 mm embedded steel bar specimens exhibited pull-out failure. Cui et al. [] noted that heat-cured GPC and OPC pull-out specimens comprising a plain bar exhibited pull-out failure, whereas pull-out specimens reinforced with deformed steel bars exhibited splitting of the concrete matrix failure. Majain et al. [] investigated the influence of varying bar diameters (12 mm, 16 mm, and 20 mm) on the bond stress of steel hooked end fiber-reinforced high-strength self-compacting concrete. The study noted that an addition of 1% steel fibers changed the mode of failure from splitting failure to pull-out failure.
Vinothini et al. [] reported the influence of varying embedment lengths (75 mm, 100 mm, and 125 mm) on the bond stress of ambient-cured GPC (FA + GGBS). The bond stress decreased from 8.2 MPa to 5.9 MPa as the embedment length was increased from 75 mm to 125 mm. Romanazzi et al. [] reported the influence of the embedment length (2.5 to 5) on the bond stress of steel-reinforced GPC pull-out specimens and the bond stress was decreased with increasing embedment length. Zhang et al. [] reported that the bond stress of ultrahigh-strength steel bars with spiral grooves embedded in RAC decreased with increasing embedment length.
Hameed et al. [] investigated the influences of percentage replacements of recycled coarse aggregate (RCA) with natural coarse aggregate (NCA), i.e., 50% and 100%, and fiber types, i.e., steel hooked end and polypropylene fibers. The study reported that a 50% replacement of NCA with RCA exhibited no influence on bond stress; however, the 100% replacement of NCA with RCA without fibers exhibited a significant reduction in bond stress. On the other hand, 100% replacement of NCA with RCA with steel fiber and polypropylene fiber resisted a similar bond stress as 0% replacement of NCA with RCA without fibers. Gao et al. [] investigated the influence of varying percentages of steel fibers (0%, 0.5%, 1%, and 1.5%) on the bond stress of OPC concrete specimens. The study noted that the bond stress was increased with an increasing percentage of fibers and an optimum bond stress was attained using 1.5% steel fibers.
Xiao et al. [] reported the influence of percentage replacements of NCA with RCA (0%, 50%, and 100%) and types of steel rebar ( plain and deformed) on the bond stress behavior of recycled aggregate concrete (RAC). The test results exhibited a reduction in bond stress with increasing percentage replacements of NCA with RCA using a plain rebar; however, no clear trend in bond stress with increasing percentage replacements of NCA with RCA using a deformed rebar was observed. Prince and Singh [] investigated the bond stress of RAC with varying percentage replacements of NCA with RCA (0, 25, 50, 75, and 100%). The results exhibited that the bond stress of concrete prepared with RCA was higher than that of concrete prepared with NCA. Moreover, the maximum bond stress was obtained at 100% replacement of NCA with RCA.
In the available literature, numerous studies have investigated the bond stress behavior of OPC concrete prepared with NCA and RCA, and fewer studies have reported the bond stress behavior of GPC prepared with NCA. The bond stress behavior of GPC prepared with RCA still needs to be thoroughly investigated. It is pertinent to note that large quantities of construction and demolition (C&D) wastes are produced in the world. The utilization of RCA produced from C&D waste in GPC is a cost-effective and environmentally friendly sustainable approach. This research aims to investigate the influence of NCA on the bond stress behavior of ambient-cured GPC (cement-less concrete) with RCA for wide applications in the construction industry. This research investigates the influences of recycled aggregates, reinforcing bar diameter, compressive strength, and embedment length on bond stress.
2. Materials and Methods
2.1. Experimental Program
To prepare cement-less recycled aggregate concrete (CRAC) mixes, the ambient-cured CRAC mix prepared with the 14 M NaOH solution, Na2SiO3/NaOH of 1.5, and AA/FA of 0.5 with a target compressive strength of 21 MPa was selected as a base mix obtained from the research study of Ghafoor et al. []. Five CRAC mixes with varying percentage replacements of natural coarse aggregate (NCA) with recycled coarse aggregate (RCA) were prepared. Mix-I comprised 100% NCA and 0% RCA. Mix-II comprised 75% NCA and 25% RCA. Mix-III comprised 50% NCA and 50% RCA. Mix-IV comprised 25% NCA and 75% RCA. Mix-V comprised 0% NCA and 100% RCA. Corresponding to each CRAC mix, three varying diameters of reinforcing bar (9.5 mm, 12.7 mm, and 19.1 mm) and two embedment lengths (4 and 6) were investigated.
2.2. Materials
To prepare CRAC mixes, fly ash (FA) was procured from the Sahiwal Coal Power Plant built under the China Pakistan Economic Corridor (CPEC). FA was used as a 100% replacement for cement in the CRAC mix (Figure 1a). The fine aggregates (Lawrencepur sand) were sourced from Punjab, Pakistan (Figure 1b). The NCA were sourced from Margalla Hills, Punjab, Pakistan (Figure 1c). The RCA was prepared by crushing waste concrete with concrete compressive strengths between 21 MPa and 28 MPa using the concrete crusher in the Plain and Reinforced Concrete (PRC) Lab, Civil Engineering Department (CED), University of Engineering and Technology (UET), Lahore (Figure 1d) (Figure 2). The alkaline activator solution comprised sodium hydroxide (NaOH) solution and sodium silicates (Na2SiO3) solution obtained from the local vendor (Figure 3).
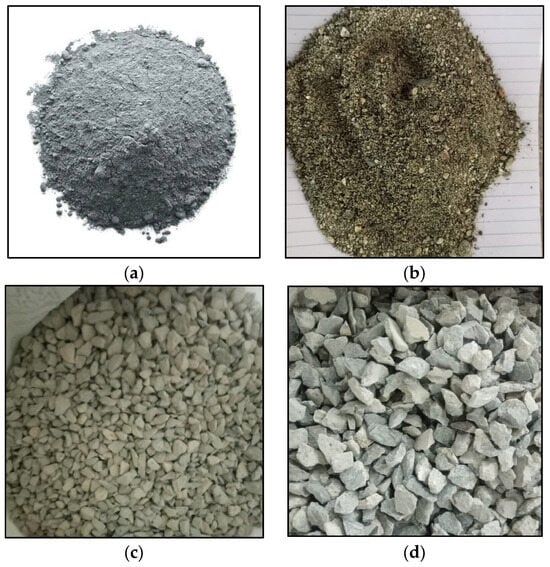
Figure 1.
The materials used in GPC are (a) fly ash, (b) sand, (c) NCA, and (d) RCA.
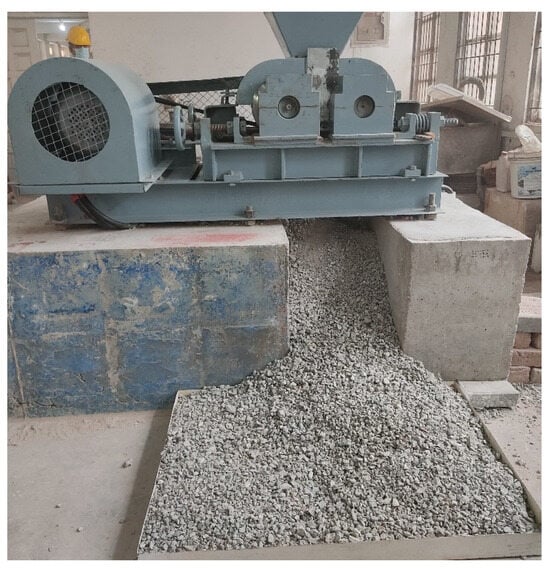
Figure 2.
Concrete crusher machine.
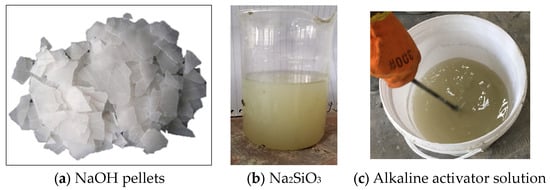
Figure 3.
Stages in the preparation of alkaline activator solution used in GPC.
The FA was light grey in color. The specific gravity of the FA was measured as 2.21 g/cm3 using the Le Chatelier Flask apparatus []. The chemical analysis of the FA was carried out in the Chemical Engineering Lab at UET, Lahore, according to ASTM C114-23 []. The sum of (79.15%), (3.01%), and (2.19%) in the FA was significantly greater than 50%. Moreover, the (0.32%) content was less than 6%. Furthermore, the loss on ignition (L.O.I.) of the FA (3.1%) was less than 6% (Table 1). The FA was classified as Class F FA according to ASTM C618-22 [].

Table 1.
Chemical composition of fly ash.
In this research, NCA with sizes between 9.5 mm and 12.7 mm was used in the CRAC mixes. RCA was prepared by crushing ordinary Portland cement (OPC) concrete cylinders with compressive strengths between 21 MPa and 28 MPa in the PRC Lab, CED, UET, Lahore. The OPC concrete cylinders were crushed using the crusher machine (Figure 2). Afterwards, the crushed aggregates, which passed the sieve size #4 (12.7 mm) and were retained on the sieve size #3 (9.5 mm) were collected. RCA with sizes from 9.5 mm to 12.7 mm was collected, washed, cleaned, and stored in a dry place. The aggregate crushing value (ACV) and aggregate impact value (AIV) of NCA and RCA were determined according to BS 812-110:1990 [] and BS 812-112:1990 [], respectively. The ACV and AIV of NCA were 23.5 and 23.1, respectively. The ACV and AIV of RCA were 34.6 and 33.2, respectively. The water absorption and bulk density of NCA and RCA were determined according to ASTM C127-15 [] and ASTM C29-97 [], respectively. The water absorption and bulk density of NCA were 1.6% and 1732 kg/m3, respectively. The water absorption and bulk density of RCA were 4.5% and 1541 kg/m3, respectively. The measured fineness modulus of Lawrencepur sand was 2.35 according to ASTM C136-19 []. The water absorption and bulk density of sand were 4.5% and 1837 kg/m3, respectively. The pull-out specimens were reinforced with deformed steel bars of varying diameters (9.5 mm, 12.7 mm, and 19.1 mm). The steel bars were tested under tension according to ASTM A615M-22 []. The steel bars were tested under tension under the force-controlled load rate. The percentage elongation of tested bars under tension was computed by marking 50 mm gauge lengths on the 500 mm steel reinforcing bar. The average yield strength, average ultimate strength, and percentage elongation of tested steel bars are presented in Table 2.
Table 2.
Mechanical properties of steel bars used in the pull-out test.
The NaOH solids and Na2SiO3 solution were procured from a local vendor in Pakistan. The 14 M NaOH solution was prepared by dissolving 42.75% NaOH pellets (540 g solids) in 1000 mL water (Figure 3). The 14 M NaOH solution was prepared 24 h prior to the casting. The Na2SiO3 solution and NaOH solution were mixed in a ratio of 1.5 to 1.
The test matrix comprised 30 different combinations of percentage replacements of NCA with RCA, reinforcing bar diameters, and embedment lengths. A total of 60 pull-out specimens and 10 compression specimens (cylinders of 150 mm diameter and 300 mm height) were cast and tested to investigate the influence of varying percentage replacements of NCA with RCA, diameter of reinforcing bars, and embedment lengths (Table 3).
Table 3.
Test matrix.
The pull-out specimen designation comprised four alphabets/numbers. The first alphabet/number represented the percentage of NCA (N100, N75, N50, N25, and N0), the second alphabet/number represented the percentage of RCA (R0, R25, R50, R75, and R100), the third alphabet/number represented the reinforcing bar diameter (9.5D, 12.7D, and 19.1D), and the fourth alphabet/number represented the embedment length (4E and 6E).
2.3. Preparation of Test Samples
To prepare pull-out and compression test specimens, the molds were cleaned and oiled. The pictorial details of the pull-out test specimen are shown in Figure 4. The pull-out specimen comprised a 150 mm diameter and 300 mm height concrete cylinder with varying percentage replacements of NCA with RCA, and a longitudinal steel reinforcing bar of varying diameters and embedment lengths.
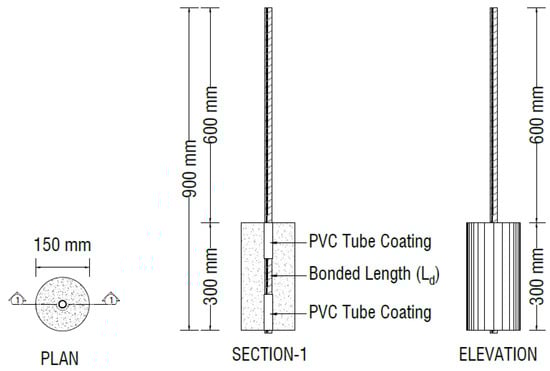
Figure 4.
Detail of pull-out test specimen.
At first, the top and bottom parts of the steel bar to be embedded in concrete were enveloped in PVC tubes. The middle part of the embedded steel was left unenveloped, which was to be bonded with concrete (Figure 5). Afterwards, the steel bar was concentrically placed in the pull-out cylindrical mold and the steel bar was embedded within the cylindrical mold for a required embedment length (4 and 6) (Figure 6). The top and bottom joints of the embedded length were sealed with silicone gel. To keep the steel bar truly vertical, a steel cap and a wooden plate with a hole equal to the bar diameter were placed at the top and bottom ends, respectively (Figure 7).
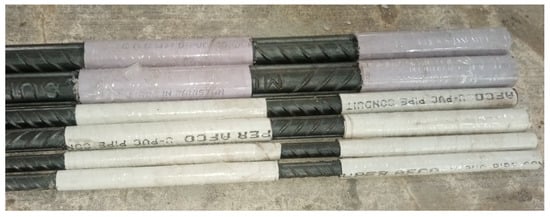
Figure 5.
Steel bars enveloped with PVC tubes.
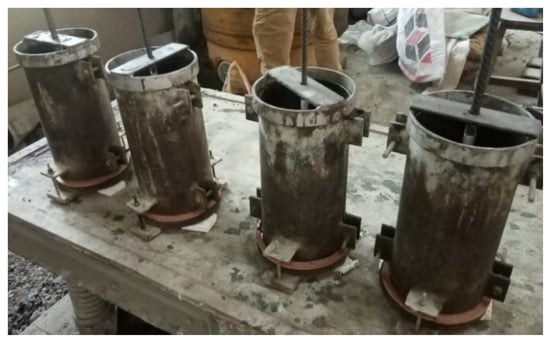
Figure 6.
Cylindrical molds placed on a mechanical vibrating table before concrete pouring.
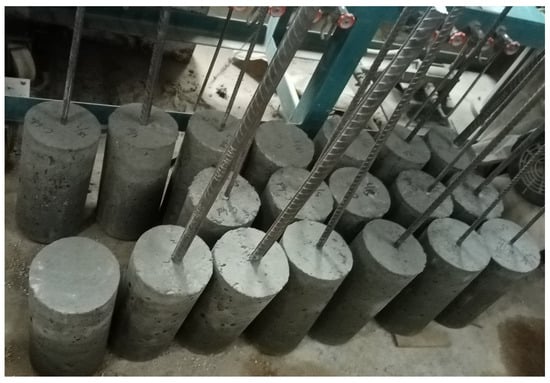
Figure 7.
Demolded samples stored at room temperature.
The casting of the cement-less recycled aggregate concrete (CRAC) mix comprised two stages. In the first stage, the fly ash, NCA, RCA, and sand were dry mixed in the concrete mixer for 2 to 3 min. In the second stage, the alkaline activator solution comprising NaOH solution and Na2SiO3 solution were added to the dry mix and mixed for another 1 to 2 min. During the wet mixing, the additional water (10% by mass of FA) was added to attain the desired consistency of the CRAC mix.
The slump of the CRAC mix was determined using the slump cone apparatus according to ASTM C143-20 []. The pull-out and cylindrical test molds were filled in three layers, and each layer was vibrated using the mechanical vibrating table for about 30 s. The specimens were demolded after 24 h of casting and were cured at room temperature for 28 days (Figure 7).
2.4. Testing Procedure
The pull-out specimens were tested in a 1000 kN Shimadzu Universal Testing Machine (UTM) under the displacement-controlled load application of 2 mm/min according to ASTM C900-19 []. For each mix, two cylinders were tested at 28 days and the average compressive strength was measured []. The pull-out test setup is shown in Figure 8.
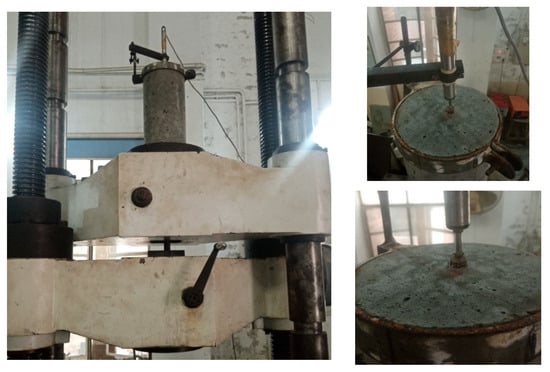
Figure 8.
Pull-out test setup.
The pull-out specimen was fixed upside down in the UTM with an embedded reinforcing steel bar fixed in the loading platens of the UTM. To measure the displacement/slip of an embedded steel bar in pull-out specimen, a linearly varying displacement transducer (LVDT) was fixed on the unloaded end of the steel bar. The force and the displacement/slip data were obtained from the data acquisition system attached to the UTM. Similarly, the load–deformation curves of the tested cylinders were obtained from the data acquisition system attached to the UTM.
3. Results and Discussion
The tested pull-out specimens exhibited three different failures, i.e., yielding of the steel bar, bond failure, and splitting of the concrete. Bond failure and yielding of the steel bar are characteristic pull-out failures.
The yield stresses for 9.5 mm and 12.7 mm diameter bars were 477.3 MPa and 455 MPa, respectively (Table 2). Based on the yield stress, the yield load for 9.5 mm and 12.7 mm diameter bars were 33.8 kN and 57.6 kN, respectively. Few pull-out specimens reinforced with 9.5 mm and 12.7 mm diameter bars failed due to the yielding of the embedded steel bar. The failure loads for Specimens NAC-100-0-10-6d and NAC-100-0-13-6d were higher than their corresponding yield loads. In this type of failure, the steel bar reached yielding stress before the bond between the concrete and steel failed. This indicated that the bond stress between the concrete and the steel was higher than the tensile strength of the steel.
In most of the specimens, failure occurred due to bond failure between the embedded steel bar and the surrounding concrete. This type of failure occurred when the bond stress between the concrete and the steel was lower than the tensile strength of the steel. The bond failure indicated that the interface between steel reinforcement and the concrete matrix could not withstand the applied tensile forces, which resulted in the separation of the reinforcement from the surrounding concrete. The bond failure was observed in 9.5 mm and 12.7 mm diameter embedded steel bars. The observed failure patterns in the case of the yielding of the steel bar and bond failure were similar (Figure 9).
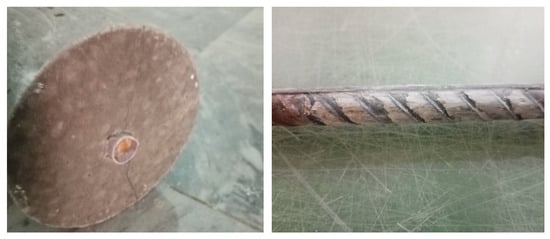
Figure 9.
Yielding/bond failure in tested pull-out specimens.
The pull-out test specimens comprising a 19.1 mm diameter steel bar failed due to the splitting of the concrete. This type of failure is often attributed to the development of hoop stresses around an embedded steel bar of a larger diameter. The hoop stresses developed due to the confinement effect of reinforcement, which produced radial cracks propagating outward from the interface of the concrete and the reinforcement. The increasing applied load eventually led to the complete splitting of the surrounding concrete around the reinforcement (Figure 10).
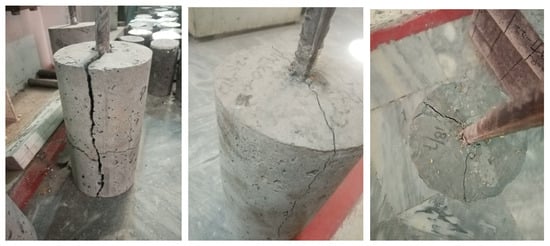
Figure 10.
Splitting failure in pull-out test specimens.
The bond stress is assumed to be uniformly distributed along the embedment length of the steel bar. The interaction between the concrete and the embedded steel has a significant influence on the overall structural performance. The bond stress, , at the interface between the concrete and the steel bar was calculated using Equation (1).
where
- = Maximum failure load (N);
- = Diameter of steel bar (mm);
- = Embedment length (mm).
The mechanism of bond stress transfer influences the load transfer capacity, crack development, and overall structural behavior of concrete. Three primary bond stress transfer mechanisms are chemical adhesion, friction, and mechanical interlocking. In pull-out test specimens with plain bars, the bond stress transfer mechanism primarily occurs due to the chemical adhesion and friction, without mechanical interlocking. In pull-out test specimens with deformed steel bars, the bond stress transfer is due to the chemical adhesion, friction, and mechanical interlocking. Deformations on the steel bar provide a larger surface area for mechanical interlocking with the surrounding aggregates. In addition, deformations provide increased roughness and enhanced possibilities for the formation of a thin layer of concrete matrix around the deformed bar, which leads to enhanced adhesion and chemical bonding between the bar and the concrete.
This study investigated the influences of the embedment lengths (4 and 6), diameters of the embedded steel bar (9.5 mm, 12.7 mm, and 19.1 mm), and percentage replacements of NCA with RCA (0%, 25%, 50%, 75%, and 100%) on the bond stress–slip behavior of a steel bar embedded in GPC specimens (Table 4).
Table 4.
Bond stress results of tested pull-out specimens.
3.1. Influence of Embedment Length
Figure 11 presents the influence of varying embedment lengths of steel bar (4 and 6) in CRAC pull-out specimens. It was observed that the bond stress decreased with increasing embedment length for all diameters of embedded steel bar and percentage replacements of NCA with RCA in CRAC. For mixes prepared with 100% NCA and 0% RCA (N100-R0), the bond stress was decreased by 7.27%, 9.30%, and 10.90%, respectively, for 9.5 mm, 12.7 mm, and 19.1 mm diameter steel bars. Moreover, for mixes prepared with 75% NCA and 25% RCA (N75-R25), the bond stress was decreased by 2.51%, 3.76%, and 3.35%, respectively, for 9.5 mm, 12.7 mm, and 19.1 mm diameter steel bars. Furthermore, for mixes prepared with 50% NCA and 50% RCA (N50-R50), the bond stress was decreased by 4.71%, 0%, and 1.15%, respectively, for 9.5 mm, 12.7 mm, and 19.1 mm diameter steel bars. Similarly, for mixes prepared with 25% NCA and 75% RCA (N25-R75), the bond stress was decreased by 1.09%, 3.45%, and 9.83%, respectively, for 9.5 mm, 12.7 mm, and 19.1 mm diameter steel bars. For mixes prepared with 0% NCA and 100% RCA, the bond stress was decreased by 10%, 7.05%, and 8.03%, respectively, for 9.5 mm, 12.7 mm, and 19.1 mm diameter steel bars.
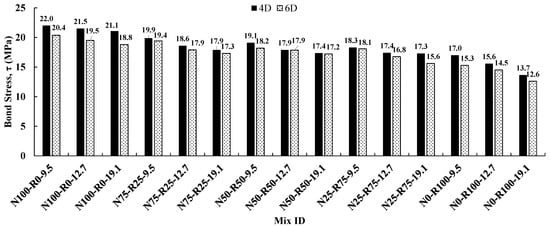
Figure 11.
Influence of embedment lengths on bond stress of CRAC mixes.
It was noted that bond stress reduced by about 5.5% with increasing embedment length for all CRAC mixes, as applied load was distributed over a larger surface area with an increasing embedment length. In the existing literature, Kathrival et al. [] and Kim and Park [] also reported a reduction in bond stress with increasing embedment length for varying percentages of replacement.
3.2. Influence of Bar Diameter
Figure 12 presents the influence of varying diameters (9.5 mm, 12.7 mm, and 19.1 mm) of embedded steel bar on the bond stress of CRAC. The bond stress was decreased with increasing diameters of the embedded steel bar for all embedment lengths of the steel bar and percentage replacements of NCA with RCA. For mixes prepared with 100% NCA and 0% RCA (N100-R0) and an embedment length of 4, the bond stress was decreased by 2.27% and 15.35%, respectively, as the diameter of the steel bar was increased from 9.5 to 12.7 mm and 12.7 to 19.1 mm. Moreover, for mixes prepared with 75% NCA and 25% RCA (N75-R25) and an embedment length of 4, the bond stress was decreased by 6.53% and 3.76%, respectively, as the diameter of the steel bar was increased from 9.5 to 12.7 mm and 12.7 to 19.1 mm. Furthermore, for mixes prepared with 50% NCA and 50% RCA (N50-R50) and an embedment length of 4, the bond stress was decreased by 6.81% and 2.25%, respectively, as the diameter of the steel bar was increased from 9.5 to 12.7 mm and 12.7 to 19.1 mm. Similarly, for mixes prepared with 25% NCA and 75% RCA (N25-R75) and an embedment length of 4, the bond stress was decreased by 4.92% and 0.57%, respectively, as the diameter of the steel bar was increased from 9.5 to 12.7 mm and 12.7 to 19.1 mm. Similarly, for mixes prepared with 0% NCA and 100% RCA (N50-R50) and an embedment length of 4, the bond stress was decreased by 8.24% and 12.18%, respectively, as the diameter of the steel bar was increased from 9.5 to 12.7 mm and 12.7 to 19.1 mm.
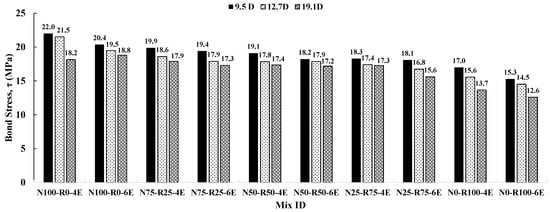
Figure 12.
Influence of varying diameters of embedded steel bar in CRAC mixes.
For mixes prepared with 100% NCA and 0% RCA (N100-R0) and an embedment length of 6, the bond stress was decreased by 4.41% and 3.59%, respectively, as the diameter of steel bar was increased from 9.5 to 12.7 mm and 12.7 to 19.1 mm. Moreover, for mixes prepared with 75% NCA and 25% RCA (N75-R25) and an embedment length of 6, the bond stress was decreased by 7.73% and 3.35%, respectively, as the diameter of the steel bar was increased from 9.5 to 12.7 mm and 12.7 to 19.1 mm. Furthermore, for mixes prepared with 50% NCA and 50% RCA (N50-R50) and an embedment length of 6, the bond stress was decreased by 1.65% and 3.91%, respectively, as the diameter of steel bar was increased from 9.5 to 12.7 mm and 12.7 to 19.1 mm. Similarly, for mixes prepared with 25% NCA and 75% RCA (N25-R75) and an embedment length of 6, the bond stress was decreased by 7.18% and 7.14%, respectively, as the diameter of the steel bar was increased from 9.5 to 12.7 mm and 12.7 to 19.1 mm. Similarly, for mixes prepared with 0% NCA and 100% RCA (N0-R100) and an embedment length of 6, the bond stress was decreased by 5.23% and 13.10%, respectively, as the diameter of the steel bar was increased from 9.5 to 12.7 mm and 12.7 to 19.1 mm.
It was observed that the bond stress decreased by 17.27%, 10.05%, 8.90%, 5.46%, and 19.41%, respectively, for CRAC mixes prepared with N100-R0, N75-R25, N50-R50, N25-R75, and N0-R100 and an embedment length of 4. Similarly, the bond stress was decreased by 7.84%, 10.82%, 5.49%, 13.81%, and 17.65%, respectively, for CRAC mixes prepared with N100-R0, N75-R25, N50-R50, N25-R75, and N0-R100 and an embedment length of 6. Sarker [], Romanazzi et al. [], Kathrival et al. [], and Kim and Park [] reported that bond stress was decreased with the increasing diameter of the steel bar. This was attributed to the larger contact surface area between the reinforcing steel bar and the surrounding concrete, resulting in a distribution of the load over a larger contact area and consequently resulting in a reduction in bond stress.
3.3. Influence of Percentage Replacements of NCA with RCA
Figure 13 presents the influence of percentage replacements of NCA with RCA (0%, 25%, 50%, 75%, and 100%) on the bond stress of CRAC pull-out test specimens. The bond stress was decreased with increasing percentage replacements of NCA with RCA for all diameters of embedded steel bars and embedment lengths. For pull-out specimens with a 9.5 mm diameter steel bar and an embedment length of 4, the bond stress was decreased by 9.54%, 4.02%, 4.19%, and 7.1%, respectively, for percentage replacements of NCA with RCA of 25% (N100-R0 to N75-R25), 50% (N75-R25 to N50-R50), 75% (N50-R50 to N25-R75), and 100% (N25-R75 to N0-R100). Moreover, for pull-out specimens with a 12.7 mm diameter steel bar and an embedment length of 4, the bond stress was decreased by 13.49%, 4.30%, 2.25%, and 10.34%, respectively, for percentage replacements of NCA with RCA of 25% (N100-R0 to N75-R25), 50% (N75-R25 to N50-R50), 75% (N50-R50 to N25-R75), and 100% (N25-R75 to N0-R100). Furthermore, for pull-out specimens with a 19.1 mm diameter steel bar and an embedded length of 4, the bond stress was decreased by 1.65%, 2.79%, 0.57%, and 20.89%, respectively, for percentage replacements of NCA with RCA of 25% (N100-R0 to N75-R25), 50% (N75-R25 to N50-R50), 75% (N50-R50 to N25-R75), and 100% (N25-R75 to N0-R100).
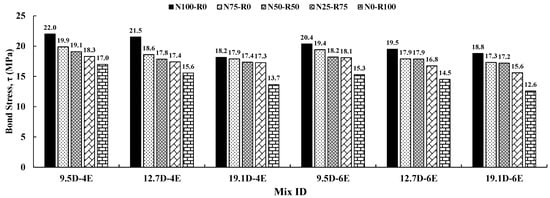
Figure 13.
Influence of varying percentage replacements of NCA with RCA in the CRAC mix.
For pull-out specimens with a 9.5 mm diameter steel bar and an embedment length of 6, the bond stress was decreased by 4.90%, 6.19%, 0.55%, and 15.47%, respectively, for percentage replacements of NCA with RCA of 25% (N100-R0 to N75-R25), 50% (N75-R25 to N50-R50), 75% (N50-R50 to N25-R75), and 100% (N25-R75 to N0-R100). Moreover, for pull-out specimens with a 12.7 mm diameter steel bar and an embedment length of 6, the bond stress was decreased by 8.21%, 0%, 6.15%, and 13.69%, respectively, for percentage replacements of NCA with RCA of 25% (N100-R0 to N75-R25), 50% (N75-R25 to N50-R50), 75% (N50-R50 to N25-R75), and 100% (N25-R75 to N0-R100). Furthermore, for pull-out specimens with a 19.1 mm diameter steel bar and an embedment length of 6, the bond stress was decreased by 7.98%, 0.58%, 9.30%, and 19.23%, respectively, for percentage replacements of NCA with RCA of 25% (N100-R0 to N75-R25), 50% (N75-R25 to N50-R50), 75% (N50-R50 to N25-R75), and 100% (N25-R75 to N0-R100).
It was noted that the bond stress significantly decreased with increasing percentage replacements of NCA with RCA from 0% to 100% for all diameters of reinforcing steel bars and embedment lengths. In the available literature, Zhang et al. [], and Jiang et al. [] reported that increasing percentage replacements of NCA with RCA tend to decrease the bond stress. Firstly, RCA possesses weaker mechanical characteristics compared to NCA, which leads to reduced interfacial bonding between the aggregates and the surrounding concrete matrix. Secondly, RCA may contain irregular shaped aggregates, which hinder proper packing within the concrete mixture, resulting in an overall reduction in strength. Thirdly, the presence of old mortar adhered to RCA surfaces created interfacial discontinuities, weakening the bond between aggregates and the cement paste. Collectively, these factors contributed to the reduction in both the bond stress and the compressive strength with the increasing percentage of RCA in the concrete mix. This highlights the importance of carefully managing and optimizing RCA content in sustainable concrete production.
The compressive strength of the CRAC mix was decreased with increasing percentage replacements of NCA with RCA. For percentage replacements of 0%, 25%, 50%, 75%, and 100%, the compressive strengths of the CRAC mixes were 37.8 MPa, 37.5 MPa, 37.2 MPa, 34.9 MPa, and 26.6 MPa, respectively. The higher compressive strengths improved interfacial bonding between the concrete and the reinforcing steel. The microstructure of higher-strength concrete is denser and exhibits a compact microstructure, which enhances the mechanical interlocking and chemical bonding between the reinforcement and the concrete, leading to an increase in bond stress.
3.4. Stress–Slip Curves
The bond stress versus slip curves illustrated the correlation between the stress transmitted between the reinforcing steel and the surrounding concrete (referred to as bond stress) and the relative displacement or slip. The stress–slip behavior can be differentiated into an initial ascending branch, which is primarily influenced by chemical adhesion, and the descending branch mainly governed by mechanical interlocking. Prior to reaching the maximum bond stress, the slip increment was relatively gradual. However, once the bond stress was decreased to its residual value, the slip started increasing at an increased rate. Notably, pull-out specimens with larger diameters exhibited steeper slopes in the descending branches (Figure 14).
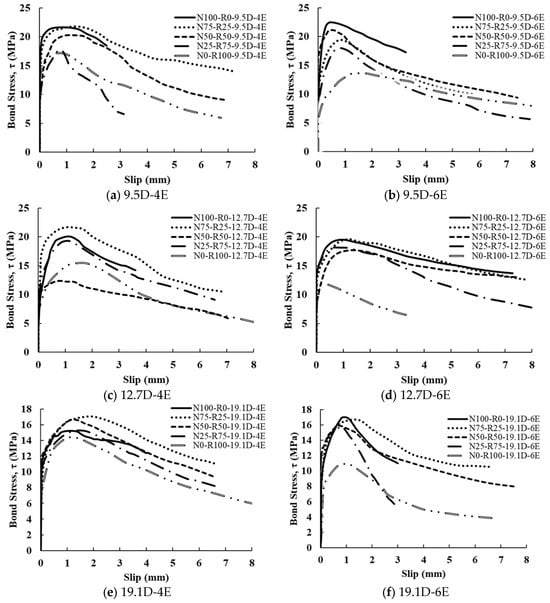
Figure 14.
Stress–slip curves of tested pull-out specimens.
3.5. Theoretical Bond Stress Models
This research aims to provide the empirical regression equation to predict the bond stress of the CRAC mix. Based on the experimental data available in the existing literature and the test results of this study, the bond stress was predicted using the available fib model code [] and Dahou et al. [].
In the fib model code [], the bond stress of OPC concrete with pull-out failure is computed using Equation (2) and the bond stress of OPC concrete with splitting failure using Equation (3).
where is the average concrete cylinder compressive strength.
Dahou et al. [] developed the bond stress equation for pull-out failure using an experimental database of 260 pull-out test specimens of GPC (Equation (4)).
It can be noted that Equation (4) is similar to the fib model (Equation (2)), except for the coefficient, which is 53% greater in Equation (4) than that in Equation (2). This indicated the improved bond stress in GPC. Moreover, Jimenez et al. [] reported that the OPC–steel bar interface area was characterized by a high porosity, whereas the GPC–steel bar interface area was characterized by a compact microstructure, thus improving the bond behavior. The empirical Dahou et al. [] model overestimated the GPC bond stress.
In the available literature, numerous research studies [,,,,,] have reported empirical regression models to predict the bond stress of OPC pull-out specimens and cement-less concrete (GPC) pull-out specimens; these are presented in Table 5.
Table 5.
Bond stress models available in the literature.
The stress–slip curves are based on the model code equation in which the parameter was calibrated using data from the available literature and the test results of this study. According to the data, the bond strength of CRAC pull-out specimens was obtained using Equation (5)
Figure 15 presents a comparison of the analytical predictions of the existing models and the proposed model with the experimental test results of this study. It was noted that Hadi et al. [] significantly underestimated the bond stress at lower compressive strengths, as their model was developed for OPC pull-out test specimens. On the other hand, Dahou et al. [] significantly overestimated the bond stress of the pull-out test specimens. In the available literature, the bond stress predicted using the Azzawi et al. [] model exhibited the best match with the experimental bond stress. The proposed model further improved the prediction of the bond stress of GPC pull-out specimens (Table 6). Based on the analysis of the test results of this study, the coefficient in the model was 18% greater than the fib model for OPC concrete, confirming that the bond between CRAC and the reinforcement was stronger than that for OPC concrete.
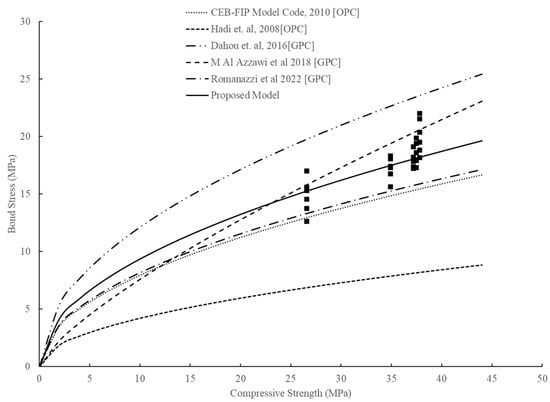
Figure 15.
Analytical predictions of bond stress with varying compressive strength using existing models and the proposed model [,,,,].
Table 6.
Comparison of experimental and predicted bond stresses.
4. Economic Comparison
A cost comparison was conducted for CRAC mixes with varying percentages of NCA replaced with RCA, i.e., 0%, 25%, 50%, 75%, and 100%. The unit prices of materials in the local market were considered for the cost analysis. In this experimental study, the material costs considered were 0.071 USD/kg for OPC, 0.043 USD/kg for fly ash, 0.0035 USD/kg for NCA, 0.001 USD/kg for RCA, 0.0027 USD/kg for fine aggregates, 0.0015 USD/kg for 14M NaOH solution, and 0.214 USD/kg for Na2SiO3 solution []. Table 7 presents the cost comparison of CRAC mixes with varying percentage replacements of NCA with RCA. Notably, for the mix with 100% NCA replaced with RCA, an 11.1% reduction in cost was achieved. Table 8 presented the cost analysis of the OPC concrete mix with an equivalent compressive strength of 35 MPa. The cost per cubic meter values of CRAC mixes with varying percentage replacements of NCA with RCA, i.e., N100-R0, N75-R25, N50-R50, N25-R75, and N0-R100 were 43.8%, 41.2%, 38.6%, 34.4%, and 31.3% higher than that of OPC concrete. The higher costs of CRAC mixes were attributed to the higher costs of alkaline activators. The cost of the CRAC mix can be reduced by using lower molarities of NaOH solution.
Table 7.
Cost analysis of CRAC mixes.
Table 8.
Cost analysis of OPC concrete mix.
5. Environmental Assessment
A comprehensive life cycle analysis was conducted, evaluating the embodied carbon dioxide (e-CO2) emissions of CRAC mixes with varying percentage replacements of NCA with RCA, i.e., 0%, 25%, 50%, 75%, and 100% (Table 9). Additionally, the e-CO2 emissions for OPC concrete with an equivalent compressive strength to that of control mix (CRAC mix with 0% RA replacement) were calculated, as presented in Table 10. The e-CO2 of fly ash, NCA, RCA, sand, and alkaline activator solutions were co-opted from Tauqir et al. []. The e-CO2 of CRAC mixes with varying percentage replacements of NCA with RCA, i.e., N100-R0, N75-R25, N50-R50, N25-R75, and N0-R100 were 57.1%, 59.2%, 61.2%, 63.1%, and 65.1%, respectively, lower than for OPC concrete. The significantly reduced e-CO2 of CRAC mixes is a major advantage to reduce the greenhouse gases and hence rising surface temperatures of the earth. Moreover, the CRAC mix uses industrial wastes, which is a major step towards a circular economy.
Table 9.
Environmental assessment of CRAC mixes.
Table 10.
Environmental assessment of OPC concrete.
6. Conclusions
This study investigated the influences of varying steel bar diameters (9.5 mm, 12.7 mm, and 19.1 mm), embedment lengths (4 and 6), and percentage replacements of natural coarse aggregate (NCA) with recycled coarse aggregate (RCA) (25%, 50%, 75%, and 100%) on the bond stress behavior of cement-less RA concrete (CRAC) mixes. A total of 60 pull-out test specimens were cast and tested. Moreover, an improved model to predict the bond stress of CRAC mixes was proposed. Furthermore, cost analysis and environmental assessment of the CRAC mix and corresponding OPC mix were performed. The following conclusions are drawn based on the experimental and analytical results presented here.
- The bond stress of the CRAC mix was decreased with increasing embedment length from 4 to 6. An average decrease in bond stress of 5.1%, 4.7%, and 6.7%, respectively, was noted for 9.5 mm, 12.7 mm, and 19.1 mm diameter steel bars, with increasing percentage replacements of NCA with RCA from 0 to 100%. The decrease in bond stress with increasing embedment length was attributed to the fact that longer embedment lengths distributed the load over a larger contact area between the reinforcing bar and the surrounding concrete.
- The bond stress of CRAC specimens was also observed to decrease with the increasing diameter of the steel bar from 9.5 mm to 12.7 mm and 12.7 mm to 19.1 mm. An average decrease in bond stress of 5.75% and 6.84%, respectively, was noted when increasing the diameter from 9.5 mm to 12.7 mm and 12.7 mm to 19.1 mm for an embedment length of 4, with increasing percentage replacements of NCA with RCA from 0 to 100%. Similarly, an average decrease in bond stress of 5.24% and 6.20%, respectively, was noted with increasing diameter from 9.5 mm to 12.7 mm and 12.7 mm to 19.1 mm for an embedment length of 6, with increasing percentage replacements of NCA with RCA from 0 to 100%.
- The study found significant reductions in bond stress as the percentage replacement of NCA with RCA was increased from 0 to 100%. The reduction in the average bond stress was 7.63%, 3.58%, 3.84%, and 14.45%, respectively, as the percentage replacements of NCA with RCA increased from 0 to 25%, 25% to 50%, 50% to 75%, and 75% to 100%. This reduction in bond stress was attributed to the reduced mechanical properties of RCA compared to NCA, i.e., the irregularity in shape of RCA particles and the presence of adhered mortar on the RCA surface.
- The proposed model to predict the bond stress of CRAC mixes (CRAC) matched well with the experimental data and test results of existing studies.
- The CRAC mixes with varying percentage replacements exhibited 31.3% to 43.8% higher costs per cubic meter than the OPC concrete mix. However, CRAC mixes with varying percentage replacements exhibited 57.1% to 65.1% reduced e-CO2 emissions compared to the OPC concrete mix.
It is highly recommended to conduct a focused bond study involving plain bars in CRAC. This study should aim to isolate and analyze the roles of adhesion and friction in the bonding mechanism between plain reinforcing bars and the GPC matrix containing RCA.
Author Contributions
Conceptualization, Q.S.K., A.U.Q., S.M.S.K. and M.J.M.; Data curation, H.A.; Formal analysis, Q.S.K. and S.M.S.K.; Investigation, Q.S.K., H.A. and A.U.Q.; Methodology, Q.S.K. and A.U.Q.; Project administration, Q.S.K., A.U.Q., S.M.S.K. and M.J.M.; Resources, Q.S.K., A.U.Q., S.M.S.K. and M.J.M.; Software, H.A.; Supervision, A.U.Q.; Validation, Q.S.K., H.A., S.M.S.K. and M.J.M.; Visualization, H.A., S.M.S.K. and M.J.M.; Writing—original draft, Q.S.K.; Writing—review and editing, H.A., A.U.Q., S.M.S.K. and M.J.M. All authors have read and agreed to the published version of the manuscript.
Funding
This research was funded by the HEC-funded China Pakistan Economic Corridor Collaborative Research Grant, Project No. 221, and the HEC-funded National Research Program for Universities, Project No. 16682.
Data Availability Statement
Data are contained within the article.
Acknowledgments
The authors are thankful to the University of Engineering and Technology, Lahore, Pakistan, for providing the research and testing facilities to conduct this research. The authors are also thankful to HEC for providing funds via the China Pakistan Economic Collaborative Research Grant (P. No. 221) and the National Research Program for Universities (P. No. 16682) for providing all the financial support to carry out this research and testing.
Conflicts of Interest
The authors declare no conflicts of interest.
References
- Lehne, J.; Preston, F. Making concrete change. In Innovation in Low-Carbon Cement and Concrete; Chatham House: London, UK, 2018. [Google Scholar]
- Robayo-Salazar, R. Life cycle assessment (LCA) of an alkali-activated binary concrete based on natural volcanic pozzolan: A comparative analysis to OPC concrete. Constr. Build. Mater. 2018, 176, 103–111. [Google Scholar] [CrossRef]
- Davidovits, J. Chemistry of Geopolymeric systems, terminology. In Proceedings of the 99 Geopolymer International Conference, France, 30 June–2 July 1999; Davidovits, J., Davidovits, R., James, C., Eds.; Geopolymer Institute: Saint-Quentin, France, 1999. [Google Scholar]
- Davidovits, J. Geopolymer cement. A review. Geopolymer Inst. Tech. Pap. 2013, 21, 1–11. [Google Scholar]
- Singh, B. Geopolymer concrete: A review of some recent developments. Constr. Build. Mater. 2015, 85, 78–90. [Google Scholar] [CrossRef]
- Mo, K.H.; Alengaram, U.J.; Jumaat, M.Z. Structural performance of reinforced geopolymer concrete members: A review. Constr. Build. Mater. 2016, 120, 251–264. [Google Scholar] [CrossRef]
- Ding, Y.; Dai, J.-G.; Shi, C.-J. Mechanical properties of alkali-activated concrete: A state-of-the-art review. Constr. Build. Mater. 2016, 127, 68–79. [Google Scholar] [CrossRef]
- Ma, C.-K.; Awang, A.Z.; Omar, W. Structural and material performance of geopolymer concrete: A review. Constr. Build. Mater. 2018, 186, 90–102. [Google Scholar] [CrossRef]
- Sumajouw, M.; Rangan, B.V. Low-Calcium Fly Ash-Based Geopolymer Concrete: Reinforced Beams and Columns. 2006. Available online: http://hdl.handle.net/20.500.11937/23928 (accessed on 15 August 2022).
- Sujatha, T.; Kannapiran, K.; Nagan, S. Strength assessment of heat cured geopolymer concrete slender column. Asian J. Civ. Eng. (Build. Hous.) 2012, 13, 635–646. [Google Scholar]
- Xiao, J.; Wang, C.; Ding, T.; Akbarnezhad, A. A recycled aggregate concrete high-rise building: Structural performance and embodied carbon footprint. J. Clean. Prod. 2018, 199, 868–881. [Google Scholar] [CrossRef]
- Ahmed, H. Recycled aggregate concrete from large-scale production to sustainable field application. Constr. Build. Mater. 2020, 262, 119979. [Google Scholar] [CrossRef]
- Price, W.H. Factors influencing concrete strength. J. Proc. 1951, 47, 417–432. [Google Scholar] [CrossRef]
- Sarker, P.K. Bond strength of reinforcing steel embedded in fly ash-based geopolymer concrete. Mater. Struct. 2011, 44, 1021–1030. [Google Scholar] [CrossRef]
- Castel, A.; Foster, S.J. Bond strength between blended slag and Class F fly ash geopolymer concrete with steel reinforcement. Cem. Concr. Res. 2015, 72, 48–53. [Google Scholar] [CrossRef]
- Shen, D.; Shi, X.; Zhang, H.; Duan, X.; Jiang, G. Experimental study of early-age bond behavior between high strength concrete and steel bars using a pull-out test. Constr. Build. Mater. 2016, 113, 653–663. [Google Scholar] [CrossRef]
- Boopalan, C.; Rajamane, N.P.; Jeyalakshmi, R. Studies on adhesive bond strength of steel reinforcing bars with fly ash based-ambient cured geopolymer concrete. In AIP Conference Proceedings; AIP Publishing: Melville, NY, USA, 2018; Volume 2030, No. 1. [Google Scholar]
- Hosseini, S.A.; Bagheri, M. The effect of fly ash on the bond strength of steel reinforcement and concrete. Iran. J. Sci. Technol. Trans. Civ. Eng. 2022, 46, 285–292. [Google Scholar] [CrossRef]
- Waqas, R.M.; Butt, F.; Zhu, X.; Jiang, T.; Tufail, R.F. A comprehensive study on the factors affecting the workability and mechanical properties of ambient cured fly ash and slag based geopolymer concrete. Appl. Sci. 2021, 11, 8722. [Google Scholar] [CrossRef]
- Vinothini, M. Bond strength behaviour of geopolymer concrete. Malays. J. Civ. Eng. 2015, 27, 371–381. [Google Scholar]
- Le, T.A.; Nguyen, T.N.; Nguyen, K.T. Experimental, numerical, and theoretical studies of bond behavior of reinforced fly ash-based geopolymer concrete. Appl. Sci. 2022, 12, 7812. [Google Scholar] [CrossRef]
- Ganesan, N.; Indira, P.V.; Santhakumar, A. Bond behaviour of reinforcing bars embedded in steel fibre reinforced geopolymer concrete. Mag. Concr. Res. 2015, 67, 9–16. [Google Scholar] [CrossRef]
- Cui, Y.; Zhang, P.; Bao, J. Bond Stress between Steel-Reinforced Bars and Fly Ash-Based Geopolymer Concrete. Adv. Mater. Sci. Eng. 2020, 2020, 9812526. [Google Scholar] [CrossRef]
- Majain, N.; Rahman, A.B.A.; Adnan, A.; Mohamed, R.N. Bond behaviour of deformed steel bars in steel fibre high-strength self-compacting concrete. Constr. Build. Mater. 2022, 318, 125906. [Google Scholar] [CrossRef]
- Romanazzi, V.; Leone, M.; Aiello, M.A.; Pecce, M.R. Bond behavior of geopolymer concrete with steel and GFRP bars. Compos. Struct. 2022, 300, 116150. [Google Scholar] [CrossRef]
- Zhang, J.; Liu, Y.; Zhao, D.; Tao, X.; Zhang, M. Bond stress-slip behavior of ultrahigh-strength steel bars with spiral grooves embedded in plain and steel fiber high-strength recycled aggregate concrete. J. Build. Eng. 2023, 80, 108056. [Google Scholar] [CrossRef]
- Hameed, R.; Akmal, U.; Khan, Q.S.; Cheema, M.A.; Riaz, M.R. Effect of fibers on the bond behavior of deformed steel bar embedded in recycled aggregate concrete. Mehran Univ. Res. J. Eng. Technol. 2020, 39, 846–858. [Google Scholar] [CrossRef]
- Gao, D.; Huang, Y.; Chen, G.; Yang, L. Bond stress distribution analysis between steel bar and steel fiber reinforced concrete using midpoint stress interpolation method. Constr. Build. Mater. 2020, 260, 119866. [Google Scholar] [CrossRef]
- Xiao, J.; Falkner, H. Bond behaviour between recycled aggregate concrete and steel rebars. Constr. Build. Mater. 2007, 21, 395–401. [Google Scholar] [CrossRef]
- Prince, M.J.R.; Singh, B. Bond behaviour of deformed steel bars embedded in recycled aggregate concrete. Constr. Build. Mater. 2013, 49, 852–862. [Google Scholar] [CrossRef]
- Ghafoor, M.T.; Khan, Q.S.; Qazi, A.U.; Sheikh, M.N.; Hadi, M.N.S. Influence of alkaline activators on the mechanical properties of fly ash based geopolymer concrete cured at ambient temperature. Constr. Build. Mater. 2021, 273, 121752. [Google Scholar] [CrossRef]
- ASTM-C188; Standard Test Method for Density of Hydraulic Cement 2017. American Society of Testing and Materials: West Conshohocken, PA, USA, 2017.
- ASTM-C114; Standard Test Methods for Chemical Analysis 2023. American Society of Testing and Materials: West Conshohocken, PA, USA, 2023.
- ASTM-C618; Standard Specification for Coal Fly Ash and Raw or Calcined Natural Pozzolan for Use in Concrete 2022. American Society of Testing and Materials: West Conshohocken, PA, USA, 2022.
- BS 812-110; Methods for Determination of Aggregate Crushing Value (ACV). British Standards Institution: London, UK, 1990.
- BS 812-112; Methods for Determination of Aggregate Impact Value (AIV). British Standards Institution: London, UK, 1990.
- ASTM-C127; Standard Test Method for Relative Density (Specific Gravity) and Absorption of Coarse Aggregate 2015. American Society of Testing and Materials: West Conshohocken, PA, USA, 2015.
- ASTM-C29; Standard Test Method for Bulk Density (“Unit Weight”) and Voids in Aggregate 1997. American Society of Testing and Materials: West Conshohocken, PA, USA, 1997.
- ASTM-C136; Standard Test Method for Sieve Analysis of Fine and Coarse Aggregates 2019. American Society of Testing and Materials: West Conshohocken, PA, USA, 2019.
- ASTM-A615; Standard Specification for Deformed and Plain Carbon-Steel Bars for Concrete Reinforcement 2022. American Society of Testing and Materials: West Conshohocken, PA, USA, 2022.
- ASTM-C143; Standard Test Method for Slump of Hydraulic-Cement Concrete 2020. American Society of Testing and Materials: West Conshohocken, PA, USA, 2020.
- ASTM-C900; Standard Test Method for Pullout Strength of Hardened Concrete 2019. American Society of Testing and Materials: West Conshohocken, PA, USA, 2019.
- ASTM-C39; Compressive Strength of Concrete Cylinders 2020. American Society of Testing and Materials: West Conshohocken, PA, USA, 2020.
- Kathirvel, P.; Thangavelu, M.; Gopalan, R.; Kaliyaperumal, S.R.M. Bond characteristics of reinforcing steel embedded in geopolymer concrete. IOP Conf. Ser. Earth Environ. Sci. 2017, 80, 012001. [Google Scholar] [CrossRef]
- Kim, J.S.; Park, J. An experimental evaluation of development length of reinforcements embedded in geopolymer concrete. Appl. Mech. Mater. 2014, 578, 441–444. [Google Scholar] [CrossRef]
- Zhang, J.; Tao, X.; Li, X.; Zhang, Y.; Liu, Y. Analytical and experimental investigation of the bond behavior of confined high-strength recycled aggregate concrete. Constr. Build. Mater. 2022, 315, 125636. [Google Scholar] [CrossRef]
- Jiang, J.; Yang, H.; Deng, Z.; Li, Z. Bond performance of deformed rebar embedded in recycled aggregate concrete subjected to repeated loading after freeze–thaw cycles. Constr. Build. Mater. 2022, 318, 125954. [Google Scholar] [CrossRef]
- Walraven, J.C.; Bigaj-van Vliet, A. The 2010 fib Model Code for Structural Concrete: A new approach to structural engineering. Struct. Concr. 2011, 12, 139–147. [Google Scholar] [CrossRef]
- Dahou, Z.; Castel, A.; Noushini, A. Prediction of the steel-concrete bond strength from the compressive strength of Portland cement and geopolymer concretes. Constr. Build. Mater. 2016, 119, 329–342. [Google Scholar] [CrossRef]
- Fernandez-Jimenez, A.M.; Palomo, A.; Lopez-Hombrados, C. Engineering properties of alkali-activated fly ash concrete. ACI Mater. J. 2006, 103, 106. [Google Scholar]
- Hadi, M.N. Bond of high strength concrete with high strength reinforcing steel. Open Civ. Eng. J. 2008, 2, 143–147. [Google Scholar] [CrossRef]
- Al-Azzawi, M.; Yu, T.; Hadi, M.N. Factors affecting the bond strength between the fly ash-based geopolymer concrete and steel reinforcement. Structures 2018, 14, 262–272. [Google Scholar] [CrossRef]
- Tauqir, M.; Qazi, A.U.; Khan, Q.S.; Munir, M.J.; Kazmi, S.M.S. Shear behavior of geopolymer concrete slender beams. Buildings 2023, 13, 1191. [Google Scholar] [CrossRef]
Disclaimer/Publisher’s Note: The statements, opinions and data contained in all publications are solely those of the individual author(s) and contributor(s) and not of MDPI and/or the editor(s). MDPI and/or the editor(s) disclaim responsibility for any injury to people or property resulting from any ideas, methods, instructions or products referred to in the content. |
© 2024 by the authors. Licensee MDPI, Basel, Switzerland. This article is an open access article distributed under the terms and conditions of the Creative Commons Attribution (CC BY) license (https://creativecommons.org/licenses/by/4.0/).