1. Introduction
Cortisol is the principal stress hormone in humans, responsible for leading the stress response through the course of several physiological changes in the body [
1]. These changes include elevated heart rate and blood pressure, as well as increased glucose metabolism for utilisation in the brain. Which is often coupled with an increased appetite to replenish depleted energy stores. Stress activation occurs in three key stages, which comprise alarm, resistance/maintenance, and exhaustion [
2,
3]. The alarm stage, also known as the ‘fight or flight response,’ is the immediate action taken by the body against perceived stress, i.e., interruption to homeostasis within the body. This stage is characterised by several biochemical mechanisms that lead to the release of cortisol into the bloodstream through the action of the hypothalamic-pituitary-adrenal (HPA) axis. The resistance/maintenance stage is represented by homeostatic intervention via physiological and behavioural responses, whereby cortisol levels decline and the stress response is dampened. Evidently, constant activation or repeated successive triggering of the stress response can lead to the exhaustion stage. Whereby, cortisol continually triggers the stress response in the human body, eventually leading to depletion of resources, i.e., allostatic overload [
4,
5]. The prolonged presence of cortisol in the bloodstream can lead to a multitude of undesirable long-term effects, such as weight gain, build-up of fat tissue, increased risk of cardiovascular disease, and accelerated mental health deterioration. Therefore, the management of stress and cortisol levels is of paramount significance for mental wellbeing.
Unquestionably, the primary tool for mental illness diagnosis and stress management encompasses the use of subjective interview-based tools, which can lead to ambiguities, misdiagnosis, and oversimplified treatment plans [
6]. Further fuelled by the stigmatisations surrounding the discussion of mental health, this can lead to individuals feeling alienated by the existing pathways for seeking mental support and therapy. Recent technological advancements have given rise to a new era of accessible approaches for mental health support and management. Several studies have reported on the monitoring of psychological and physiological stress through wearable and app-based technologies [
7,
8]. Through physiological monitoring of stress using standard heart rate variability (HRV), electroencephalography (EEG) and electrodermal activity (EDA) measures, a vast array of information can be uncovered regarding an individual’s stress profile and their bodily patterns to recover from acute and chronic stress [
9,
10,
11]. Furthermore, the use of objective measures of stress can be used to deduce an individual’s mental health status, such as the presence or deterioration of mental illnesses, including clinical depression [
12]. Alternatively, biochemical biomarkers of stress offer the characterisation of the underlying neurobiological processes that define stress in the body through stress hormones, such as cortisol [
13,
14]. Normal salivary cortisol ranges from 0.7 to 4.1 ng/mL and follows a diurnal rhythm, with morning salivary cortisol levels reaching 27.3 ng/mL before diminishing throughout the day and declining towards a trough during the evening [
15]. The phenomenon of the cortisol awakening response involves a spike in cortisol levels by 50% of the clinical range within 30 min post-awakening; it can often be an indication of irregularities in cortisol responses and dysfunctionality of the HPA axis. For example, in Burke et al. and Huber et al., clinical depression patients presented lower cortisol awakening responses compared to healthy matched controls [
16,
17,
18]. Evidently, the monitoring of cortisol is a useful tool for the determination of psychological and physiological stress levels, as well as any mental health implications such as clinical depression and major depressive disorder [
19]. The implementation of point-of-care monitoring solutions for cortisol would improve the current landscape of mental health monitoring through patient empowerment and education, as well as facilitate the destigmatisation of mental health monitoring [
20,
21].
Several preliminary studies have presented the use of a multimodal approach for stress and depressive symptom evaluation, which may propose the future of psychophysiological stress monitoring. Reinhardt et al. employed EDA and heart rate metrics alongside salivary cortisol measurements for the evaluation of the effects of the Mannheim Multicomponent Stress Test (MMST) [
22]. The study exhibited synchrony between physiological and biochemical markers towards the quantification of stress. Therefore, the practicality of employing cortisol sensing techniques alongside physiological monitoring proposes a complete system for psychological stress evaluation in the body. Existing technologies for cortisol monitoring include the measurement of cortisol concentration through blood, urine, and saliva samples, often utilising predominantly ELISA-based methods or mass spectrometry, i.e., LC-MS/MS [
23,
24]. These methods implicate several limitations, such as long processing times, high costs and the need for specialised equipment, which deem them inappropriate for routine use in stress management tools. Moreover, applications for stress analysis via bloods introduce undesirable invasive procedures that may often lead to further stress and individuals refraining from such monitoring approaches [
25,
26]. Tu et al. proposed the utilisation of colorimetric techniques for the measurement of cortisol levels in eccrine and apocrine sweat, which concluded that blue tetrazolium dye offers a significant linear relationship between absorbance and cortisol concentration [
15].
Therefore, the present study proposed the exploration of the use of blue tetrazolium dye for the measurement of artificial salivary cortisol through spectrophotometric analysis, with comparison and validation using commercial cortisol ELISA kits. This led to the establishment of a novel, simple method for cortisol monitoring and the development of a prototype point-of-care device in the form of a pocket colorimeter for routine evaluation of cortisol for stress monitoring. Furthermore, the colorimetric method was utilised for the development of a colorimetric sensor which was tested on a small sub-set (
n = 17) of the artificial salivary cortisol range for sensor validation. The aim of this research is to provide accessible means for non-invasive stress hormone monitoring for regular usage, in non-laboratory-based settings by reducing the need for outsourced commercial laboratory testing kits and face-to-face interventions, which continues to remain inaccessible for the public, especially post-pandemic, i.e., COVID-19 [
27]. The current study provides a novel colorimetric method for cortisol evaluation towards the development of a point-of-care stress monitor.
2. Materials and Methods
2.1. Materials and Reagents
3,3′-3,3′-dimethoxy-4,4′-biphenylene bis 2,5-diphenyl-2h-tetrazolium chloride (blue tetrazolium), Tetramethylammonium hydroxide, 25 wt.% in methanol, hydrocortisone (>98%) and analytical grade methanol (>99.7%) were purchased from Fisher Scientific (Fisher Scientific, Waltham, MA, USA). Artificial saliva was obtained from Sigma-Aldrich (Sigma-Aldrich, St. Louis, MO, USA). For the development of the pocket colorimeter sensor, 1 cm path length plastic disposable cuvettes were acquired from Fisher Scientific (Fisher Scientific, Waltham, MA, USA). An Arduino Uno microcontroller was used alongside blue green through-hole 20 mA 510 nm LEDs acquired from Farnell Electronics (Farnell Electronics, Leeds, UK). Furthermore, 30 nA dark current 940 nm 2-pin photodiodes were used from Farnell Electronics. A dual operational amplifier IC chip (TL082) was used (RS Components, Corby, UK). A 3D-printed housing unit as developed with an Arduino Uno compartment, for the final sensor prototype.
2.2. Sample Preparation
A cortisol stock solution of 24 µmol/L was prepared by dissolving 0.008 g of hydrocortisone powder into 1 L of methanol. For the preparation of the blue tetrazolium dye, 1.2 g of blue tetrazolium chloride was dissolved in 200 mL of methanol. Additionally, a 1% v/v tetramethylammonium hydroxide solution was prepared by combining 5 mL of tetramethylammonium hydroxide in 45 mL of methanol. For sample preparation, diluted solutions of cortisol in methanol were made as ‘pre-samples’ of 5 mL volume, of which 1 mL was combined with 1.4 mL of artificial saliva and 0.3 mL each of blue tetrazolium solution and tetramethylammonium hydroxide solution to give a final sample volume of 3 mL. The clinical range for salivary cortisol concentration is 0.7–27.3 ng/mL; therefore, a calibration set (BT-Cal) was created which comprised of a series of 7 diluted solutions of cortisol in methanol. Furthermore, a series of 34 samples of unknown concentration of cortisol within this clinically significant range were produced for spectral analysis with the BT method, Salitrack sensor and reference ELISA measurements.
2.3. Optical Spectroscopy Measures
For optical determination of salivary cortisol concentration from the artificial saliva samples, 2.4 mL of the salivary cortisol sample was combined with equal volumes (0.3 mL) of blue tetrazolium dye solution and tetramethylammonium hydroxide solution. One millilitre of the prepared sample was pipetted into plastic Eppendorf disposable UV-Vis cuvettes with a spectral range between 220 and 1600 nm and a path length of 1 cm. These samples were then optically analysed after 10 min using the Lambda 1050 dual-beam spectrophotometer equipped with the 3-detector module (PerkinElmer Corp, Waltham, MA, USA).
The utilisation of a chromogenic reagent such as blue tetrazolium chloride allows for the indirect measurement of salivary cortisol. Blue tetrazolium is a water-soluble nitro-substituted aromatic tetrazolium compound that oxidises the C-17 side chain of cortisol. This is subsequently reduced by free oxygen radicals in tetramethylammonium hydroxide to form nitro blue formazan. The BT method for colorimetric determination of cortisol was reported by Tu et al. for its notable colour change, visible to the naked eye, that is dependent on cortisol concentration. After the development period, the sample colour changes from translucent yellow to magenta. The colour intensity showcases a positive correlation with increasing cortisol concentrations. The observable colour change occurs due to the hydrolysis of cyclic diacetyl in the blue tetrazolium dye, with colour intensity depending on the cortisol concentration within the sample. This visible colour change can be used for the determination of cortisol levels through spectrophotometric and colorimetric methods. The characteristic absorption peak for the colorimetric reaction between the dye and cortisol is present at 510 nm. A 3-cycle configuration was used to collect 3 consecutive absorbance spectra for each sample within a specified spectral region (450–650 nm) at a step interval of 1 nm. To ensure that there were no interferences with the cortisol-BT reaction, a sample of artificial saliva without cortisol was tested with the BT method. This yielded a pale, yellow-coloured solution, i.e., no reaction, suggesting that no interferences were present in saliva to react with the BT dye other than cortisol.
The reference cuvette was kept blank for the entire duration of the protocol, and baseline corrections at 100% transmittance/0% absorbance were considered to reduce the effects of instrumental and ambient noise. The experiment was conducted in triplicate for each sample of artificial saliva with spiked cortisol, whereby each sample was measured three times.
2.4. Sensor Development
2.4.1. Circuit Design and Assembly
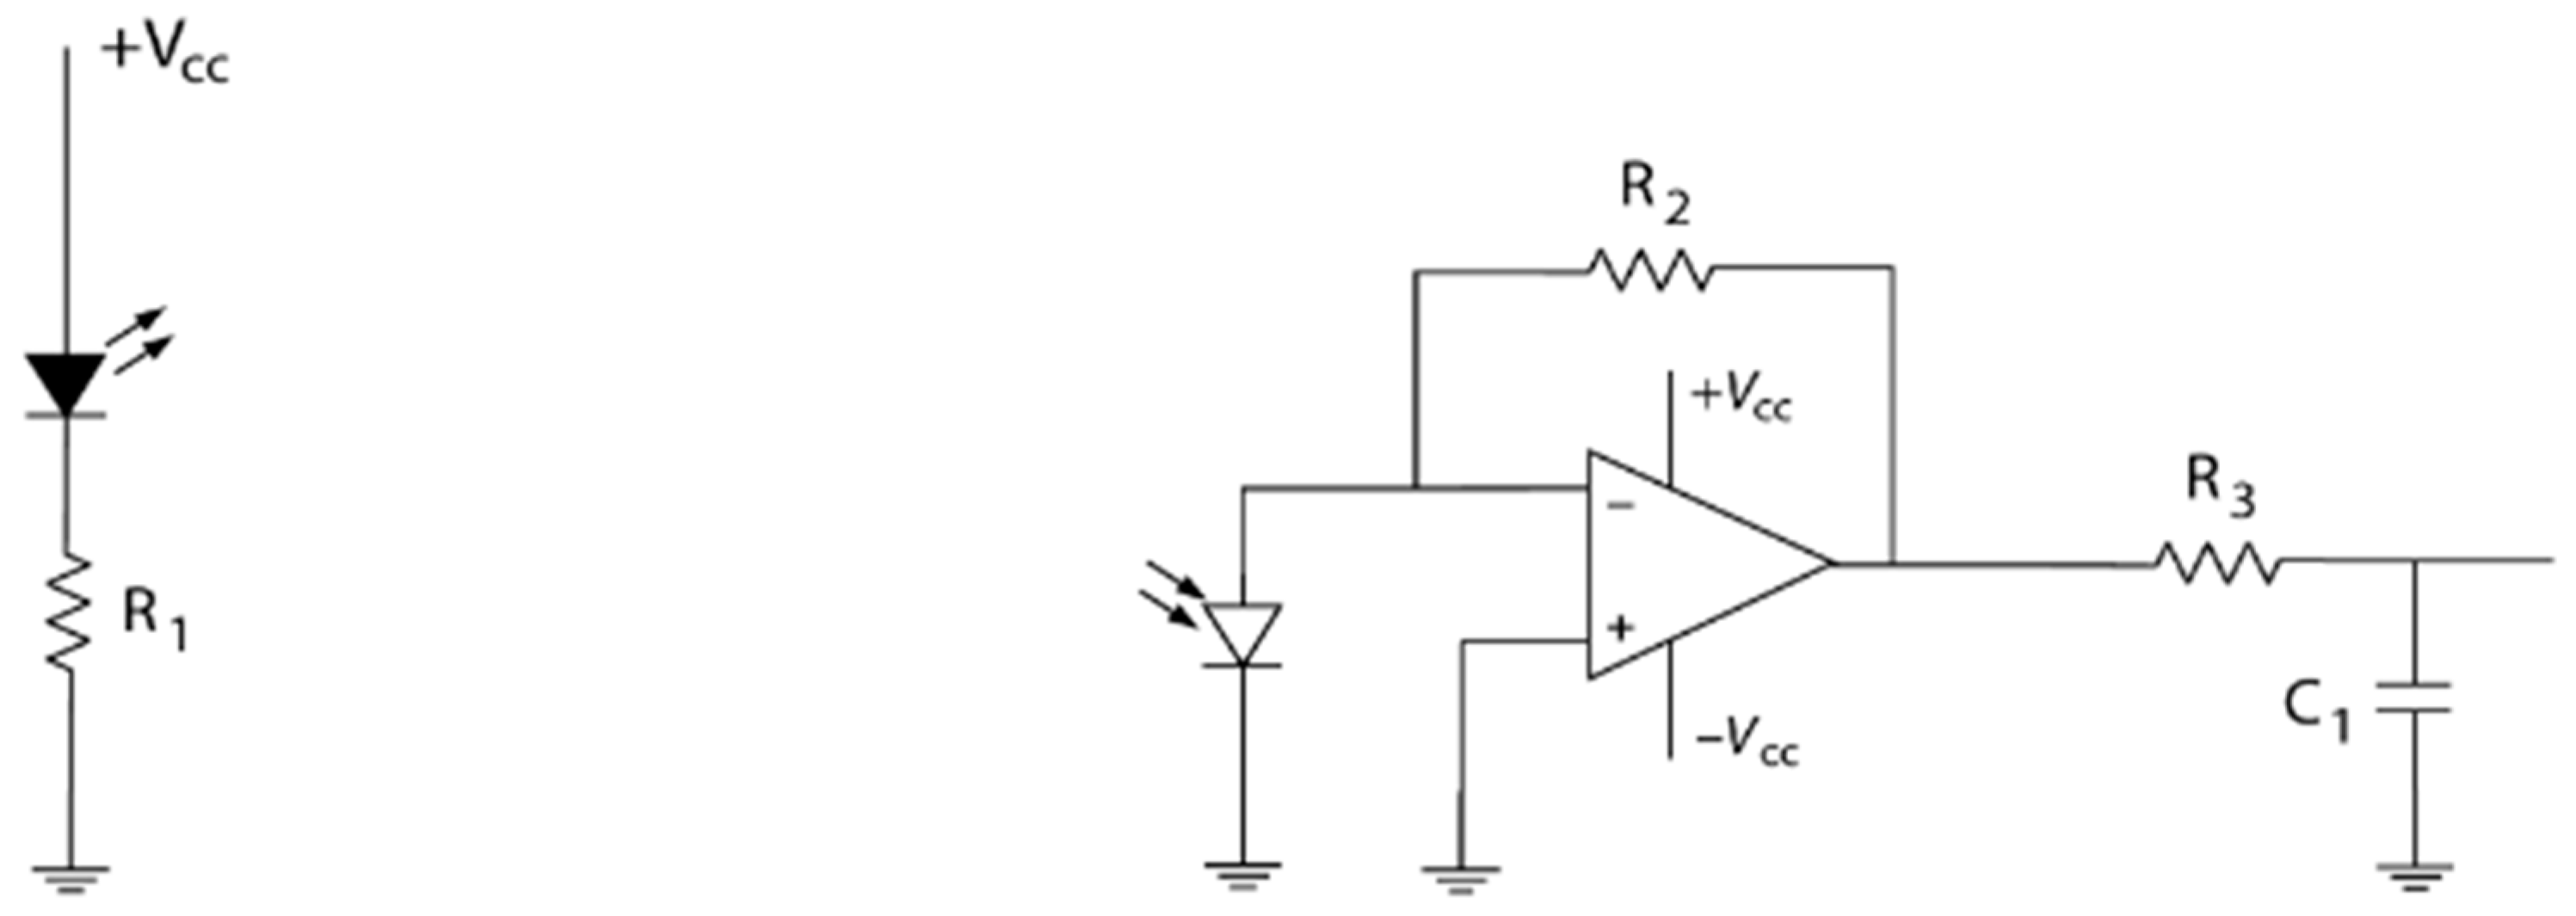
A simple electronic and portable colorimeter was developed for the measurement of the spectral absorption of salivary cortisol samples at 510 nm. The measurement at 510 nm was chosen and subsequently validated through the in vitro measurements of artificial salivary cortisol concentrations using the benchtop spectrophotometer and blue tetrazolium (BT) method, due to the discernible characteristic peak of the nitro blue formazan product at this wavelength. A 510 nm light-emitting diode (LED) was used as the light source. A 30 nA dark current photodiode was used at the photodetector. The components were connected to a TL082 dual-input operational amplifier chip, as portrayed by the circuit diagram (
Figure 1). The electronic components used for the sensor development are highlighted in
Table 1. The circuit was developed on a miniature breadboard/Arduino shield, which was then connected to the Arduino Uno microcontroller for digitisation and further processing. The Arduino Uno and breadboard were placed into the customised 3D-printed housing unit and connected to a PC via USB.
2.4.2. Testing and Calibration
The calibration of the colorimeter sensor (Salitrack−Cal) involved the use of the same samples as those used in the BT−Cal set of artificial saliva with known cortisol concentrations, which were validated by ELISAs and the benchtop spectrophotometric BT method. The sensor was then tested on the smaller sub-set (
n = 17) of the prediction set (SalitrackPred1) for the measurement of cortisol concentrations in a series of 5 samples with unknown salivary cortisol levels, which was then compared with the BT method and validated with the gold-standard ELISA protocol. Voltage readings taken from the Salitrack sensor were used to calculate the absorbance of the tested samples. Testing of the Salitrack sensor was conducted within the 3D-printed housing unit, which was painted black to mimic a dark chamber for the prevention of voltage fluctuations caused by ambient light. The final Salitrack sensor prototype is shown in
Figure 2.
2.4.3. Sensor Optimisation and Software Development
The optimisation procedure for the sensor involved testing the sensor with a range of feedback resistors to determine the optimal range for detection within the optical range of interest and for further data analysis and post-processing. Software was developed for use alongside the ArduinoUno® in Sketch (IDE 2.3.2), utilising C++. The Sketch program was run with a baud rate of 9600. To prevent complete CPU usage through the data transmission state, the delay was set to be 20 ms to determine whether the signal was being successfully read by the Arduino board and system without lag. Furthermore, post-processing of the signal and subsequent data analysis were conducted in MATLAB, using the MATLAB support package for Arduino.
With decreased light absorbed by the sample, the intensity of the light reaching the photodiode increases, which leads to a lower resistance and a smaller Vout reading post-amplification. The Arduino software (IDE 2.3.2) was developed to read the input voltage and the output voltage from the operational amplifier and calculate the absorbance of the sample using Beer–Lambert’s law, which dictates a linear relationship exists between absorbance and concentration with a constant path length. The path length was maintained at 1 cm through the use of 1 cm plastic disposable cuvettes. Light intensity and output voltage follow an inverse relationship, which was then used to determine the absorbance and subsequent concentration of each sample. The values were printed to the serial monitor, which in this case was a laptop. The input voltage was set at 5 V. The output absorbance value can be applied to the standard curve to estimate the concentration of the artificial salivary cortisol sample for point-of-care usage.
2.5. Reference ELISA Measurements
Reference measurements were made using a cortisol ELISA kit (Parameter Cortisol Assay, R&D Systems, Minneapolis, MN, USA). The BT-calibration (BT-Cal) and prediction set (BTPred) samples were measured via ELISA. The assay was prepared and used according to the recommended protocol as stated by the manufacturer to determine artificial salivary cortisol levels. Fifty microlitres of each sample was combined with 200 µL of diluent (5-fold sample dilution). All samples were tested in duplicate, and a cortisol calibration standard curve was included on the assay plate. Cortisol concentrations were reported in ng/mL after considering the dilution factor (5-fold).
2.6. Data Analysis
2.6.1. Spectroscopy and Linear Regression Modelling
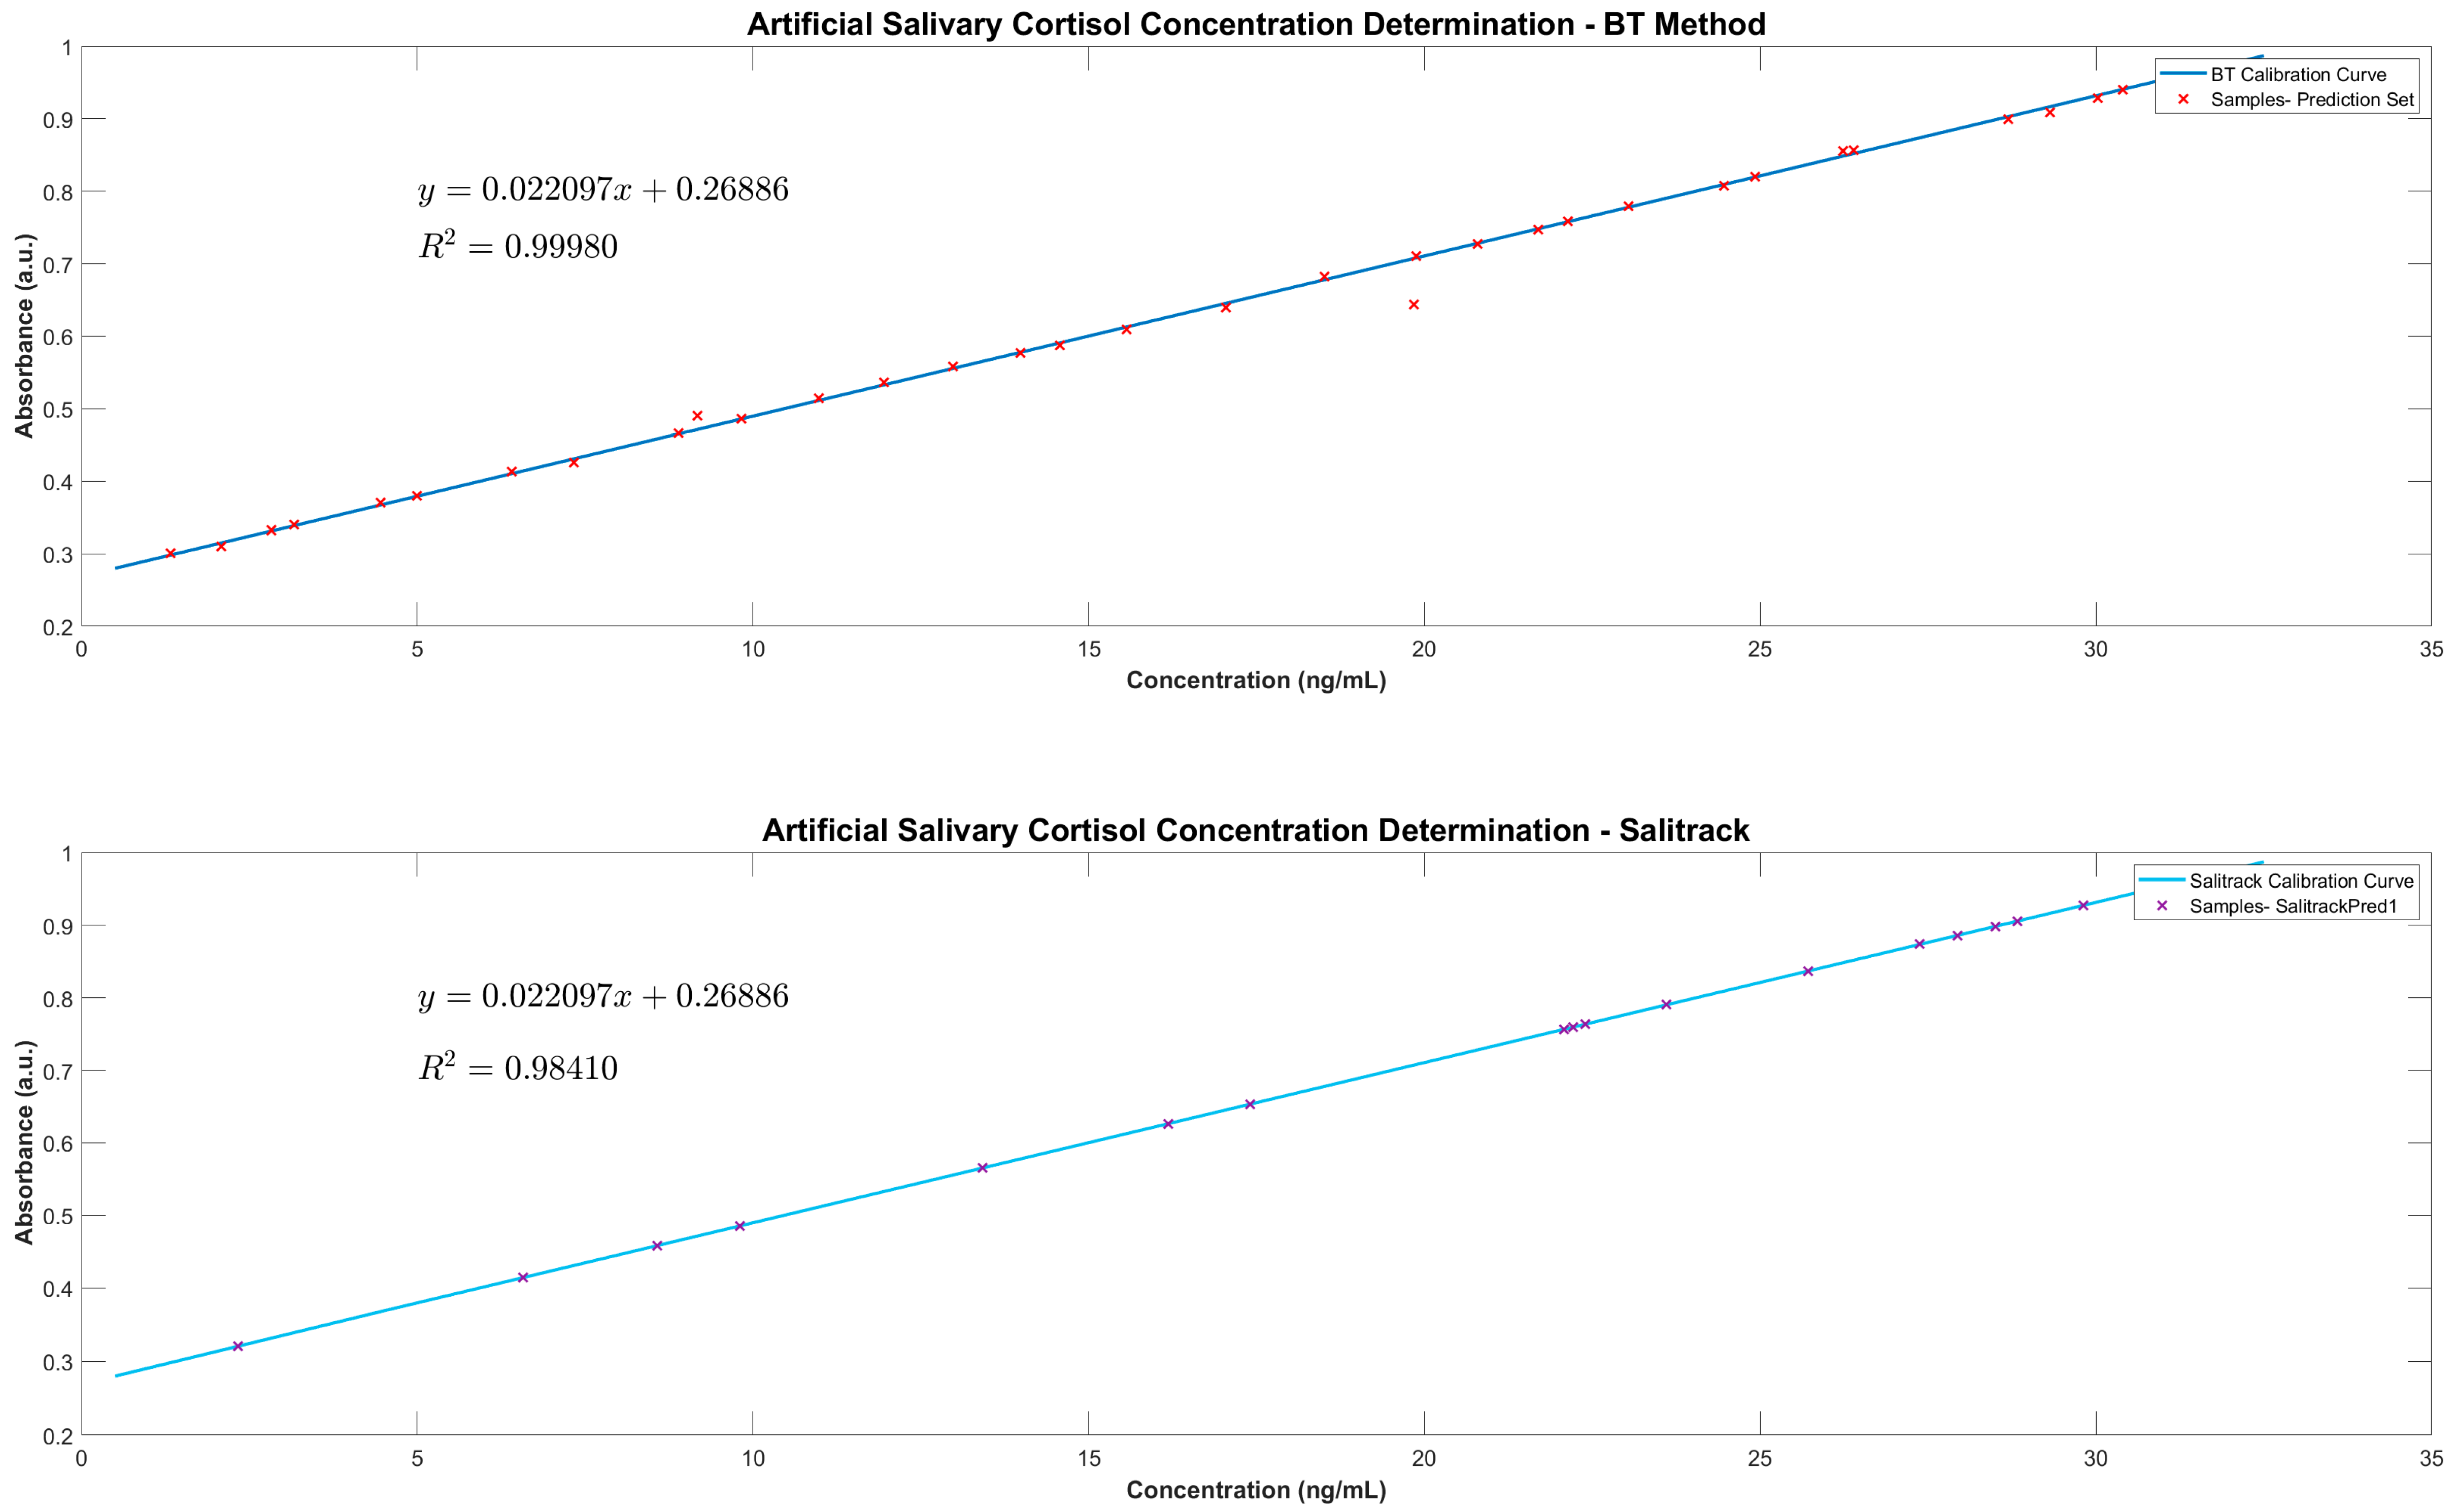
UVWinLab (5.1) was utilised for spectral collection from the Lambda 1050 spectrophotometer, and pre-processing and analysis were carried out in MATLAB R20220b (MathWorksTM, Natick, MA, USA), which included the use of the Statistics and Machine Learning Toolbox for statistical testing of the results from the BT method, the sensor, and the cortisol ELISA protocol. Three spectra were obtained from each sample, which were then processed through baseline subtractions, averaging and Savitsky-Golay smoothing (interval 5, polynomial order 2). Subsequently, a second derivative analysis was conducted to improve the prominence of the characteristic peak and enhance spectral features for further evaluation. The sample calibration dataset (BT-Cal) was used to develop a linear regression model, which was then used as a calibration curve for the prediction of the unknown cortisol concentrations. The peak absorbance value at 510 nm was used to predict concentration levels by utilising of the Beer–Lambert Law, which states that a linear relationship exists between the target analyte concentration and the absorbance of the sample.
2.6.2. Salitrack Sensor Performance Validation
The performance of the colorimetric sensor was validated against the BT benchtop spectrophotometric method as well as the ELISAs. A calibration curve was generated using the BT-Cal sample set of known cortisol concentrations and absorbances, which was subsequently validated with the BT method. The absorbance of each sample at a known cortisol level was determined using Equation (1). The coefficient of determination (R
2) values from the Salitrack-Cal was compared with the BT-Cal dataset and the ELISA curve to determine the accuracy and strength of both models against the gold standard. The performance of the sensor was tested in the determination of cortisol concentration from the SalitrackPred1 set, and the absorbance data collected from the sensor was classified as SalitrackPred1. The concentration values yielded from the Salitrack method and the BT method were individually compared with the results obtained from the cortisol ELISA protocol.
Equation (1) Calculation of absorbance values from voltage reading outputs via the Salitrack sensor.
2.6.3. Reference ELISA Analysis
Optical density values for each sample from the ELISA protocol were processed in Excel before analysis with a 4-PL (Parametric Logistic) regression model, which was conducted using the Quest Graph Four Parameter Logistic (4PL) Curve Calculator (AAT Bioquest Inc., Pleasanton, CA, USA) and MATLAB. The calibration curve was developed using the standard solutions from the cortisol ELISA kit, which was then implemented to analyse cortisol concentration levels from the artificial saliva samples. Concentration values were reported in ng/mL, after consideration of the dilution factor (5-fold dilution).
4. Discussion
Commonly known as the ‘fight or flight’ response, the stress response is segmented into three key stages that regulate pathways and mechanisms to restore homeostasis within the body upon stress elicitation [
4,
28,
29]. Cortisol measurement is of utmost significance for the evaluation of the HPA axis as it is a vital regulator of the stress response in the human body. Furthermore, the non-invasive measurement of cortisol via saliva collection offers a straightforward method for evaluating stress levels in clinical and home settings. Thus, the proposed method of assessing artificial salivary cortisol through the use of chromogenic agents offers a rapid and simple alternative to extensive laboratory-based analytical procedures such as liquid chromatography-mass spectrometry (LC-MS) and ELISAs [
30].
Evidently, the observations from the current study define the feasibility of utilising the BT method for the colorimetric determination of cortisol in artificial saliva, with great potential in applications towards measurement of human salivary cortisol levels. The proof-of-concept colorimetric sensor that was developed further reiterates that the BT method provides the basis for further technological advancements, specifically within the field of mental health monitoring and management, towards point-of-care devices for the evaluation of psychological and physiological stress. Existing technologies within this field comprise physiological monitoring techniques such as measurement of heart rate variability (HRV) and electrodermal activity (EDA), which provide substantial evaluation of physiological stresses such as those experienced during periods of exercise and high physical activity [
7]. However, such techniques neglect the measurement of the biochemical processes that occur during the stress response. Stress hormones, such as cortisol, which govern the human stress response are key biomarkers of interest for the evaluation and quantification of physiological and psychological stress. The relationship between cortisol and stress response activity is prominent in stress studies that investigate the functionality of the HPA axis; therefore, the measurement of cortisol in the body can aid in the quantification of stress and its progression into mental health disorders such as clinical depression [
29]. Although cortisol is regarded as the stress hormone, several point-of-care technologies focus entirely on the physiological biomarkers of stress, such as increased heart rate and irregular alpha-wave activity measured via electroencephalography (EEG) [
31]. Evidently, the recognised methods for measuring salivary cortisol involve the use of highly specialised lab equipment and biochemical assays such as ELISAs [
30]. ELISAs are considered the gold-standard method for measurement of salivary cortisol concentration but involve several time-consuming processes and remain inaccessible for routine use by the public. Hence, the employment of the BT method for the evaluation of cortisol and, therefore, stress, can aid in the progression of point-of-care technologies that diverge away from benchtop applications and challenge traditional methods of stress assessment, such as subjective interviews and face-to-face interventions.
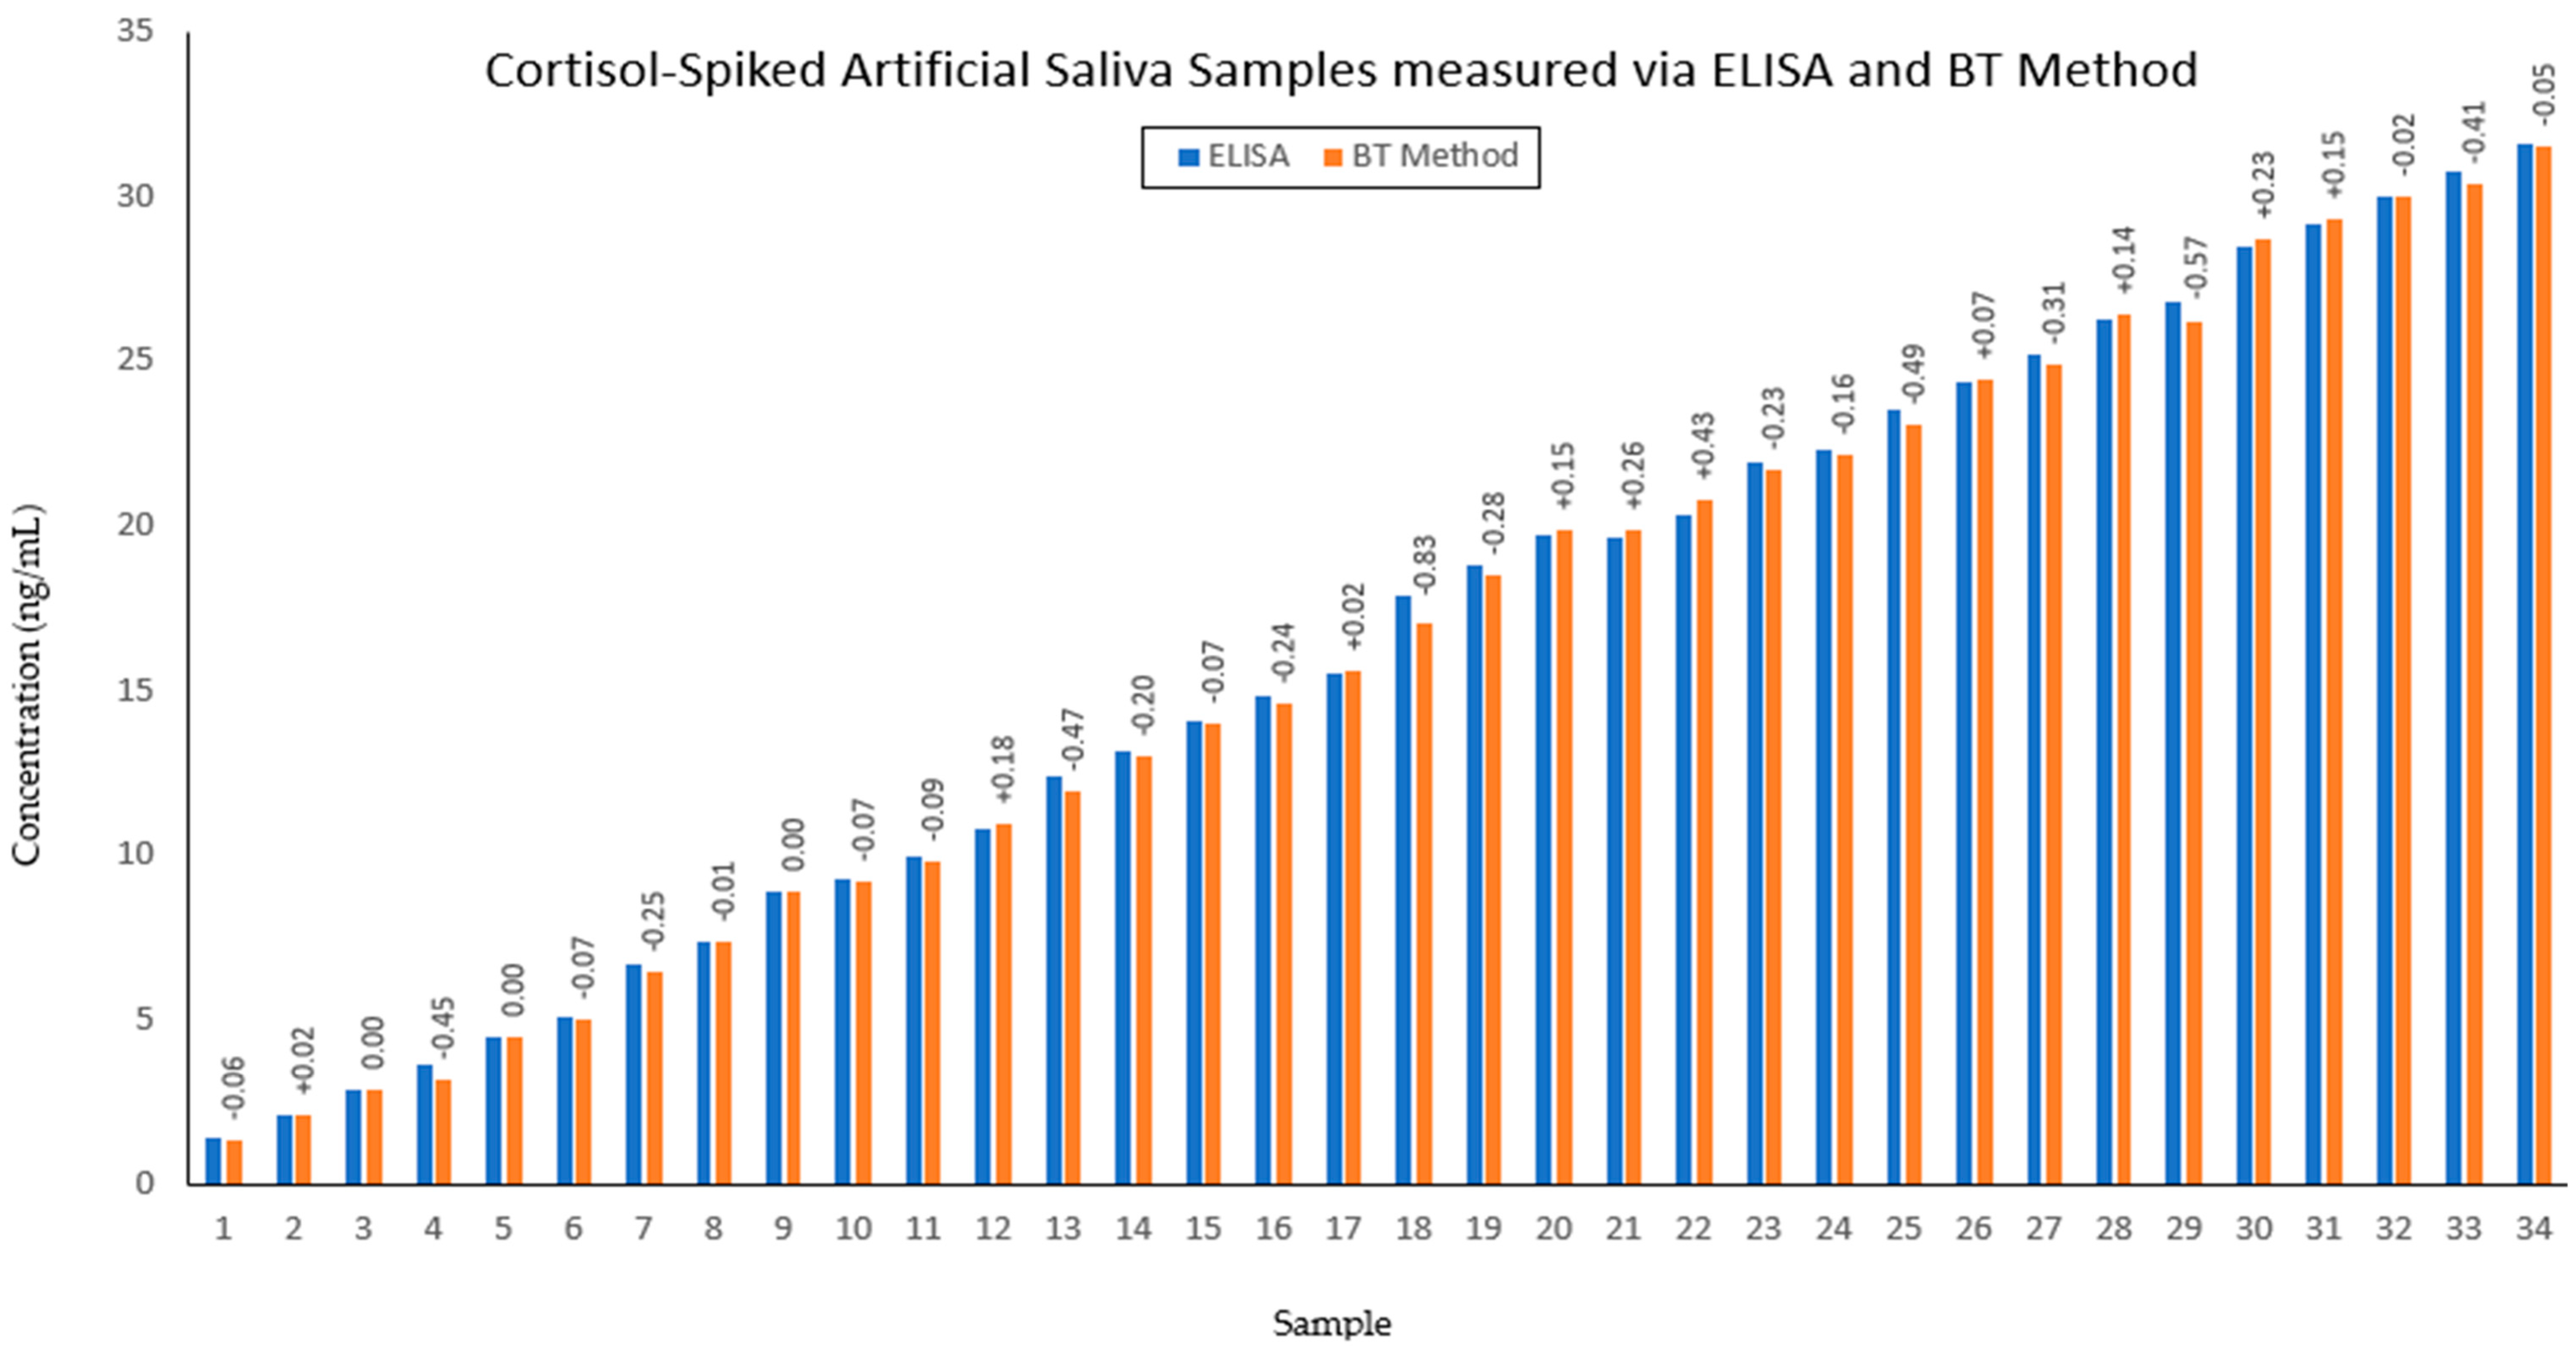
The results from the current study showcase the successful performance of the regression models for the prediction of salivary cortisol with accuracy levels that are strongly comparable to the ELISA method. It is evident that blue tetrazolium proposes an effective method of cortisol concentration measurement that is in line with the gold-standard measurement technique. This facilitates the use of optical sensors for the mapping of psychological stress profiles, as the sensor offers readily available and highly accurate results within 10 min of sample collection. Further development and optimisation of the sensor can enable simple point-of-care testing alongside a mobile-based application for data collection and processing. Such advancements propose alternative means for screening therapy and mental health management that diverge from current face-to-face-based practices. Through the quantification of cortisol, which is a key logical indicator of stress in the human body, the proposed sensor facilitates the advancement of technologies towards the complete comprehension of stress via biochemical monitoring. This challenges the existing screening methods for mental health-related issues, which primarily rely on interview-based tools and have led to gross misdiagnosis and poor adherence to treatment plans [
32]. As mental health disorders are becoming an unprecedented global burden, the quantification and comprehension of the biomarkers of the leading disorders, such as chronic stress, offer an objective support tool for management in both the clinical environment and for point-of-care applications.
Undoubtedly, using the blue tetrazolium dye exhibits great sensitivity for detecting variations in artificial salivary cortisol levels, which gives a greater understanding of the chemical interactions between the dye and the target analyte that led to the qualitative evaluation of cortisol. Notably, the formation of the nitro blue formazan is the key indicator of the presence of cortisol within a sample, which can be examined in the visible region of the optical spectrum for further quantitative analysis of cortisol levels for sensitive monitoring of the clinical range of cortisol in saliva [
15]. The present study sought to investigate the feasibility of developing a sensor using the BT method as the foundation for optical determination of cortisol, which yielded exceptional results and highlighted the ease of use of a visual tool for biomarker detection. The visual assessment of cortisol concentration offers a qualitative evaluation of stress, with increasing cortisol levels correlating with prominent colour development ranging from translucent yellow to deep magenta. The sensor acts as an extension of this established method by measuring the absorbance of the sample to provide a quantitative result for the salivary cortisol evaluation, which can be monitored routinely in settings for stress management or for clinical evaluation of therapy adherence and efficacy.
Further elaboration of this technology will involve the optimisation of the sensor alongside the development of a smartphone application to allow for optical data analysis and storage. Mathematical modelling of collected data for a user can then be used towards the creation of personalised hormonal profiles that can predict stress levels for individual users based on their lifestyles and hormone trends. Moreover, the introduction of other stress-related biomarkers would lead to robust modelling of user stress profiles, such as the inclusion of other stress hormones like adrenaline and noradrenaline or antagonistic biomarkers like dehydroepiandrosterone sulphate (DHEA-S). The antagonistic relationship between cortisol and DHEA-S should be considered for the complete comprehension of stress regulation in the human body [
33]. The current study has proposed a method for the optical determination of cortisol in samples of artificial saliva with great sensitivity and accuracy, as well as the development of a proof-of-concept sensor that quantifies the colorimetric reaction to ensure precise results are obtained as a readout signal within 10 min. Therefore, the proposed methodology offers a time-efficient and straightforward approach to cortisol measurement, which eliminates the need for lengthy preparatory steps that are required by existing methods for cortisol analysis. Furthermore, the colorimetric sensor offers a rapid and cost-effective solution for accurate at-home cortisol testing, which eradicates the need for sending off saliva samples for lab-based testing, which involves a plethora of costs such as sample transportation and processing, as well as general establishment costs. Further development within this proposed technology should include vigorous repeatability testing of the proof-of-concept Salitrack sensor and prototyping of the sensor with accessory biomarkers to facilitate the development of a complete stress monitoring system. Furthermore, extensive testing of the Salitrack sensor on populations of stressed and non-stressed individuals would lead to robust developments in the point-of-care sensor.


