Article

Built Environment Evaluation in Virtual Reality Environments—A Cognitive Neuroscience Approach

1
School of Architecture, Planning, Preservation, University of Maryland, College Park, MD 20742, USA
2
Department of Kinesiology, School of Public Health, University of Maryland, College Park, MD 20742, USA
*
Author to whom correspondence should be addressed.
Urban Sci. 2020, 4(4), 48; https://doi.org/10.3390/urbansci4040048
Submission received: 26 August 2020 / Revised: 28 September 2020 / Accepted: 29 September 2020 / Published: 3 October 2020

Abstract

:
To date, the predominant tools for the evaluation of built environment quality and impact have been surveys, scorecards, or verbal comments—approaches that rely upon user-reported responses. The goal of this research project is to develop, test, and validate a data-driven approach for built environment quality evaluation/validation based upon measurement of real-time emotional responses to simulated environments. This paper presents an experiment that was conducted by combining an immersive virtual environment (virtual reality) and electroencephalogram (EEG) as a tool to evaluate Pre and Post Purple Line development. More precisely, the objective was to (a) develop a data-driven approach for built environment quality evaluation and (b) understand the correlation between the built environment characters and emotional state. The preliminary validation of the proposed evaluation method identified discrepancies between traditional evaluation results and emotion response indications through EEG signals. The validation and findings have laid a foundation for further investigation of relations between people’s general cognitive and emotional responses in evaluating built environment quality and characters.

1. Introduction

The built environment has greatly impacted human emotional states [1,2] and especially wellbeing [3,4]. The built environment objective characteristics can often be defined by density [5], land-use mix [6,7], architecture/design features [8,9], and street characteristics (connectivity and accessibility) [10]. Density refers to housing, job, or population density. Land-use mix is often defined by the use and function of the land area or floor area. Architecture/design features include sidewalk coverage, architecture characteristics, aesthetic values, building setback or front porch coverage, and other physical variables. Street characteristics (connectivity and accessibility) are associated with street grids, block size, and different available transportation methods. In the built environment design, the users’ response is normally collected through a post-occupancy survey (POS), which is used as a design evaluation tool to collect real data and feedback from occupants or residents to further assess the built environment impact. However, there are two main drawbacks of a POS. First, a POS will reveal discrepancies between the intended design and actual experience, but it cannot pinpoint the design features that cause discrepancies nor can it explain the causes. Second, once the project is completed, it is much more difficult to make any structural changes; therefore, a POS might benefit future built environment designs while having a limited impact on the existing environment. Consequently, there is a need for an innovative approach using tools other than a POS that can enable designers and future building occupants to experience the intended design in a more realistic environment and solicit the occupants’ emotional responses before the actual building is constructed.
This research project is part of a large natural experiment, the Purple Line Light Rail Impact on Neighborhood, Health and Transit (PLIGHT) Study. The PLIGHT Study leverages an expansion of the Washington D.C. Metropolitan Area Transit Authority with the spring 2022 opening of the Purple Line (PL), a 16.2-mile light rail line. The PL light rail line will operate in Prince George’s (PG) County, Maryland, a suburb of Washington, D.C. By taking advantage of this timely natural experiment, we can examine changes in health outcomes, such as active transportation, overall physical activity, and obesity. Natural experiments require time to gather useful data. The PLIGHT Study includes the Pre-PL and Post-PL phases. The aim of the first phase was to set up and validate the feasibility of a data-driven approach for built environment evaluation. We have a clear goal to assess the built environment variables and their impact before and after the PL stations were completed. However, if we were to follow the natural progression of the Purple Line, we would need to wait at least four to five years after the completion of the station to start to experience the modified built environment variables. Therefore, an innovative assessment method is needed to simulate the Post-PL condition and assess the potential impact. In order to simulate the change, we constructed the future scenario in a virtual environment, based on the information about the proposed station that is available on the county website and recent mixed-use developments in the surrounding areas.
The paper is organized as follows: Section 2 provides an overview of the current research activities, methods, and the need for integrating cognitive neuroscience and virtual reality technology in the research of the built environment. Section 3 details the methodology, materials, and tools employed and the underlying rationale. Section 4 illustrates the findings and limitations of the research. Section 5 concludes and offers several future research directions.

2. Current Research and Needs

Humans are integral parts of the creation and use of design products in the built environment; however, the critical elements—human reaction and behavior—are not fully understood yet. Human reaction is difficult to model due to the fact that it is largely regulated by emotions [11,12,13] besides the explainable cognitive function. In current design literature, there are several studies on people’s emotional responses to a physical environment, such as a place [14], space [15], or certain design features. The research found that people’s emotional responses to a physical environment could be captured on two dimensions: pleasure–displeasure and the degree of stimulation or excitement [16]. Since the early 1970s, cognitive psychology has provided the means for researchers to gain fundamental knowledge of emotions and their relation to the built environment. Later, cognitive neuroscience provided new tools and methods for researchers to investigate precise correlations between environmental stimuli and human emotions.

2.1. The Cognitive Neuroscience Approach and Selection of Electroencephalography (EEG)

Contemporary cognitive neuroscience is a more recent approach for studying design in the built environment. The term “cognitive neuroscience” was coined in 1976 by two American psychologists, George Armitage Miller and Michael Gazzaniga, to study how human behavior is controlled by neural activities in the brain. Human emotions originate in the cerebral cortex, with their regulation and feeling involving several areas. A cognitive neuroscience approach, therefore, presents a promising method for the study of human response to the design of the built environment. In the past couple of decades, a variety of methodologies have been tested and implemented, including single-unit recording, the lesion method, transcranial magnetic stimulation (TMS), and functional brain imaging methods. Functional imaging methods also included electromagnetic and hemodynamic techniques. Until very recently, the lack of appropriate tools presented obstacles for implementing this research approach in design-related fields, especially in studying larger scale realistic settings, such as neighborhoods. Most recently, the emerging use of devices, such as Functional Magnetic Resonance Imaging (fMRI) and electroencephalography (EEG), have provided practical tools to apply cognitive neuroscience in human emotion in built environment.
Electroencephalography (EEG) is one of the neuroscience research tools with particularly good temporal resolution (picks up brain signal changes over milliseconds). Unlike fMRI, which depends on blood flow, EEG signals are the result of synchronous activity of neuronal assemblies that can be recorded from the surface of the scalp and is non-invasive [17]. The use of EEG in cognitive science of the built environment is one of the most rapidly growing fields of research due to its portability and flexibility as it allows test subjects to move around while immersed in a real environment. EEG is used to measure event-related potentials (ERPs), which is the brain activity directly related to a specific event (stimulus), such as the presentation of an image, word, or special visual environment. Unlike behavior studies used in the cognitive psychology approach, ERPs provide a continuous measurement of processing between a stimulus and response, which is very appropriate for studying a built environment design. Due to the complexity and multi-faceted attributes of design, continuous measurement could shed more light on which events (stimuli) are affected by which particular design feature manipulations. In the context of the built environment, ERPs are defined as different spatial characteristics, such as an open green space versus a densely built urban area. In this research project, we attempted to validate a framework to study the different physical stimuli as a result of emotional responses to the built environment. Since understanding the correlation between brain activity and design evaluation was of greater importance than discerning how and which parts of the brain respond to different stimuli, EEG was more appropriate than fMRI.

2.2. Use of EEG in the Study of the Built Environment

The signal detected from the EEG allows researchers to gain new insights into the ways that people perceive the built environment and design features. Since the 1980s, researchers in the design and built environment fields began to experiment with EEG usage. Ulrich (1981) examined EEG and heart rate data to study perceptions of urban and rural environments [18]. Hu et al. (2017) used EEG to predict design outcomes while establishing a basis for the connection between EEG measurements and common constructs in engineering design research [19]. Their findings reveal that cognitive engagement is correlated with design outcome. Nguyen and Zeng proposed a method that combined EEG signals and heart rate variability and tested seven subjects’ mental stress during the conceptual design phase. The statistical analysis showed that mental effort was lowest at the highest stress level, and it also revealed that mental effort was related to creativity, with higher levels of mental effort by a subject during the design process resulting in a higher potential to generate creative solutions [20]. Aspinall et al. (2013) used an EEG device called the Emotiv EPOC to study participants who took a 25 min walk through three areas of Edinburgh, Scotland [21]. Results indicated a high-dimensional correlation between low frustration, engagement, and arousal and higher mediation when moving into the green space zone.

2.3. The Need for Virtual Reality for the Design and Research of the Built Environment

The concept of mixed reality, which includes both virtual reality (VR) and augmented virtuality (AV), was first coined by Milgram and Kishino in 1994 [22]. VR is a commonly known technology that can add the dimensions of immersion and interactivity to three-dimensional, computer-generated models, offering an experience that does not exist in the conventional form of representation [23]. VR offers the possibility to experience sensations and movement in a simulated environment of the proposed design solutions. This experience is often difficult to fully grasp from two-dimensional rendering or even a three-dimensional model. VR provides the opportunity for users or clients to experience the space and building prior to construction. Consequently, the potential applications of VR in the architecture, engineering, and construction (AEC) fields are wide, from the design itself to the construction process simulation and project communication to, most importantly, a collaborative decision-making platform and environment [24]. Two virtual reality formats have been applied in practice and research: (1) a VR room equipped with pictures or screens displayed in a panoramic style or 360° projection and (2) an immersive VR with a head-mounted device. Studies show that immersive VR offer results closer to reality by allowing users to navigate and interact with the environment [25]. The use of immersive VR has been approved as an effective elicitation method to solicit and automatically recognize different emotional states [24]. VR can provide a fully controlled environment but also allows for the rapid manipulation of different built environment stimuli, such as building characters, streetscape, height, color, green space, etc. Consequently, it is possible to measure the emotional response of an individual in a controlled environment to correlate the person’s emotional response and satisfaction regarding particular design features of a built environment.

3. Methodology and Materials: Sample, Experiment, and Set Up

3.1. Neuroscience Framework: ERPs and Cognition Architecture (CA)

This research method is based on the event-related potential (ERP) neuroscience approach (as explained in Section 2) and cognition architecture (CA) theory. The research flow is illustrated in the diagram below, as shown in Figure 1. CA was proposed in the 1950s by Herbert Simon, a pioneer in artificial intelligence, with the goal of creating programs that could solve problems across different domains, develop insights, adapt to new situations, and evaluate themselves [26]. Cognitive architecture refers to both a theory and structure regarding human cognition from a computational instantiation. It was initially proposed in the fields of artificial intelligence and computational cognitive science [27]. Cognitive architecture (CA) theory is aligned with contemporary cognitive neuroscience, which generally considers the brain as having a modular organization within, where individual modules interact to produce certain mental activities and emotions [28]. In 1973, Allen Newell called for the development of multiple, diverse cognitive architectural styles instead of focusing on specific issues of understanding the human mind [29]. Since then, there has been a steady flow of research on cognitive architecture [30]. It was used intensively in studying instructional design [31] to encourage learners to engage in conscious cognitive processing that was directly or indirectly relevant to the constructed curriculum [31,32]. CA has since been applied to research on 3D objects’ perception [33,34], spatial navigation [35], decision-making [36], and architectural design/design thinking [37]. In our project, we rely on the capabilities of cognitive architecture that can acquire and understand perception since cognition does not occur in isolation; an intelligent agent (person) exists in the context of a certain external environment that the agent (person) must sense, perceive, and interpret. If we can understand what perceptual knowledge would be invoked by which sensors/stimuli in the environment, where and when to focus them, and what inferences are plausible, then a cognitive architecture can be built to acquire and improve the knowledge by learning from previous perceptual experience [30]. Furthermore, this cognitive architecture will provide a way for designers to best assess a situation and understand the occupants’ behavior.

3.2. Sample Size

This experiment is part of a large research project as explained in previous sections. The aim of the first phase was to set up and validate the feasibility of a data-driven approach for design evaluation. Previous similar studies have had a large variance in the number of subjects, varying from 7 to 479 participants [38,39,40]. Larson and Carbine conducted a systematic review for the sample size used in human electrophysiology (EEG and ERP). Their findings suggested that the reporting of sample size calculations was extremely rare in current clinical human electrophysiology literature, with the sample sizes in certain studies being relatively small, ranging from 7 to 26 subjects per group [41]. Previous studies suggested that for sample sizes as small as four, a nonparametric test should be used [42]. Our phase one sample size was eight, which was on the borderline; and the results are explained in Section 4.
Eight undergraduate students were recruited through the research pool between June 2018 and August 2020. Three of the participants were women. The age range was 17–23 years with a mean of 18.41 (S.D. = 1.28), and all reported no history of neurological or mental abnormalities. The study protocol was reviewed approved by the Institutional Review Board of University of Maryland.

3.3. Pre-PL Data Collection

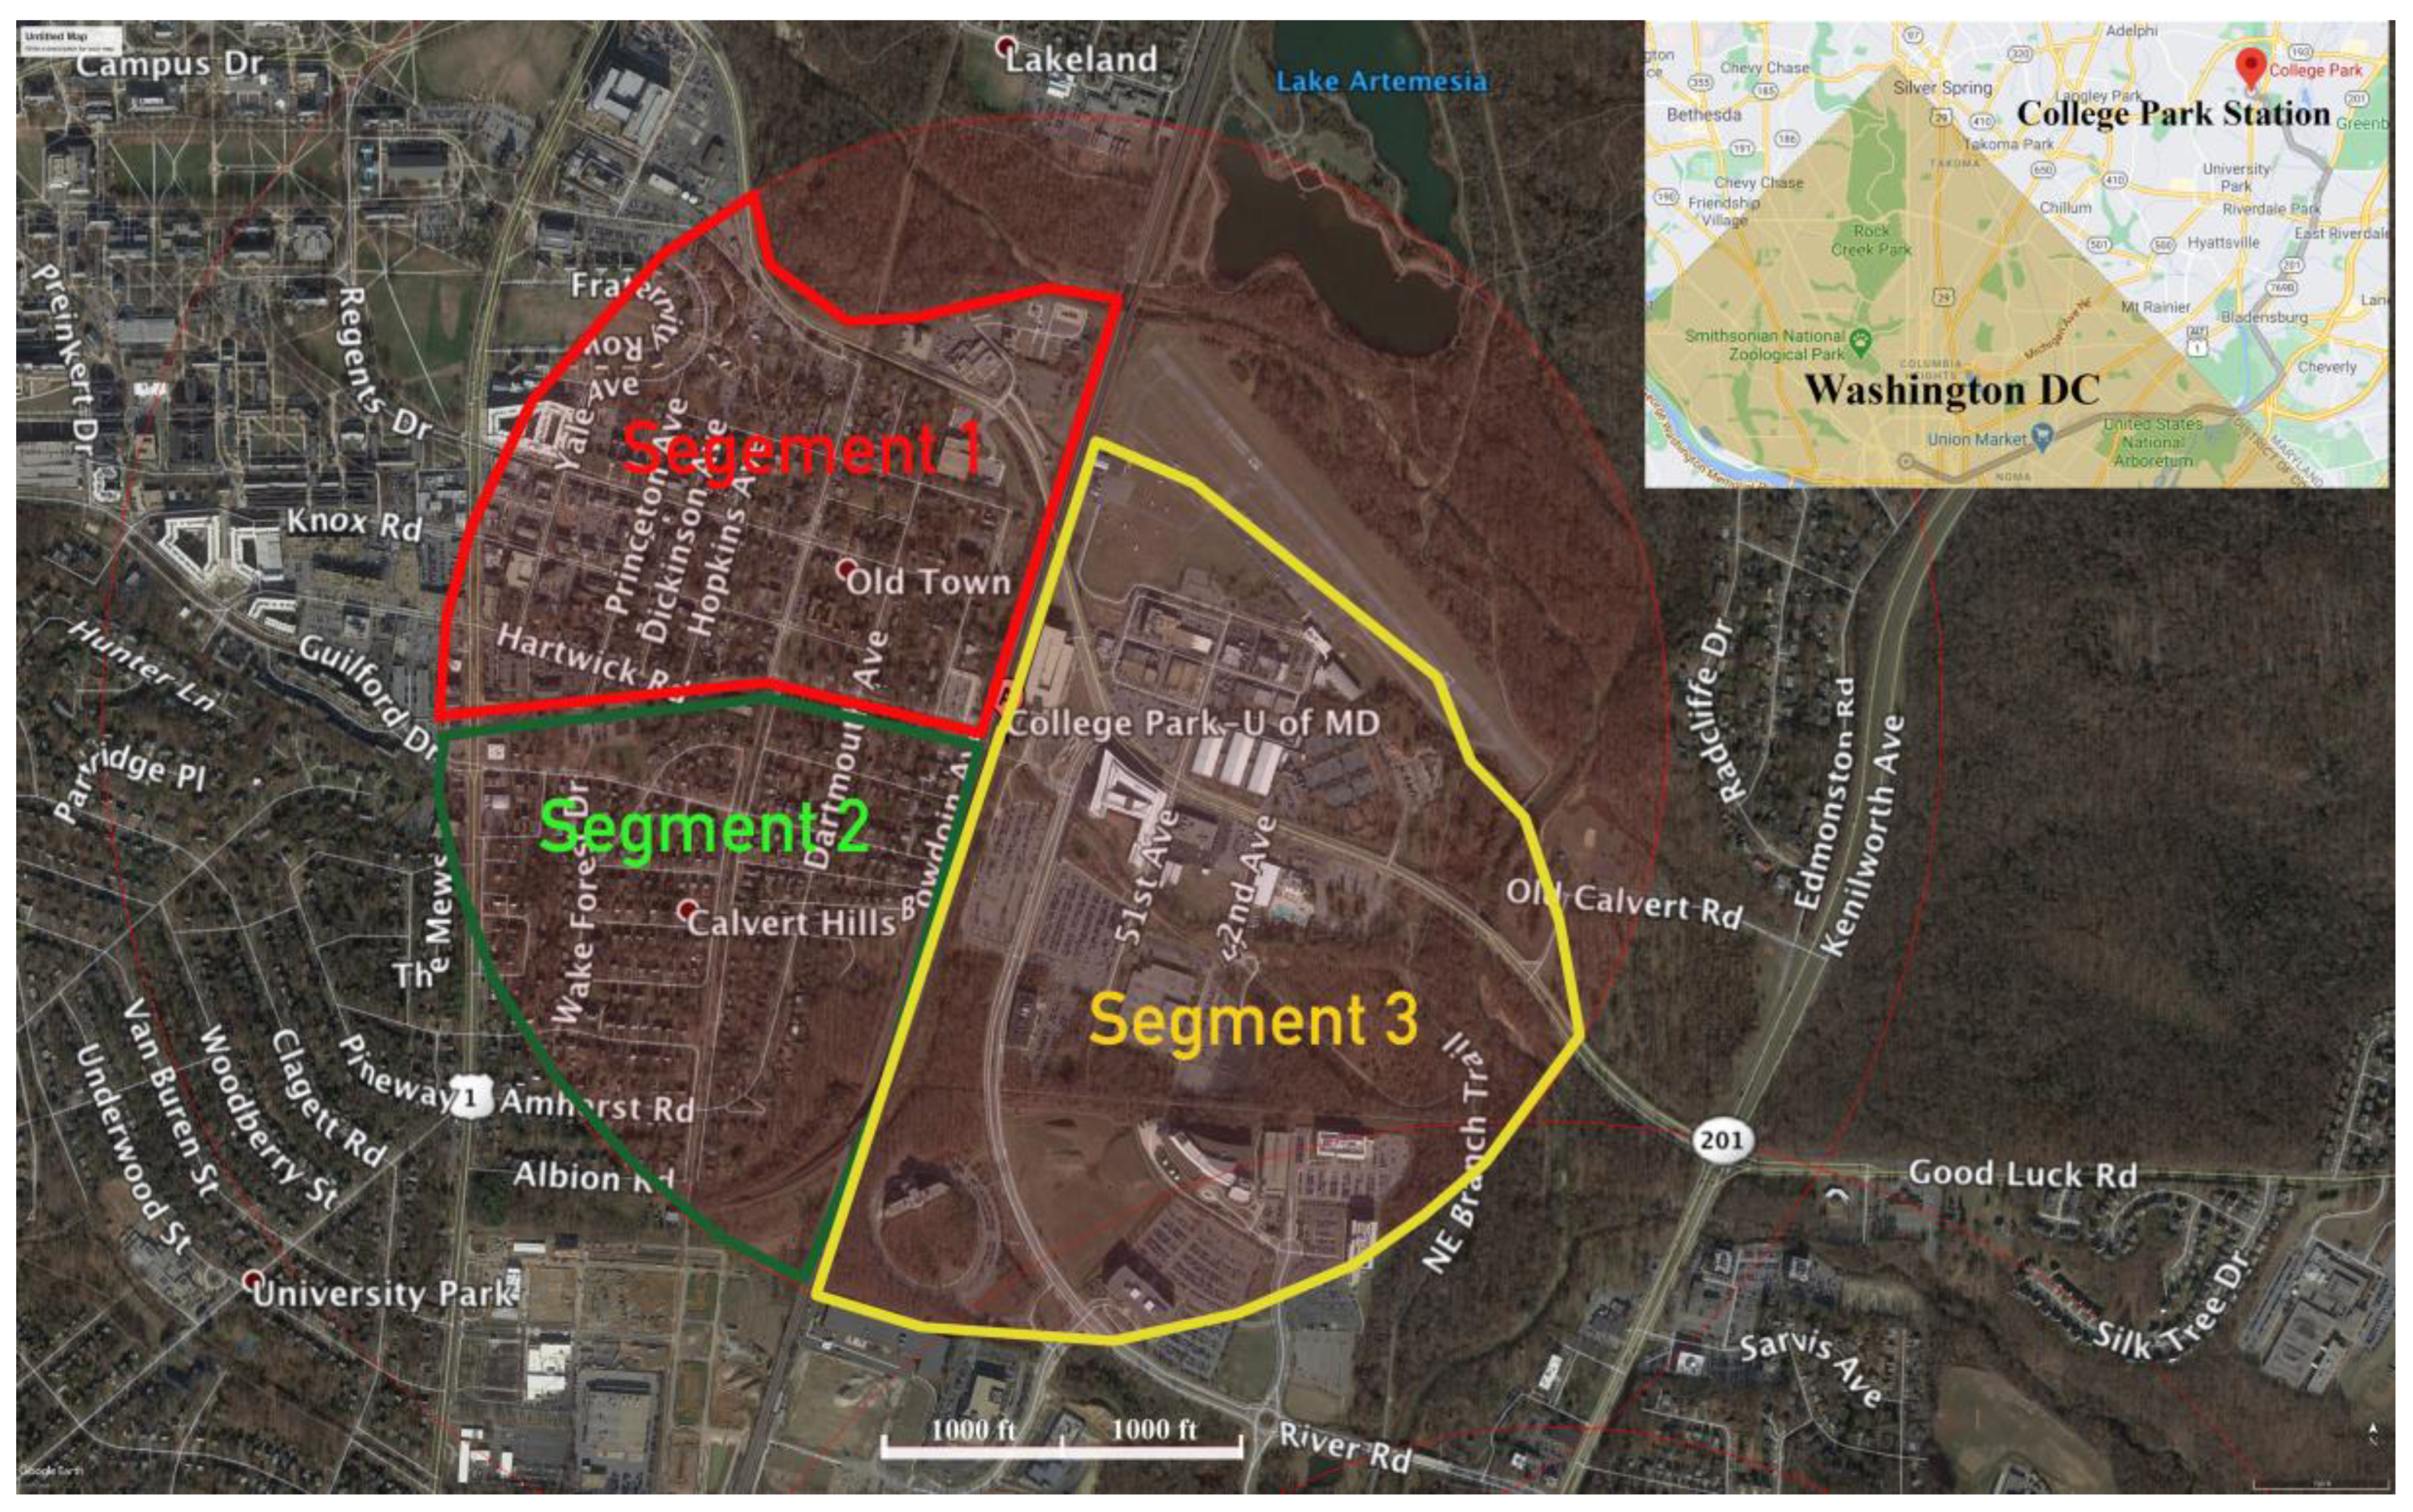
Firstly, the field auditing was conducted between July and August 2018 to collect data for assessing built environment quality with respect to objective characteristics of the sites. The method for selecting the location for measurement was systematically arranged. Initially, three sites were selected along the PL with different existing densities, building characteristics, population mixes, and income mixes. Later in the research, in order to rule out social-demographic factors and focus on the built environment variables, we concentrated on one site, which covers a ten-minute walking distance radius from a future PL station—College Park Station. The location was divided into three segments, altogether covering an area of 1.13 square miles, as shown in Figure 2.
The audit was completed with a paper checklist onsite, and later the data were transcribed into an electronic version. On a typical audit day, three to four teams of at least two individuals participated in the audit fieldwork. Four primary built environment categories were measured and investigated: land-use mix, architecture/facility, connectivity/accessibility, and aesthetics/environment factors. Within each primary, there were multiple sub-categories; altogether, 122 variables were investigated. Out of the 122 variables, 6 categorical variables showed significant differences in the three segments, therefore they were used as criteria to construct Pre- and Post-PL VR, and also included in the final data analysis. The six categorical variables were: (a) building types (BT), (b) natural features (NF), (c) street characteristics (SF), (d) architecture features (AF), (e) front porch (FP), (f) building height (BH) (refer to the supplementary materials for the detailed checklist and included 122 variables).

3.4. Pre-PL Scenario Reconstruction and Post-PL Scenario Creation in Virtual Reality (VR)

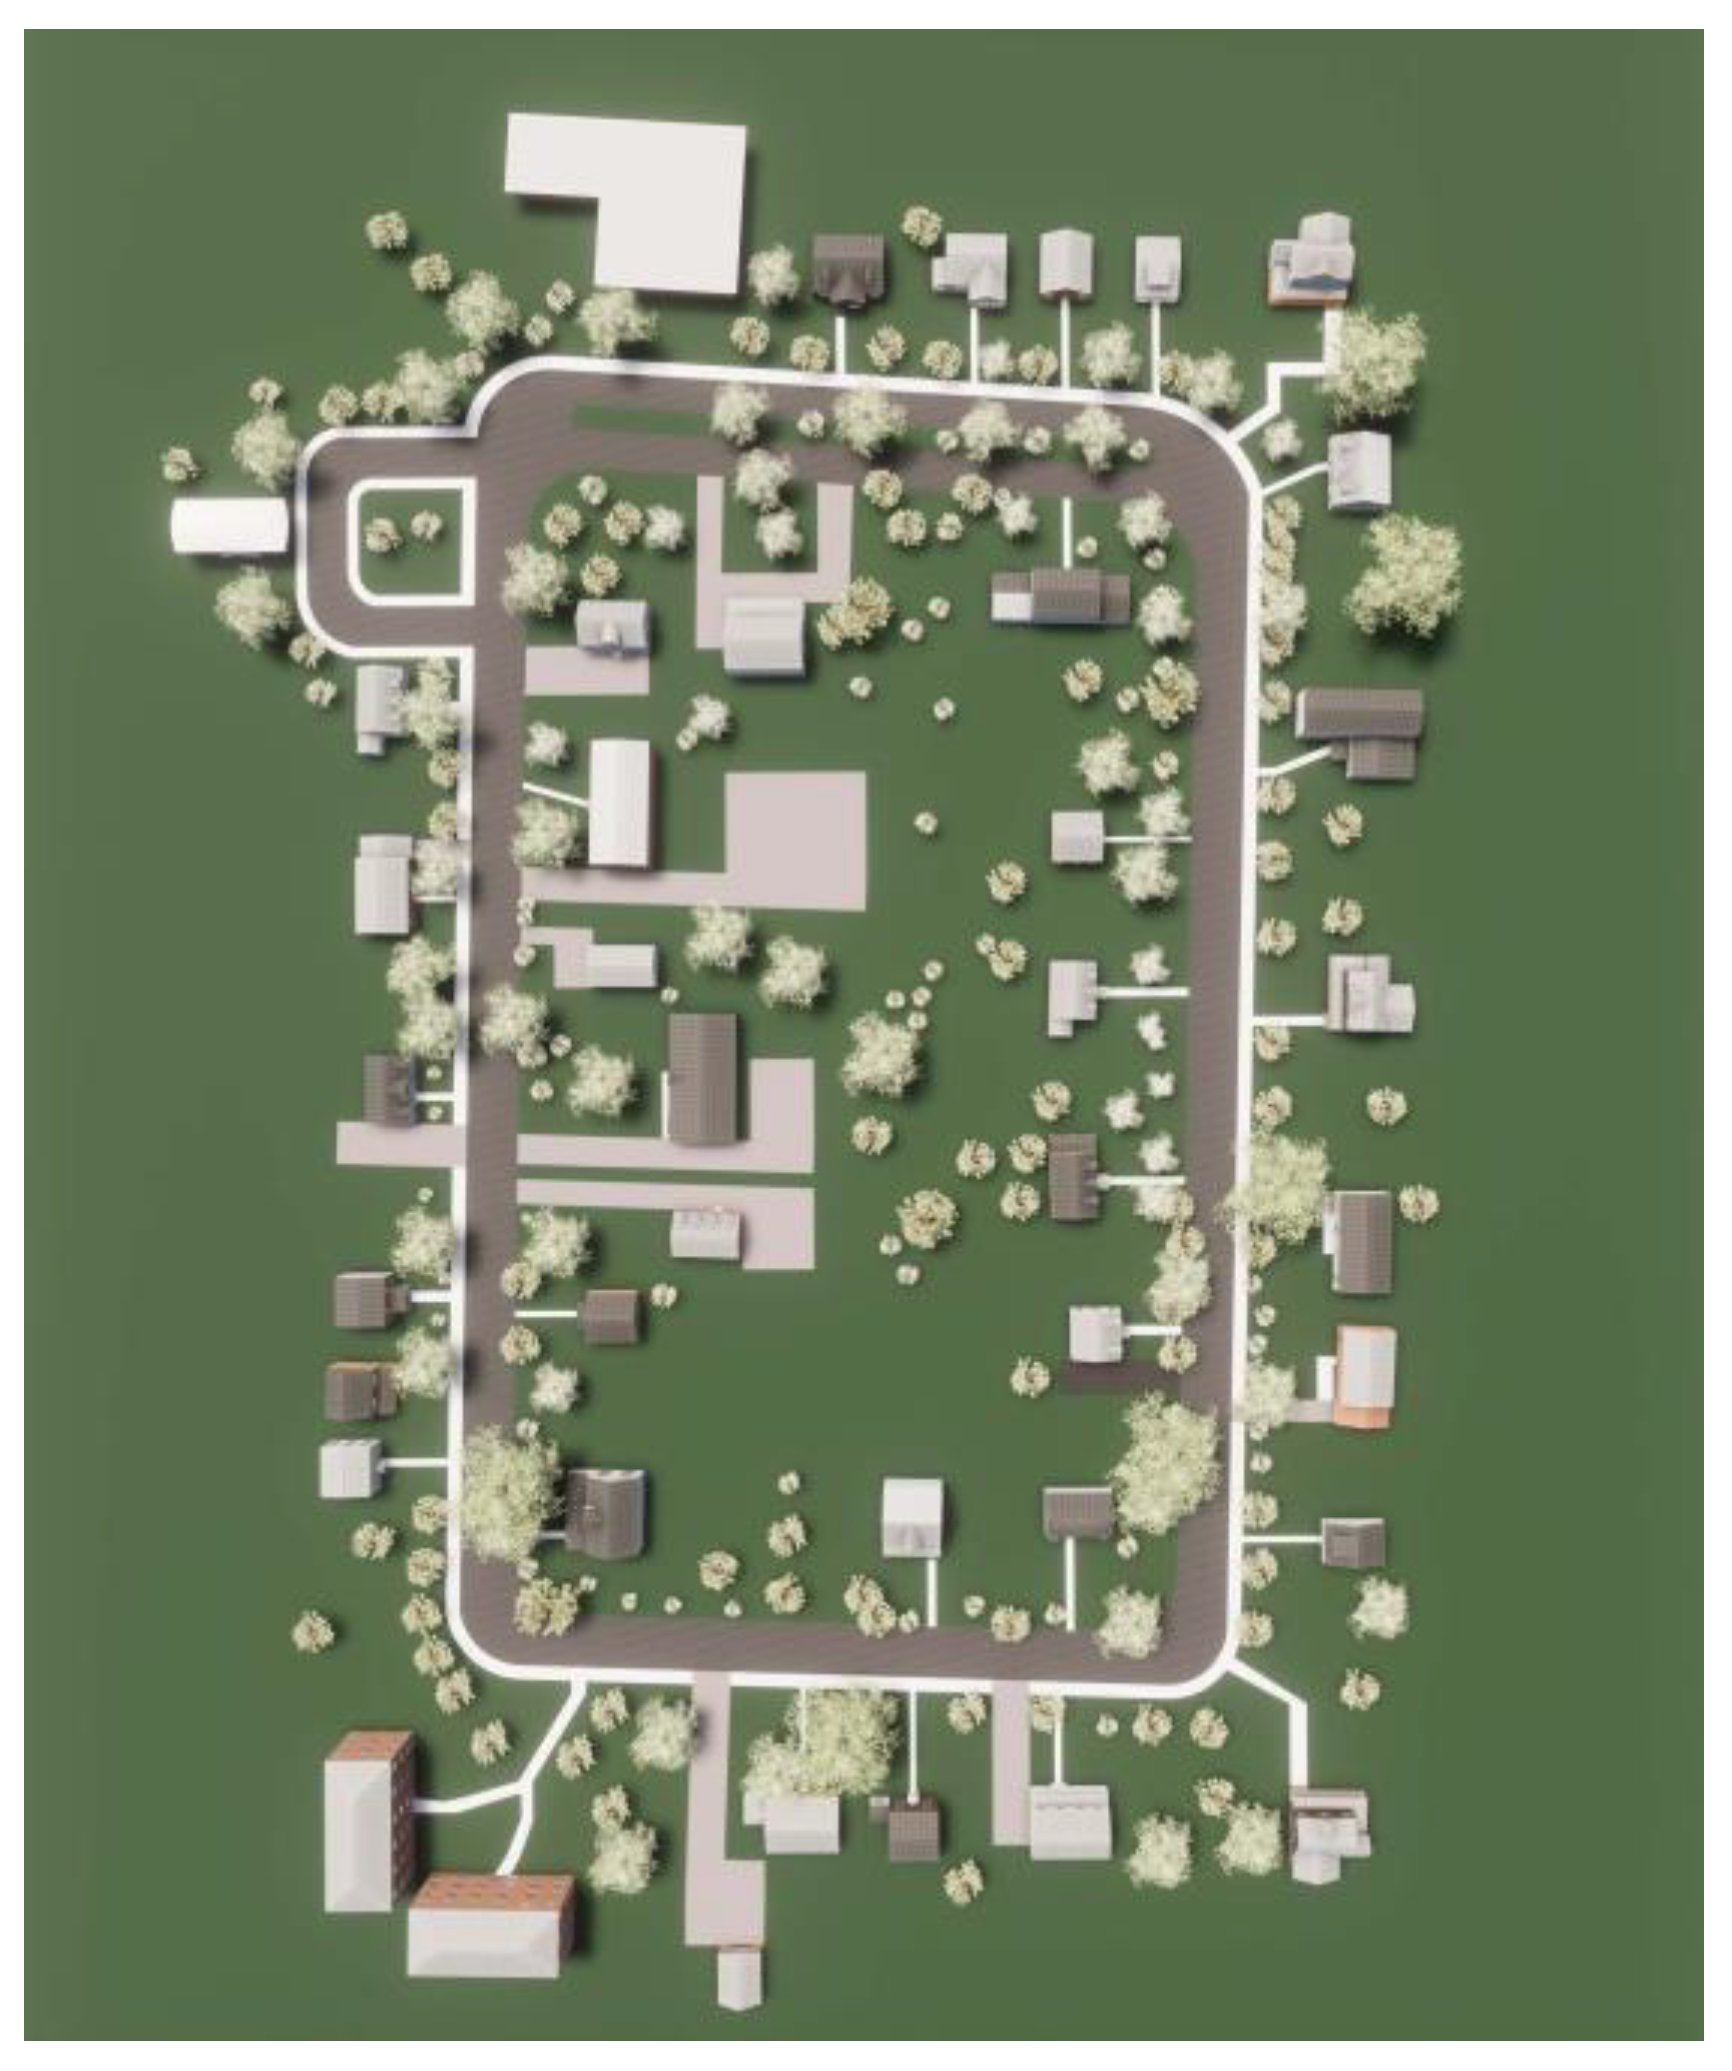
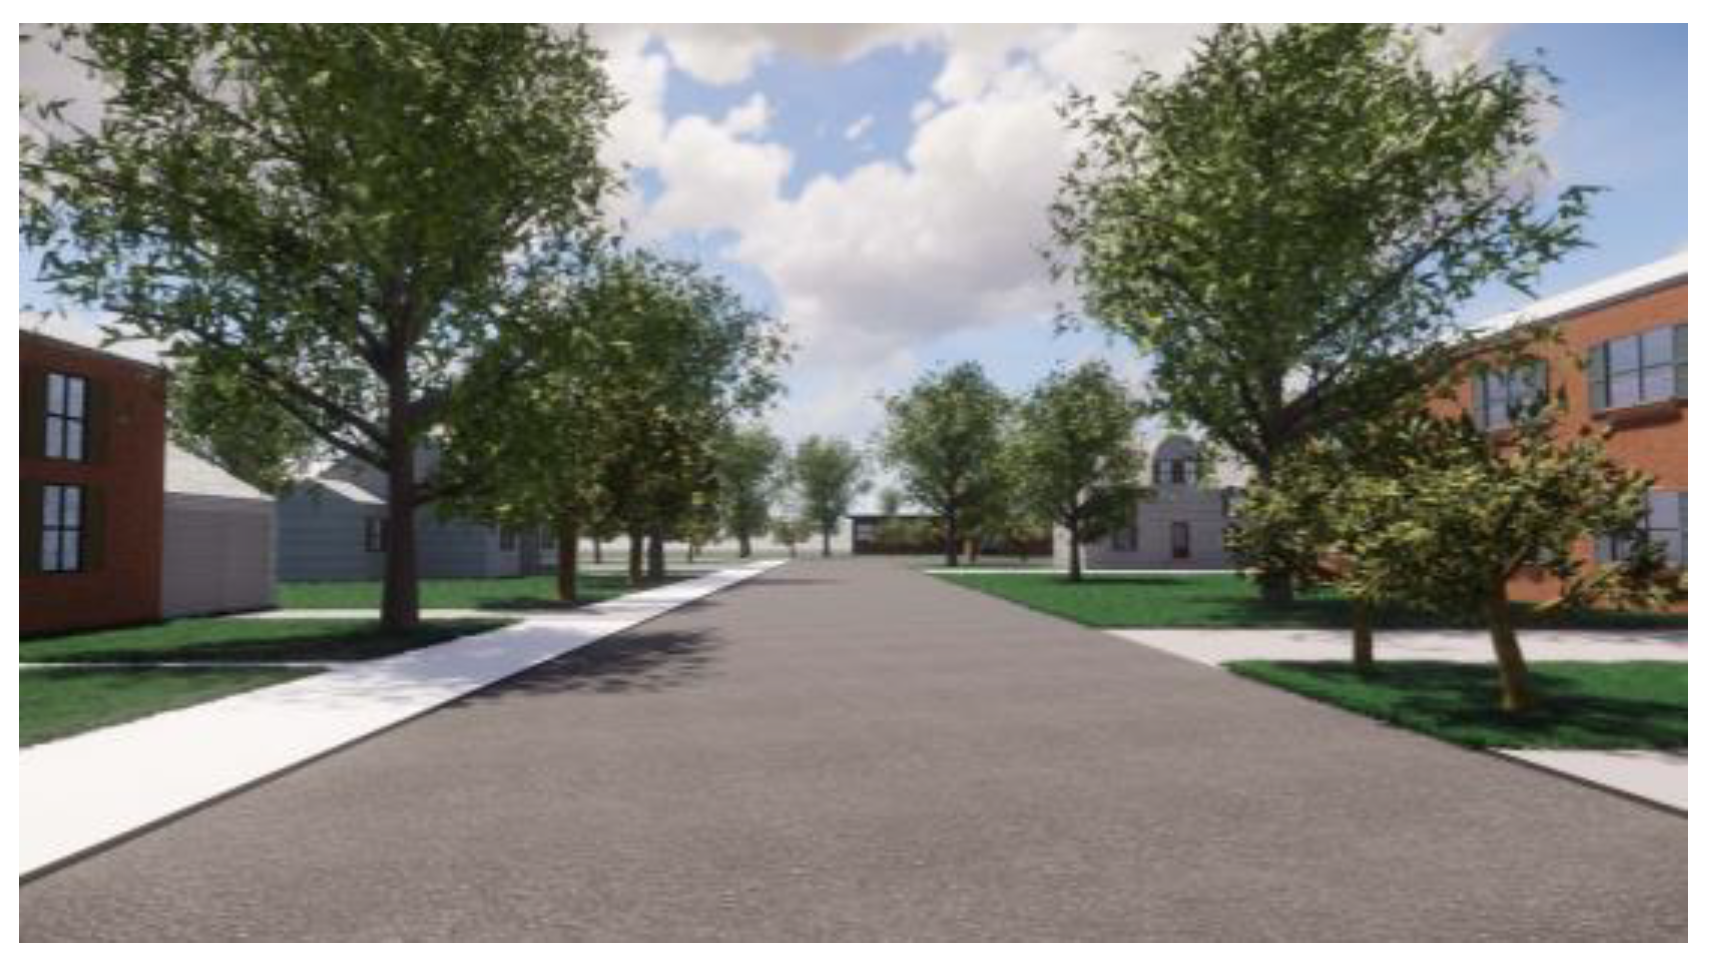
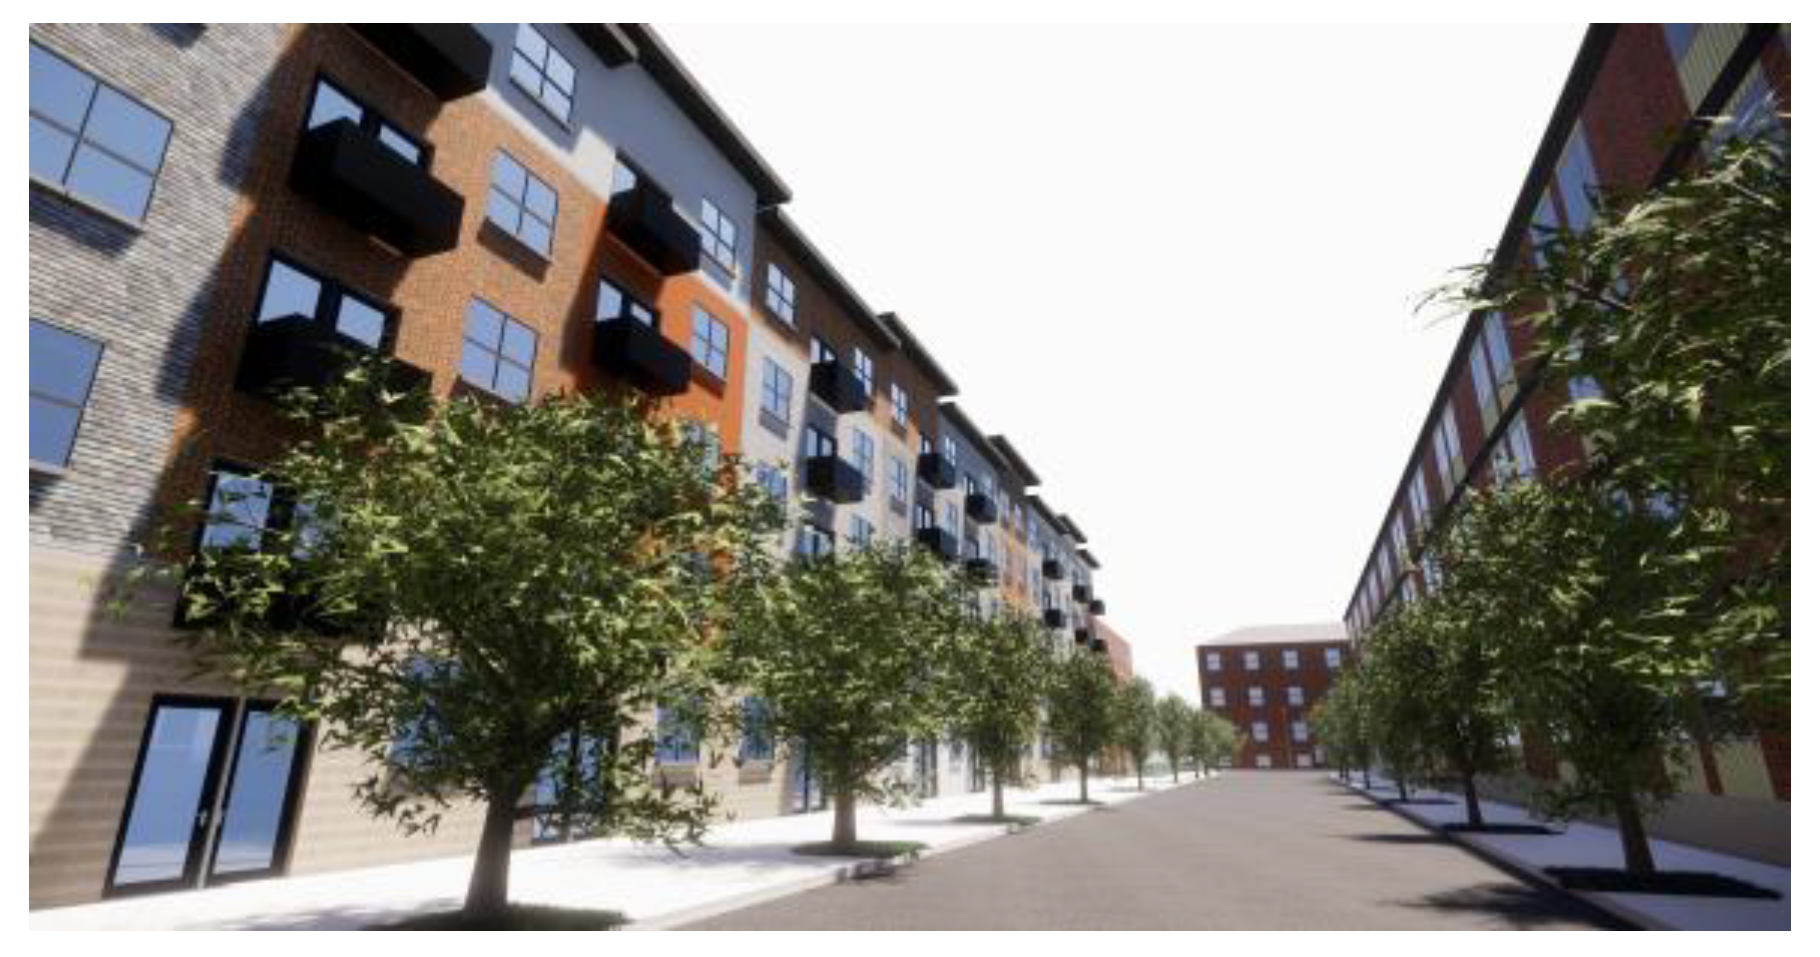
After the field audits, the Pre-PL scenario was reconstructed in the virtual environment. In general, there are three types of VR technologies: (1) direct VR integration in 3D modeling software, (2) VR with a game engine, and (3) a 360-degree panoramic picture [43]. In this research project, direct VR integration technology was applied due to the speed and quality of the work. Firstly, a 3D model was created with Autodesk Revit based on the initial design. Then, a plug-in tool called ENSCAPE was used to translate the Revit model to a virtual environment. It is the only program that can be directly integrated into multiple 3D modeling software programs, which creates high requirements for the hardware (computer); however, it allows for instantaneous design changes in a virtual environment. After the objective physical Pre-PL built environment attributes were measured and verified through field auditing, then the Pre-PL built environment (which are existing conditions) were reconstructed in a VR. In the Pre-PL, more than 95% of buildings are one story single-family residential houses; there are no commercial buildings or public recreation facilities in Segment 1 and 2. There is only one public recreation facility in Segment 3, as shown in Figure 3, Figure 4, Figure 5 and Figure 6. The architectural style and street characteristics are homogeneous in the Pre-PL environment. Then, based on the information about the proposed station that is available on the county website and recent mixed-use developments in the surrounding areas, the Post-PL environment was created. The eight variables (extracted from field auditing, described in Section 3.3) were used as design criteria to create the future scenario to be differentiated from the Pre-PL (existing) condition. Unlike the Pre-PL built environment, the Post-PL environment is featured with mixed-use building types, and multi-storied buildings with a variety of styles with porches and balconies. Furthermore, the street characteristics in Post-PL can be described as walkable, dense, and enclosed, as shown in Figure 4 and Figure 6.

3.5. VR Headset and Mobile Electroencephalograph (Mobile EEG) Set Up

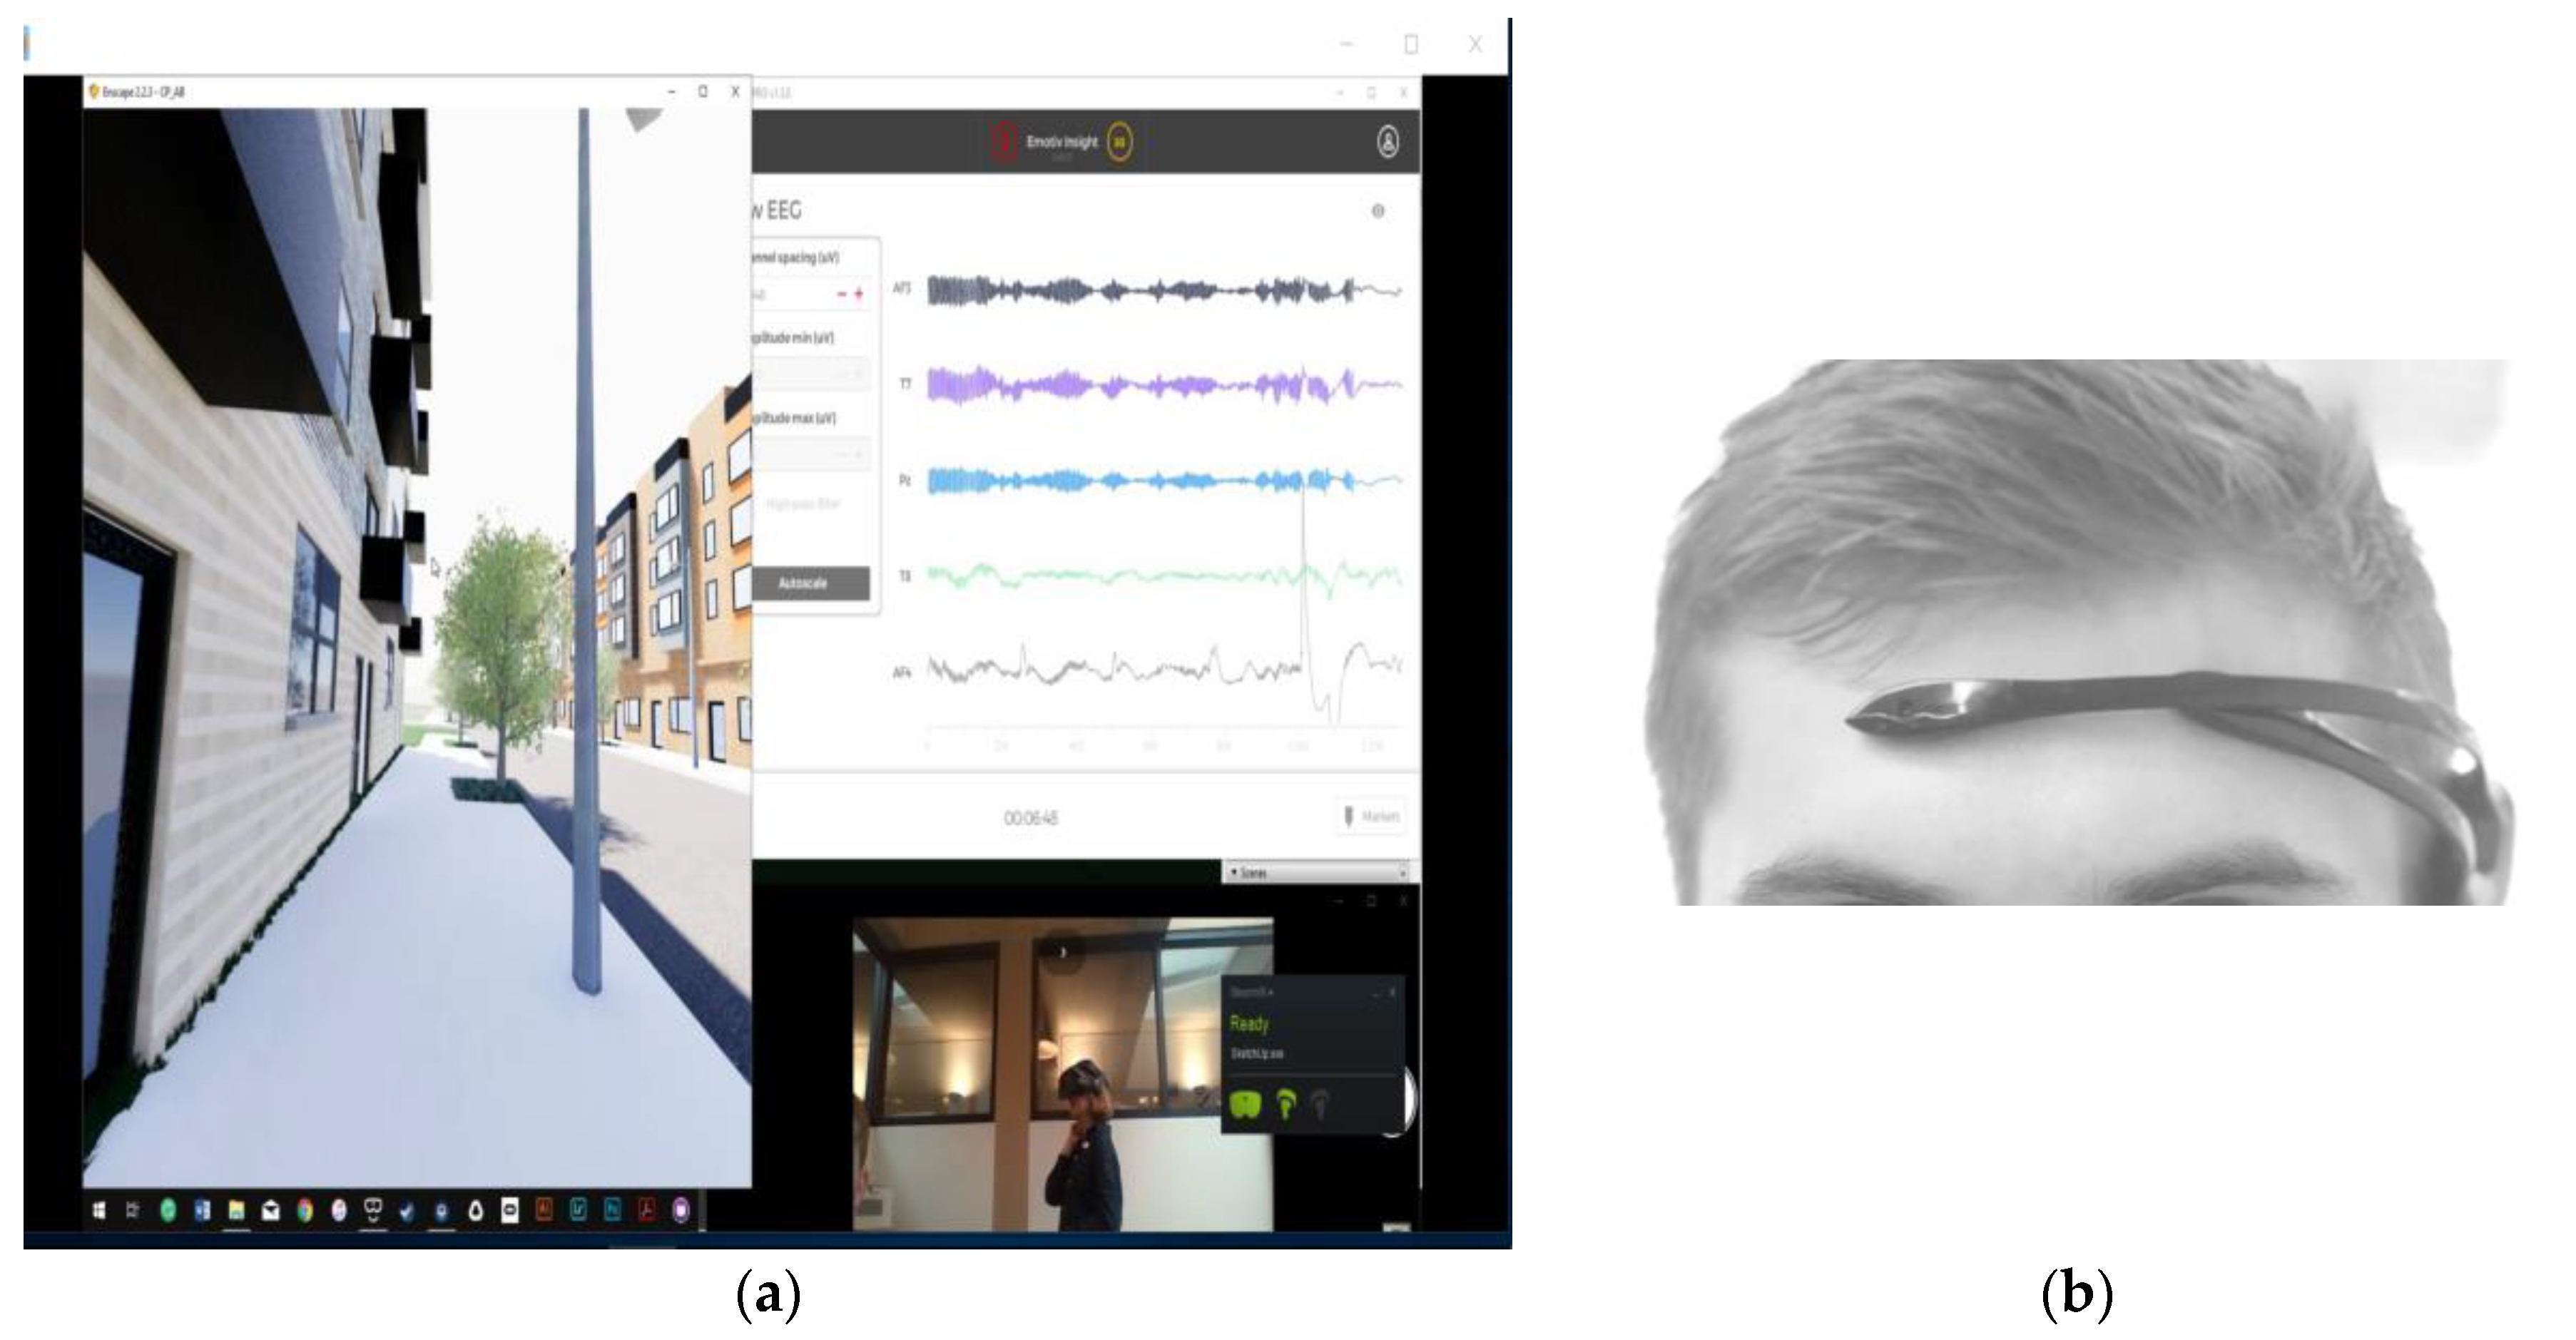
In this research, the VR set used was a Samsung Odyssey and it was worn on top of the EEG device. The emotional responses were then measured as the proxy/indicator of the psychological impacts of stress, relaxation, and engagement. The Emotiv INSIGHT EEG headset was chosen based on its relatively low cost and accompanying software, which can aggregate the raw data. The EEG headset was fitted on the underside of the VR headset, as shown in Figure 7a,b. After being fitted with the device, each participant was asked to focus on a blank background for 10 s, attentive to his or her own breathing, which allowed us to detect the baseline emotional state of the participants. Afterward, we immersed them into two VR environments, with each environment taking approximately 15–20 min to experience.
All tests were completed in the afternoon during a weekday. The test participants first experienced Pre-PL and then Post-PL. After the VR immersion, they were asked to fill out a questionnaire; altogether, the entire test lasted 40–50 min per participant. The participants were given full control of where and how they wanted to explore the VR environment and how long they decided to stay in each space (refer to Figure 5 for the virtual environment). In addition, the total maximum amount of time was kept at 20 min for each VR environment. Since the participants could control the speed of movement, certain participants spent less time in the VR than others; however, they were able to visit more spaces. It was possible to set a default path in the VR so that all participants would experience the same events based on identical sequences. However, in the initial experiment design, we wanted to validate the feasibility of capturing as close to a real experience of how an individual would explore a new environment so the emotional responses would be less edited; therefore, we gave full control to the participants. The varied VR paths of the participants were recorded, so, if necessary, we could compare and investigate the differences among the explored paths.
The device, as shown in Figure 7b, consisted of five sensors positioned on the wearer’s scalp according to the international 10–20 system: the antero-front (AF3, AF4), parietal (Pz), and temporal sites (T7, T8). Brainwaves were measured through those five channels in terms of amplitude (10–100 microvolts) and frequency (1–80 Hz) at 128 samples per second per channel [44]. The four main brainwaves/bands measured and recorded were beta, alpha, theta, and gamma. The beta wave is associated with engaged brain activities, such as learning, working, and speaking. The alpha wave, in contrast, represents non-arousal brain activity; a person who is sitting down and resting is often in the alpha state. The theta wave represents the state of having a free flow of ideas as well as being less engaged in the current physical state. For instance, an individual who often runs outdoors has a state of mental relaxation and is prone to a flow of ideas. Theta waves, known as “suggestive waves”, also appear during daydreaming, which is considered a positive mental state since these waves suggest an open mindset. They also imply deep emotional connections to others or objects; in this case, the built environment. Furthermore, theta waves have the benefit of improving creativity and intuition (Emotiv). The gamma wave is a more recent discovery and is involved in processing highly complex tasks with healthy cognitive functions.
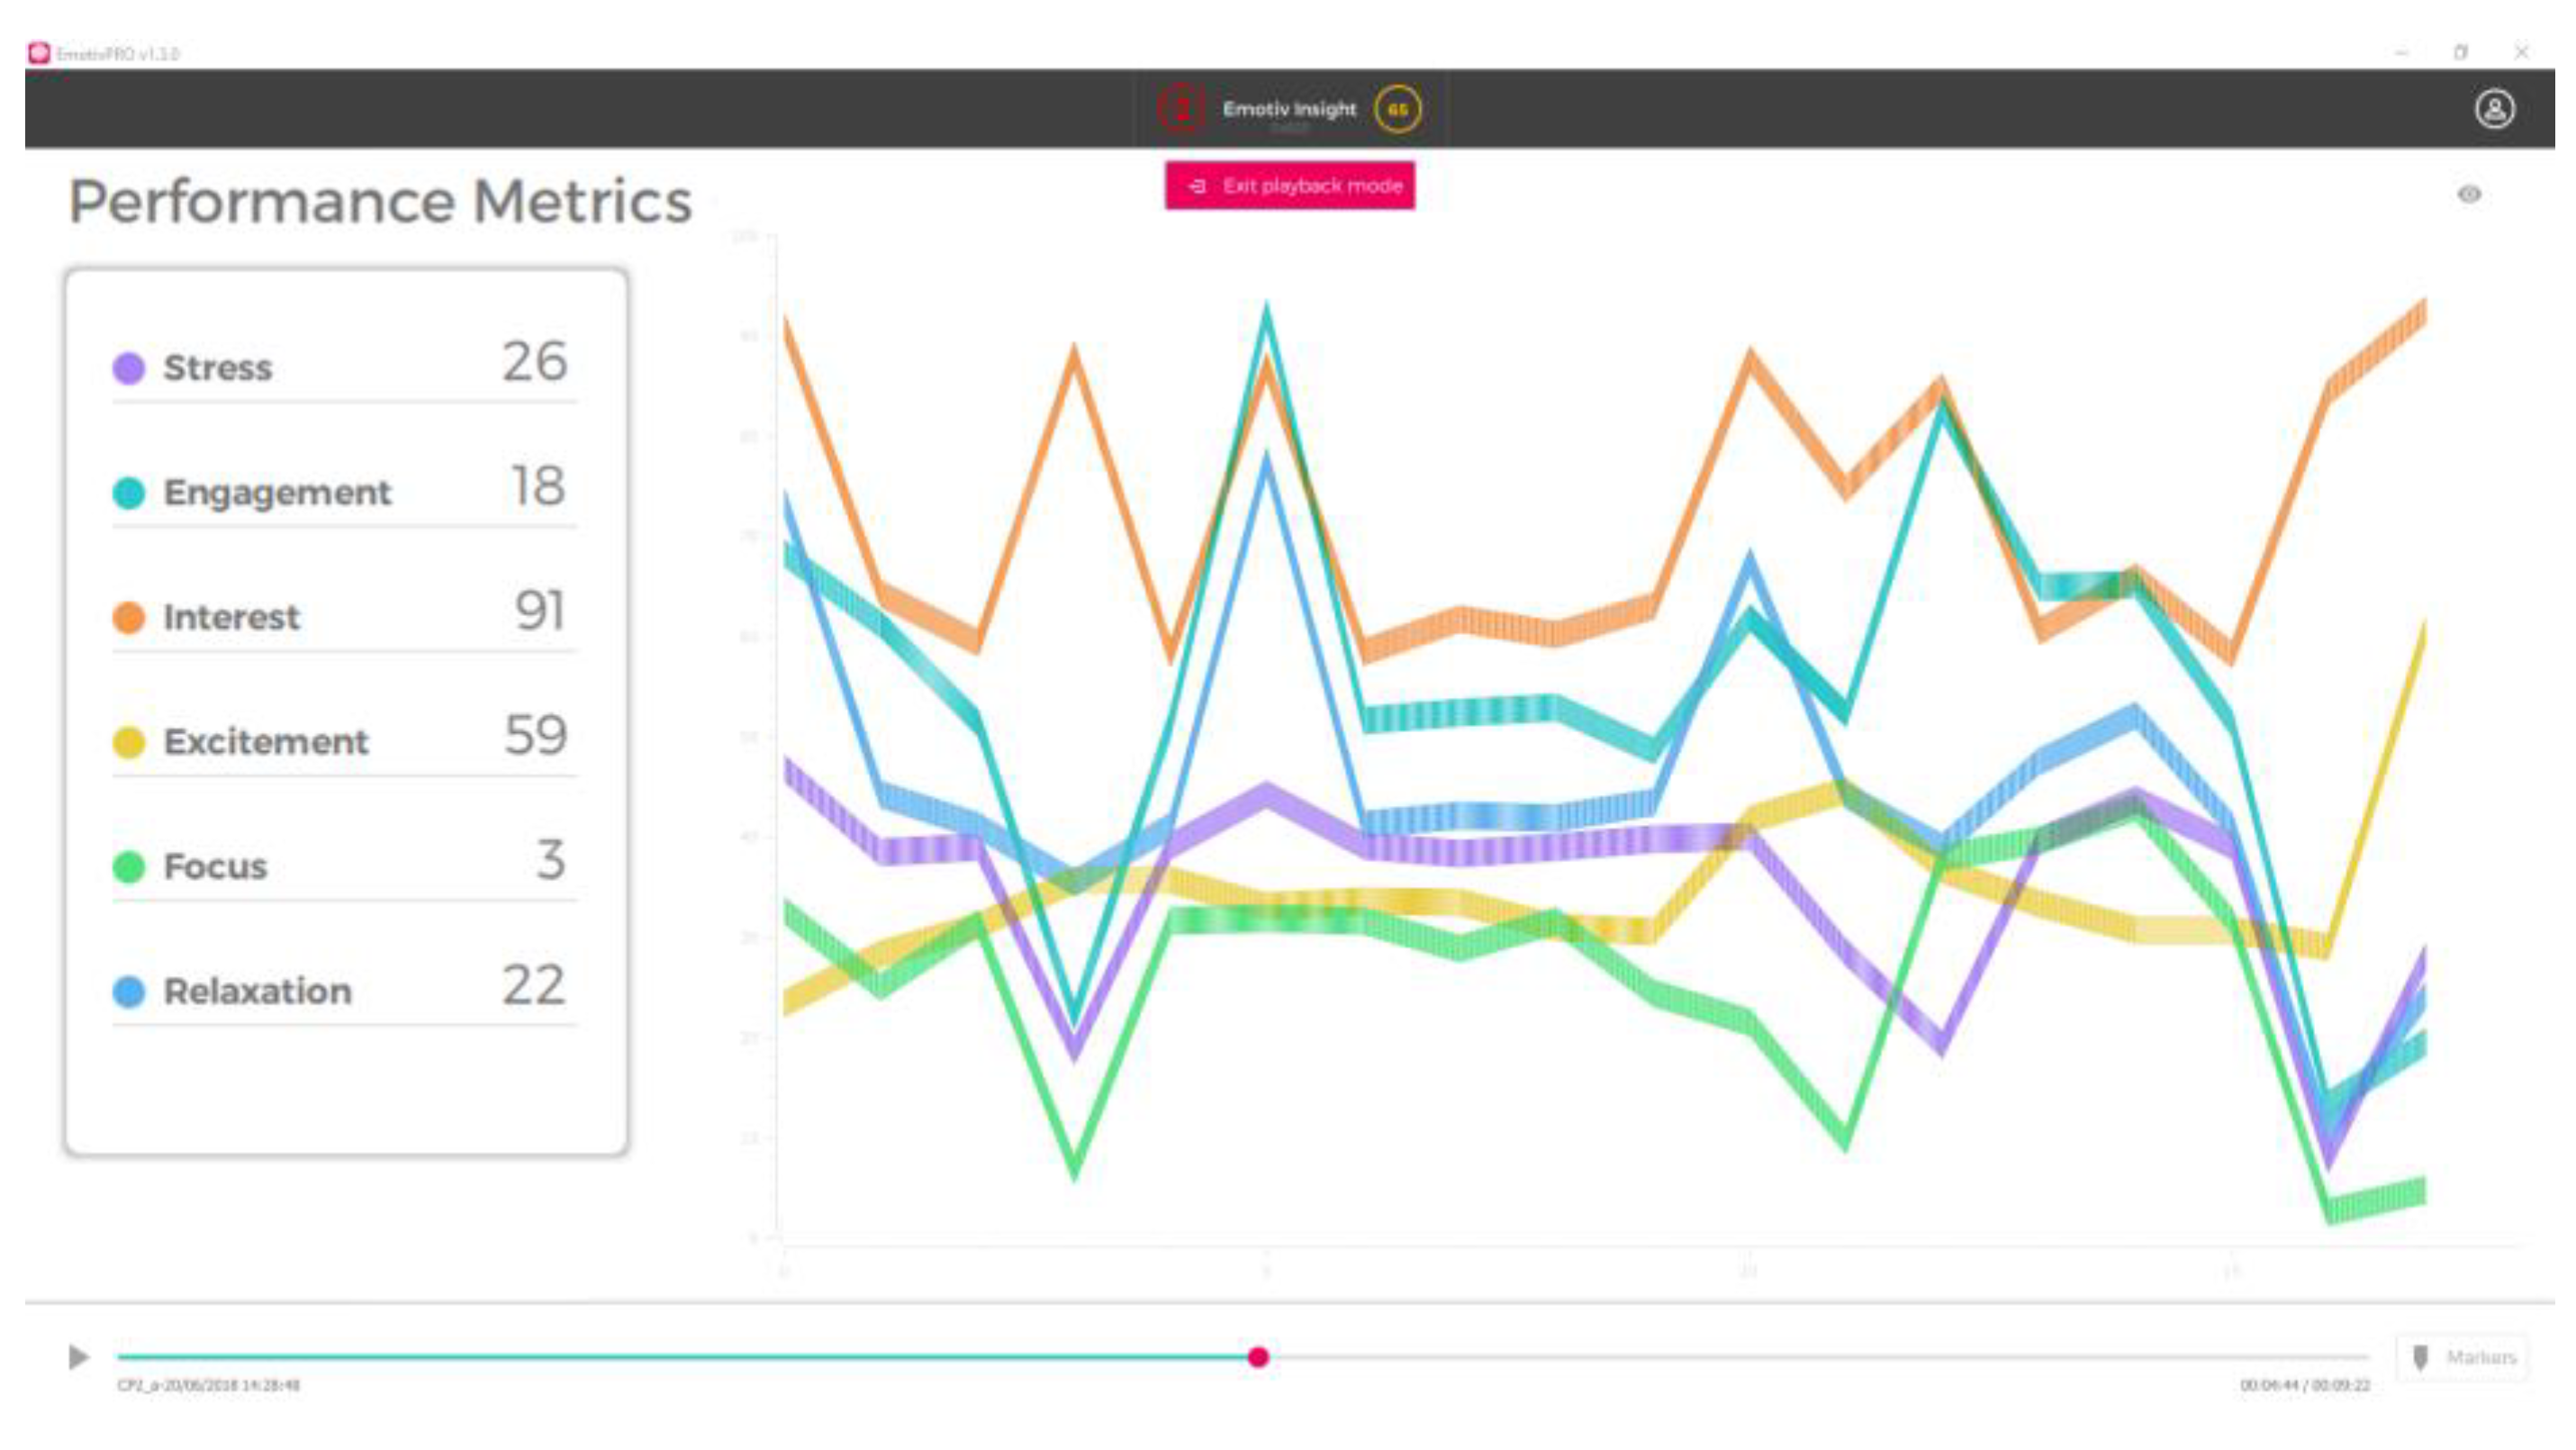
After the raw EEG data was collected from each participant, the signals were analyzed with the software Emotiv Pro (developed by Emotiv) and categorized into one of six emotional states: stress, engagement, interest, excitement, focus, or relaxation. Engagement (ENG) typifies a mixture of attention and concentration, with high scores indicating higher productivity. It measures the level of immersion in the moment and contrasts with boredom. Engagement is characterized by an increased physiological arousal as well as beta waves and attenuated alpha waves. The greater the attention, focus, and workload, the greater the output score reported by the detection. Excitement (Exc) is correlated with classical arousal indicators, such as increased heart rate and blood flow [45], and the type of arousal is typically short term in comparison to the long-term arousal associated with engagement. Focus (FOC) is a measure of the depth of attention as well as the frequency that attention switches between tasks. In contrast, interest (VAL) provides a measure of affinity to tasks, with low scores indicating aversion and mid-range scores indicating neither like nor dislike. Stress (FRU) is indicative of several outcomes—low to moderate levels of stress can improve productivity whereas a higher level tends to be destructive and can have long-term consequences for health and wellbeing [46,47]. Finally, relaxation (LEX) is a measure of an ability to switch off and recover from intense concentration. Each of the five measurements was given a number between 0 and 1. The scores provided by Emotiv were useful indicators for our pilot study; however, we recognize the limitations in the validity and reliability of this device. Following immersion in one of the VR designs, for each participant, Emotiv Pro provided temporally based scores for each of the six emotional states, as shown in Figure 8, which were later used in the statistical analysis.

3.6. Subjective Evaluation

After immersion in the two VRs, an eight-item questionnaire measuring the built environment characters was given to each participant. Eight variables (defined in the field auditing phase) were rated on a seven-point Likert scale: (a) building types (BT), (b) natural features (NF), (c) street characteristics (SF), (d) architecture features (AF), (e) front porch (FP), (f) building height (BH) (refer to the supplementary materials for the detailed checklist and included 122 variables). At the end, test subjects were also asked to provide a preference score of one built environment over the other.

4. Data Analysis and Findings

4.1. Questionnaires and EEG Results

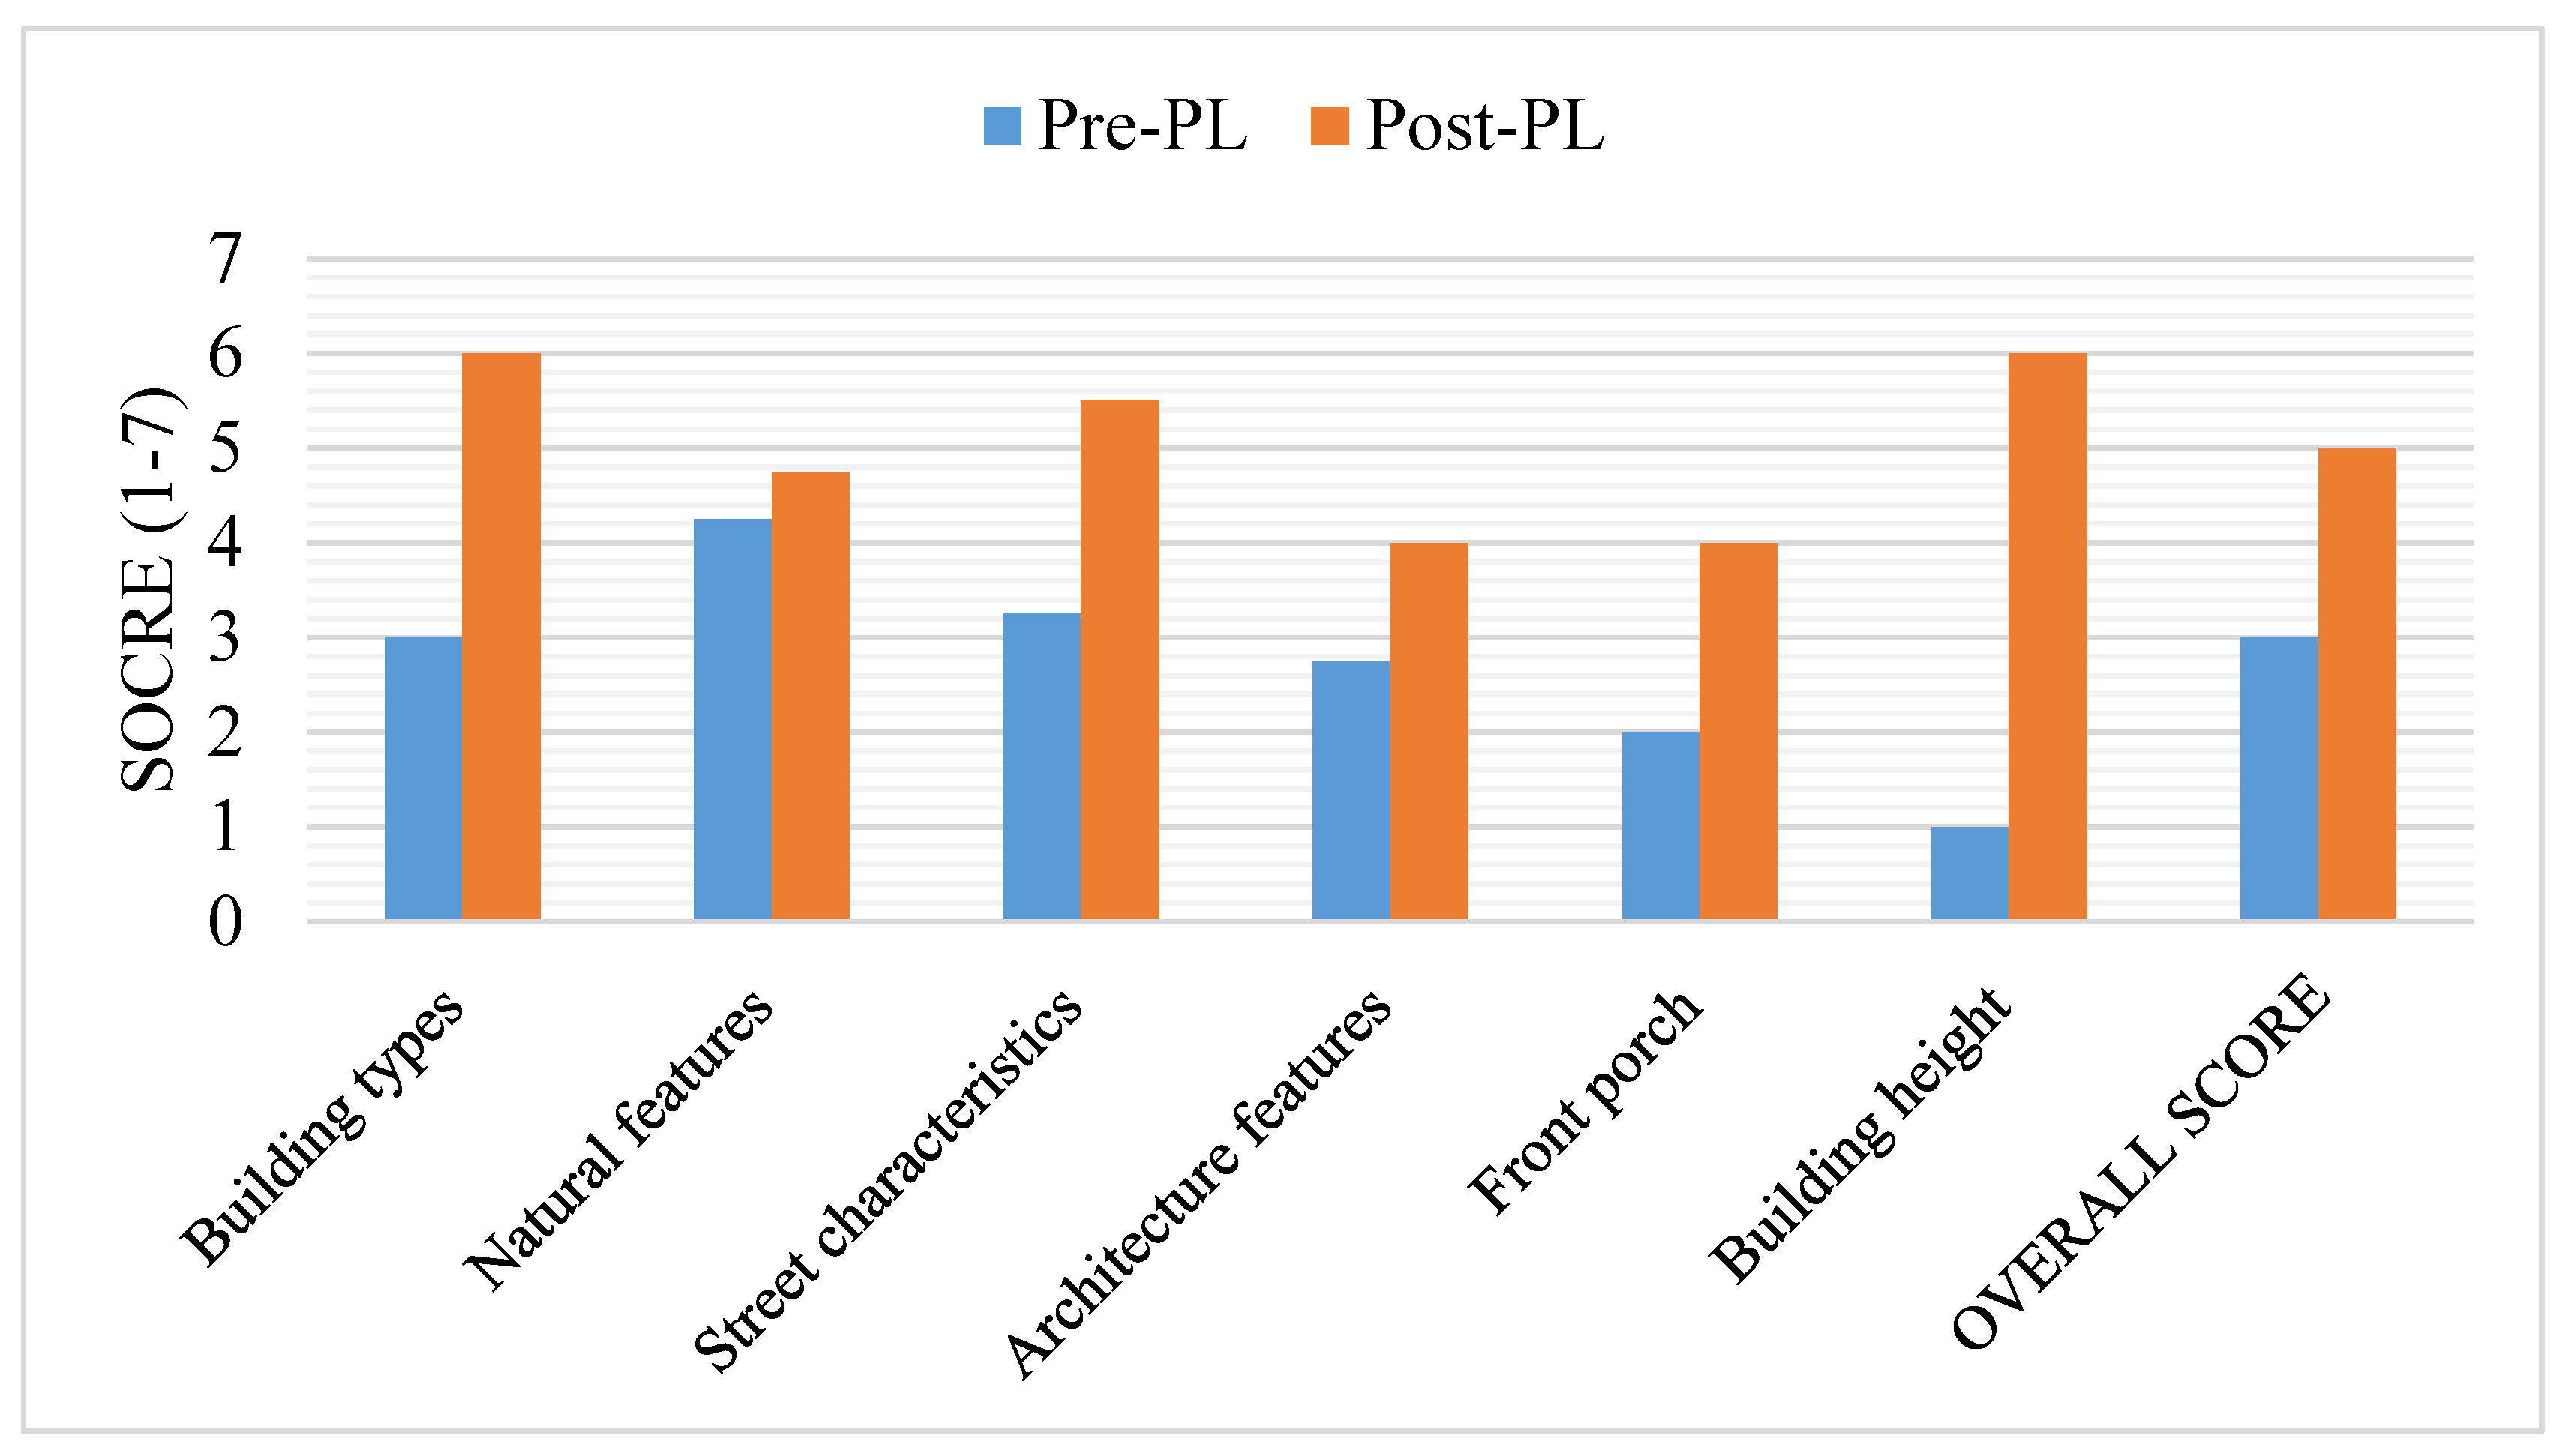
Figure 9 illustrates that the Post-PL scenario received a higher score than the Pre-PL scenario in all four built environment characters. In Post-PL, architecture features (AF), density (DS), and land-use mix (LUM) were rated as the top three attributes, aligning with the fact that Post-PL was created based on development goals. The much higher overall preference score of Post-PL (the last column in Figure 9) validates the point that Post-PL can potentially encourage local resident engagement and participation in the built environment by providing more connected streetscapes, more interesting architecture features, and diverse land use. One interesting finding was the fact that AF was rated as one of the top attributes for the Post-PL environment by participants and was directly correlated to the high final overall score; however, none of the test participants were architecture students. This might be explained by the innate nature of human beings as visual thinkers who do not consciously or proactively acknowledge the important role of aesthetic value of architecture features in built environment evaluation. Scientists agree that humans possess five basic senses: smell, hearing, touch, taste, and vision. Additionally, the human brain expressly prioritizes just one sense: vision [47]. Furthermore, Ackerman (1992) stated that about half of the sensory information reaching the brain is visual [48].
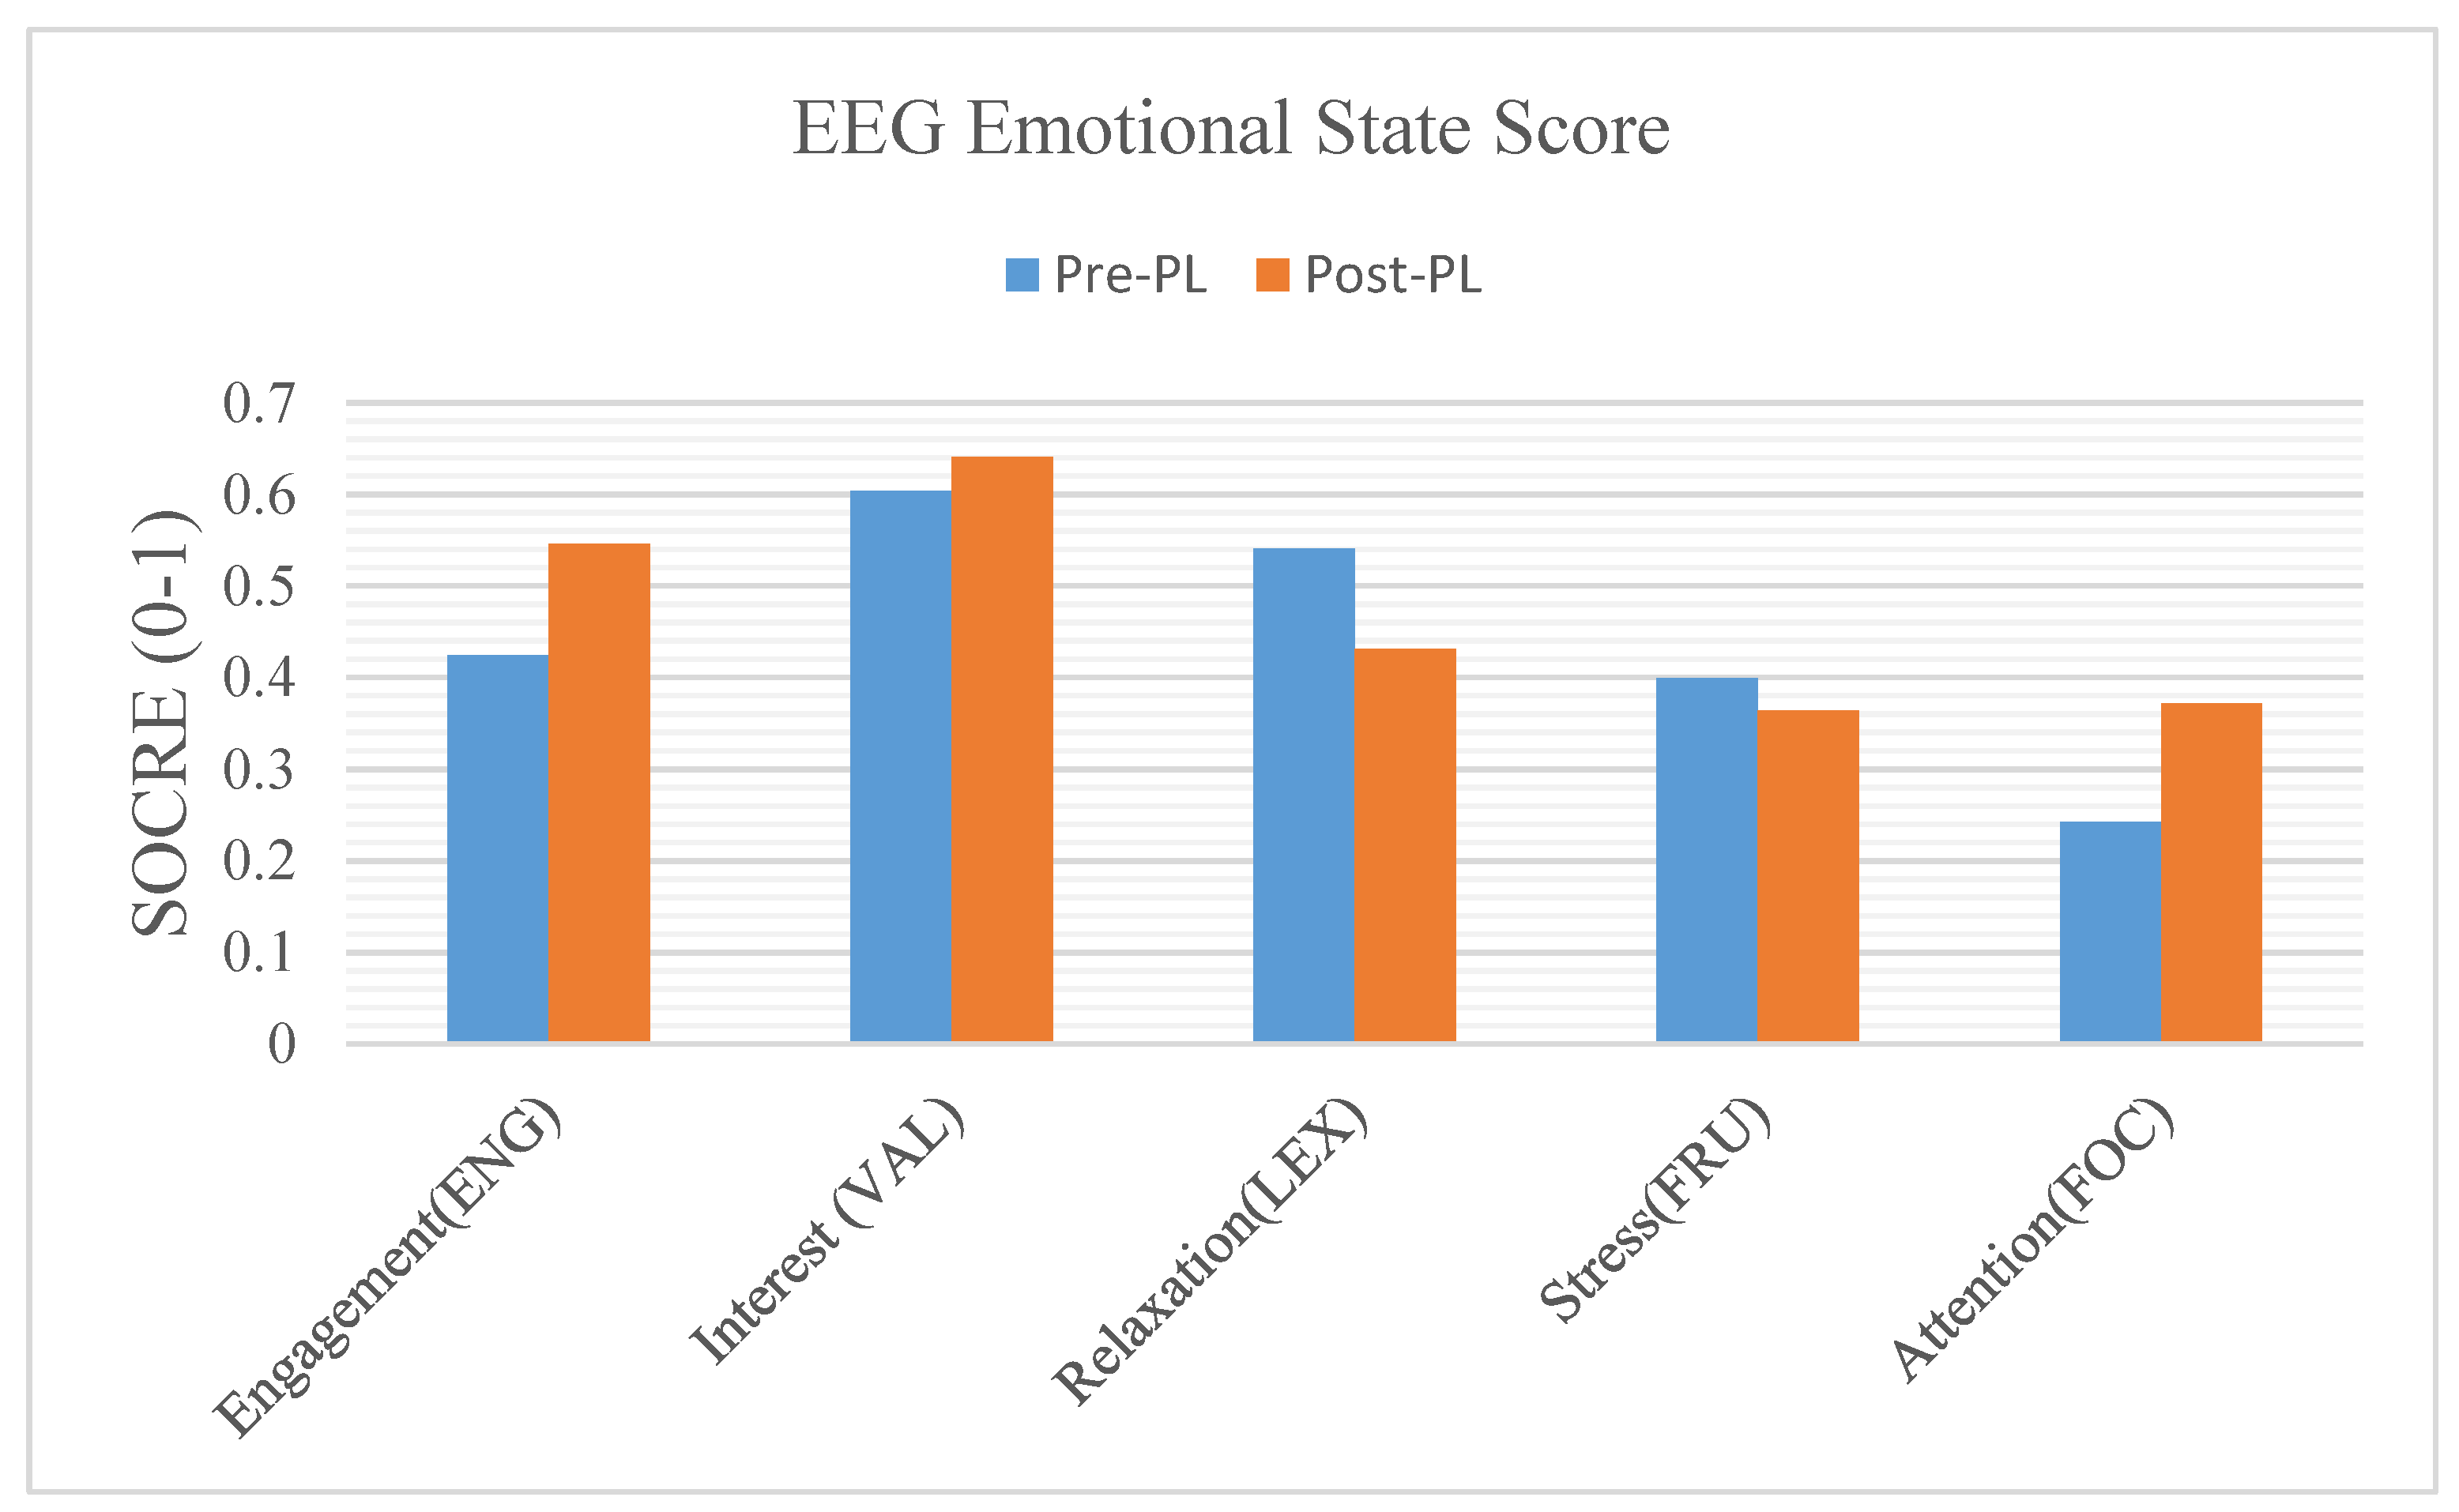
Next, we examined whether the higher evaluation scores were correlated with a positive emotional state of the participants. Each participant had an approximate 20 min recording, which generated more than 1400 data points. Overall, Post-PL stimulated more engagement, interest, and attention, while Pre-PL generated greater relaxation and stress, with stress levels in the moderate range, as shown in Figure 10. Unlike the scores from the questionnaires, which indicate a clear preference for Post-PL from all participants, EEG data indicated that participants had varied emotional responses—including negative, positive, and neutral—toward the two built environments. This is indicating the complexity of the human emotional response and cognitive reactions.

4.2. Statistical Analysis: Wilcoxon Signed-Rank Test

The EEG data did not directly lead to the overall evaluation of the Pre-PL and Post-PL condition, and the emotional state could not be directly translated as negative or positive toward the design solutions. Therefore, instead of looking at the representation of the individuals’ emotional state, we examined whether there was a significant difference in how participants responded to the different design options. A null analysis was appropriate for verifying the hypothesis. The Wilcoxon signed-rank test is commonly used to test for a difference in a paired observation, and a sign test is often used to test the null hypothesis.
The analysis considers one null hypothesis:
Hypothesis 1a (H1a).
There is no significant difference between the participants’ negative and positive emotional states to Pre-PL and Post-PL.
The alternative hypothesis is:
Hypothesis 1b (H1b).
There is a significant difference between the participants’ negative and positive emotional states to Pre-PL and Post-PL.
Descriptive results: Wilcoxon signed-rank test
The results from the Wilcoxon signed-rank test for Pre-PL, compared to Post-PL, are illustrated in Table 1. The equation used to obtain the statistic W was:
W = i = 0 n R i ( + ) ,
where n′ is the actual sample size, Ri is the rank, and W is the Wilcoxon test score.
For null hypothesis H1a, among the five different emotional responses to the two design options, three response types were higher for Pre-PL while the other two were lower for Pre-PL, as shown in Figure 10. The Wilcoxon test score (W), 27, was higher than the critical value used for a two-tier test of 18. Based on these results, we can reject null hypothesis H1a. Instead, we should reject the alternative hypothesis, H1b. In conclusion, there was emotional state difference between the participants’ positive and negative responses to the Pre-PL and Post-PL conditions.

4.3. Statistical Analysis: T-Test

A t-test was conducted to verify the findings from the Wilcoxon signed-rank test. A t-test is a parametric test. The t-test conducted in this project was a paired t-test (or one-sample t-test). A t-test assumes a normal distribution of the sample; the sample/data is collected from a randomly selected portion of the total population. Even though the sample size was small, the selection still met the random selection criteria, and the sampling distribution was symmetrical, unimodal, and without outliers. After validating the approach, in the second phase study, we used a much larger sample set that had more than 50 participants.
The null hypothesis remained the same, and the level of significance α = 0.05 was used. The equation used to obtain the statistic t was:
t = m A m B s 2 n a + s 2 n b ,
where m A is the mean of the emotional state score (ENG, VAL, LEX, FRU, and FOC) to Pre-PL and m B is the mean of the emotional state score to Post-PL. na and nb represent the size of the two sample groups, and s2 is the estimator of the common variance of the two samples. t is the test statistical value.
Descriptive results: t-test
For null hypothesis H1a, the p-value of the one-tail test was 0.027, which is larger than α   ( 0.05 ) . Therefore, we can reject the hypothesis and instead rejected the alternative hypothesis. In conclusion, we found that there was difference between the participants’ positive and negative responses to the two design options, which matched the results from the Wilcoxon signed-rank test.

5. Discussion

5.1. Emotion as Latent Attributes

The Post-PL built environment does receive a much higher score in all evaluation categories. The questionnaire’s results, as shown in Figure 9, show that, among the four built environment characters, architecture features correlate highest with the overall score. One potential explanation is that aesthetic physical characters or symbols in the built environment could generate a predictable pattern of emotional scripts along the dimensions of pleasantness, arousal, and power [16]. The more pleasurable experiences tend to lead to higher concentration, interest, and eventually higher productivity. This type of correlation is normally reflected in an experience where people are viewing a beautiful piece of art or a natural landscape. On the other hand, based on the available EEG data from this experimental study, we cannot conclude that a positive emotional state (brain activity) can be correlated with a higher scoring built environment evaluation. Likewise, a negative emotional state does not automatically result in negative design evaluations. Therefore, we cannot conclude or reject whether emotional state could be used as supplementary evidence to evaluate built environment quality and impact. Experiencing the built environment is a complicated cognitive process that has evolved decision-making and evaluation; it is far more complicated than “viewing beautiful objects” to stimulate pleasurable experiences and emotion. Therefore, further studies with a higher number of participants and a more fined-tuned EEG data collection could be helpful to produce statistically significant results.

5.2. Limitations

There are three main limitations we learned from this study. First, we decided to let the participants move around freely in the virtual environment to simulate real conditions. It did provide certain insights into a variety of human responses in a VR environment, but it also created difficulties in isolating particular emotional responses and correlating certain responses to a particular set of visual events. Consequently, the results were less clear and interpretable. In the second phase (currently), we are conducting the testing with both a preset moving route immersion and free-style immersion. This allows us to compare the different responses derived from the varying types of immersion. The second limitation is the number of participants. While eight participants might be sufficient for validating an approach, larger data samples could enable us to make a generalized conclusion. The third limitation is the EEG device we employed in the pilot study. Emotiv is an affordable commercial product. Its reliability has been validated by several researchers who concluded that the system has the capability to recode brain activity for the detection of various mental statuses successfully and accurately [49], and it has proven useful for measuring less reliable ERPs [50]. However, we are very aware of its limitations; Emotiv does not have much open source software and has limitations and difficulties when being converted to MATLAB programming [51]. Additionally, the algorithm that Emotiv uses to aggregate raw data is still a “black box”. In addition, the variables we examined in this study are visual variables only; other stimulus, such as smell and sound, were not included. How people experience the built environment is a complex process that is influenced by multi-dimensional variables including visual, aural, and sound stimulus, and hence the results presented in this study need to be considered with limitations.

6. Conclusions

Despite the limitations, this experimental research project has shed light on how a built environment evaluation could be combined with neuroscience. The findings from this study enable us to identify a set of research questions for the next step. Since a theoretical framework explaining the attitude and behavior toward a built environment design evaluation does not yet exist, this study employs an inductive approach and attempts to move toward such a theory. The study’s experimental results suggest that the cognitive science could be applied to the design field. Moreover, as designers can no longer rely on surveys or verbal evaluations, practitioners could utilize scientific research findings to determine optimal design solutions. The preliminary validation of the proposed evaluation method has identified discrepancies between traditional design evaluation results and emotional response indication through EEG signals. The validation and findings lay a foundation for further investigation of relations between people’s general cognitive and emotional responses in evaluating built environment quality. Even though this study did not produce conclusive results and additional experiments and data are needed for further studies, it provided insights into linking emotional responses to cognitive function during the built environment evaluation. This research also demonstrated proof of the concept of a data-driven approach that uses emotional responses as a method of built environment evaluation. This process has the potential to open new avenues for inquiry of how technology-based tools can be leveraged to influence mainstream built environment design.
The mechanisms underpinning how the built environment affects mental health and cognitive functioning are largely unexplored due to the complexity of the built environment, and the difficulty in quantifying psychological responses. A neuroscientific approach has the capacity to bridge this gap. This project developed and tested a neuroimaging experimental protocol, combined with VR technology, as a quantitative, repeatable framework that, if further developed and tested, can be readily adopted by researchers in a wide variety of social science and design fields. This proposed approach provided a unique new utility to three (separately) validated methodologies by combining (1) EEG with an emerging design technology and (2) VR to overcome the dual problems of confounding variables and participant bias during the measurement of elicited user responses to built environment features in real time. VR allows three-dimensional, systematic design manipulations that are prohibitively expensive in real environments and EEG offers validated inferences regarding cognitive and affective processing. The proposed approach also combined (3) continuous EEG approaches with neuroimaging to understand occupants’ emotional responses. In the future research, we hope to work with a large dataset, collecting data from 50–100 participants in order to further advance our understanding of how the built environment positively or negatively affects occupants’ psychological and physiological responses. We hope the in-depth understanding of mechanisms driving occupant behavioral differences between Pre-PL and Post-PL virtual environments will provide designers and engineers evidence to change, modify, and propose new design solutions pre-build. The integration of neuroscientific validated evidence in the design process may lead to a novel and impactful design framework for building industry adoption.

Supplementary Materials

The following are available online at https://www.mdpi.com/2413-8851/4/4/48/s1, Figure S1: title, Table S1: title, Video S1: title.

Author Contributions

The study design was by M.H. and J.R., and data was implemented and collected by M.H., and analysed by M.H., J.R. and M.H. contributed to secure the funding. J.R. contributed to the overall planning of the project, M.H. was responsible for interpreting the data as well as the main draft of the manuscript. All authors were involved in critically revising the manuscript. All authors have read and agreed to the published version of the manuscript.

Funding

This work was supported by the University of Maryland, Tier 1 award.

Conflicts of Interest

The authors declare no conflict of interest.

References

  1. Aries, M.B.; Aarts, M.; Van Hoof, J. Daylight and health: A review of the evidence and consequences for the built environment. Light. Res. Technol. 2013, 47, 6–27. [Google Scholar] [CrossRef]
  2. Eyles, J.; Baxter, J. Environments, Risks and Health; Routledge: London, UK, 2016. [Google Scholar]
  3. Burton, E.J.; Mitchell, L.; Stride, C.B. Good places for ageing in place: Development of objective built environment measures for investigating links with older people’s wellbeing. BMC Public Health 2011, 11, 839. [Google Scholar] [CrossRef] [PubMed] [Green Version]
  4. Shanahan, D.F.; Fuller, R.A.; Bush, R.; Lin, B.B.; Gaston, K.J. The Health Benefits of Urban Nature: How Much Do We Need? BioScience 2015, 65, 476–485. [Google Scholar] [CrossRef] [Green Version]
  5. Brownson, R.C.; Baker, E.A.; Deshpande, A.D.; Gillespie, K.N. Evidence-Based Public Health; Oxford University Press: Oxford, UK, 2017. [Google Scholar]
  6. Stevenson, M.; Thompson, J.; De Sá, T.H.; Ewing, R.; Mohan, D.; McClure, R.J.; Roberts, I.; Tiwari, G.; Giles-Corti, B.; Sun, X.; et al. Land use, transport, and population health: Estimating the health benefits of compact cities. Lancet 2016, 388, 2925–2935. [Google Scholar] [CrossRef] [Green Version]
  7. Wei, Y.D.; Xiao, W.; Wen, M.; Wei, R. Walkability, Land Use and Physical Activity. Sustainability 2016, 8, 65. [Google Scholar] [CrossRef] [Green Version]
  8. Jackson, R.J.; Dannenberg, A.L.; Frumkin, H. Health and the Built Environment: 10 Years After. Am. J. Public Health 2013, 103, 1542–1544. [Google Scholar] [CrossRef] [PubMed]
  9. Larice, M.; Macdonald, E. The Urban Design Reader; Larice, M., Macdonald, E., Eds.; Routledge: London, UK, 2012. [Google Scholar]
  10. Koohsari, M.J.; Badland, H.; Giles-Corti, B. (Re)Designing the built environment to support physical activity: Bringing public health back into urban design and planning. Cities 2013, 35, 294–298. [Google Scholar] [CrossRef]
  11. Marsella, S.; Gratch, J. Computationally modeling human emotion. Commun. ACM 2014, 57, 56–67. [Google Scholar] [CrossRef]
  12. Farr, O.M.; Li, C.-S.R.; Mantzoros, C.S. Central nervous system regulation of eating: Insights from human brain imaging. Metabolism 2016, 65, 699–713. [Google Scholar] [CrossRef] [Green Version]
  13. Balters, S.; Steinert, M. Capturing emotion reactivity through physiology measurement as a foundation for affective engineering in engineering design science and engineering practices. J. Intell. Manuf. 2015, 28, 1585–1607. [Google Scholar] [CrossRef] [Green Version]
  14. Mehrabian, A.; Russell, J.A. An Approach to Environmental Psychology; MIT Press: Cambridge, MA, USA, 2017. [Google Scholar]
  15. Duncan, E.H. Environmental Aesthetics: Theory, Research, and Applications; Nasar, J.L., Ed.; Cambridge University Press: Cambridge, MA, USA, 1992. [Google Scholar]
  16. Pullman, M.E.; Gross, M.A. Ability of Experience Design Elements to Elicit Emotions and Loyalty Behaviors. Decis. Sci. 2004, 35, 551–578. [Google Scholar] [CrossRef]
  17. Seitamaa-Hakkarainen, P.; Huotilainen, M.; Mäkelä, M.; Groth, C.; Hakkarainen, K. The promise of cognitive neuroscience in design studies. In Proceedings of the Design Research Society 2014 Conference, Umeå, Sweden, 16–19 June 2014; pp. 834–846. [Google Scholar]
  18. Ulrich, R.S. Natural Versus Urban Scenes: Some psychophysiological effects. Environ. Behav. 1981, 13, 523–556. [Google Scholar] [CrossRef]
  19. Hu, W.-L.; Booth, J.; Reid, T.N. The Relationship Between Design Outcomes and Mental States During Ideation. J. Mech. Des. 2017, 139, 051101. [Google Scholar] [CrossRef] [Green Version]
  20. Nguyen, T.A.; Zeng, Y. A physiological study of relationship between designer’s mental effort and mental stress during conceptual design. Computer-Aided. Des. 2014, 54, 3–18. [Google Scholar] [CrossRef]
  21. Roe, J.J.; Aspinall, P.A.; Mavros, P.; Coyne, R. Engaging the brain: The impact of natural versus urban scenes using novel EEG methods in an experimental setting. Environ. Sci. 2013, 1, 93–104. [Google Scholar] [CrossRef] [Green Version]
  22. Milgram, P.; Kishino, F. A taxonomy of mixed reality visual displays. IEICE Trans. Infor.Syst. 1994, 77, 1321–1329. [Google Scholar]
  23. Stouffs, R.; Janssen, P.; Roudavski, S.; Tunçer, B. What is happening to virtual and augmented reality applied to architecture? In Proceedings of the Conference on Computer-Aided Architectural Design Research in Asia (CAADRIA 2013), Singapore, 15–18 May 2013; Volume 1, p. 10. [Google Scholar]
  24. Milovanovic, J.; Moreau, G.; Siret, D.; Miguet, F. Virtual and augmented reality in architectural design and education. In Proceedings of the 17th International Conference Future Trajectories of Computation in Design, CAAD Futures, Istanbul, Turkey, 12–14 July 2017. [Google Scholar]
  25. Marín-Morales, J.; Higuera-Trujillo, J.L.; Greco, A.; Guixeres, J.; Llinares, C.; Scilingo, E.P.; Alcañiz, M.; Valenza, G. Affective computing in virtual reality: Emotion recognition from brain and heartbeat dynamics using wearable sensors. Sci. Rep. 2018, 8, 1–5. [Google Scholar] [CrossRef]
  26. Kotseruba, I.; Tsotsos, J.K. 40 years of cognitive architectures: Core cognitive abilities and practical applications. Artif. Intell. Rev. 2018, 53, 17–94. [Google Scholar] [CrossRef] [Green Version]
  27. Lieto, A.; Bhatt, M.; Oltramari, A.; Vernon, D. The role of cognitive architectures in general artificial intelligence. Cogn. Syst. Res. 2018, 48, 1–3. [Google Scholar] [CrossRef] [Green Version]
  28. Bertolero, M.A.; Yeo, B.T.T.; D’Esposito, M. The modular and integrative functional architecture of the human brain. Proc. Natl. Acad. Sci. USA 2015, 112, E6798–E6807. [Google Scholar] [CrossRef] [Green Version]
  29. Anderson, J.R.; Lebiere, C. The Newell Test for a theory of cognition. Behav. Brain Sci. 2003, 26, 587–601. [Google Scholar] [CrossRef] [PubMed]
  30. Langley, P. Progress and Challenges in Research on Cognitive Architectures. In Proceedings of the Thirty-First AAAI Conference on Artificial Intelligence, San Francisco, CA, USA, 4–9 February 2017; pp. 4870–4876. [Google Scholar]
  31. Sweller, J.; Van Merriënboer, J.J.; Paas, F. Cognitive Architecture and Instructional Design. Educ. Psychol. Rev. 1998, 10, 251–296. [Google Scholar] [CrossRef]
  32. Koć-Januchta, M.M.; Höffler, T.N.; Thoma, G.-B.; Prechtl, H.; Leutner, D. Visualizers versus verbalizers: Effects of cognitive style on learning with texts and pictures–An eye-tracking study. Comput. Hum. Behav. 2017, 68, 170–179. [Google Scholar] [CrossRef] [Green Version]
  33. Stea, D. Image and Environment: Cognitive Mapping and Spatial Behavior; Transaction Publishers: Piscataway, NJ, USA, 2017. [Google Scholar]
  34. Oliveira, A.S.; Schlink, B.R.; Hairston, W.D.; König, P.; Ferris, D.P. Induction and separation of motion artifacts in EEG data using a mobile phantom head device. J. Neural Eng. 2016, 13, 036014. [Google Scholar] [CrossRef] [PubMed]
  35. Chersi, F.; Burgess, N. The Cognitive Architecture of Spatial Navigation: Hippocampal and Striatal Contributions. Neuron 2015, 88, 64–77. [Google Scholar] [CrossRef] [PubMed] [Green Version]
  36. Kirsch, A. A unifying computational model of decision making. Cogn. Process. 2019, 20, 243–259. [Google Scholar] [CrossRef] [Green Version]
  37. Bhatt, M.; Suchan, J.; Schultz, C.P.; Kondyli, V.; Goyal, S. Artificial Intelligence for Predictive and Evidence Based Architecture Design. In Proceedings of the Thirtieth AAAI Conference on Artificial Intelligence (AAAI-16), Phoenix, AZ, USA, 12–17 February 2016; pp. 4349–4350. [Google Scholar]
  38. Zeng, M.; Nguyen, L.T.; Yu, B.; Mengshoel, O.J.; Zhu, J.; Wu, P.; Zhang, Y. Convolutional Neural Networks for Human Activity Recognition using Mobile Sensors. In Proceedings of the 6th International Conference on Mobile Computing, Applications and Services, Austin, TX, USA, 6–7 November 2014; pp. 197–205. [Google Scholar]
  39. Vijayalakshmi, K.; Sridhar, S.; Khanwani, P. Estimation of effects of alpha music on EEG components by time and frequency domain analysis. In Proceedings of the International Conference on Computer and Communication Engineering (ICCCE’10), Kuala Lumpur, Malaysia, 11–12 May 2010; pp. 1–5. [Google Scholar]
  40. Vallabhaneni, M.; Baldassari, L.E.; Scribner, J.T.; Cho, Y.W.; Motamedi, G.K. A case–control study of wicket spikes using video-EEG monitoring. Seizure 2013, 22, 14–19. [Google Scholar] [CrossRef] [PubMed] [Green Version]
  41. Larson, M.J.; Carbine, K.A. Sample size calculations in human electrophysiology (EEG and ERP) studies: A systematic review and recommendations for increased rigor. Int. J. Psychophysiol. 2017, 111, 33–41. [Google Scholar] [CrossRef]
  42. Siegel, S. Nonparametric statistics. Am. Stat. 1957, 11, 13–19. [Google Scholar]
  43. Xiao, D.Y. Experiencing the library in a panorama virtual reality environment. Libr. Hi Tech. 2000, 18, 177–184. [Google Scholar] [CrossRef]
  44. Aspinall, P.; Mavros, P.; Coyne, R.; Roe, J. The urban brain: Analysing outdoor physical activity with mobile EEG. Br. J. Sports Med. 2013, 49, 272–276. [Google Scholar] [CrossRef] [PubMed] [Green Version]
  45. Neale, C.; Aspinall, P.; Roe, J.; Tilley, S.; Mavros, P.; Cinderby, S.; Coyne, R.; Thin, N.; Bennett, G.; Thompson, C.W. The Aging Urban Brain: Analyzing Outdoor Physical Activity Using the Emotiv Affectiv Suite in Older People. J. Urban Health 2017, 94, 869–880. [Google Scholar] [CrossRef] [PubMed] [Green Version]
  46. Ramirez, R.; Vamvakousis, Z. Detecting Emotion from EEG Signals Using the Emotive Epoc Device. In Proceedings of the Human-Computer Interaction, Macau, China, 4–7 December 2012; Applications and Services. Springer: Berlin, Germnay, 2012; pp. 175–184. [Google Scholar]
  47. Hollander, J.; Foster, V. Brain responses to architecture and planning: A preliminary neuro-assessment of the pedestrian experience in Boston, Massachusetts. Arch. Sci. Rev. 2016, 59, 474–481. [Google Scholar] [CrossRef]
  48. Ackerman, S. Discovering the Brain; National Academies Press: Washington, DC, USA, 1992. [Google Scholar]
  49. Harrison, T. The Emotiv Mind: Investigating the Accuracy of the Emotiv EPOC in Identifying Emotions and Its Use in an Intelligent Tutoring System. Ph.D. Thesis, University of Canterbury, Christchurch, NZ, USA, 2013. [Google Scholar]
  50. Badcock, N.A.; Mousikou, P.; Mahajan, Y.; De Lissa, P.; Thie, J.; McArthur, G.M. Validation of the Emotiv EPOC®EEG gaming system for measuring research quality auditory ERPs. Peer J. 2013, 1, e38. [Google Scholar] [CrossRef] [PubMed] [Green Version]
  51. Liu, Y.; Jiang, X.; Cao, T.; Wan, F.; Mak, P.U.; Mak, P.-I.; Vai, M.I. Implementation of SSVEP based BCI with Emotiv EPOC. In Proceedings of the 2012 IEEE International Conference on Virtual Environments Human-Computer Interfaces and Measurement Systems (VECIMS) Proceedings, Tianjin, China, 2–4 July 2012; pp. 34–37. [Google Scholar]
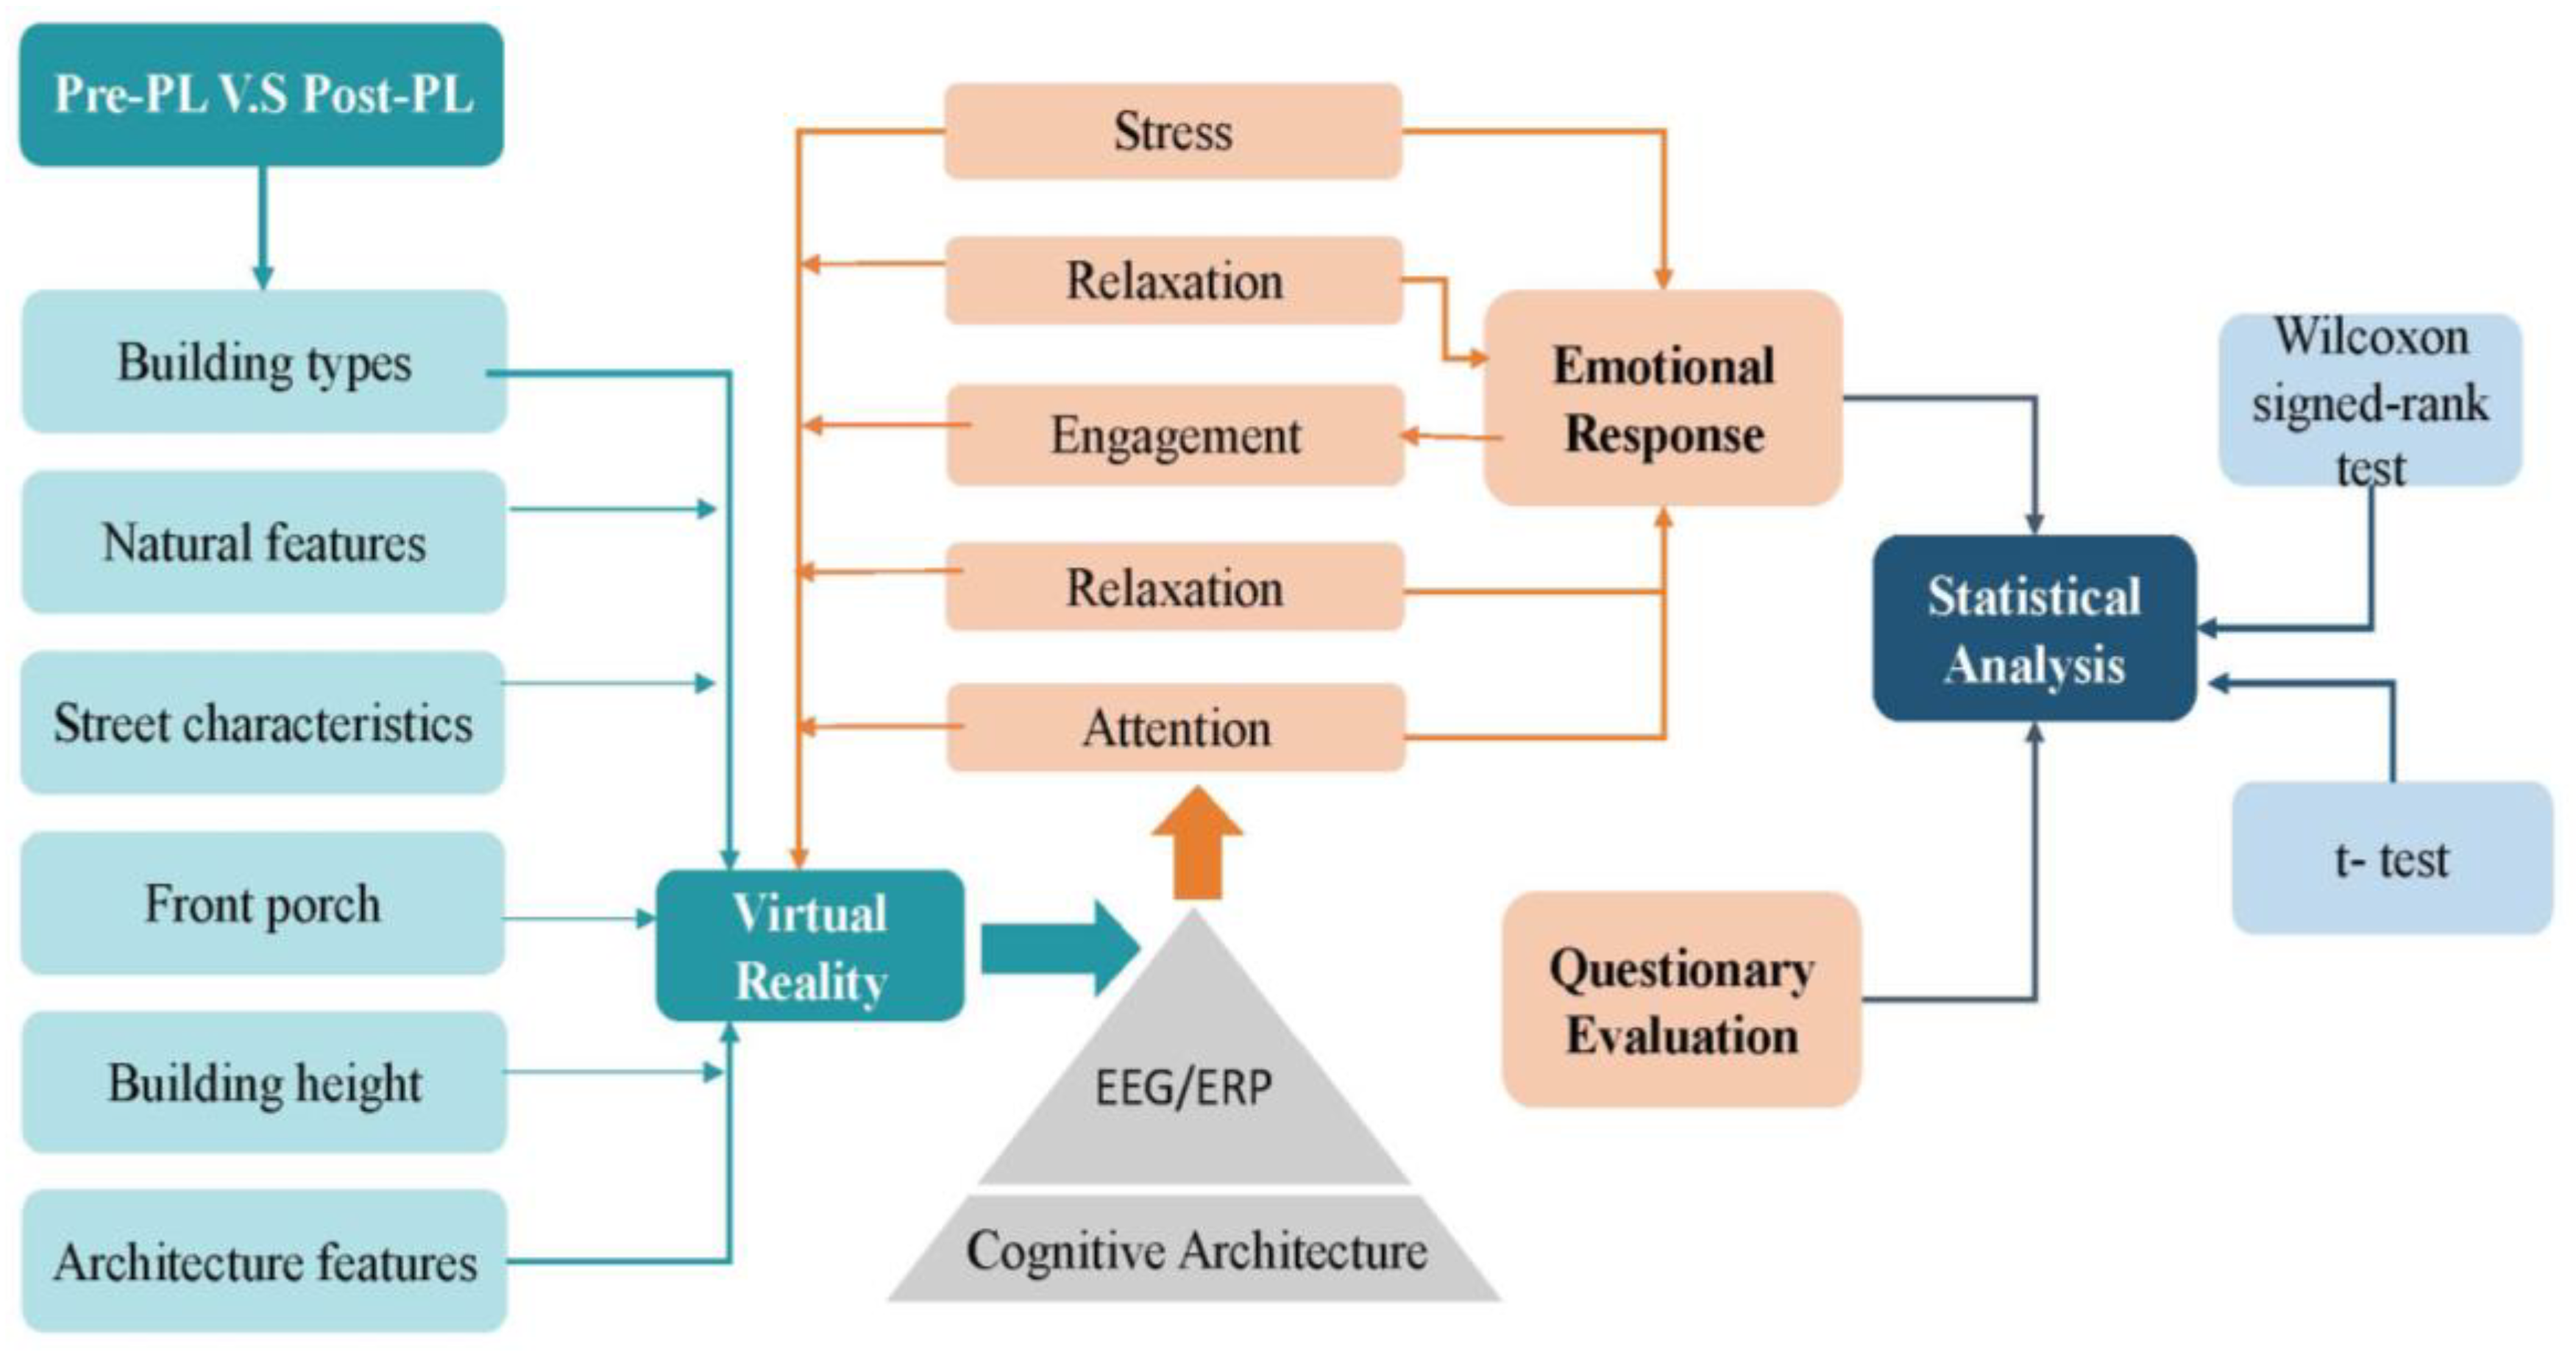
Figure 1. Research methodology based on event-related potential (ERP) and cognitive architecture (CA) using a combination of virtual reality (VR) and electroencephalography (EEG) (by authors).
Urbansci 04 00048 g001
Figure 2. Site location and segments (by authors).
Urbansci 04 00048 g002
Figure 3. Pre-PL condition (by authors).
Urbansci 04 00048 g003
Figure 4. Post-PL condition (by authors).
Urbansci 04 00048 g004
Figure 5. Pre-PL condition (by authors).
Urbansci 04 00048 g005
Figure 6. Post-PL condition (by authors).
Urbansci 04 00048 g006
Figure 7. (a) VR headset and set up (by authors); (b) EEG headset (by authors).
Urbansci 04 00048 g007
Figure 8. Final emotional score of one immersion (by authors).
Urbansci 04 00048 g008
Figure 9. Final emotional score of one immersion.
Urbansci 04 00048 g009
Figure 10. Emotional state score from the EEG recording.
Urbansci 04 00048 g010
Table 1. Wilcoxon matched pairs signed-rank tests for responses to Pre-PL and Post-PL.
Time StepPre-PLPost-PLDifference Positive[Diff]RankSigned Rankα = 0.05
Response 10.7600.0470.7110.7188
Response 20.3770.636−0.26−10.265−5
Response 30.7250.6570.0710.0711
Response 40.8710.4720.4010.4066
Response 50.8860.4180.4710.4777
Response 60.4410.650−0.21−10.214−4
Response 70.3360.1690.1710.1722
Response 80.3230.1480.1810.1833
27Positive sum
−9Negative sum
27Test statistic (W)