Abstract
By the year 2020, 90% of the population with access to electricity worldwide was surpassed. However, the reality is very different for many countries, especially for those on the African continent that had more than 572 million people without electricity service at the end of 2019. This work studies the implementation of an isolated microgrid activated with photovoltaic energy and energy storage in batteries under the case study of the community of Bigene, located in the African country of Guinea-Bissau. This type of project is a potential solution to the problem of access to energy, but as the cost of the energy storage system is typically very high, this work technically and economically addresses the effect of using absorbed glass material (AGM) and lithium batteries. A simulator was developed using TRNSYS software to analyze the operation of the microgrid under a defined annual demand profile for different types of users, and economic analysis was conducted considering a project lifetime of 25 years. The results showed no significant differences in the solar fraction of both types of batteries when the photovoltaic power was less than 600 kW, regardless of the capacity of the storage bank. The analysis of auxiliary power requirements showed that lithium technology leads to a lower consumption from 800 kW of PV capacity, and utilizing less than this capacity did not have a significant difference with AGM batteries. In this microgrid with a photovoltaic capacity of less than 700 kW and an energy storage of less than 2580 kWh, the type of storage technology, AGM or lithium, did not represent a considerable difference in the levelized cost of energy, indicating that AGM technology could be selected considering its low initial investment cost compared to lithium batteries.
1. Introduction
Bringing electricity service to all regions of the world that need it is a major challenge. Despite a global electricity access rate of 90.5% by 2020 [1], there are countries with very low values, most of which are located on the African continent. The Sub-Saharan African countries presented in the same year has an average access to electricity of 48.4%, in contrast to 100% of the countries in the European Union. This becomes an issue of vital importance, in which the efforts of public and private institutions must contribute with new projects and technologies seeking to reduce this huge gap that is access to basic electricity services sustainably.
Different strategies have been implemented to bring electricity to the entire population. In most cases, it had been decided to extend the transmission lines to carry the energy from the large generation centers to each consumer. However, sometimes the remoteness of the consumption centers made it impossible to extend the grid due to economical reasons. In addition, in other cases, the geographical location of the users, such as in mountains or difficult access areas, made it technically impossible to install transmission lines. To solve this problem, it was proposed to bring generators to the consumption centers so that the energy would be produced in the same place as the user, eliminating both the costs and energy losses related to the extension of the electric grid. Based on these strategies, the microgrid model was initiated. A microgrid can be composed of different generators, including renewable energies, promoting sustainable decentralized electrification. In the past, due to the low cost of fossil fuels, it was common practice to install an electric power generator based on diesel or gasoline combustion. However, nowadays, due to the problems of environmental pollution and climate change seeking to move towards energy-sustainable development, traditional generators have been largely replaced by generators based on renewable energies. This allows the electricity produced in the consumption centers to come from a clean and free source, taking advantage of the natural resources present in the region. This, together with the lower costs of renewable technologies, makes it an economically and sustainably attractive option for rural electrification [2].
Several rural electrification projects have been developed under the concept of the community microgrid, which has been defined as a system that “(…) is connected with its community through physical placement and can be owned by said community or other part” [3], using renewable energies as the main driving force. In Puertecitos, Baja California, Mexico, an isolated microgrid was installed in a fishing community with a high level of social marginalization [4,5]. This system was sized to meet basic needs, such as food preservation, comfort, and education. Due to the extreme climatic conditions, where summers are very hot and winters consist of low temperatures, the electricity demand profile contrasts the year’s different seasons. A 55 kW photovoltaic (PV) module system, a 5 kW wind turbine, a 75 kVA diesel generator as an auxiliary, and a 522 kWh lead–acid battery energy storage system (ESS) were all chosen. However, as the microgrid is not able to fully meet the demand during the summer when air conditioning equipment is needed, the diesel generator is instead used for short periods, which while during the winter is a large amount of wasted energy. In Huatacondo, in the Atacama Desert, Chile, a microgrid isolated from the power transmission system was installed to continuously provide electricity service for 24 h [6]. This system incorporated 22.5 kW of PV technology, 3 kW of wind power, a 140 kWh battery bank, and a 120 kVA diesel generator. In contrast, another microgrid installed in Chile, in the town of Ollagüe in the Antofagasta region, incorporated 200 kW PV power, 30 kW of wind energy, 410 kVA of diesel generation, 752 kWh of EES, and two parabolic dish solar collectors to provide hot water for the local school [6]. In many regions of the world, low-capacity microgrids have been installed for rural electrification using renewable energies as a basis to improve the living conditions of the marginalized communities [7,8,9].
Rangel et al. [10] presented a cost optimization model, which focused on generator performance in isolated microgrids based on diesel, photovoltaic, and battery generators. Their study took the Lindi region of Tanzania as a case study, and they used their optimization model seeking to reduce the operating costs and environmental impact of this type of system. For three scenarios: high, medium, and low electricity demand, they found that each scenario was able to consider a unique set of diesel generators, and the correct selection of this was deemed as a function of the photovoltaic and battery storage capacity. They presented levelized cost of energy (LCOEs) of £0.43/kWh, £0.42/kWh, and £0.45/kWh, for the high, medium, and low electricity demand scenarios, respectively. For their part, Khawaja et al. [11] proposed a cost-based framework for determining the optimal size and energy management of standalone microgrids using reinforcement learning. They defined the framework in two stages, where the first stage established the best PV generation capacity and energy storage based on a model to obtain the minimum LCOE. The second stage focused on the energy management strategy for the microgrid using reinforcement learning to provide optimum cost savings. Their results showed an operational improvement of the microgrid, decreasing up to 22% of the working hours of the diesel generator, increasing up to 6% of the photovoltaic utilization, and reducing 11% of the LCOE, going from 0.188 $/kWh to 0.167 $/kWh, respectively.
Nallolla and Perumal [12] used HOMER software to study a hybrid microgrid composed of a photovoltaic system, wind turbine, diesel generator, battery storage, and an electrolyzer, aiming for techno-economic optimization by analyzing different generation and storage capacities. Under the case study of a village in Chittoor, Andhra Pradesh, India, the best design resulted in a minimum net present cost of $7.01 M and an LCOE of $0.244/kWh, respectively. Using the same software, Kumar and Channi [13] assessed an off-grid microgrid composed of a photovoltaic system and a biomass-based generator for a community of 770 conventional houses in a residential area in the rural region of Punjab, India. This microgrid was characterized by only being composed of renewable energies and used a battery bank for storage. Based on the energy potential of the region, the optimal configuration of the photovoltaic and biomass generation was defined, and energy costs of 0.362 $/kWh were achieved as a result. Tarife et al. [14] performed microgrid optimization for rural agricultural areas in the Philippines, finding LCOEs of up to 0.179 USD/kWh. Seeking to increase electricity access in the Philippines, Castro et al. [15] studied the technical and economic feasibility of installing microgrids based on renewable energy on 634 off-grid islands. They found that government subsidies for microgrids on smaller islands were of the utmost importance, while the private sector should focus on the larger islands.
Thomas et al. [16] assessed different configurations of isolated microgrids, aiming to examine the technical and economic feasibility of a high penetration of renewable sources in power generation. Their results showed that the scenario with the lowest LCOE, 0.1658 €/kWh, produced the most pollution due to the higher capacity of the diesel generator compared to the renewables. When a system based 100% on solar, wind, and battery storage was studied, it resulted in an LCOE of 0.61 €/kWh. In another study that sought to analyze the technical and economic feasibility of isolated microgrids based on renewable energies on a university campus, Shirzadi et al. [17] found that the integration of renewable energies with some grid backup can reduce the LCOE by up to half the price of the electricity that the university typically buys from the grid, mainly due to the high cost of the battery energy storage system. Moreover, different techno-economic studies of isolated microgrids based on renewable energies with similar results can be found in the literature [18,19].
The high cost of isolated microgrids remains an impediment to their implementation in poor communities [20]. In most scenarios, the main factor is the initial investment cost of the ESS. For example, a rural microgrid on the small island of Koh Jik in Thailand was redesigned, proposing to replace the lead–acid battery bank with lithium technology. The results showed that considering lithium batteries improves almost all aspects operationally, but the initial investment cost issue increased, therefore making it economically more attractive to continue with less sustainable technology, such as lead–acid batteries [21]. For their part, Kumar and Saini [22] analyzed three types of batteries for consideration within isolated microgrids, with Ni–Fe battery-based batteries being found to be the most economically attractive with a levelized cost of energy (LCOE) of 0.217 $/kWh. Therefore, the correct sizing of the equipment is of great importance during planning.
This work presents the energy and economic analysis for implementing a microgrid for the isolated community of Bigene, Guinea-Bissau, an African country with a high rate of social marginalization. The microgrid was based on the use of renewable technologies and an ESS using batteries. To offer the best cost-benefit ratio and considering that the ESS is critical to both technical and economic feasibility, a comparative study was conducted using absorbed glass material (AGM) and lithium batteries. An auxiliary power generation system was also considered for periods for when there was no stored energy. The study includes the analysis of the generation-storage capacity relationship and its effect on variables, such as solar fraction (SF), auxiliary energy (AuxE) requirements, energy loss, and LCOE. With the above, it was intended to establish the criteria for decision-making regarding the capacity of the system to be installed.
2. System Description
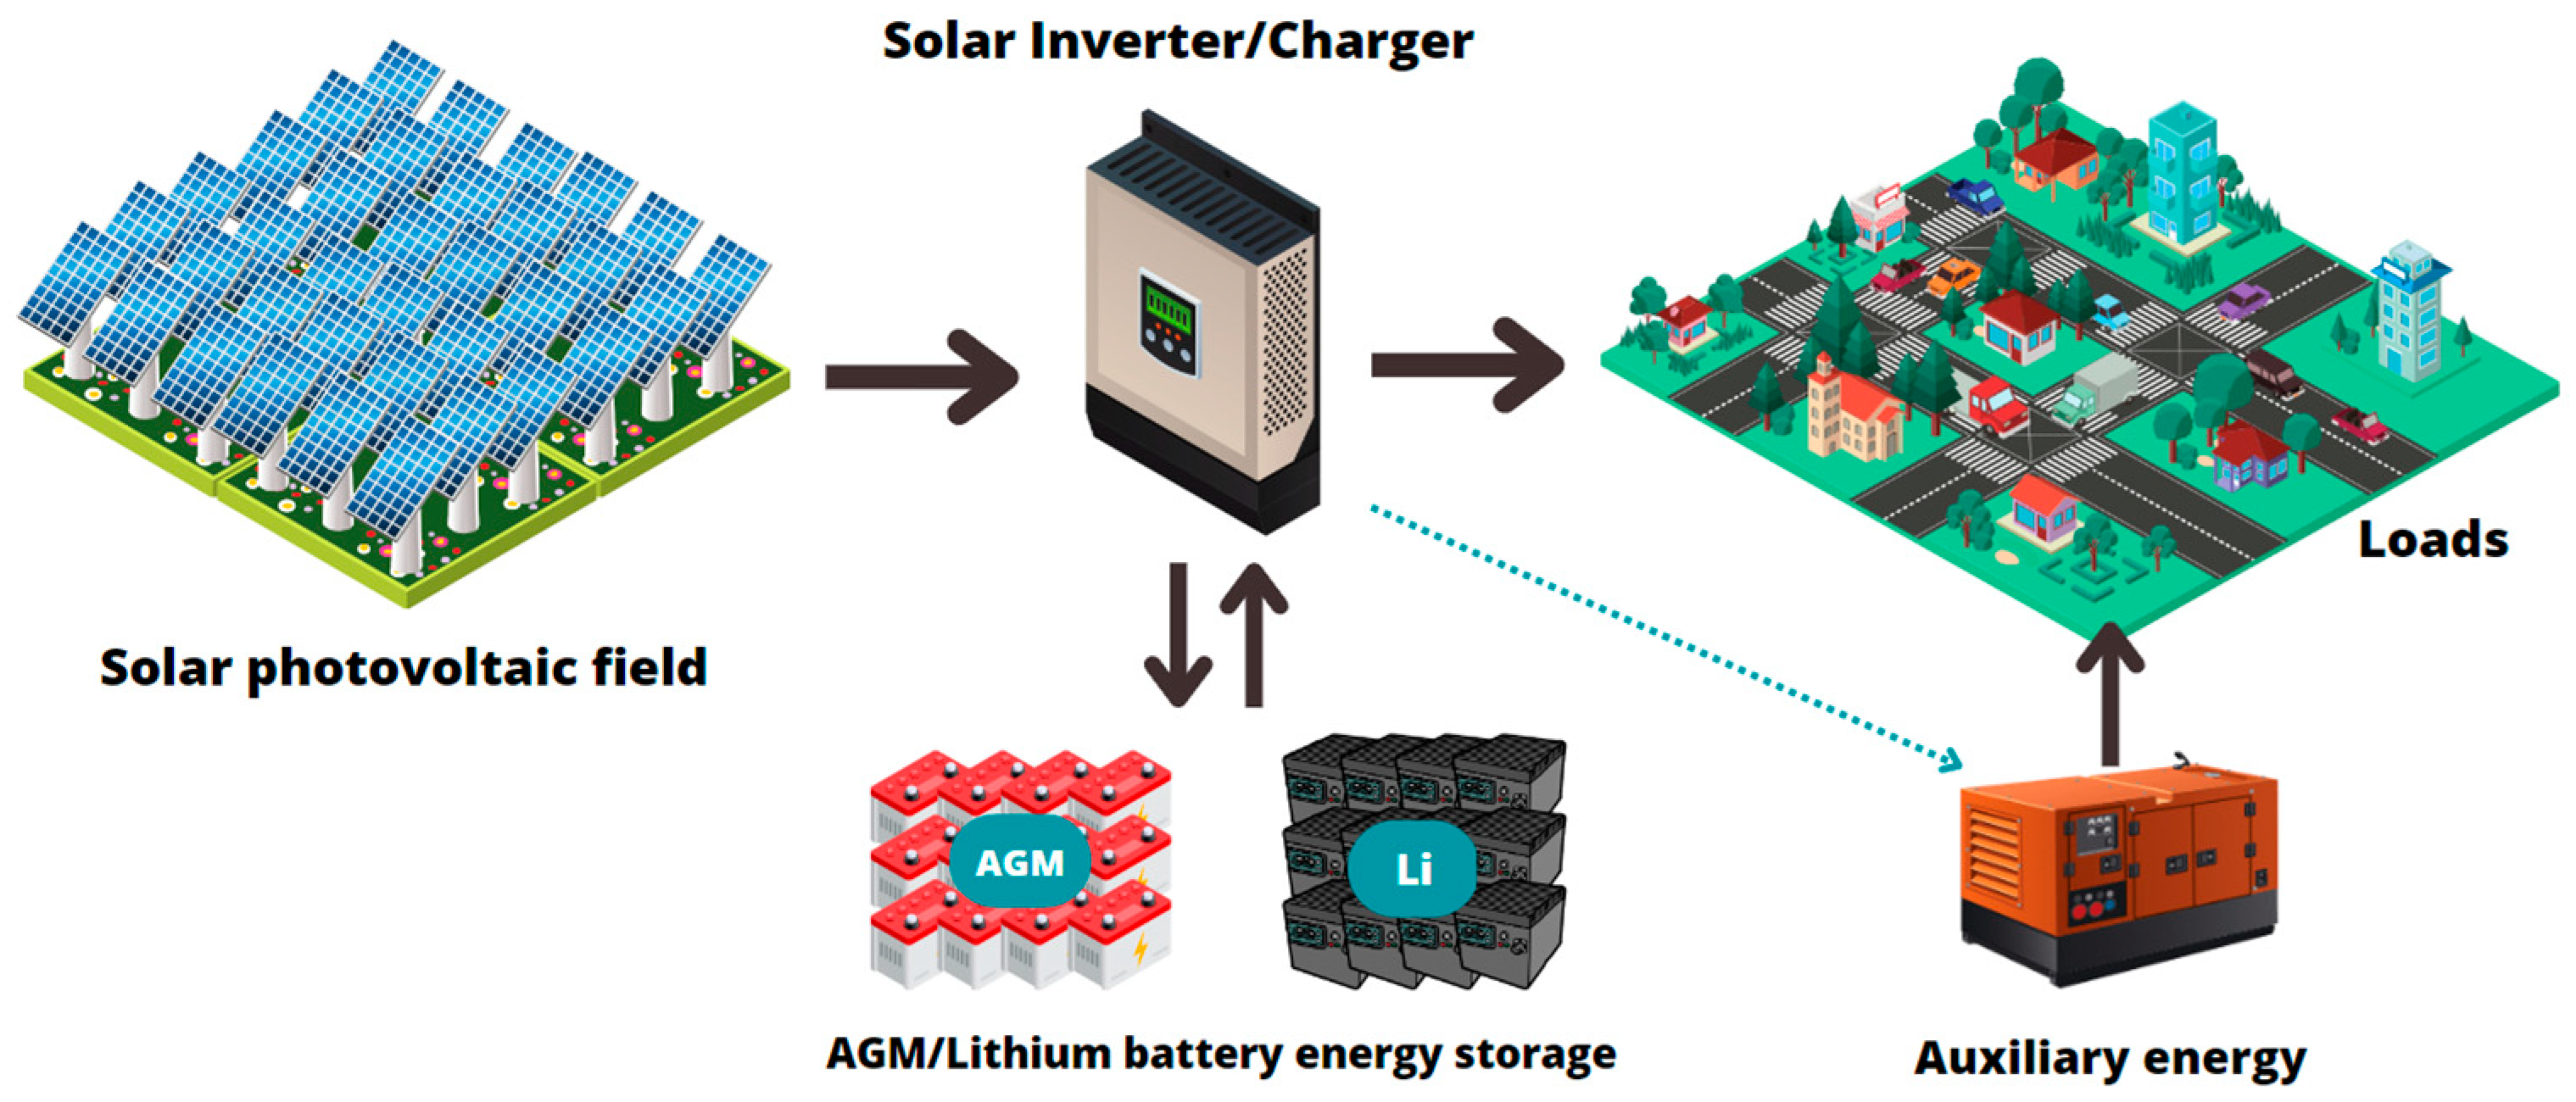
Figure 1 shows the schematic diagram of the off-grid PV system with an ESS with AGM or lithium batteries. The field of PV modules is responsible for converting the solar radiation incident on them into electrical energy. This energy is then transmitted to an inverter/charger which converts the electricity from direct current to alternating current to meet the energy demands of the different users. Depending on the demand conditions and the availability of the solar resource, part of the electrical energy generated by the PV field can be stored in a bank of AGM or lithium batteries to be used later in conditions of high demand and/or low-to-no solar radiation. The inverter/charger is responsible for deciding the energy output. If the electrical energy production of the PV field is not sufficient to satisfy the demand and there is not enough energy in the battery bank, an auxiliary electrical generator is then considered, which receives the signal from the inverter/charger of the lacking energy to be supplied.

Figure 1.
Schematic diagram of the PV system with an AGM/Lithium battery ESS.
Commercially available energy generation and storage technologies were considered for this analysis and are shown in Table 1. Trojan AGM batteries deliver approximately 1750 cycles at 50% depth of discharge (DoD), while Growatt lithium batteries deliver over 6000 cycles at 10% DoD, respectively. Inverter/charger efficiencies were considered based on those presented by the most commercially available equipment, being conservative with this value.

Table 1.
Characteristics of the technologies considered in the study.
3. Methodology
For the development of this research, TRNSYS 17 [23] software was used to simulate the operating behavior of the solar system with battery storage, taking into consideration the variables that affected the performance, such as weather conditions and energy demand. TRNSYS 17 allows using different blocks programmed with the validated mathematical models of a variety of equipment, technologies, and processes termed “types”, to develop an energy system according to the user’s needs and to study its operation transiently. This program has the peculiarity in that it can use climatological databases that are typical of the selected locations to operationally study the systems under more realistic conditions. The characteristics of the technologies considered in this study, as shown in Table 1, were declared as parameters in the different simulation types. Table 2 shows the different types used in the microgrid simulator.
Table 2.
Types used in the simulation in TRNSYS software.
For the simulation process, a climatological database of the case study region was considered. This database contains information on variables such as solar radiation, ambient temperature, and wind speed, among others, which are used by the type of the photovoltaic system to calculate the production of electricity generation based on the hourly conditions. The electrical energy produced is then used to meet the demands of the case study and/or be stored in the ESS by means of a decision made by the type 48 (inverter/charger). The electrical transmission network is represented by type 188, and it is through this network that the energy flows from the PV generators and/or ESS to the demand. Type 120 represents the auxiliary generator to satisfy the demands of the case study in the event that there was not enough energy production and/or storage. The simulation of the microgrid was conducted on an hourly basis throughout the year using typical annual weather data. The results of the simulation in TRNSYS show the energy production and electric power of the different generators, hourly energy demand by the case study, and amount of energy wasted and stored/extracted from the ESS, among other information.
3.1. Case Study: Isolated Community in Bigene, Guinea-Bissau
Bigene is a community within the Cacheu region of the African country Guinea-Bissau (12°26′24″ N, 15°32′30″ W). It is a community that lacks the basic services of electric power and drinking water, thus presenting a high social marginalization. In this scenario, an electric microgrid based on renewable energies, with ESS in batteries and with an auxiliary electric generation system, is an excellent opportunity to improve the living conditions of the population, providing access to health and education services, productive activities, food preservation, comfort, and entertainment [5,24].
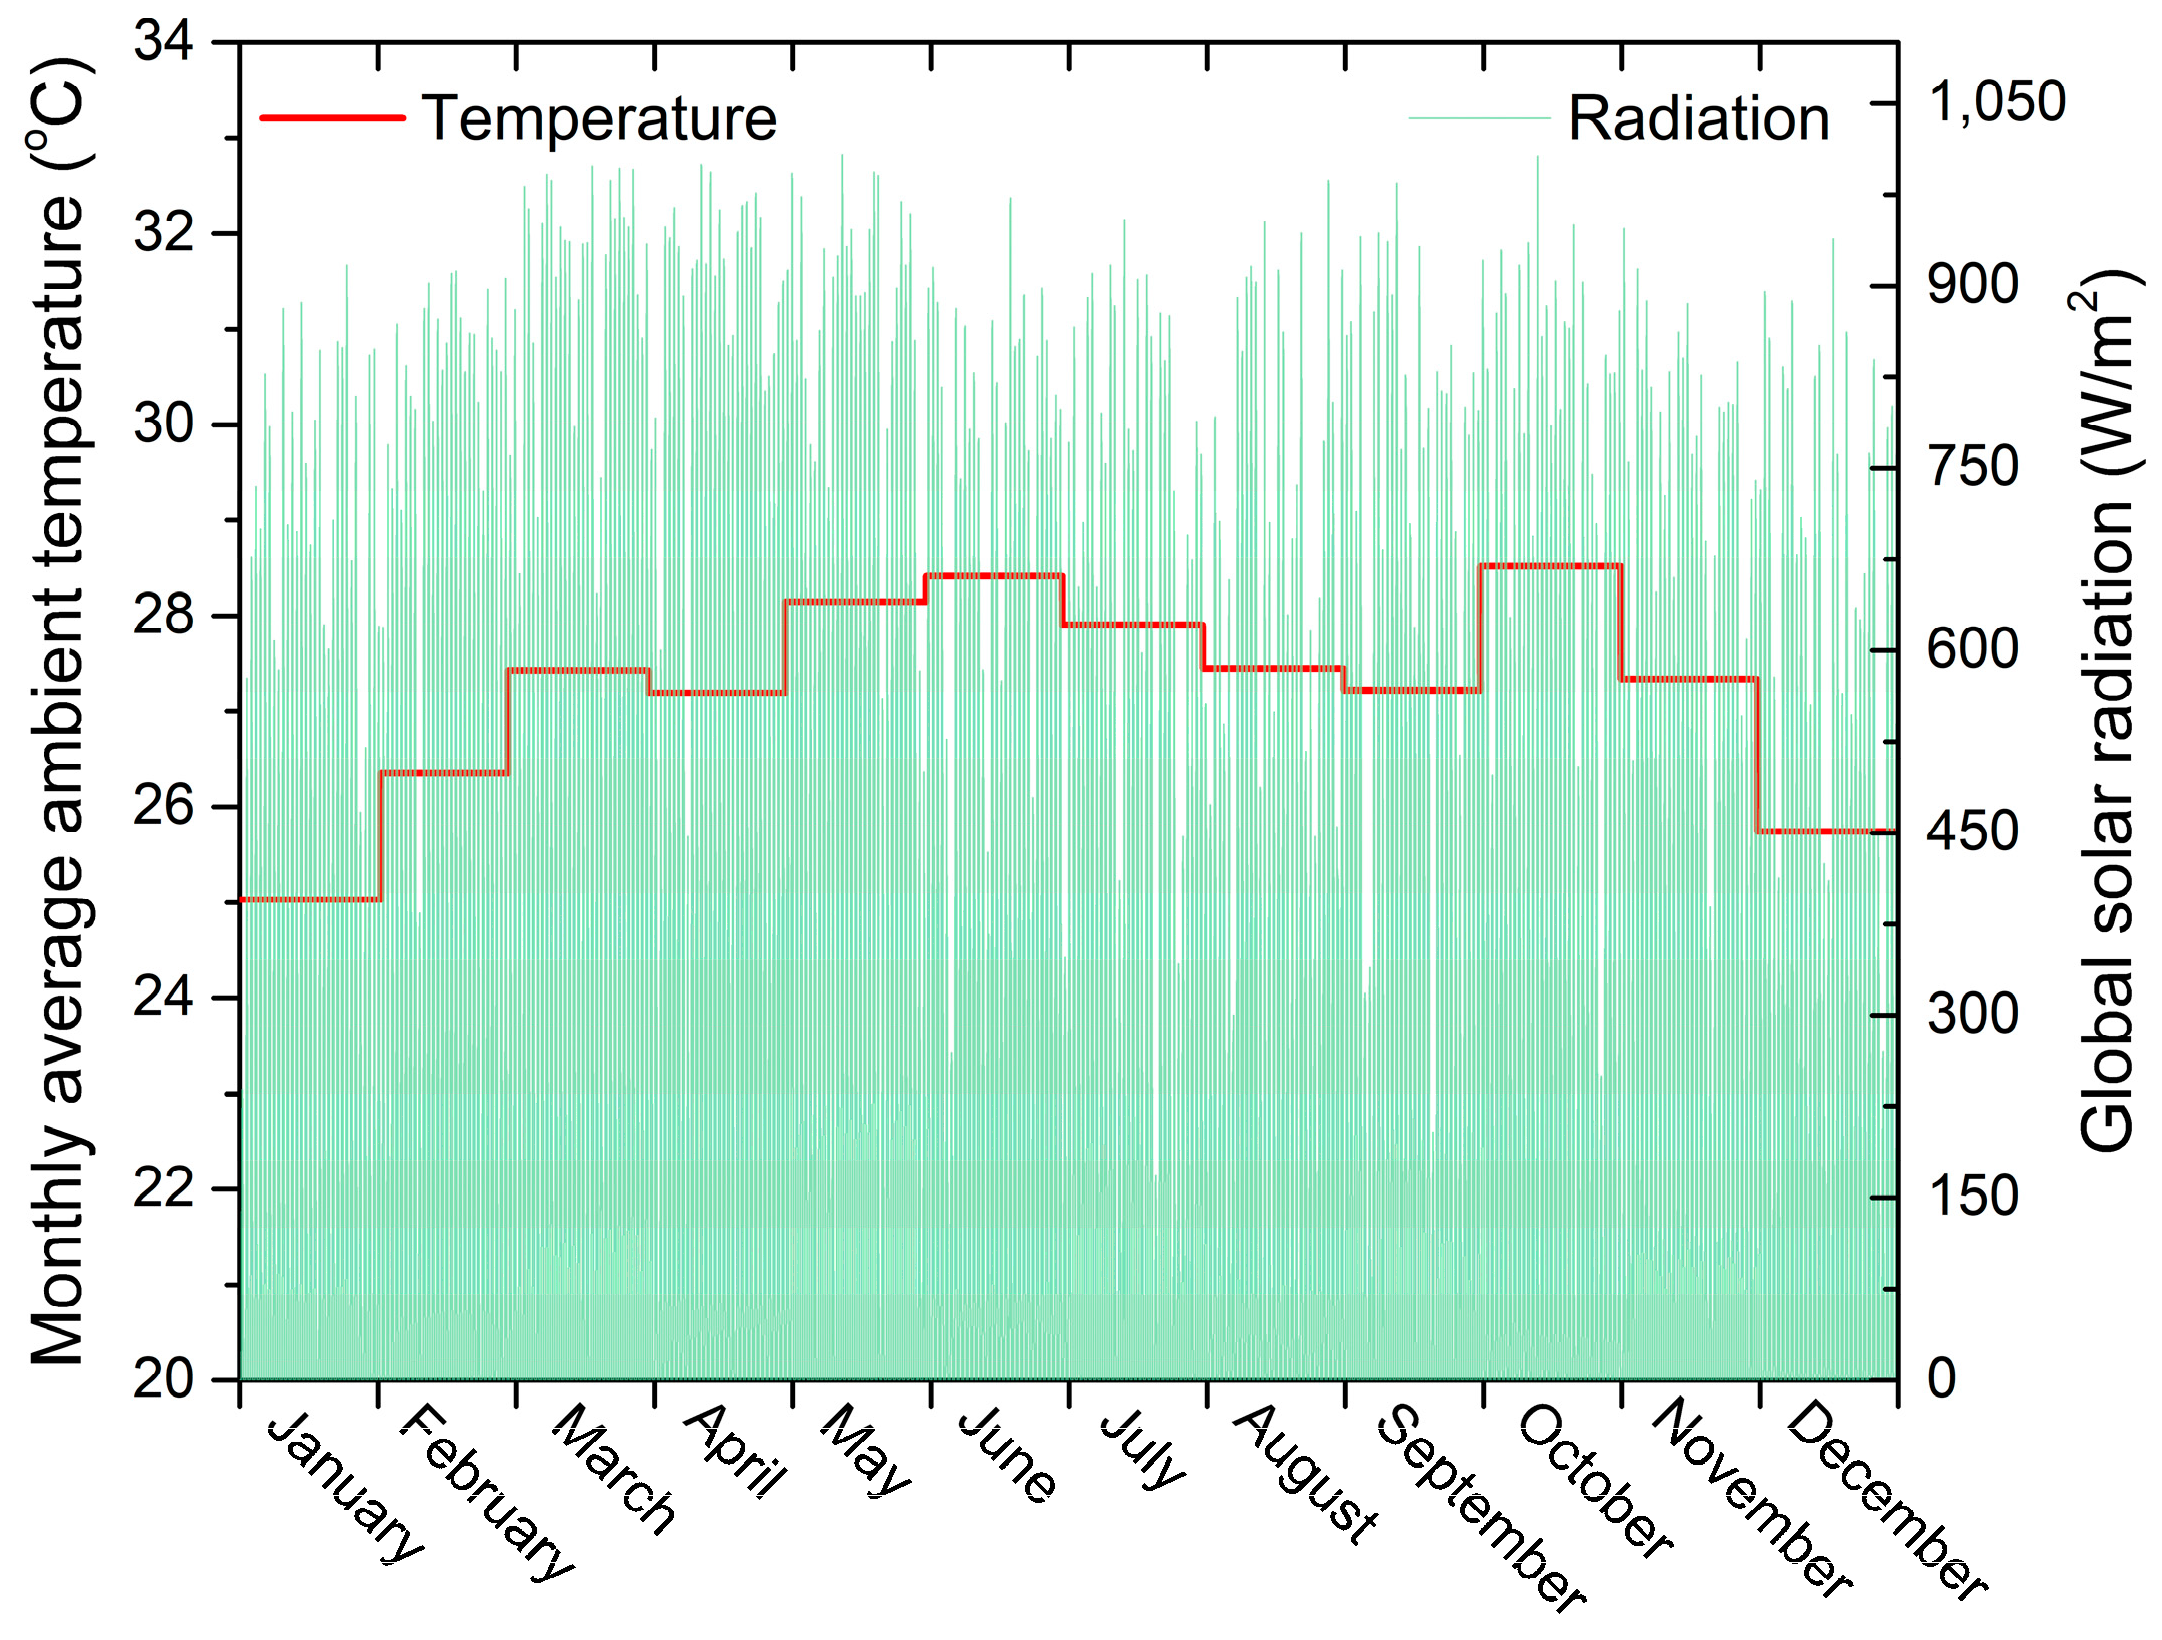
This region has a good solar resource and stable, warm ambient temperatures throughout the year, as shown in Figure 2, and therefore the use of solar energy for the conversion into electricity was deemed as an option to meet the electricity requirements of the community. Bigene has an average annual ambient temperature of approximately 26.9 °C, with an average maximum of 28.5 °C during the month of October and an average minimum of 25 °C during December and January, respectively, while presenting a yearly in-plane irradiation of 2195 kWh/m2 [25].
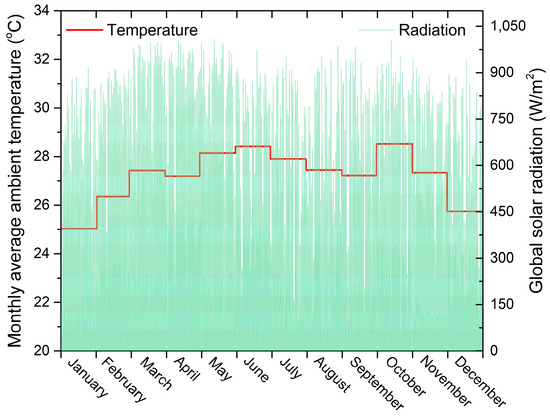
Figure 2.
Monthly average ambient temperature and annual global solar radiation for Bigene, Guinea-Bissau.
3.2. Electricity Demand Profile
This study focuses on the comparative technical and economic analysis of isolated microgrids based on solar PV energy with an ESS with AGM/lithium batteries. The community of Bigene does not have electricity service, nor does it have a real electricity consumption profile. In addition to the above, due to the lack of electricity service, the population does not have the household appliances and/or energy-consuming equipment that they would be expected to have if they had electricity. Due to the above, a set of electrical loads was defined for a certain number of users, considering covering the basic needs and promoting the sustainable development of the community. The electrical loads and equipment that were considered can be seen in Table 3. To meet the needs of the different types of users, typical demand profiles were considered for the domestic sector, schools, commercial establishments, and a hospital, in which different amounts and types of equipment and technologies were established to carry out the activities of each sector. For the domestic sector, lighting, comfort, food preservation, and preparation were included; for the educational sector, loads for lighting, comfort, and technologies for academic activities were considered. For the commercial sector, in addition to the above, an electric motor was included for specialized activities, while for the health sector (hospital) a constant load of 3000 W was considered for various uses instead of an electric motor. A total of 500 domestic users, 3 schools, 25 commercial businesses, and 1 hospital were established for the total Bigene community.
Table 3.
Electrical power and number of equipment considered per typical user.
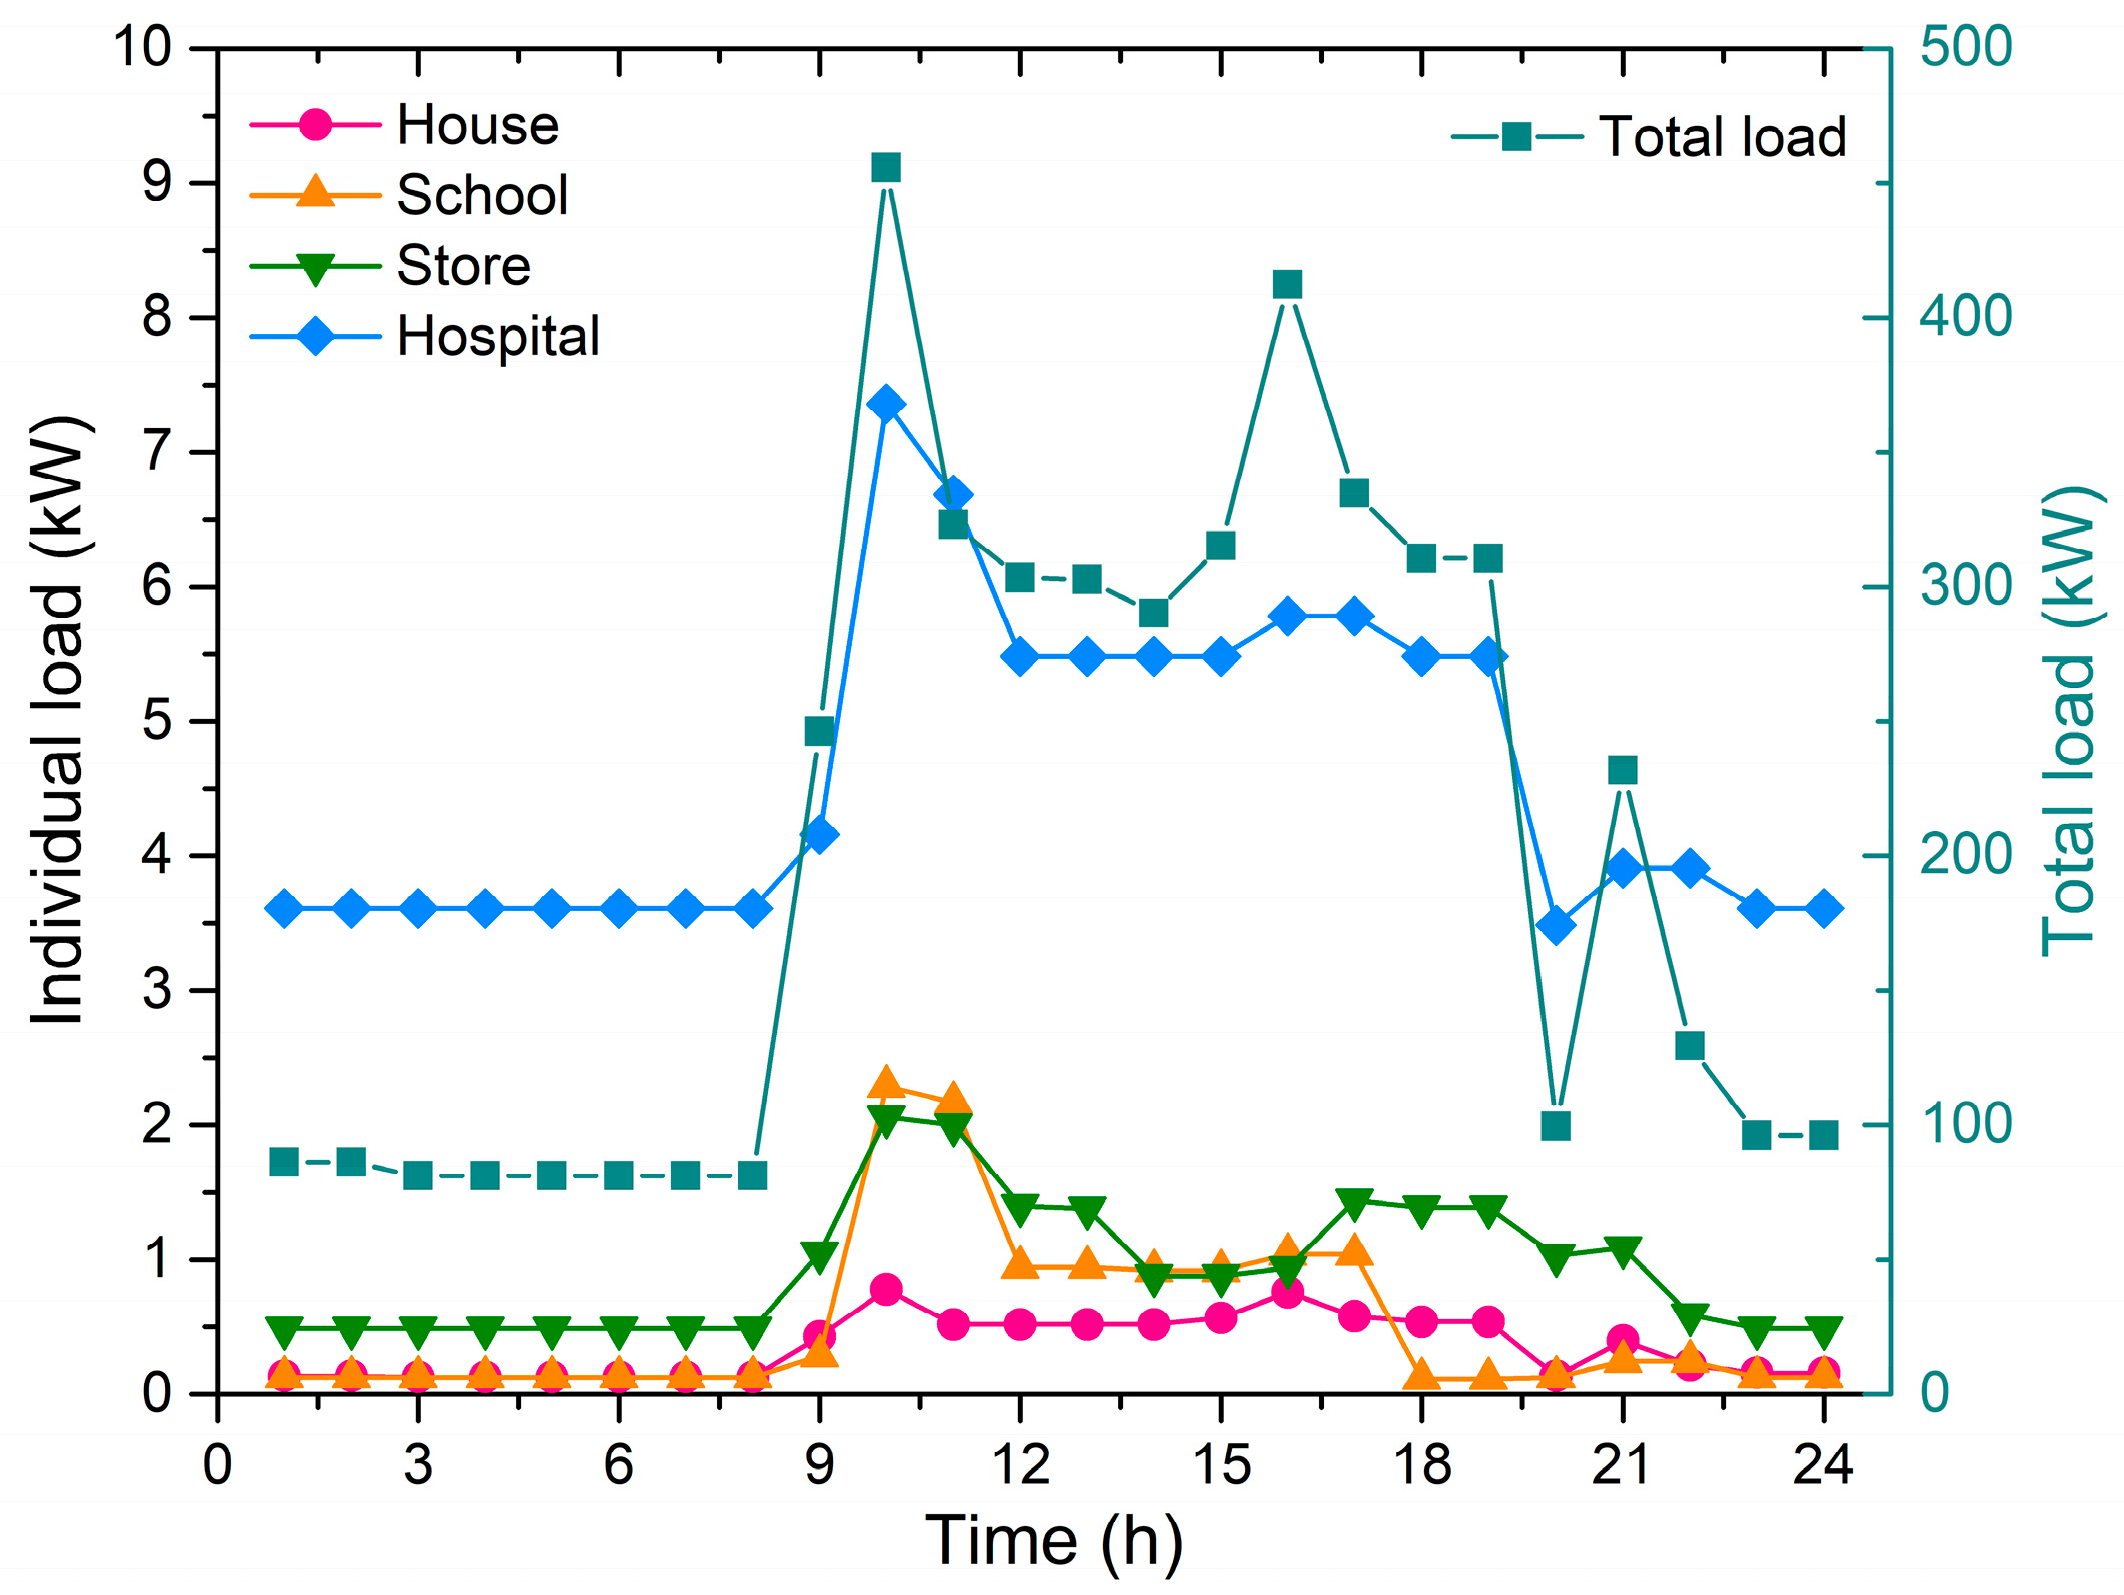
Figure 3 shows the hourly demand profile for the Bigene microgrid for the different users and considers the total connected loads. There are 3 moments of relevance during the typical day of demand, at 10:00, 16:00, and 21:00, with demands of 455, 412, and 232 kW, respectively, mainly caused by the energy demand in households for food preparation (specifically, more use of the refrigerator and blender). This demand profile assesses the PV generation system in conjunction with its storage system, since the first two consumption peaks do not coincide with the point of maximum generation (half solar day) and the latter one is outside the hours of solar generation, meaning it must be covered entirely by the ESS with the batteries.
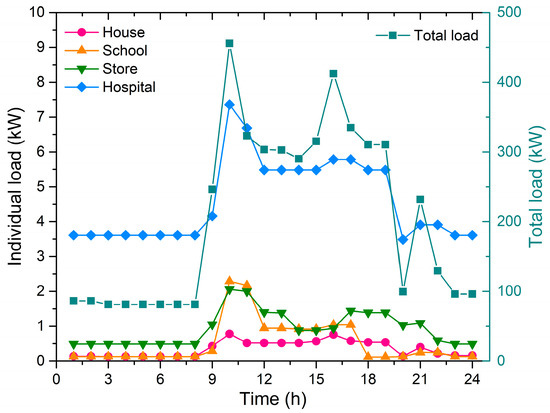
Figure 3.
Daily demand profile by the user type and total considering the number of connected loads.
This demand profile is based on satisfying the basic energy requirements of the Bigene community, with a fundamental factor being the total daily energy by type of user. With the experience in the development and study of isolated microgrids in marginalized communities [5,24], this profile has been defined, and it was considered robust to possible changes in consumption, due to the total amount of energy distributed among the different users that can be compensated with the low consumption of some users. In this type of project, energy consumption should not exceed the maximum energy production of the microgrid, which can only be achieved through the implementation of energy management models in conjunction with the beneficiary community.
3.3. Solar Fraction and LCOE Calculation
The operational simulation study focused on analyzing the effects of varying the installed PV peak power and ESS capacity with both types of batteries, AGM and lithium. These variations have a direct impact on the solar fraction (SF), which is defined as the energy produced by the PV system that was delivered to the end user, and is calculated as follows:
where is the SF, is the electrical energy required to satisfy the total demand of the users during a whole year, and is the energy of the microgrid that could not be supplied by the PV energy and the ESS, and that has to be produced by an auxiliary electric generator on an annual basis, as shown in the following equation:
where is the power required to satisfy the community’s demand for electric energy, is the photovoltaic power available at the time of the electrical demand, and is the power available from the ESS to be delivered to the demand. It is worth mentioning that this calculation of required auxiliary energy was made hour by hour during the entire study period, which was a full year (8760 h). In addition, if the value of is negative, this is attributed to the availability of a higher energy production and/or stored energy that is capable of meeting the demand. In this scenario the value was not subtracted from the total sum.
Wasted energy, , is defined as the result of the excess PV energy production after the community’s electricity demand has been satisfied, and this energy cannot be stored in the ESS because it is at its maximum capacity. This is calculated according to Equation (3):
If the resultant value of Equation (3) is negative, this is because there was no excess energy production, and all the was used to meet the electricity demand and/or store energy in the ESS.
To calculate the total energy demand of the microgrid, the profile presented in Figure 3 for the whole year was considered, resulting in a cumulative total of 1793.47 MWh.
To make a comparison of the economical feasibility of this type of battery storage technology during their useful life, the LCOE indicator for both technologies was considered, which is the economic valuation of the cost of the electricity generation system that includes all the costs over the project life, which was considered as 25 years for both, and is calculated based on Equation (4):
where is the total energy supplied to the electricity demand during the life of the project, considered in MWh, and is the annual total expenditures during the useful life of the project, which is calculated by Equation (5):
where is the initial investment cost of the project and is only considered during the year (1). are defined as the expenses for operating and maintaining the project during its useful life, which is calculated as shown in Equation (6):
where are the operation and maintenance costs during the th year of operation. This is calculated according to Equation (7):
where 0.02 corresponds to an operating expense of 2% of the , is the economic cost related to the energy supplied by the auxiliary electric generator, is the annual inflation rate considered at 5%, and corresponds to the eventualities that may arise during the operation of the project in terms of the spare parts or change in the individual equipment due to their useful life. For the comparative study of AGM and lithium batteries, an inverter parts replacement cost of 30% of the initial cost of the inverter was considered every 10 years, while for the microgrid with AGM batteries, a total replacement of the ESS bank was considered every 5 years based on the life cycles that the batteries would deliver with a depth of discharge of 50% [26]. In the case of the microgrid with lithium batteries, a total replacement of the battery bank was considered every 10 years according to the warranty provided by the manufacturer [27]. Table 4 shows the estimated costs of the equipment considered in the study.
Table 4.
Cost estimation of the microgrid system with the batteries.
4. Results
Simulation studies of the PV-electric microgrid system with an ESS with AGM and lithium batteries were performed considering the operational dynamics related to the demand and energy resource conditions of the community of Bigene, Guinea-Bissau. The study contemplated parametric simulations varying the PV and ESS capacities for both technologies, analyzing the effect they have on variables such as SF, auxiliary energy needs, energy losses, and LCOE during the lifetime of the project. The results presented were conducted during an annual operational simulation with simulation periods of one hour, except for the LCOE, which considered the 25-year life of the project.
4.1. Solar Fraction
The variation of the SF as a function of PV capacity and ESS capacity for both AGM and lithium batteries are shown in Figure 4a,b, respectively. It should be noted that increasing the ESS capacity in both battery technologies did not produce a significant effect on the SF until a PV capacity greater than 600 kW was considered. With this power without storage, a SF of 51.7% was reached, and this increased to approximately 59.5% when a battery bank greater than 2580 kWh was considered for both AGM and lithium batteries. This was mainly because with this PV capacity, the electricity generation was consumed in its entirety, leaving no energy to be stored as a result. From 1000 kW of PV capacity onwards, lithium ESS technology tended to contribute a higher SF compared to AGM technology, with up to 90.6% of the SF compared to 83.0% for AGM, 9.1% more with 2580 kWh of storage and 1000 kW of PV capacity, respectively. Furthermore, from the 1000 kW of PV capacity, it can be seen that increasing it does not exhibit a significant impact on the SF if it is not accompanied by an increase in the storage capacity. Increasing the capacity from 1200 kW to 1400 kW results in increases of approximately 3.7% in the SF without considering the ESS. However, maintaining 1400 kW of PV capacity can lead to an increase from 68.3% to 90.4% and 69.2% to 97.2% SF, with 2580 kWh of ESS with AGM and lithium batteries, respectively. A high SF reduces the dependence on the auxiliary generator but entails an increase in the CAPEX that must be analyzed on a cost-benefit basis.
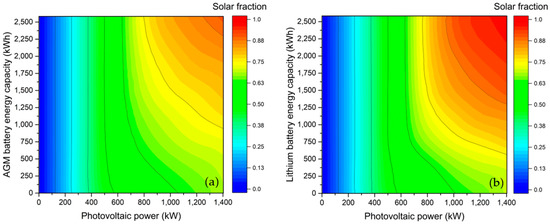
Figure 4.
SF as a function of the PV power and ESS capacity with (a) AGM and (b) lithium batteries.
4.2. Auxiliary Energy Required to Meet the Demand
Since the PV capacity and ESS ratios do not reach a SF of 1, it is therefore necessary to supply the missing energy with an auxiliary electrical source. The AuxE as a function of the PV capacity and ESS can be seen in Figure 5a,b, for AGM and lithium ESS-based technologies, respectively. The typical annual energy demand of the Bigene community is 1793.47 MWh. As the installed PV capacity increases, the need for auxiliary power decreases linearly, with no significant effects observed in considering an ESS, mainly because all the energy produced is consumed at the moment, leaving no remaining energy for storage. From 600 kW of PV capacity onwards, there was a decrease in the need for AuxE when considering an ESS with both AGM and lithium technologies. With 600 kW PV, a reduction of approximately 16% of the AuxE was achieved when considering a storage bank of 2580 kWh, being the same percentage for both types of batteries. From 800 kW of PV capacity onwards, a greater reduction of AuxE was observed when lithium batteries were considered. With a capacity of 1400 kW, the need for AuxE was reduced by 69.9% and 91.1% when considering a storage bank of 2580 kWh with AGM and lithium batteries, respectively. This represents a saving of 121.8 MWh of AuxE per year when using lithium batteries instead of AGM batteries, equivalating to an economic saving of USD 58,502/year.
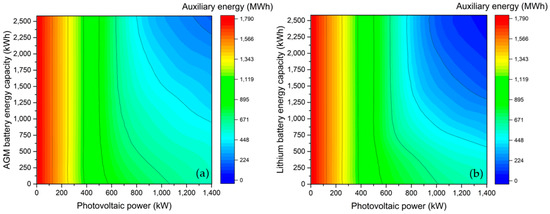
Figure 5.
AuxE requirements as a function of the PV power and ESS with (a) AGM and (b) lithium batteries.
4.3. Energy Loss
In some PV generation and battery storage ratios, there may be a surplus of electricity produced due to a low user demand and a full battery bank, meaning this surplus is considered as an energy loss. Figure 6a,b show the energy loss as a function of the PV capacity and ESS. At low PV capacities, there was no such energy loss as all the energy was either consumed or stored in batteries, specifically in capacities below 600 kW. From this PV capacity, energy waste tends to increase in different percentages for AGM and lithium battery technologies. With a PV capacity of 800 kW, energy loss can be reduced by 84.8% when considering an AGM battery bank of 2580 kWh, compared to not having an ESS in the microgrid, which would result in an annual energy loss of 432.01 MWh. However, when considering lithium technology, an 85.4% decrease in energy loss was achieved when considering a 1476 kWh bank, which is 42.8% lower in capacity than AGM. For a 1400 kW PV system, a high-capacity storage system is required to avoid a large amount of energy losses, especially if it considers AGM batteries. However, with this PV capacity, having a battery bank with a capacity of 2580 kWh would not avoid the losses of 923.8 MWh and 777.8 MWh of energy with AGM and lithium technology, respectively. It should be noted that with this energy generation-storage capacity ratio, the SF was 90.4% and 97.2% for AGM and lithium batteries, respectively, as shown in Figure 4, meaning that increasing the ESS capacity to reduce energy losses would not have a major impact on meeting the energy demand of the community.

Figure 6.
Energy losses as a function of the PV power and ESS capacity with (a) AGM and (b) lithium batteries.
4.4. LCOE Estimation
The LCOE is an indicator that helps to compare the different energy generation and storage technologies, since it considers the initial investment, operating, and eventuality costs, to mention a few, that could occur for each piece of equipment, thereby affecting the economic benefits during the lifetime of the project. The CAPEX is a variable of great importance that affects the LCOE, so it is relevant to look for an attractive techno-economic option at the time of making the initial investment. In this study, the value of the CAPEX, and therefore the LCOE, was not considered as an economic constraint since it is a study variable for the future stages of the project. Figure 7a,b show the effects of the PV capacity and ESS size on the LCOE of the Bigene microgrid project. It should be noted that in the scenario of this microgrid, with a PV capacity of less than 700 kW and an ESS of less than 2580 kWh, the type of storage technology, AGM or lithium, does not represent a considerable difference in the LCOE, meaning therefore that AGM technology could be selected considering its low initial investment cost compared to lithium batteries. At PV capacities above 700 kW, the type of storage technology already represents a significant difference concerning AGM. Considering a capacity of 1000 kW PV and 2580 kWh of ESS, LCOEs of $267.5 and $200.7 USD/MWh were achieved for AGM and lithium batteries, respectively, being 25% lower with the latter. The main factor for this effect was the depth of discharge that can be achieved with lithium batteries, which in this case was 10% compared to 50% for AGM, and the much longer lifetime. On the other hand, when considering a maximum PV power of 1400 kW and a storage of 2580 kWh capacity, minimum LCOEs of $222.7 and $162.7 USD/MWh were achieved for AGM and lithium batteries, respectively, with the latter being up to 26.9% lower in LCOE than AGM. Although the initial investment was lower for AGM batteries, and their lifetime replacement cost was lower than that of the lithium batteries, the higher discharge factor and longer lifetime of lithium batteries end up offering more competitive LCOEs at higher microgrid capacities.
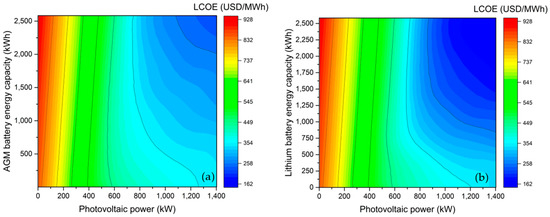
Figure 7.
LCOE as a function of the PV power and ESS capacity with (a) AGM and (b) lithium batteries.
5. Discussion
When presenting the results of the study of the variation in the PV capacity and ESS with AGM and lithium batteries, it can be seen that seeking to achieve SF levels close to one causes a large amount of energy losses, as shown in Figure 4 and Figure 6. When considering a PV power of 1400 kW and a battery bank of 2580 kWh, we obtained an energy production of 2809.3 MWh and losses of 923.8 and 777.8 MWh for the AGM and lithium batteries, which were equivalent to 32.9% and 27.6% of the total energy generated, respectively. At the same time, it also causes the CAPEX to increase without a proportional increase in the SF. The effect of increasing the PV and ESS capacities brings about a reduction in the LCOE for both types of batteries, being to a greater extent for the lithium batteries. This was deemed to be due to the high cost of fuel considered as an AuxE source. However, there was a tendency towards stability in the LCOE as the capacity limits studied were reached due to the increases observed in the CAPEX, O&M, and eventuality costs, respectively, while the need for AuxE decreased, which means that the LCOE not only does not increase, but also does not decrease in a representative way either.
In this scenario, due to the high costs of fuel, increasing the SF brought about a reduction in the LCOE, and as the cost of fuel increases, the economic attractiveness of solar PV generation and storage also increased as a result. Despite the above, for the selection of the ratio of the PV generation capacity and ESS capacity and type, the most relevant factor for decision-making was the economic capacity for the CAPEX. If the budget to invest in a microgrid with a maximum SF of 60% is available, the recommendation would be a system with an AGM battery storage due to the lower CAPEX. If the budget is higher, the recommendation would be lithium battery storage technology. This is because with this SF, the storage capacity does not have a significant impact on the LCOE reduction, regardless of the technology. Furthermore, the larger the available budget, the recommendation will be to achieve the highest SF possible, considering 1400 kW of PV capacity and increasing the lithium battery storage. This will reduce energy losses but will harm the LCOE as a consequence.
6. Conclusions
This study presented the energy and economic analysis of a microgrid based on solar PV energy with a battery ESS for the isolated community of Bigene in the African country of Guinea-Bissau. The analysis considered two ESS technology options: AGM and lithium batteries. The expected demand profiles for the community were established according to four types of users: domestic, commercial, school, and hospital, ensuring that the basic needs of comfort, food preservation, economic activities, health, and entertainment were covered. The microgrid simulator was developed in TRNSYS software considering the factors that were involved in the operation of the system, such as the demand profile of the community, weather conditions, and operational status of the equipment, to mention a few.
The results revealed no significant differences in the SF of either type of battery, AGM and lithium, when the PV power was less than 600 kW regardless of the capacity of the storage bank. Above 1000 kW of PV capacity, lithium technology tended to have a higher SF benefit over the AGM batteries. The analysis of auxiliary power requirements showed that lithium technology led to a lower consumption from 800 kW of PV capacity, while less than this capacity was found to not have a significant difference with the AGM batteries. At a capacity of 1400 kW, the need for auxiliary power can be reduced by 69.9% and 91.1% when considering a storage bank of 2580 kWh capacity with AGM and lithium batteries, respectively. This represents a saving of 121.8 MWh of AuxE per year when lithium batteries are used instead of AGM batteries, which is equivalent to an economic saving of $58,502 USD/year. The economic analysis showed that the LCOE can reach up to $162 USD/MWh with lithium battery technology. It should be noted that in this microgrid with a PV capacity of less than 700 kW and an ESS of less than 2580 kWh, respectively the type of storage technology, AGM or lithium, does not represent a considerable difference in the LCOE, meaning that AGM technology could be selected considering its low initial investment cost compared to the lithium batteries.
The proper sizing of isolated microgrids, such as Bigene’s, must consider the economic availability for the correct selection of technologies. Lithium batteries in this case do not present an energy improvement in microgrids with a low SF compared to the AGM batteries, but they present a disadvantage in the CAPEX that must be considered when making the decision.
Author Contributions
J.A.A.-J.: Methodology, Investigation, Validation, Writing—Original Draft, Formal analysis. L.H.-C.: Validation, Formal analysis, Writing—Original Draft, Review and Editing, Supervision. J.A.S.-M.: Methodology, Investigation, Writing—Original Draft, Supervision. V.A.G.: Validation, Formal analysis, Supervision. A.G.-Á.: Conceptualization, Review and Editing, Supervision. R.M.-N.: Conceptualization, Review and Editing, Formal analysis. L.J.O.: Conceptualization, Review and Editing, Supervision. All authors have read and agreed to the published version of the manuscript.
Funding
Soria City Council Project 2021 Phase 2: Asegurando el derecho a la educación con disponibilidad, accesibilidad y adaptabilidad en el nivel básico de los niños y niñas en Udasse y mejorada la calidad educativa del sector de Bigene.
Data Availability Statement
Information is available upon request from the authors.
Conflicts of Interest
The authors declare no conflict of interest.
References
- The World Bank Access to Electricity. Available online: https://data.worldbank.org/indicator/EG.ELC.ACCS.ZS (accessed on 30 November 2018).
- Hirsch, A.; Parag, Y.; Guerrero, J. Microgrids: A Review of Technologies, Key Drivers, and Outstanding Issues. Renew. Sustain. Energy Rev. 2018, 90, 402–411. [Google Scholar] [CrossRef]
- Warneryd, M.; Håkansson, M.; Karltorp, K. Unpacking the Complexity of Community Microgrids: A Review of Institutions’ Roles for Development of Microgrids. Renew. Sustain. Energy Rev. 2020, 121, 109690. [Google Scholar] [CrossRef]
- Aguilar-Jiménez, J.A.; Velázquez-Limón, N.; López-Zavala, R.; González-Uribe, L.A.; Islas, S.; González, E.; Ramírez, L.; Beltrán, R. Optimum Operational Strategies for a Solar Absorption Cooling System in an Isolated School of Mexico. Int. J. Refrig. 2020, 112, 1–13. [Google Scholar] [CrossRef]
- Aguilar-Jiménez, J.A.; Velázquez, N.; Acuña, A.; Cota, R.; González, E.; González, L.; López, R.; Islas, S. Techno-Economic Analysis of a Hybrid PV-CSP System with Thermal Energy Storage Applied to Isolated Microgrids. Sol. Energy 2018, 174, 55–65. [Google Scholar] [CrossRef]
- Jiménez-estévez, B.G.; Navarro-espinosa, A.; Palma-behnke, R. Achieving Resilience at the Distribution Level. IEEE Power Energy Mag. 2017, 15, 64–73. [Google Scholar] [CrossRef]
- López-González, A.; Domenech, B.; Gómez-Hernández, D.; Ferrer-Martí, L. Renewable Microgrid Projects for Autonomous Small-Scale Electrification in Andean Countries. Renew. Sustain. Energy Rev. 2017, 79, 1255–1265. [Google Scholar] [CrossRef]
- Valer, L.R.; Manito, A.R.A.; Ribeiro, T.B.S.; Zilles, R.; Pinho, J.T. Issues in PV Systems Applied to Rural Electrification in Brazil. Renew. Sustain. Energy Rev. 2017, 78, 1033–1043. [Google Scholar] [CrossRef]
- Gaona, E.E.; Trujillo, C.L.; Guacaneme, J.A. Rural Microgrids and Its Potential Application in Colombia. Renew. Sustain. Energy Rev. 2015, 51, 125–137. [Google Scholar] [CrossRef]
- Rangel, N.; Li, H.; Aristidou, P. An Optimisation Tool for Minimising Fuel Consumption, Costs and Emissions from Diesel-PV-Battery Hybrid Microgrids. Appl. Energy 2023, 335, 120748. [Google Scholar] [CrossRef]
- Khawaja, Y.; Qiqieh, I.; Alzubi, J.; Alzubi, O.; Allahham, A.; Giaouris, D. Design of Cost-Based Sizing and Energy Management Framework for Standalone Microgrid Using Reinforcement Learning. Sol. Energy 2023, 251, 249–260. [Google Scholar] [CrossRef]
- Nallolla, C.A.; Vijayapriya, P. Optimal Design of a Hybrid Off-Grid Renewable Energy System Using Techno-Economic and Sensitivity Analysis for a Rural Remote Location. Sustainability 2022, 14, 15393. [Google Scholar] [CrossRef]
- Kumar, R.; Channi, H.K. A PV-Biomass off-Grid Hybrid Renewable Energy System (HRES) for Rural Electrification: Design, Optimization and Techno-Economic-Environmental Analysis. J. Clean. Prod. 2022, 349, 131347. [Google Scholar] [CrossRef]
- Tarife, R.; Nakanishi, Y.; Chen, Y.; Zhou, Y.; Estoperez, N.; Tahud, A. Optimization of Hybrid Renewable Energy Microgrid for Rural Agricultural Area in Southern Philippines. Energy 2022, 15, 2251. [Google Scholar] [CrossRef]
- Castro, M.T.; Pascasio, J.D.A.; Delina, L.L.; Balite, P.H.M.; Ocon, J.D. Techno-Economic and Financial Analyses of Hybrid Renewable Energy System Microgrids in 634 Philippine off-Grid Islands: Policy Implications on Public Subsidies and Private Investments. Energy 2022, 257, 124599. [Google Scholar] [CrossRef]
- Thomas, D.; Deblecker, O.; Ioakimidis, C.S. Optimal Design and Techno-Economic Analysis of an Autonomous Small Isolated Microgrid Aiming at High RES Penetration. Energy 2016, 116, 364–379. [Google Scholar] [CrossRef]
- Shirzadi, N.; Nasiri, F.; Eicker, U. Optimal Configuration and Sizing of an Integrated Renewable Energy System for Isolated and Grid-Connected Microgrids: The Case of an Urban University Campus. Energy 2020, 13, 3527. [Google Scholar] [CrossRef]
- Das, M.; Mandal, R. The Effect of Photovoltaic Energy Penetration on a Photovoltaic-Biomass-Lithium-Ion off-Grid System and System Optimization for the Agro-Climatic Zones of West Bengal. Sustain. Energy Technol. Assess. 2022, 53, 102593. [Google Scholar] [CrossRef]
- Mustafa Kamal, M.; Asharaf, I.; Fernandez, E. Optimal Renewable Integrated Rural Energy Planning for Sustainable Energy Development. Sustain. Energy Technol. Assess. 2022, 53, 102581. [Google Scholar] [CrossRef]
- Shakya, B.; Bruce, A.; MacGill, I. Survey Based Characterisation of Energy Services for Improved Design and Operation of Standalone Microgrids. Renew. Sustain. Energy Rev. 2019, 101, 493–503. [Google Scholar] [CrossRef]
- Veilleux, G.; Potisat, T.; Pezim, D.; Ribback, C.; Ling, J.; Krysztofiński, A.; Ahmed, A.; Papenheim, J.; Pineda, A.M.; Sembian, S.; et al. Techno-Economic Analysis of Microgrid Projects for Rural Electrification: A Systematic Approach to the Redesign of Koh Jik off-Grid Case Study. Energy Sustain. Dev. 2020, 54, 1–13. [Google Scholar] [CrossRef]
- Kumar, P.P.; Saini, R.P. Optimization of an Off-Grid Integrated Hybrid Renewable Energy System with Different Battery Technologies for Rural Electrification in India. J. Energy Storage 2020, 32, 101912. [Google Scholar] [CrossRef]
- Klein, S.A. TRNSYS 17: A Transient System Simulation Program 2015.
- Aguilar-Jiménez, J.A.; Velázquez, N.; Beltrán, R.; Hernández-Callejo, L.; López-Zavala, R.; González-San Pedro, E. Potential for Thermal Water Desalination Using Microgrid and Solar Thermal Field Energy Surpluses in an Isolated Community. In Smart Cities; ICSC-CITIES 2019; Nesmachnow, S., Hernández-Callejo, L., Eds.; Springer: Cham, Switzerland, 2020; pp. 162–175. ISBN 9783030388881. [Google Scholar]
- JRC Photovoltaic Geographical Information System (PVGIS)—European Commission. Available online: https://re.jrc.ec.europa.eu/pvg_tools/en/tools.html (accessed on 27 November 2022).
- Trojan Battery|Solar SAGM 12 205 12V AGM Battery. Available online: https://www.trojanbattery.com/products/solar-sagm-12-205-12v-agm-battery (accessed on 9 March 2023).
- ARK LV Battery|Sistema de Batería|Growatt. Available online: https://latam.growatt.com/products/ark-lv-battery (accessed on 9 March 2023).
- Solar Price Index & Solar Module Price Development. Available online: https://www.pvxchange.com/Price-Index (accessed on 9 March 2023).
- Wattuneed Conmparative Table of the Price per Useful Kwh on Batery Lifetime. Available online: https://www.wattuneed.com/themes/wattuneed-1200-2/battery-table-en.html (accessed on 9 March 2023).
- Solar Battery Comparison and Prices|Solar Quotes. Available online: https://www.solarquotes.com.au/battery-storage/comparison-table/ (accessed on 9 March 2023).
- Pricelist—Victron Energy. Available online: https://www.victronenergy.com/information/pricelist (accessed on 9 March 2023).
- Africa: Countries with Highest Diesel Prices 2022s|Statista. Available online: https://www.statista.com/statistics/1297071/average-retail-prices-for-diesel-in-africa-by-country/ (accessed on 9 March 2023).
- Diesel Generator—Energy Education. Available online: https://energyeducation.ca/encyclopedia/Diesel_generator (accessed on 9 March 2023).


Disclaimer/Publisher’s Note: The statements, opinions and data contained in all publications are solely those of the individual author(s) and contributor(s) and not of MDPI and/or the editor(s). MDPI and/or the editor(s) disclaim responsibility for any injury to people or property resulting from any ideas, methods, instructions or products referred to in the content. |
© 2023 by the authors. Licensee MDPI, Basel, Switzerland. This article is an open access article distributed under the terms and conditions of the Creative Commons Attribution (CC BY) license (https://creativecommons.org/licenses/by/4.0/).