1. Introduction
In line with the notion that the sustainability of neighborhoods and cities is gaining global interest, specific accredited metrics and third-party assessment systems [
1] have emerged to keep track of the associated practices and to assist the development of neighborhoods, socially, environmentally, and economically. Due to the particularities assigned to differences of scale, the regional priorities of different urban fabrics, cultural heritage, lifestyle, and building culture [
2], distinctive assessment tools have arisen and are now used and known with international recognition. The development of any of these neighborhood sustainability assessment (NSA) tools is based on a conventional structure of indicators [
1], characteristics [
2], and applications of those indicators [
3]. Each indicator in an established NSA tool is assigned a specific weight, which proceeds to a calculated scorecard. The result gives a general outline of what a sustainable neighborhood includes as elements and indicators, and is used to numerically compare the ‘sustainability level’ of the investigated development to other accredited developments in similar contexts or regional classifications. Most of the indicators supporting neighborhood sustainability are similar in all their assessment methods, although occasionally they appear under different headings and include various expressions of sustainability [
4], and each has a different numeric weight and description. Distinctions between indicators and their weightage among the NSA tools are justified per the location-specific conditions of population density, urban development, and energy needs, which trigger specific sustainability needs [
4]. The absence of or running issues with one of these needs make the associated category a high necessity. For instance, the spread of sprawl and the excessive use of private cars in the US has made transportation and location indicators gain the highest weightage in LEED ND’s scheme [
1]. Regional priorities have led to a disparity in addressing indicators as mandatory and optional measures [
5]. Another similarity between NSA tools is the inclusion of building. Some of the NSA schemes dedicate a specific category to the sustainability of buildings, especially in terms of the operational systems of water, material, and energy. This relates to the emergence of NSA tools after the formation of building sustainability metrics. Hence, it is no surprise that the inspiration for neighborhood sustainability assessment follows the conception of green buildings [
6], except that it adds the dimension of private and public spaces between those buildings [
7].
Though NSA tools appear to be holistic in their contexts, some gaps have been addressed in some research papers, which have tackled how NSA tools differ, how similar they are, and how they are assessed [
1,
2,
8]. Some major papers have indicated that evaluation continues to lack strategies for promoting sustainable urban development through economic methods [
9] and socio-economic aspects [
10]. Furthermore, the addressed NSA paid little attention to monitoring the performance of governmental and non-governmental institutions as part of institutional sustainability [
1], with an obvious lack of participatory decision-making [
11]. Also, some countries still have not got their own tool established; among them is Palestine.
In the local context of Palestine, the Palestinian Higher Green Building Council (PHGBC) came into being in 2010. The council seeks to promote environmentally friendly and sustainable architecture and buildings in Palestine by presenting primary green building design ideas in its published guidelines [
12]. Many structures that follow the PHGBC requirements have been identified since the organization’s foundation. However, neither the council nor any new council have added an investigatory extension for the scheme of sustainable neighborhoods. In the thesis paper Strategic Planning Towards Sustainable Palestinian Neighborhoods, the proposed strategic assessment pointed out the inclusion of neighborhoods as a crucial future opportunity to be studied under the scope of the council’s regulations [
13].
Current Palestinian neighborhoods face challenges in the aspects of the economy, society, and environment, which are pertinent in affecting the current and future state of how Palestinian cities operate, how they look, and how they are nationally and internationally branded. With the absence of formal tools to assess and reform, negative impacts become prolonged and arduous. Thus, the establishment of a local sustainable neighborhood framework is a necessity. It can generate scientific-based and systematic solutions, given that sustainability already revolves around locally problematic aspects: the economy, society, and environment. To achieve the mentioned target, this paper consists of determining an approach for adequate local guidelines and suitable assessment framework for the sustainability of local neighborhoods. It employs a methodology of reviewing NSA tools; LEED ND, PCRS, BREEAM COMM, CASBEE UD, DGNB ND, and GREEN MARK DISTRICTS, addressing local needed indicators, and using qualitative and quantitative tools to test the framework. Furthermore, what all NSA tools agree on is achieving efficient, healthy, and active communities that are in strategic urban locations. To test the applicability of sustainability following this notion, this paper selects Al-Mreij Neighborhood for evaluation as it is one of the most active and livable districts, located in the center-to-west part of the city of Nablus, yet it was spontaneously planned. Investigating this reality links the results with the impact of urban planning on the sustainability of urban design and the architecture of neighborhoods.
To point out the differences between the proposed methods in the study and those in the literature, the paper develops crossover between different accredited NSA tools and embraces the local context to influence the structure of the chosen indicators for the suggested model. Moreover, the study uses innovative tools like Urbano, and challenges its use for studies within local settings of inconsistent topography and irregular street patterns. Previous studies have integrated Urbano into their methods for evaluating street layouts in a mixed-use district [
14], studying the distribution of amenities around a tourist attraction [
15], and designing a TOD area [
16].
The paper’s significance is in finding answers to the following questions: How far are the local neighborhoods from becoming sustainable? How can the local NSA model be distinguished from the accredited NSA tools? What are the gaps in NSA tools? How can the existing and new local neighborhoods become sustainable? The paper acknowledges the role of urban design in the process of space design and production, since it is the simplified translation of larger planning schemes and it is the cumulative translation of architectural interventions. The sustainability of neighborhoods is an extension of the evolution of sustainability as a term for parallel schemes of needs, present and future [
17]. This extension is translated into the form of models with lasting social, economic, and environmental value [
18], introduced as NSA tools. Though previous research has been carried out on the review of NSA tools, this paper develops an original methodological framework for neighborhood assessment that is extracted from NSA tools and local needs. Since the first usage of the model is in Palestine, this study fills the gap of insufficient urban studies of local neighborhoods and expands the exploration of sustainability to contexts of spontaneous planning. The model can be of great importance to local governments, municipalities, and construction developers.
2. Materials and Methods
To establish a sustainable neighborhood assessment framework and implement this framework to assess Palestinian neighborhoods and introduce recommendations for future sustainable neighborhoods, different methods were utilized.
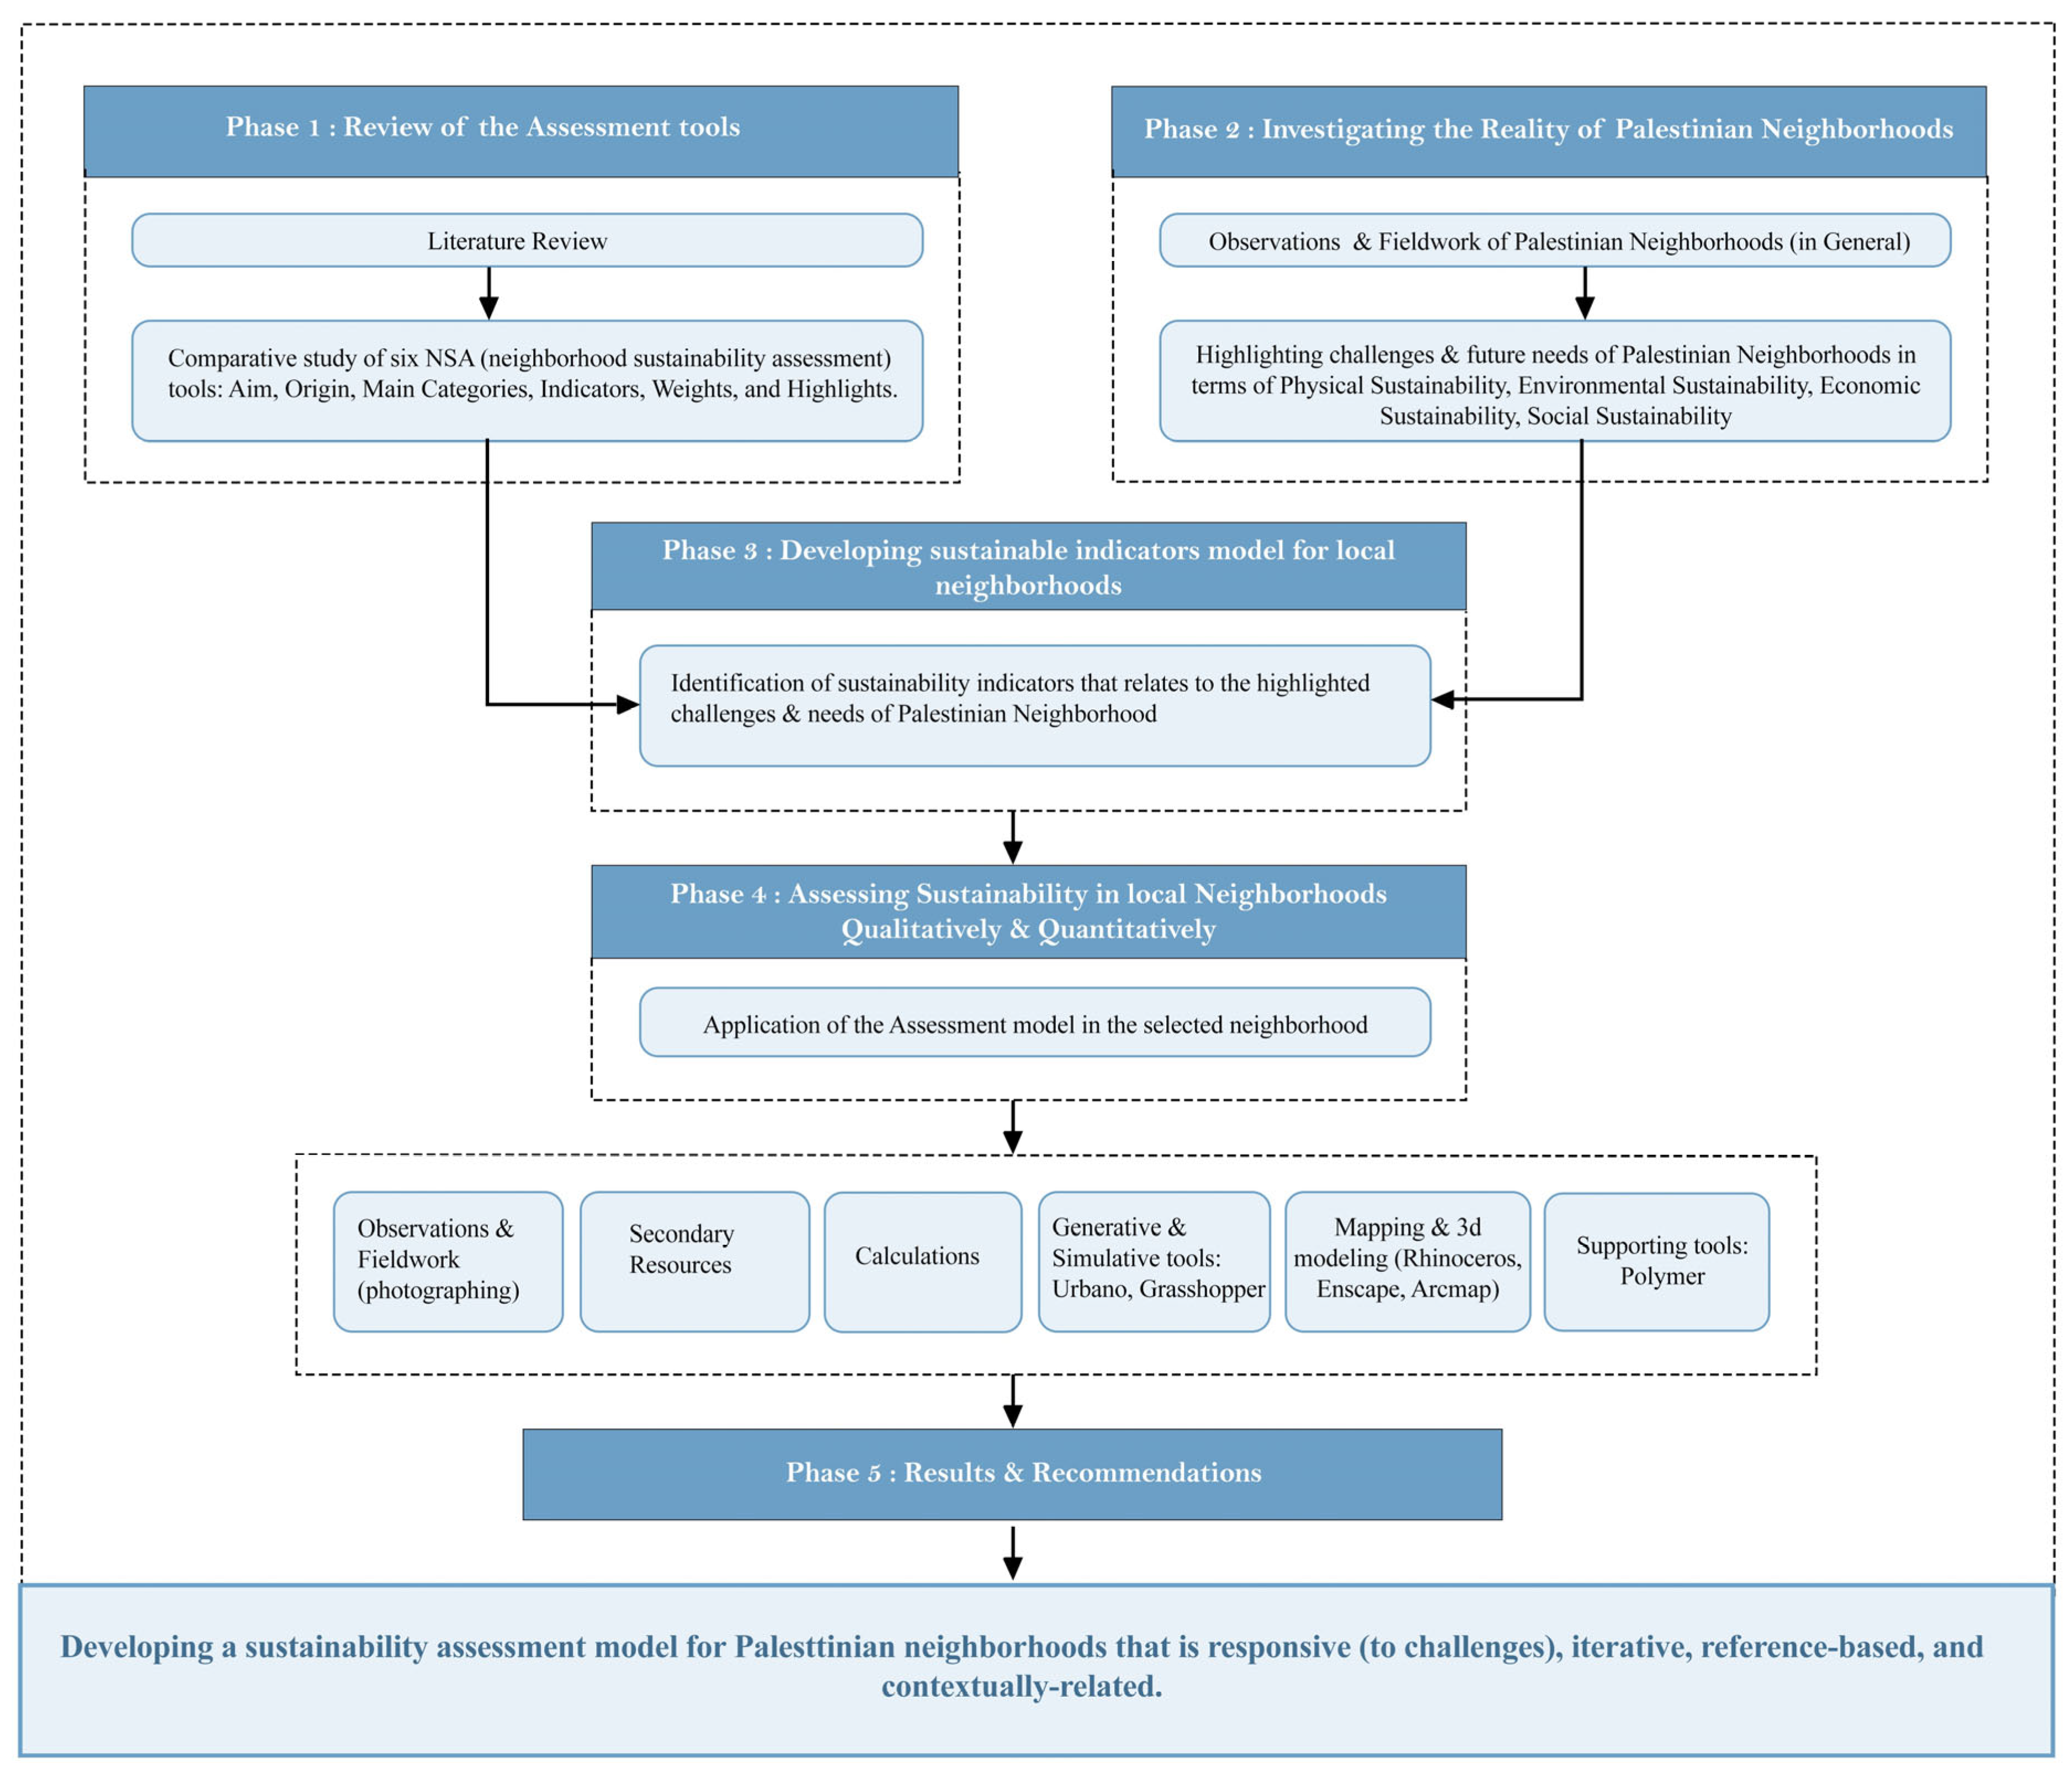
Figure 1 below illustrates the phases that guided the process of obtaining the localized assessment model. Each phase, method, and tool is explained in the subsections. Qualitative and quantitative methods are applied according to each indicator corresponding to what is required. Data collection methods, observations, fieldwork, and secondary resources guided the proceeding phase of mapping, modeling, and creating generative studies. The used tools produced a better understanding of the social, environmental, economic, and physical dimensions of investigated urbanism in neighborhoods.
2.1. Review of Assessment Tools
Six sustainability assessment tools were analyzed in
Table 1 for the comparison of the selected tools, which will assist in understanding the distinctions between each one. The comparison includes the establishing year, country of origin, developer, indicators, objectives, highlights, and priorities of indicators following their numbers and their weightage.
2.2. Investigating the Reality of Palestinian Neighborhoods
Similar to the reviewed NSA tools, the assessment model must be based on the reality of the context, with an aim to develop it and guide its used practices. Thus, the second step towards developing a sustainability assessment model for Palestinian cities was to consider the local challenges and respond accordingly. An established framework for Palestinian neighborhoods should stress the existing social, economical, environmental, and physical issues to set priorities and responsive, sustainable indicators.
Table 2 lists the current issues and challenges in the Palestinian neighborhoods, particularly the city of Nablus, gathered from the analysis of the master plan, regulations, uses, local context needs, and from the researchers’ background knowledge of everyday norms of local urbanism. A comparison between the economic, social, and environmental pillars of sustainability in the context of neighborhoods was identified.
Economic sustainability in neighborhoods is a complex concept that is often unevenly integrated into sustainable development projects [
19]. It is a vital aspect of achieving sustainable cities, and is influenced by factors such as the preservation of natural systems and resources, economic prosperity, and social equity [
20]. Environmental sustainability in neighborhoods encompasses a range of factors, including transport, density, urban forms, and environmental buildings [
21]. Physical sustainability in neighborhoods is usually tied to social, resource management, and energy concerns. Social sustainability in neighborhoods incorporates social justice, community interaction, and attachment to the environment. Understanding power dynamics and personal investment in addressing sustainability challenges in impoverished neighborhoods is highly important [
22]. A mixed use promotes social interaction and inclusion [
23], and the need for a combination of social sustainability aspects in urban planning enhances local identity [
24].
2.3. Developing Sustainable Indicator Model for Sustainable Neighborhood Assessment
The highlighted challenges, in
Table 2, were next corresponded with identified indicators from the selected NSA.
Table 2 also summarizes the list of twenty-one sustainability indicators that are used for the third phase—the analysis of local Palestinian neighborhoods. The selection of sustainable indicators from the NSA tools was based on the themes of challenges and needs for Palestinian neighborhoods. Though indicators are similar between one sustainable assessment tool and another, this study considered NSA reference with an indicator of the highest weight. The highest weight indicated a higher value, and thus more focused strategies for obtaining the associated indicator. The level of relevancy of the NSA tools to Palestinian needs was generated based on the number of chosen indicators.
The description, requirements, and accredited practices of the selected indicators were reviewed and reflected in the assessment of local neighborhoods to measure the sustainability level in accord with specific themes. This made the assessment reference-based and more strategically centric towards the defined parameters. The relevancy assessment of the different sustainability assessment tools to the Palestinian context showed LEED ND at the top with 12 indicators, followed by BREEAM COMM with 3 indicators, followed by PCRS and DGNB with 2 indicators each, and finally CASBEE UD and GMD with 1 indicator each.
The performance metrics used for the selected parameter to evaluate the sustainability of the neighborhood were based on qualitative and quantitative indicators summarized in
Table 3. The performance measurements for each indicator were conducted through different methods (depending on the indicator) to calculate the performance metrics, including but not limited to the following:
Field work measurements and calculation;
Software simulation (Urbano tool and GIS) (Urbano v1.1, GIS: ArcMap 10.8);
Master plan analysis and examining applicable regulations;
International standards, e.g., height-to-street ratio.
Table 3 lists the selected indicators under their identified category and references from NSA tools. Listed indicators in the table were assessed qualitatively and quantitatively in the selected neighborhood in Nablus (Al-Mreij). Suggested reforms and guidelines for local sustainability were directed to the addressed indicators. Conductance of the assessment was based on several methods, where the use of method depended on the requirements needed for assessing each indicator.
Table 3.
Developed framework of assessment indicators for possible sustainable Palestinian neighborhoods.
Table 3.
Developed framework of assessment indicators for possible sustainable Palestinian neighborhoods.
| Rating System | Indicators |
|---|
| Assessed Indicators Taken from LEED ND | - -
Smart Location and Linkage (Preferred Location, Access to Quality Transit, Housing and Job Proximity) - -
Neighborhood Pattern and Design (Compact Development, Mixed-Use Neighborhood, Visitability and Universal Design, Reduced Parking Footprint, Walkable Streets, Connected and Open Community, Access to Civic and Public Space) - -
Green Infrastructure and Buildings (Heat Island Reduction, Building Reuse)
|
| Assessed Indicators Taken from BREEAM COMM | - -
Social and Economic Wellbeing (Demographic Needs and Priorities, Inclusive Design) - -
Land use and Ecology (Landscape)
|
| Assessed Indicators Taken from PCRS | - -
Integrated Development Process (Integrated Development Strategy) - -
Livable Communities (Safe and Secure Community)
|
| Assessed Indicators Taken from DGNB UD | - -
Economic Quality (Lifecycle Cost and Land use efficiency)
|
| Assessed Indicators Taken from GMD | - -
Material and Waste Management (Minimize Cut and Fill-in Earthworks)
|
| Assessed Indicators Taken from CASBEE UD | - -
Environment Resources (Rainwater Utilization)
|
The established framework was used to evaluate the current situation and to give recommendations. The following methods and tools were used:
Fieldwork and observations.
Secondary resources (PCBS, Geomolg, Cadmapper. Snazzy Maps).
Calculating the indicator of density was assessed based on attaining specific numeric values.
Three-dimensional modeling and mapping.
Supporting tools (Polymer and google sheet templates).
Generative tools: Urbano in Grasshopper, Open Street map.
Different tools were used in the analysis. Urbano is an analytical tool that uses built-in algorithms to measure the walkability and activeness of amenities and streets [
25], which may be integrated into the design process and the decision-making of urban environments [
16]. It integrates the fields of architectural design, sustainability, building performance simulation, and computational design [
26]. It was mainly used for measuring StreetHits, which resembles the accessibility and connection of streets, and Walkscore, which resembles walkability. Arcmap software (version 10.8, Esri company, Redlands, CA, USA) was used to generate mappings of collected data from Geomolg, and was used to generate buffer studies needed for indicator assigning requirements within specific areas. Rhinoceros was used for building the 3D model of the neighborhood, where some primary data were extracted from Cadmapper. Enscape, a synchronized real-time rendering tool, was used to export images of 3d models and diagrams. Polymer was used to build AI-generated dashboards of connected datasheets.
The research methods were applied to a selected neighborhood (Al Mreij Neighborhood). Al-Mreij neighborhood is considered one of the most well-known and active neighborhoods in the city. It contains 258 buildings distributed unequally among 22 building blocks. Among the 48 neighborhoods in Nablus, it is considered moderate in size: 418 hectares. It is generally active due to the landmarks it has; schools, local hospitals, shops, and the commercial streets connecting it. In acknowledgment of its strategic location being in the center, the availability of landmarks, its density, and its general transit activity, this case was selected to test its existing livability considering the aspect of its spontaneous planning, and whether this implies any level of sustainability.
3. Results
This part examines how the developed framework aims to assess local neighborhoods to investigate their sustainability spectrum. The results for the list of NSA indicators are presented as follows.
3.1. Smart Location and Linkage
3.1.1. Preferred Location
The criteria for a smart location for creating sustainable neighborhood developments mainly consist of reducing the effects of sprawl and creating more livable communities [
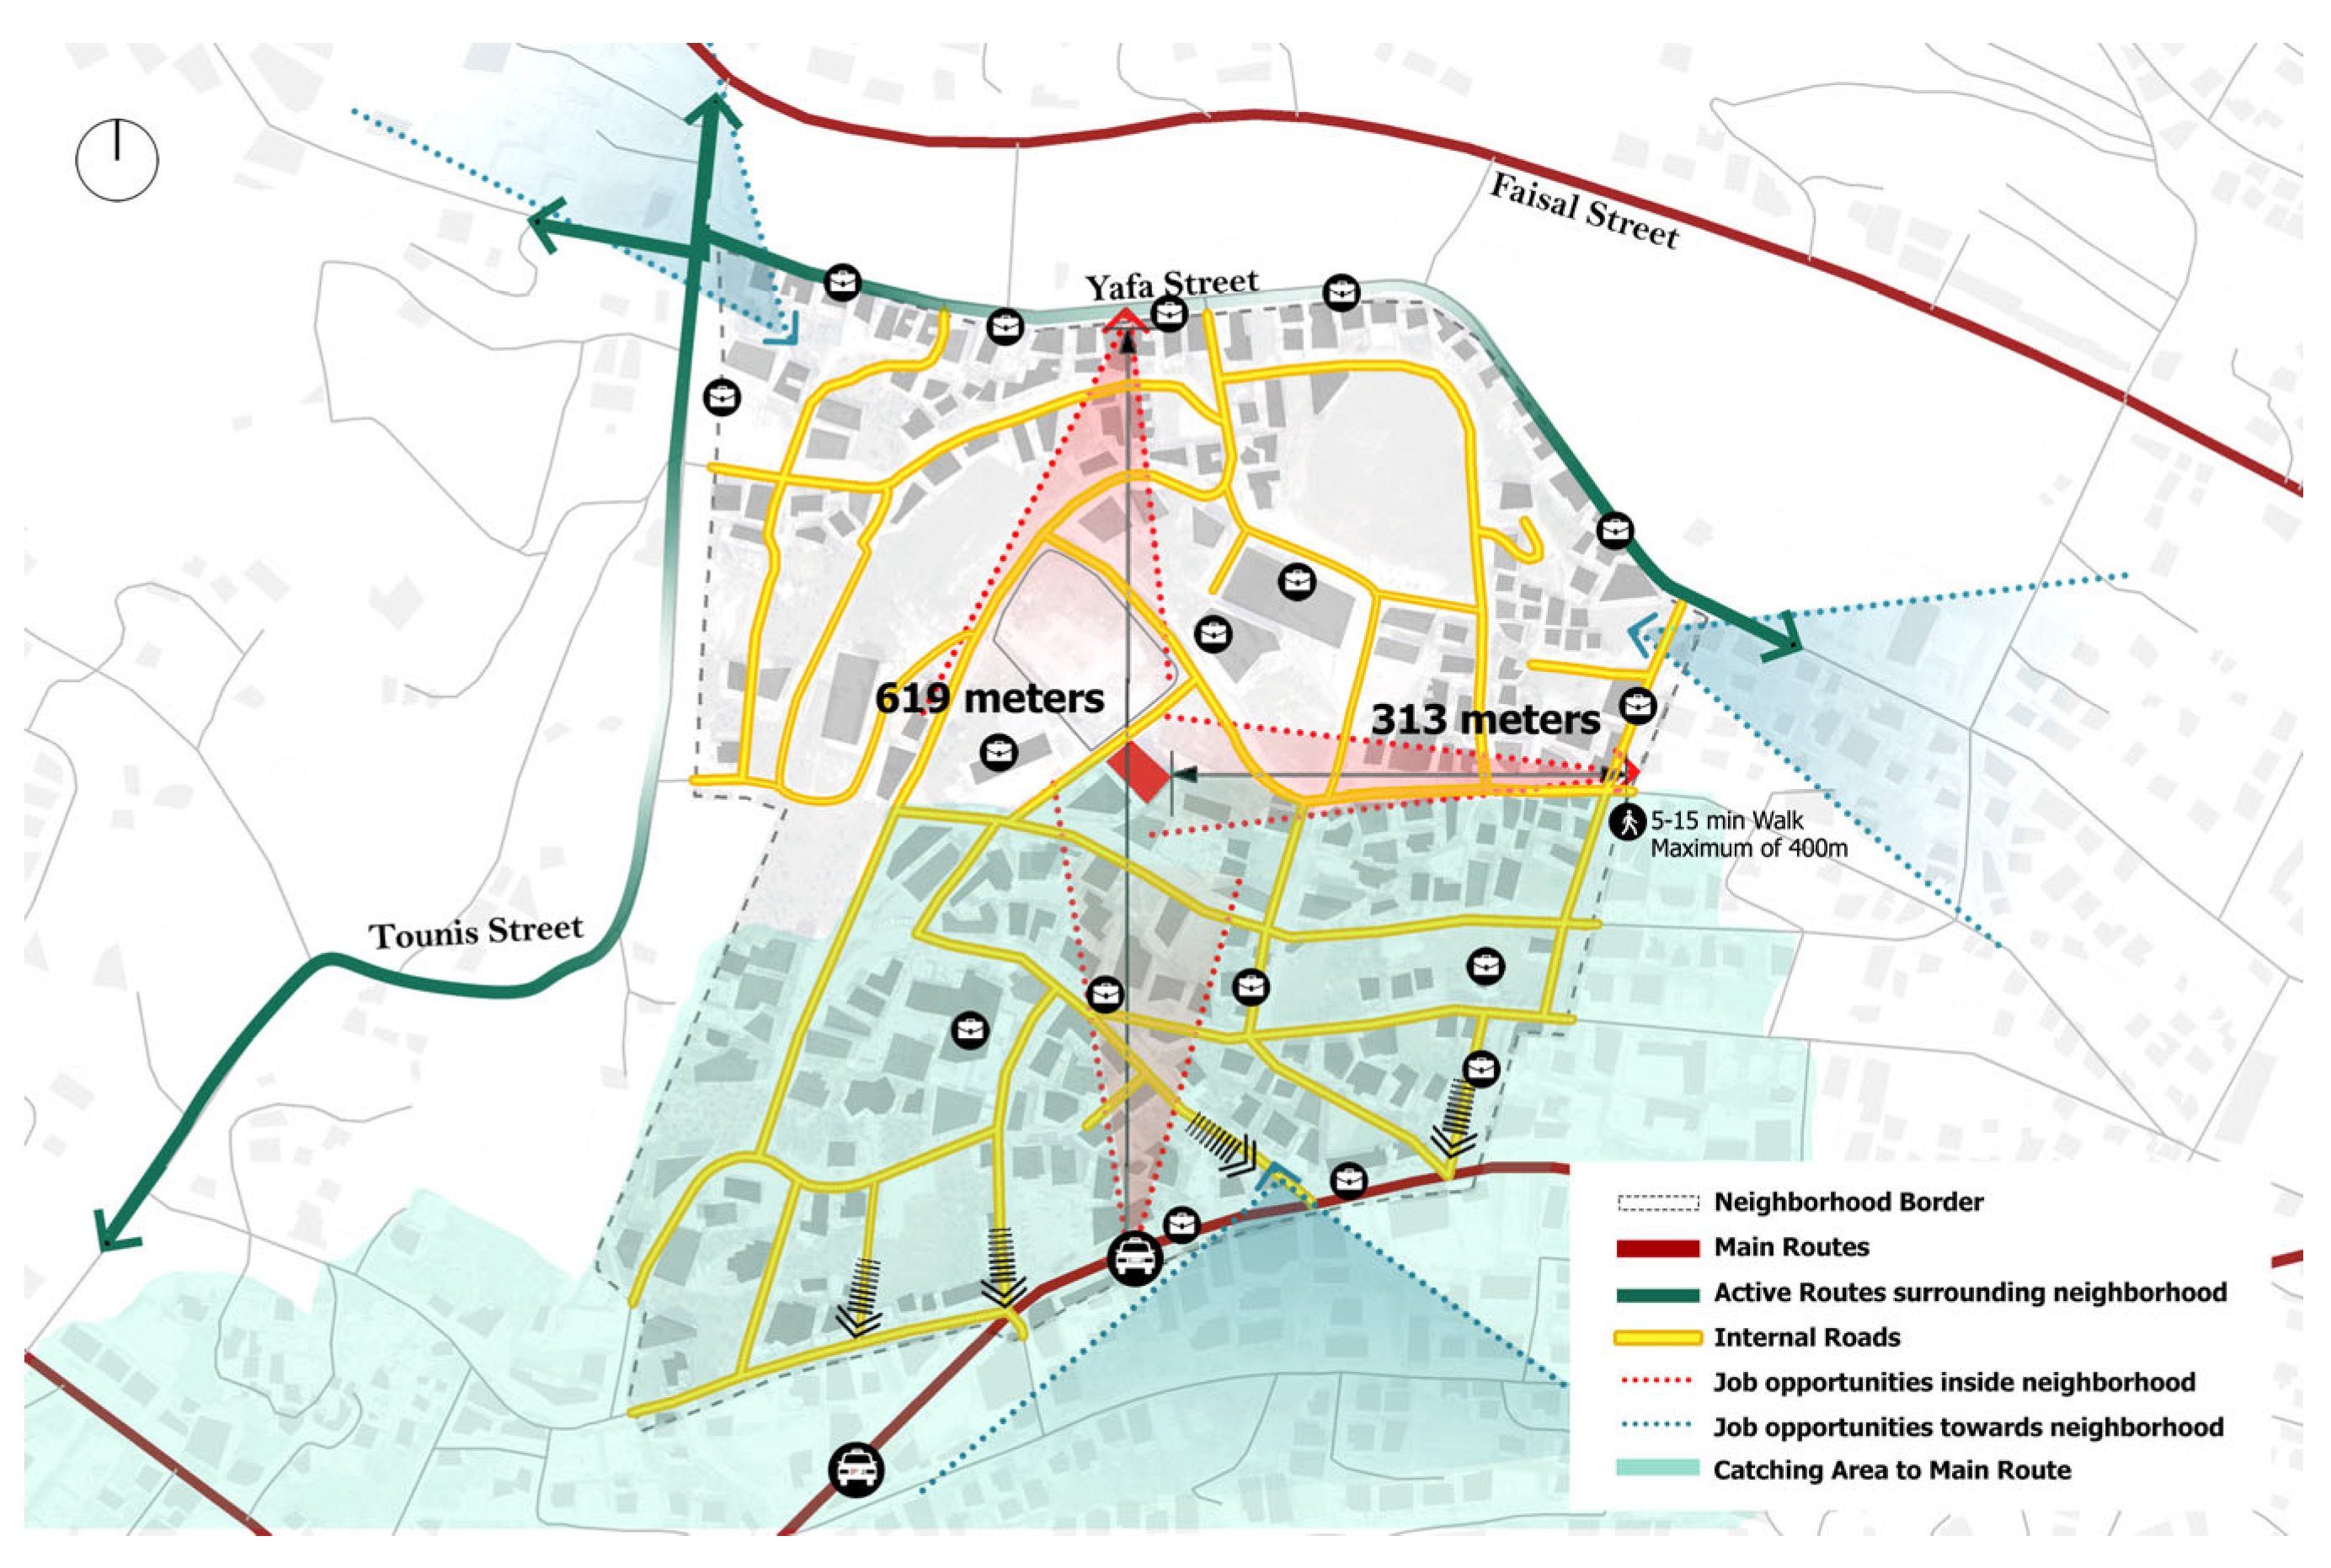
27]. Al-Mreij neighborhood sits towards the western commercial center of the city. It is generally classified as a site with good transit access due to its location being adjacent to two significant commercial streets in Nablus, Rafidea Street and Yafa Street, featured in
Figure 2. Al-Mreij neighborhood is strategically placed thanks to the inclusion of landmarks and its closeness to active and wide streets. These aspects help to maintain the social ties between people residing in the city, which causes the geographical location of Al-Mreij to be a dense urban district.
3.1.2. Access to Quality Transportation
The main intention of access to quality transit is to encourage development in locations shown to have multimodal transportation choices or, otherwise, reduced motor vehicle use, thereby reducing greenhouse gas emissions, air pollution, and other environmental and public health harms associated with motor vehicle use.
In the city of Nablus, the prevailing means of mobility are private cars and publicly shared cabs. It must be acknowledged that Al-Mreij neighborhood and the whole city of Nablus lack the infrastructure of diverse and developed public transportation. The only means of providing public mobility facilities are the use of shared cabs that are designated according to destinations. The evaluation of efficient transportation service accounts for whether the service is publicly accessible, accommodates multiple passengers, uses a fixed route, and is visible through transit maps or signage [
28]. Al-Mreij is close to two active streets: Faisal Street from the north and Tounis Street from the west. Both of these two streets are wide and have four street lanes that pass through some commercial landmarks, which makes them important in the transit circulation of public vehicles and destination passages. From the south, Al-Mreij is connected by one of the main streets, which experiences a consistent flow of public cabs. Rafidea Street is accessible from multiple internal streets and is notable in offering bidirectional service. Accessibility for residents from buildings closer to the center of those streets is challenging due to its topography. The duration of walking time is generally non-uniform due to non-uniform inclination of lands, patterns of streets, and inconsistent proximity of some internal streets to buildings.
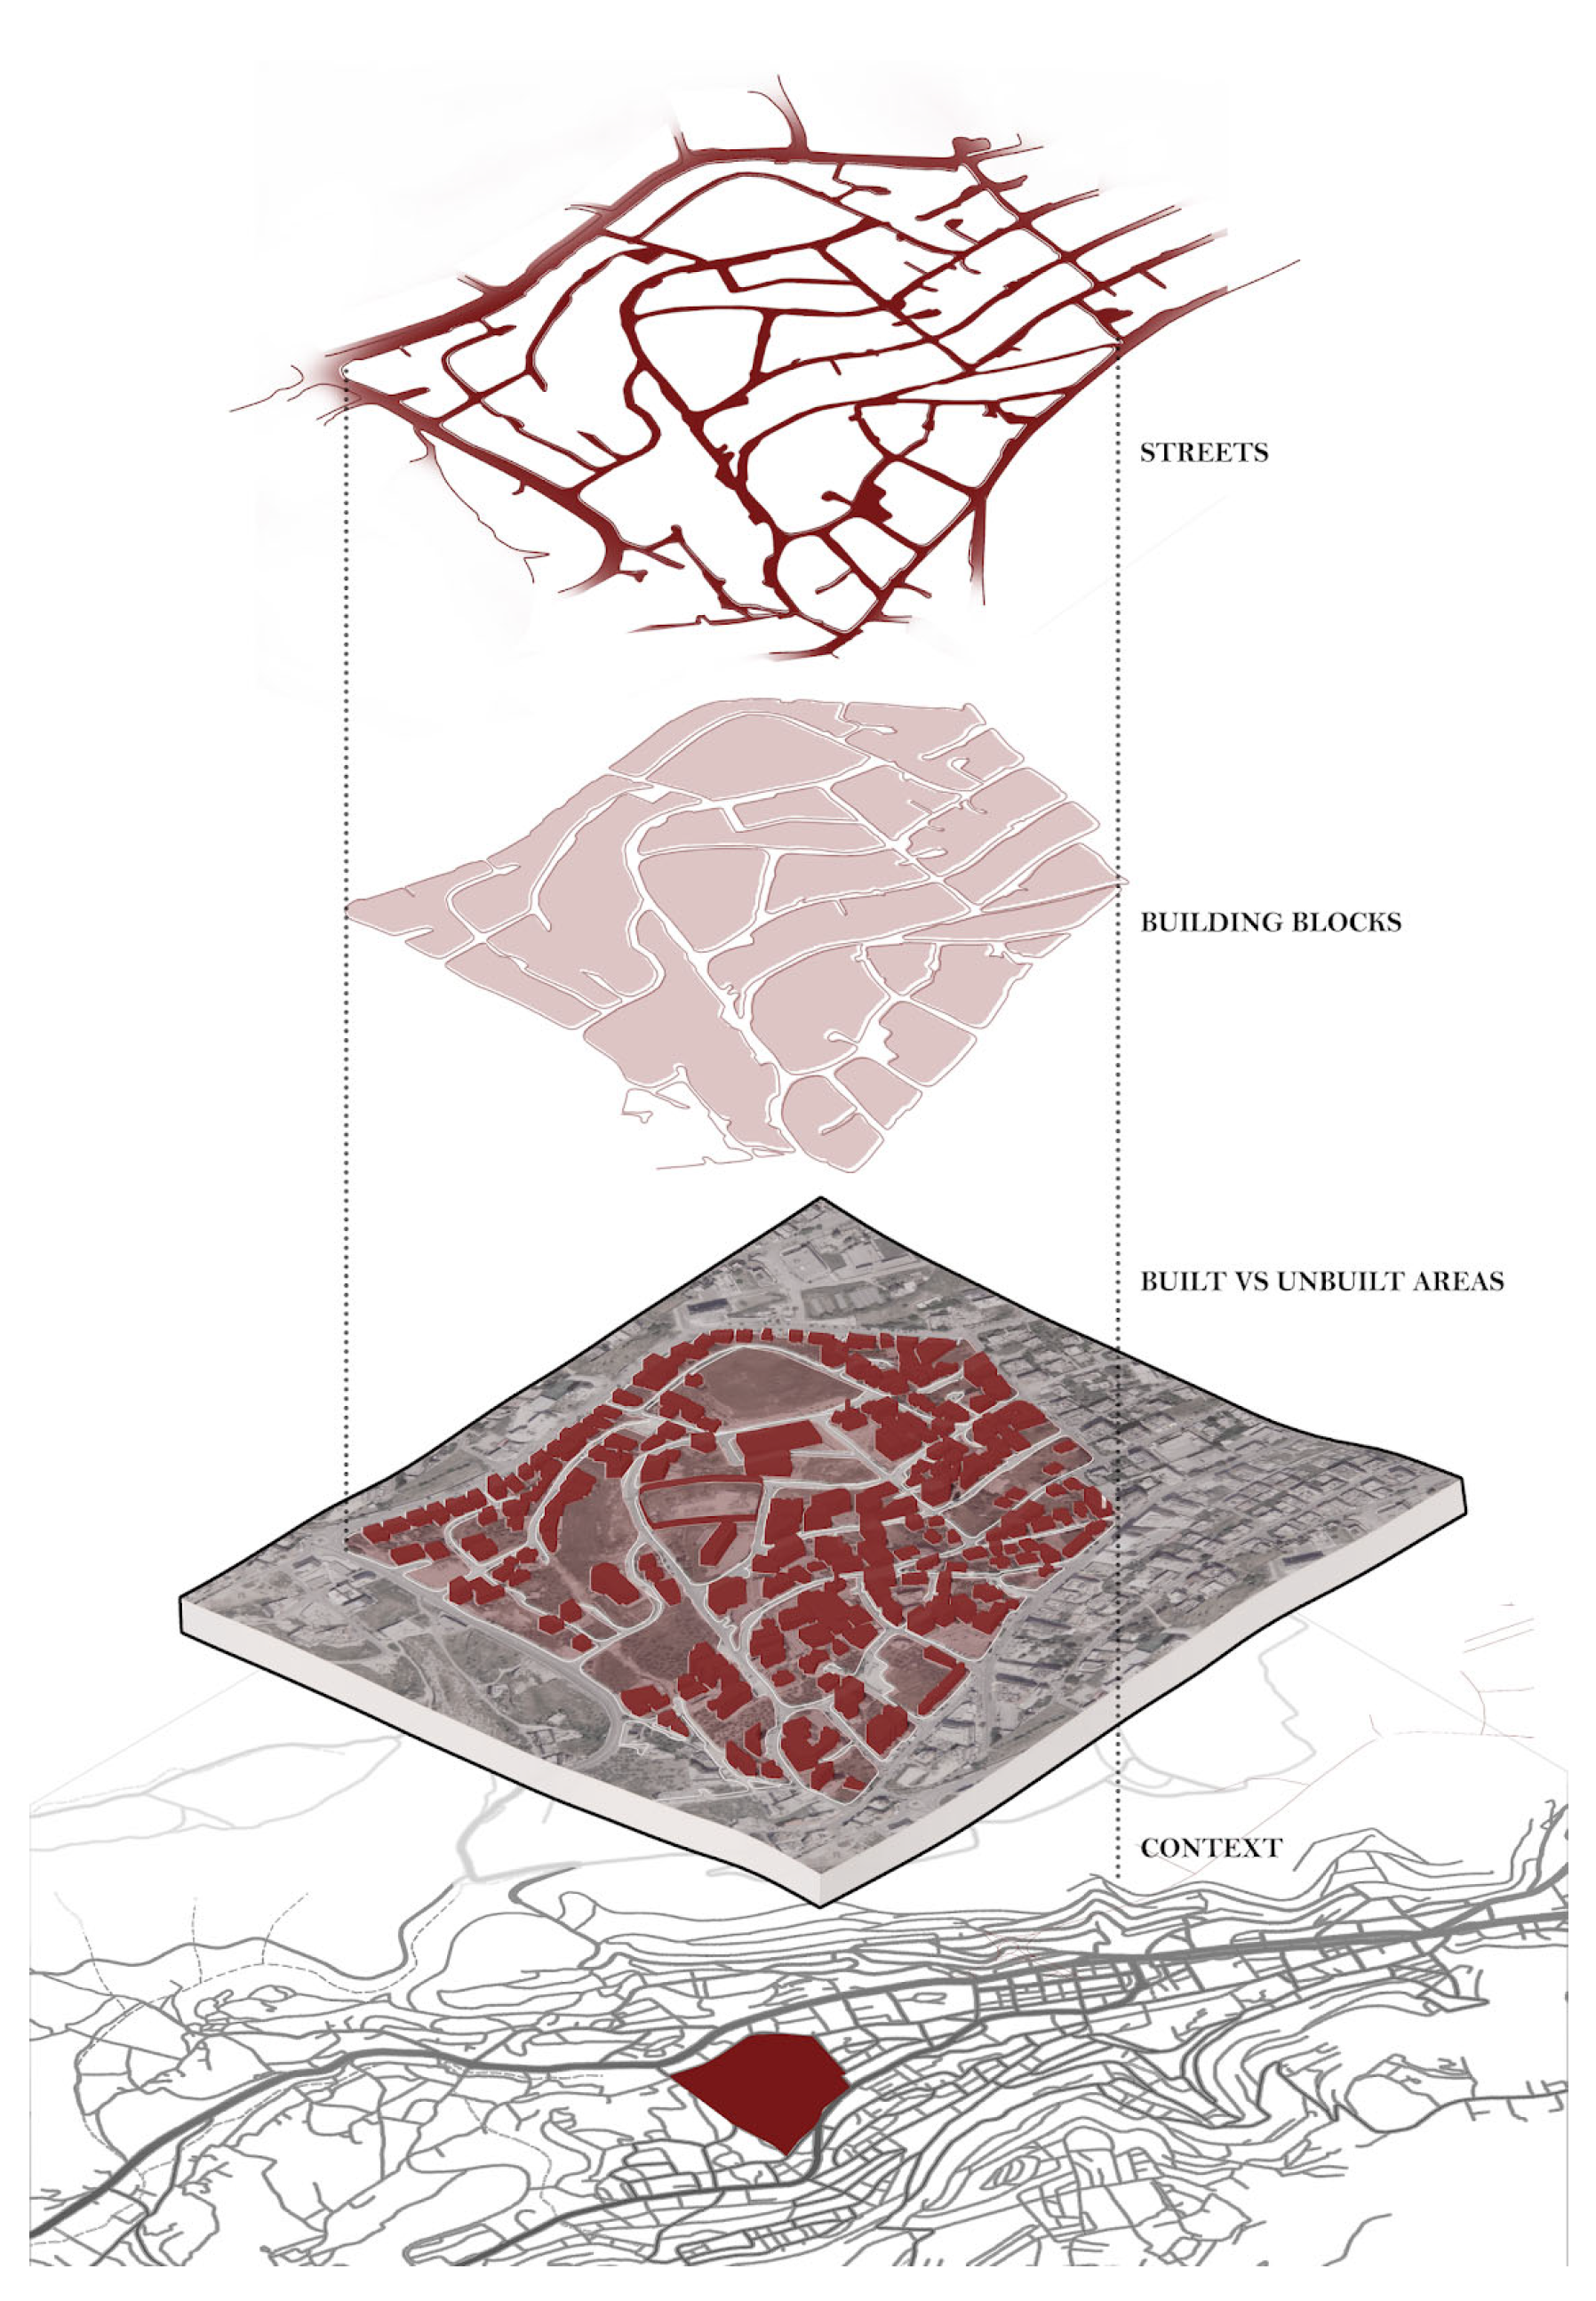
Street shape, street pattern, and street condition are strongly associated with facilitating residents’ access to the locations of transit-catching areas. Locally, the street systems in Al-Mreij neighborhoods follow irregular patterns. They cannot be identified as warped parallels because the relationship of the building distribution path to the street beside is what is parallel, not the streets to each other. Streets are closer to the classification of curvilinear modified rectangles, being altered by the non-uniform distribution of buildings, as seen in
Figure 3. The resulting pattern allows conditional accessibility from buildings to car-based streets. Street shapes in Al-Mreij neighborhood are organic and twisted according to the segmentation of built areas, land blocks, and topography. This may lead to longer trips and inconsistent pathways, though it may preserve the condition of the paved streets.
3.1.3. Housing and Job Proximity
This aspect intends to encourage balanced communities using a diversity of uses and employment opportunities. One of the quantitative validations of this aspect is the association of full-time jobs within 800 m (½ mile) of the center of the neighborhood, and the number of these jobs must be equal to or higher than the number of the dwelling units. Stimulating job opportunities can happen in two ways: either through mixed-use buildings or the existence of retail and single-floor shops. Part of measuring local job proximity encompasses an investigation of building frontages and whether they are active economically and socially or unused.
The calculated linear distance from the center of Al-Mreij to its boundaries is approximately 300 m. This indicates that estimated job opportunities are within 300 m or less if travelling from and to the center, and are within a maximum of 600 m from boundary to boundary, which satisfies the first part of the quantitative reference. On the other hand, it was very hard to count the number of offered jobs in the area; the maximum would be three shop frontages, if any, and the number of floors in buildings for job use is unstandardized. We estimated the low ratio of total jobs about dwelling units. Also, the quantitative reference does account for the location of internal streets and their relation to buildings or the inconsistency of accessibility to jobs impacted by topography.
Locations like schools and hospitals in the neighborhood provide profession-related jobs. Buildings opposed to or leading to active streets are active with job opportunities, as shown in
Figure 3. Mainly, the northern and southern boundaries of Al-Mreij are the most vibrant among the whole neighborhood, due to the spread of shops and retail. However, the regulations for owning a shop do not require the buyer to reside in the same neighborhood. Therefore, this means that the jobs created in the neighborhood might be employing the population of other neighborhoods and not necessarily creating jobs at a reasonable distance for the residents.
3.2. Neighborhood Pattern and Design
3.2.1. Compact Development
Expansion in the city of Nablus took place in both the vertical and horizontal directions. This expansion has massively affected urban and architectural schemes and raised the population density noticeably. Coupled with limiting sprawl, compactness is a concept that targets densification and rearranges existing densities. This comes along with promoting livability, walkability, and transportation efficiency, including reduced vehicle distance traveled. In one of the neighborhood sustainability assessments, residential components should be at a density of 7 or more dwelling units per acre (17.5 DU per hectare) of the buildable land available.
Inspections of the Al-Mreij neighborhood indicated that the 419 donum of the neighborhood (41.9 hectares) should include 733 dwelling units, according to the quantitative reference. The generated count was 2526 units according to values extracted from Geomolg, which is almost 3.5 times more than the number required. Since the estimated population is 12,630, the population density was 301.4/hectare. Theoretically, a dense neighborhood should be distinguished by urban design and architectural measures accompanied by such an urban phenomenon. A dense and livable neighborhood preserves enough setbacks, privacy, height, direction of openings, etc. These distinctions were not found in the fieldwork conducted.
3.2.2. Mixed-Use Neighborhood
A mixed-use neighborhood is where diverse land uses are embedded with well-accessible and regional centers to encourage daily walking, biking, transit use and car-free living. Investigating this aspect showed that 50% of neighborhood dwellings should be within ¼ mile (400 m) walking distance, and from 4 to maximum 20 uses. Uses in each use type can be repeated only twice.
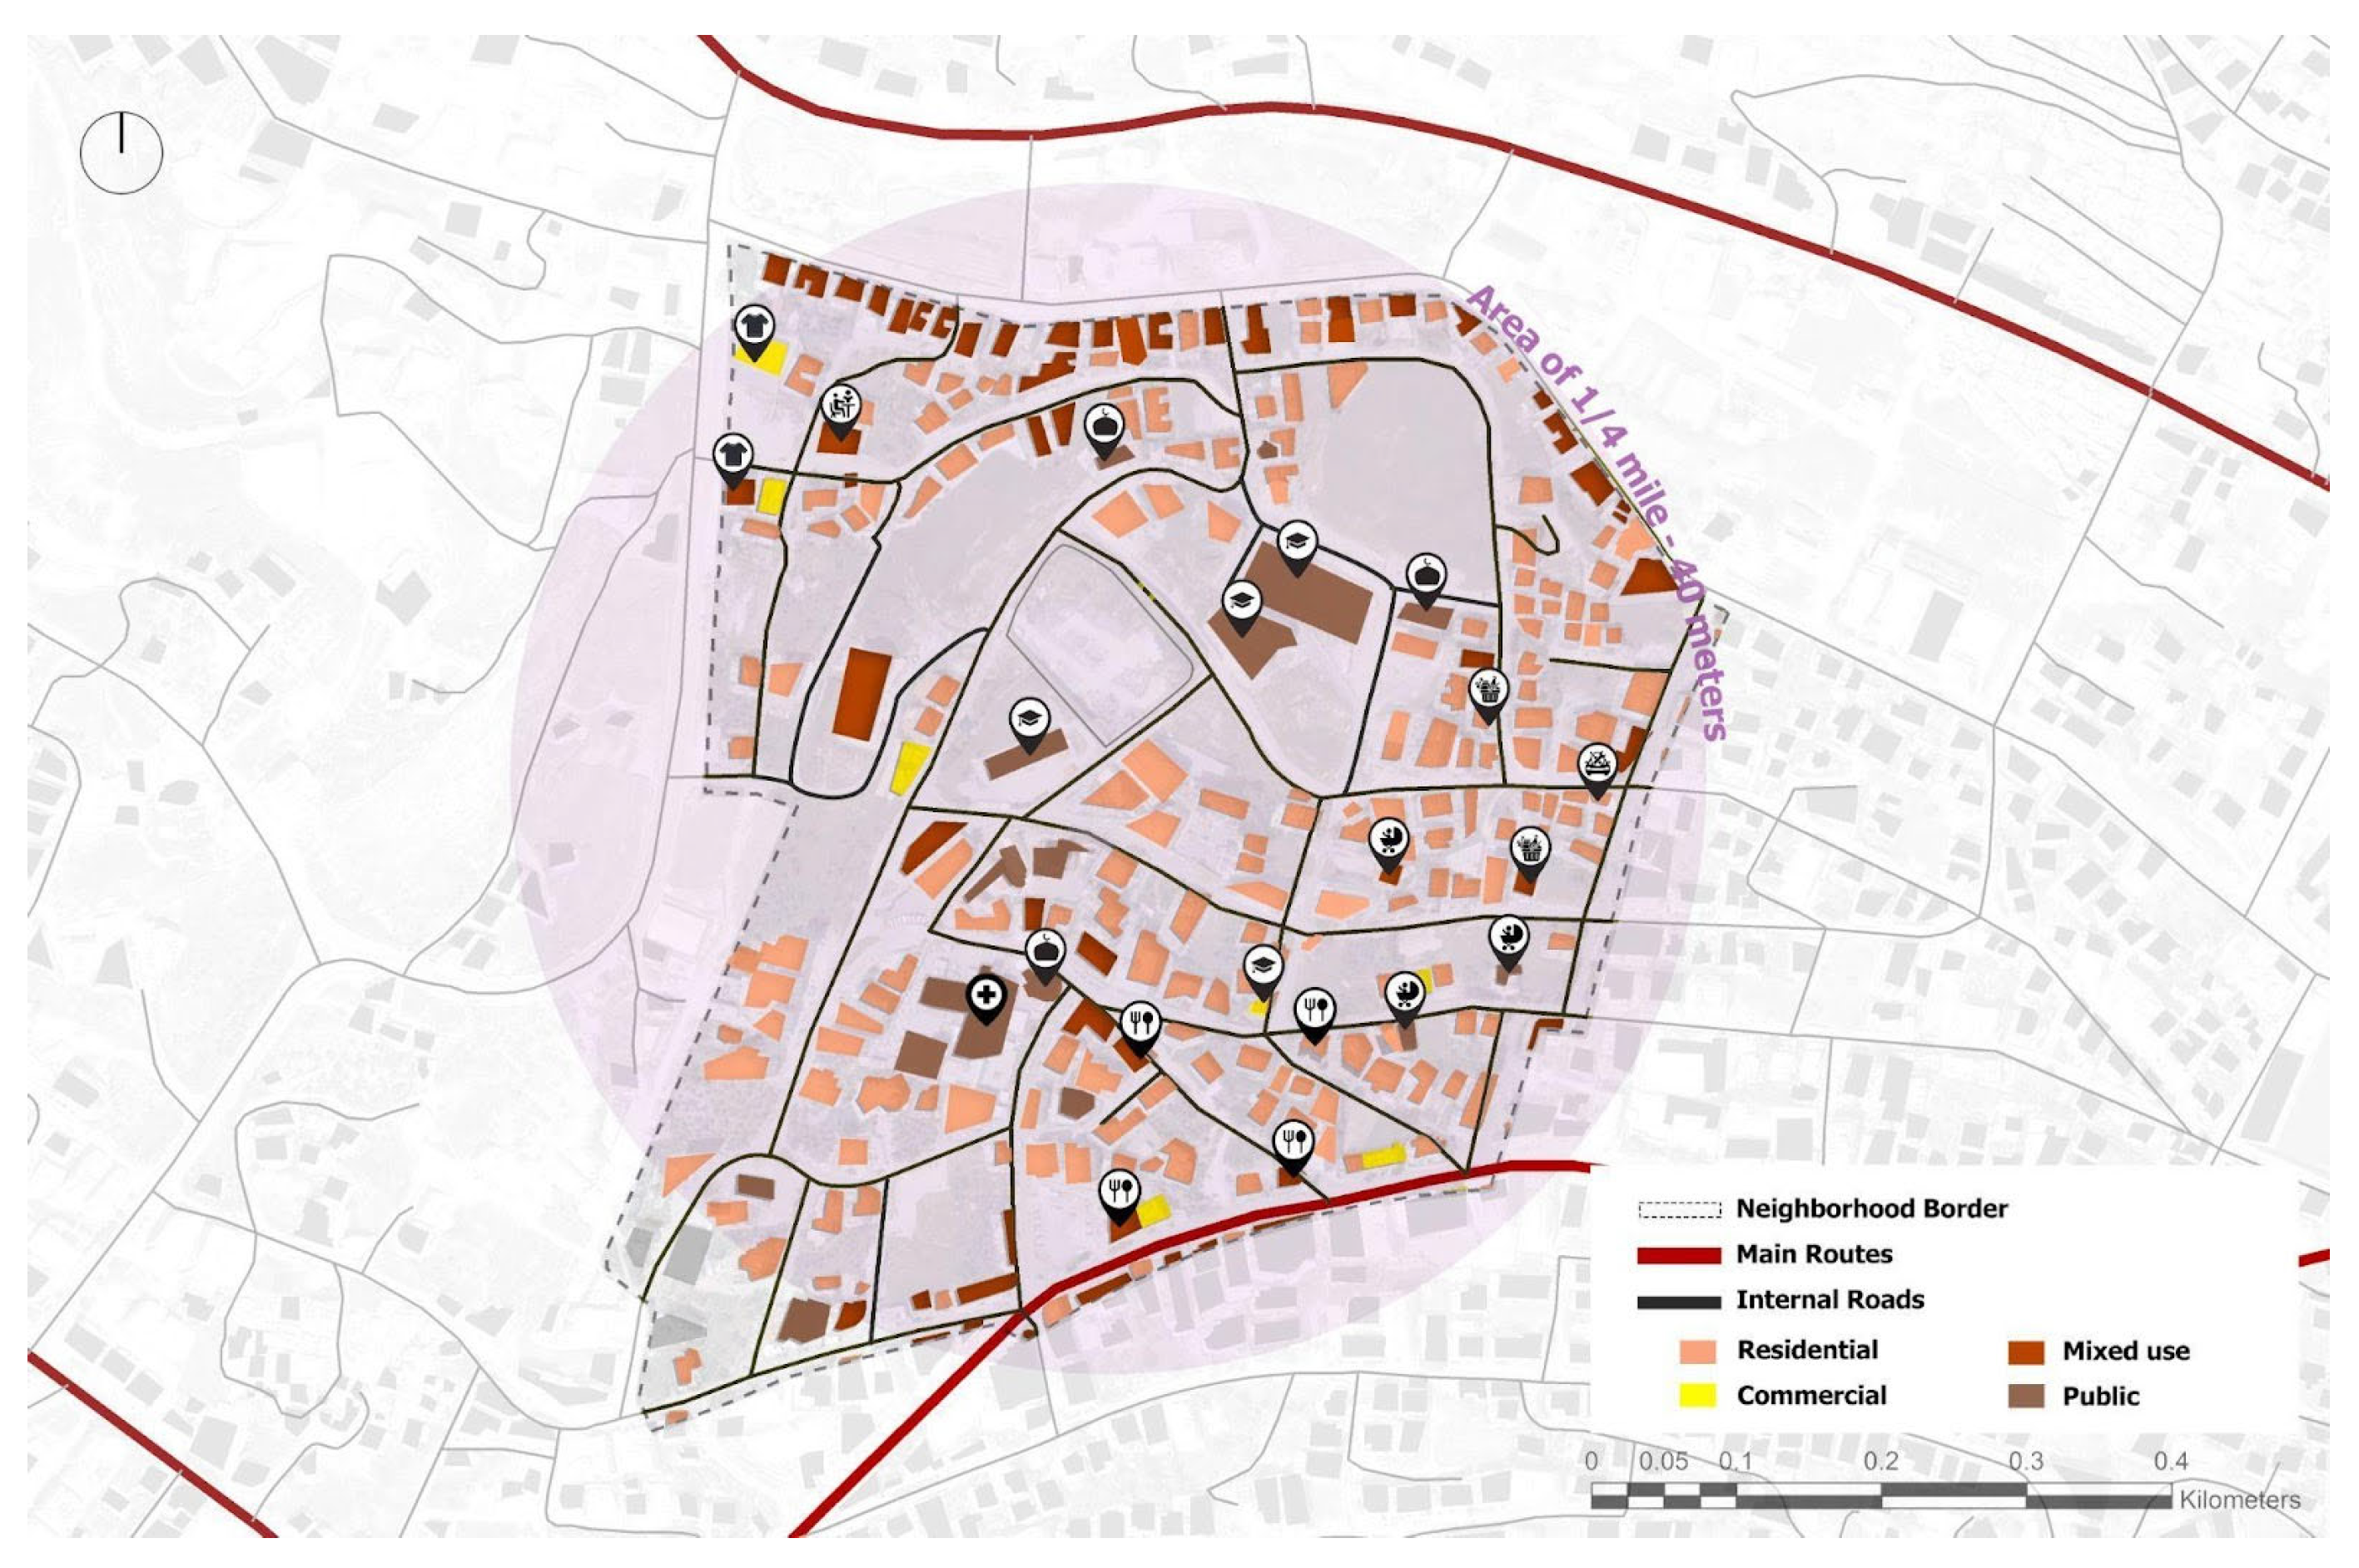
Al-Mreij neighborhood includes diverse building use types, including residential buildings, mixed-use buildings, public buildings, and commercial buildings. The count of service types was listed as follows: three kindergartens, three schools, more than four restaurants, more than three clothing stores, two hospitals, more than three mosques, one social forum, one laboratory, more than four grocery stores, one electronics shop, and one car maintenance, as seen in
Figure 4. The total was 18 (considering the count of 2 for those exceeding more than two locations of the same use type).
The creation of a compacted community has the same benefits as having a diverse community. High densities bring in higher service rates and, therefore, more diverse service types. Those different service types are addressed to meet the diverse needs of a population from diverse age groups, genders, education, financial statuses, and other socioeconomic distinctions. Building uses indicate whether this diversity is embraced in the first place and whether it is embraced sufficiently and equally. However, services are not distributed in coordination with each other. Similar uses can be found next to each other based on the choice of owners. This means that neither the distribution nor proximity to services is considered. Also, there is no specific coordination between building density and the type or the number of allowed shops, for instance. Some shops use a part of single-family housing, and others use the leveling floors of low- and high-density buildings.
3.2.3. Visitability and Universal Design
Visitability and universal design are mainly intended to make spaces comfortable for social interactions in terms of accessibility and usage. Guidance in implementing this factor is primarily directed towards the internal design and features of spaces, but it also stresses the availability of multiple housing typologies: single attached, single detached, and buildings of multiple dwelling units.
In the urban setting, the identification of neighborhood landmarks indicates a rise in the visitability of these locations by residents of the neighborhood, residents from nearby neighborhoods, and residents from other neighborhoods. Maintaining a good impression of a space boosts investment and the overall economic sustainability of a neighborhood. In Al-Mreij neighborhood, some landmarks exist, such as Rafidea Surgical Hospital, Talaee Al Amal School, Islamic elementary school, Nablus Businessmen Forum, well-known clothing stores such as Leopard and Springfield, a remarkable cafe for teenagers and young adults, the Arab Specialty Hospital, etc. It is noted that there are not many diverse communal spaces for women or elders.
3.2.4. Reduced Parking Footprint
This aspect intends to minimize the environmental harms associated with parking facilities, including automobile dependence, land consumption, and rainwater runoff, by assigning sufficient parking capacity and not exceeding it.
It was noticed that the majority of local parking is either on-street or off-street; not all residential buildings offer private parking. Some buildings assign underground floors for parking; others depend on the ground-floor area tied to the entrances; and others use the open area of the street adjacent to the building. The use of land for parking follows two types of patterns: formal and informal. A formal parking lot puts a rate of payment per hour for every car that parks (blanket parking), a pattern that is very similar to parking lots in the city center. Both informal and formal off-street parking lots in Al-Mreij neighborhood make use of open land (with no asphalt). An example of formal parking in Al-Mreij is located opposite Rafidea Street, seen in
Figure 5, which leads to mixed-use areas such as shops, offices, cafes, and residential components. It is mainly used during the weekdays and in the daytime by users of these areas.
Though parking lots help regulate car circulation and parking habits, their location generates benefits for their surroundings at a certain distance. Residents who park to access surrounding services would be making the best use of the lot if it were nearby. On the other hand, parking in the lot becomes unpleasant for those who are visiting services at a distance, as they have to walk for longer trips. In terms of the size of the parking area, it was estimated that the demonstrated example of a parking lot would almost replace two to three residential components. Environmentally speaking, this void brings better visibility and air circulation to the surrounding buildings. It also creates a balanced entity for controlling building compactness.
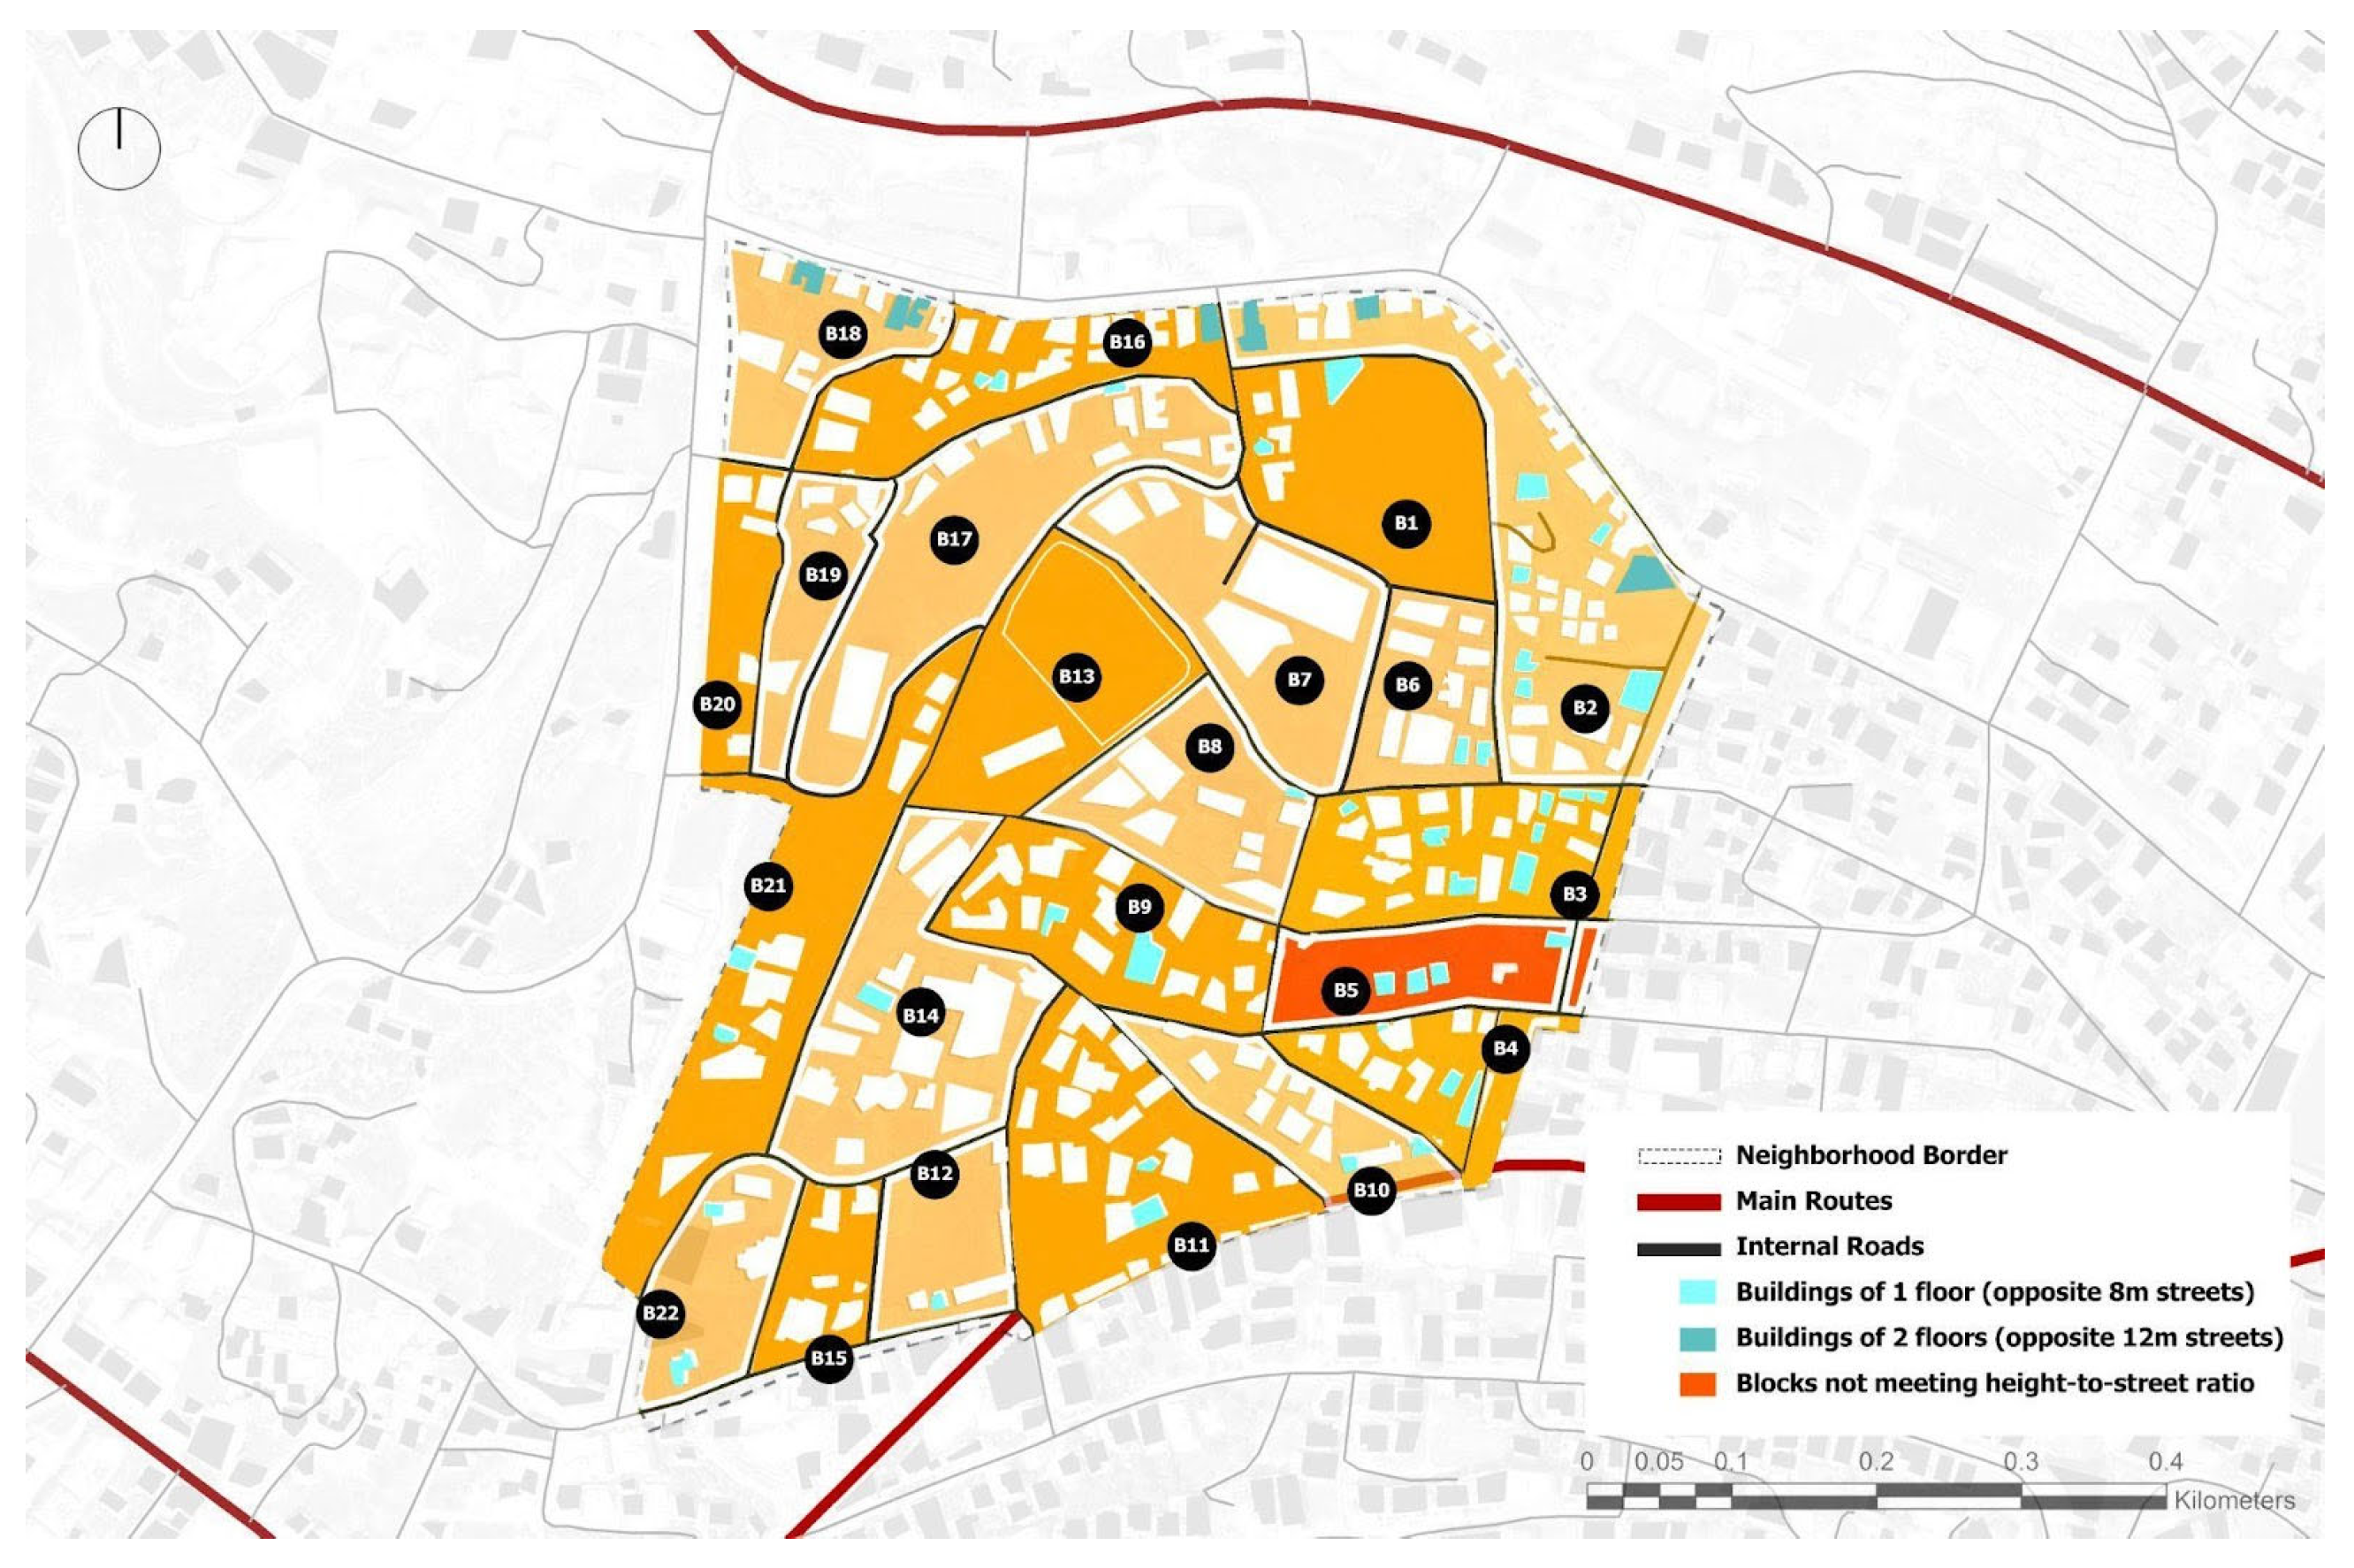
3.2.5. Walkable Streets
The identification of walkable streets includes lowering the distance traveled to destinations in the neighborhood. Additionally, it focuses on providing streets that are good settings for safety, comfort, and aesthetics. Thus, walkability depends on parameters such as the height-to-street ratio, street width, and sidewalk measures. According to one of the sustainable neighborhood assessments, 15% of the building blocks must have a minimum height-to-street ratio of 1:1.5. In Al-Mreij, the ratio of the building height to street width across one street is different due to the instabilities of building heights. Variations in building height exist among buildings next to each other or buildings opposite each other. It is hard to depict a frequency pattern or a cluster of buildings of a certain height duplicating, and coordinating with, other buildings in an adjacent block. To satisfy the exact ratio, buildings must be at a height of 5.3 m (approximately 1–2 floors) opposite an 8 m street and have a height of 8 m opposite a 12 m street (approximately 2–3 floors). According to the reference, one block does not satisfy the needed ratio, shown in
Figure 6.
In terms of walkability and comfort, sidewalks and all-weather paths are required to be continuous on both sides, and have widths of 2.5 m beside retail and mixed-use buildings and 1.2 m beside other buildings. In Al-Mreij, the sidewalk condition, pattern, and material are inconsistent, leading to inconsistency in and a fragmented experience of walkability. For instance, it was noted that some streets have a pattern of having sidewalks on both sides, other streets only have a sidewalk on one side, and others have no sidewalk on either side. Materials and colors vary among those patterns of sidewalks. Some have the indication of sidewalks and are dedicated for the parking of vehicles, such as red and white or black and white sidewalks, and other sidewalks are tiled, which gives more comfort for walkability. The condition of sidewalks differs from one street to another without regard to the specific building usage, location, or sidewalk width. While sidewalks beside schools are higher and in better condition, public places such as mosques lack sidewalks at the entrance. Not all of these sidewalks are continuous, and neither are consistent in condition and width.
Walkable streets are also safe streets. Urban signage and the inclusion of street details such as crosswalks are necessary for the evaluation of residents’ movements within streets. Lighting features are needed for the safety of walking and driving residents. The local fieldwork noticed a general lack of crosswalks within streets and around intersections.
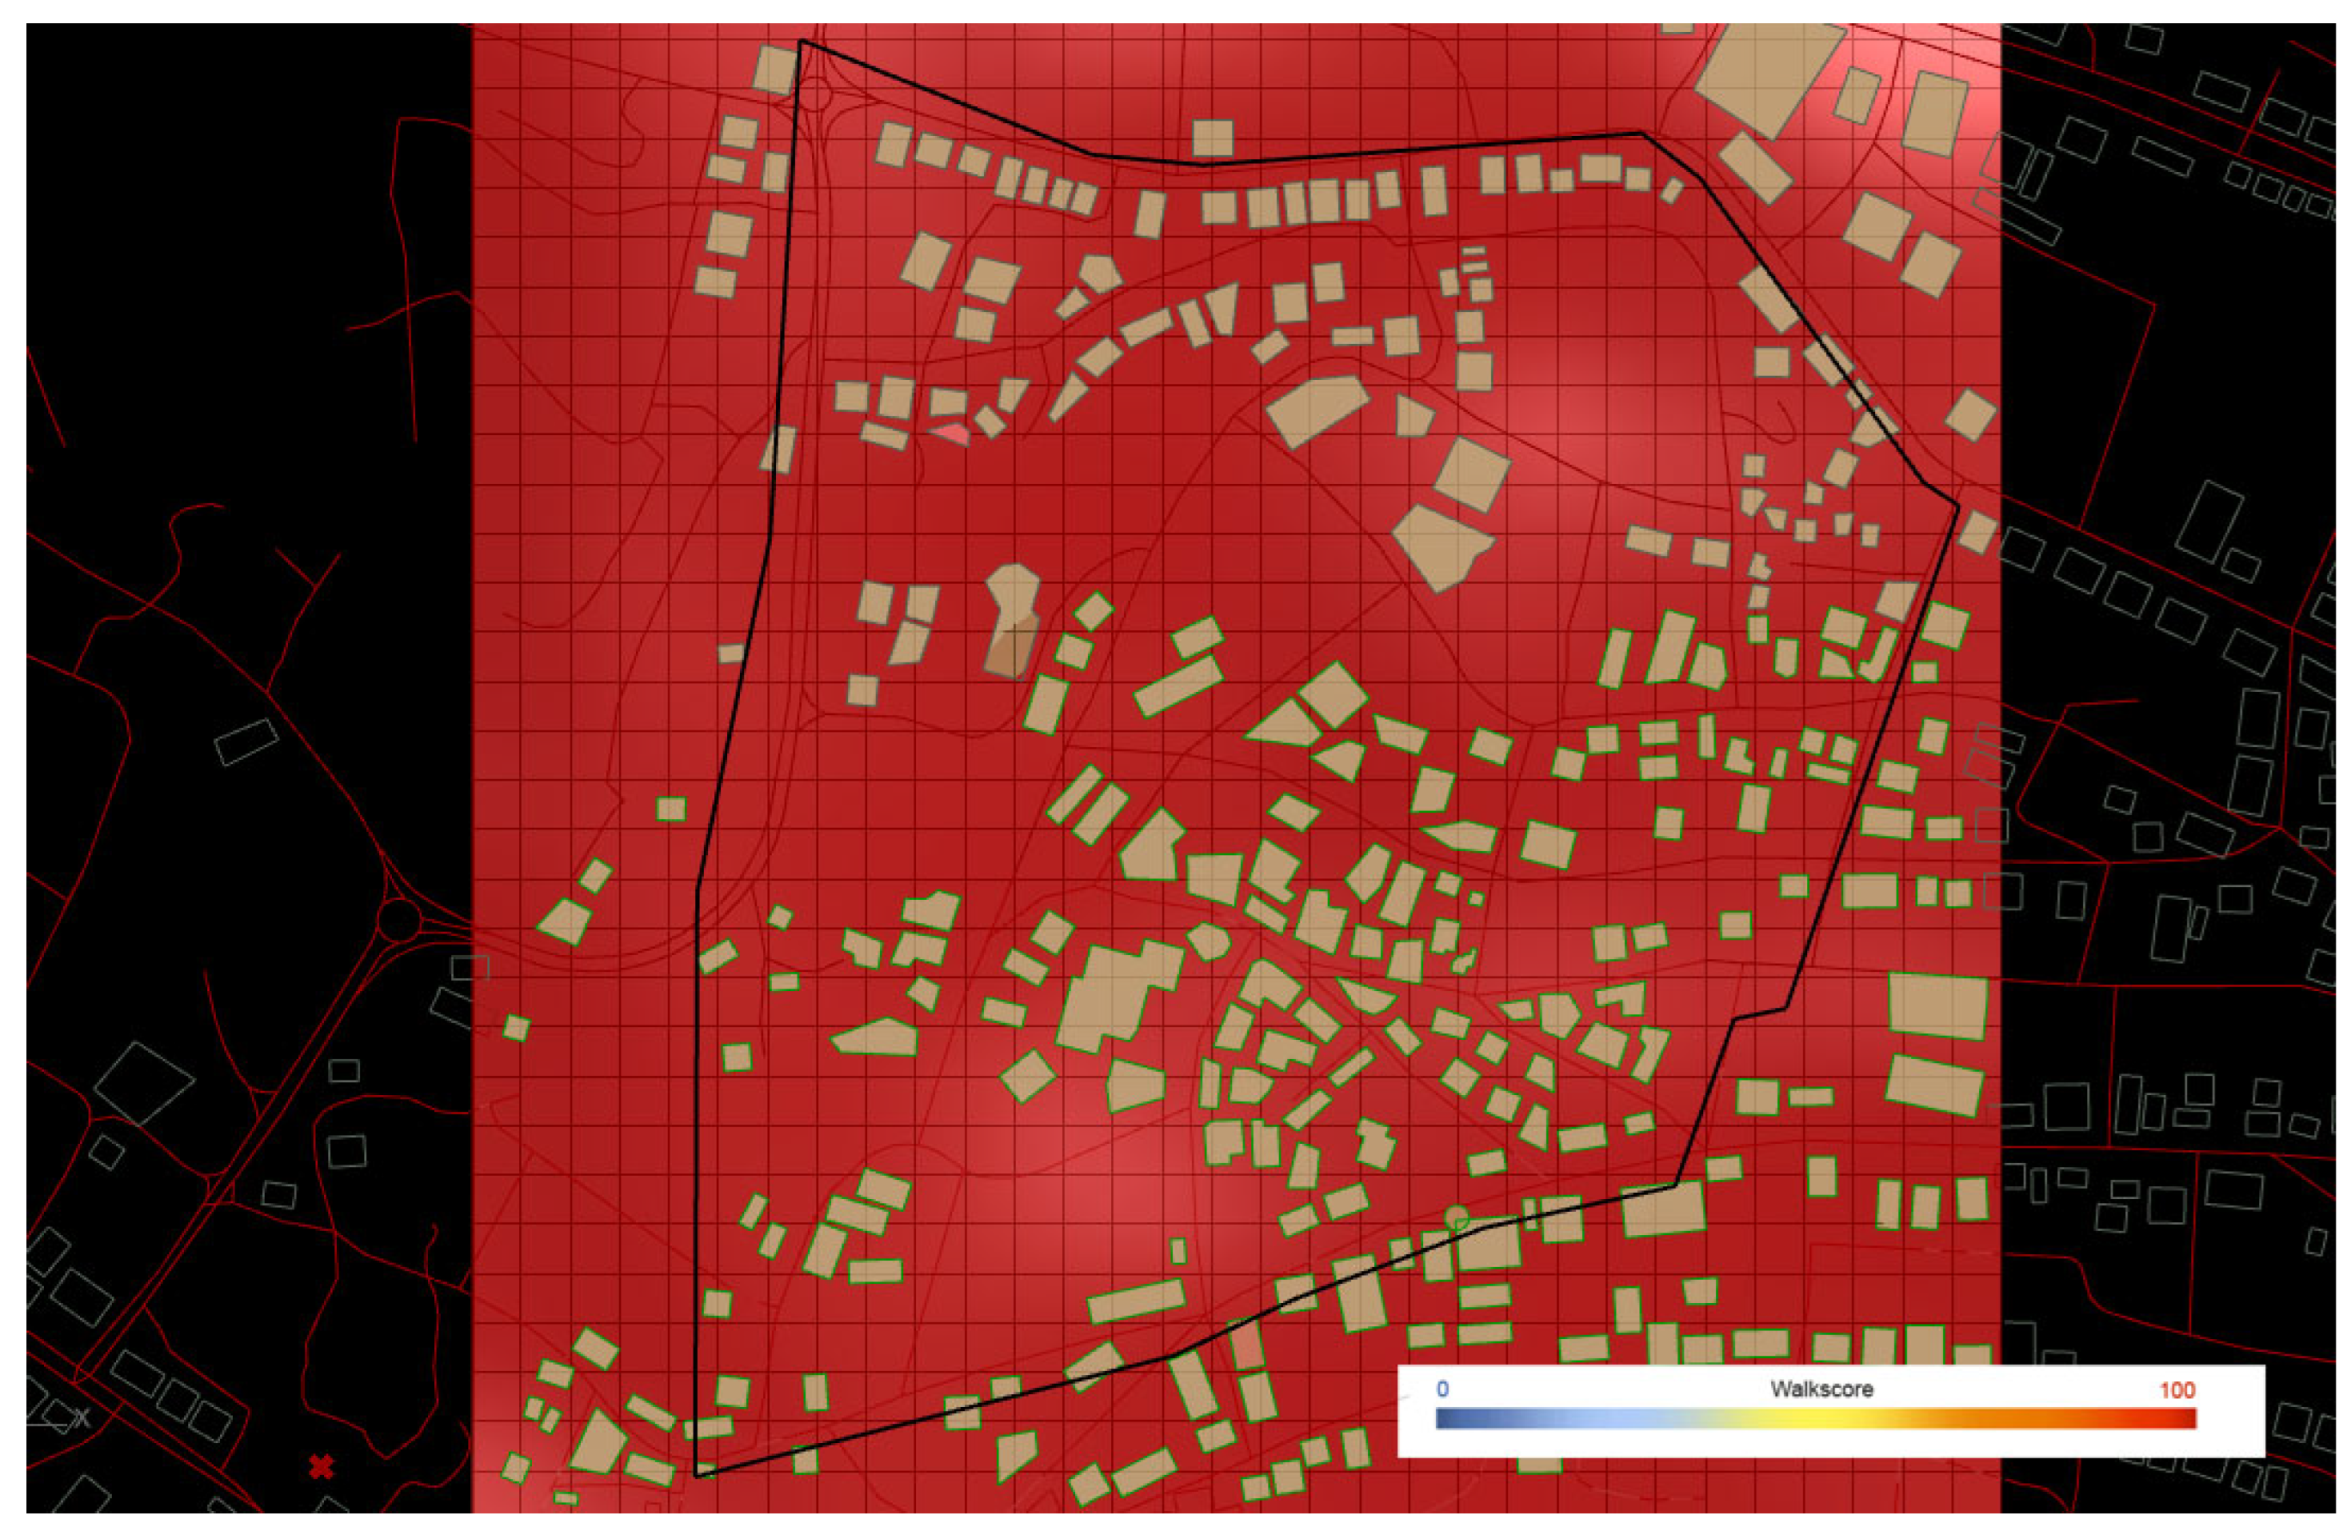
Additionally, results from the Urbano tool showed that the walkability scores of neighborhood buildings were fairly the same, probably due to the scale of the neighborhood. In comparison with the global score of walkability, Al-Mreij scored 22.25 out of 100, with buildings rendered in green according to the legend spectrum. This numeric result proves the observed qualitative measures of walkability in the neighborhood. Results were extracted from the streetscape quality and the analysis of street hits and amenity hits. The highest values of walk score are indicated in red or orange, and the lowest values of walk score are visually depicted in blue, as seen in
Figure 7.
Since walkability is highly associated with topography, the aspect of having the shortest distances to services depends on the difference in topographic levels between the locations of amenities. Overall, Al Mreij neighborhood is not flat. Each block is either higher or lower in level than the surrounding blocks. Hence, walkability is subject to the distance traveled from one block to another and whether there are any shortcuts through stairs.
3.2.6. Connected and Open Community
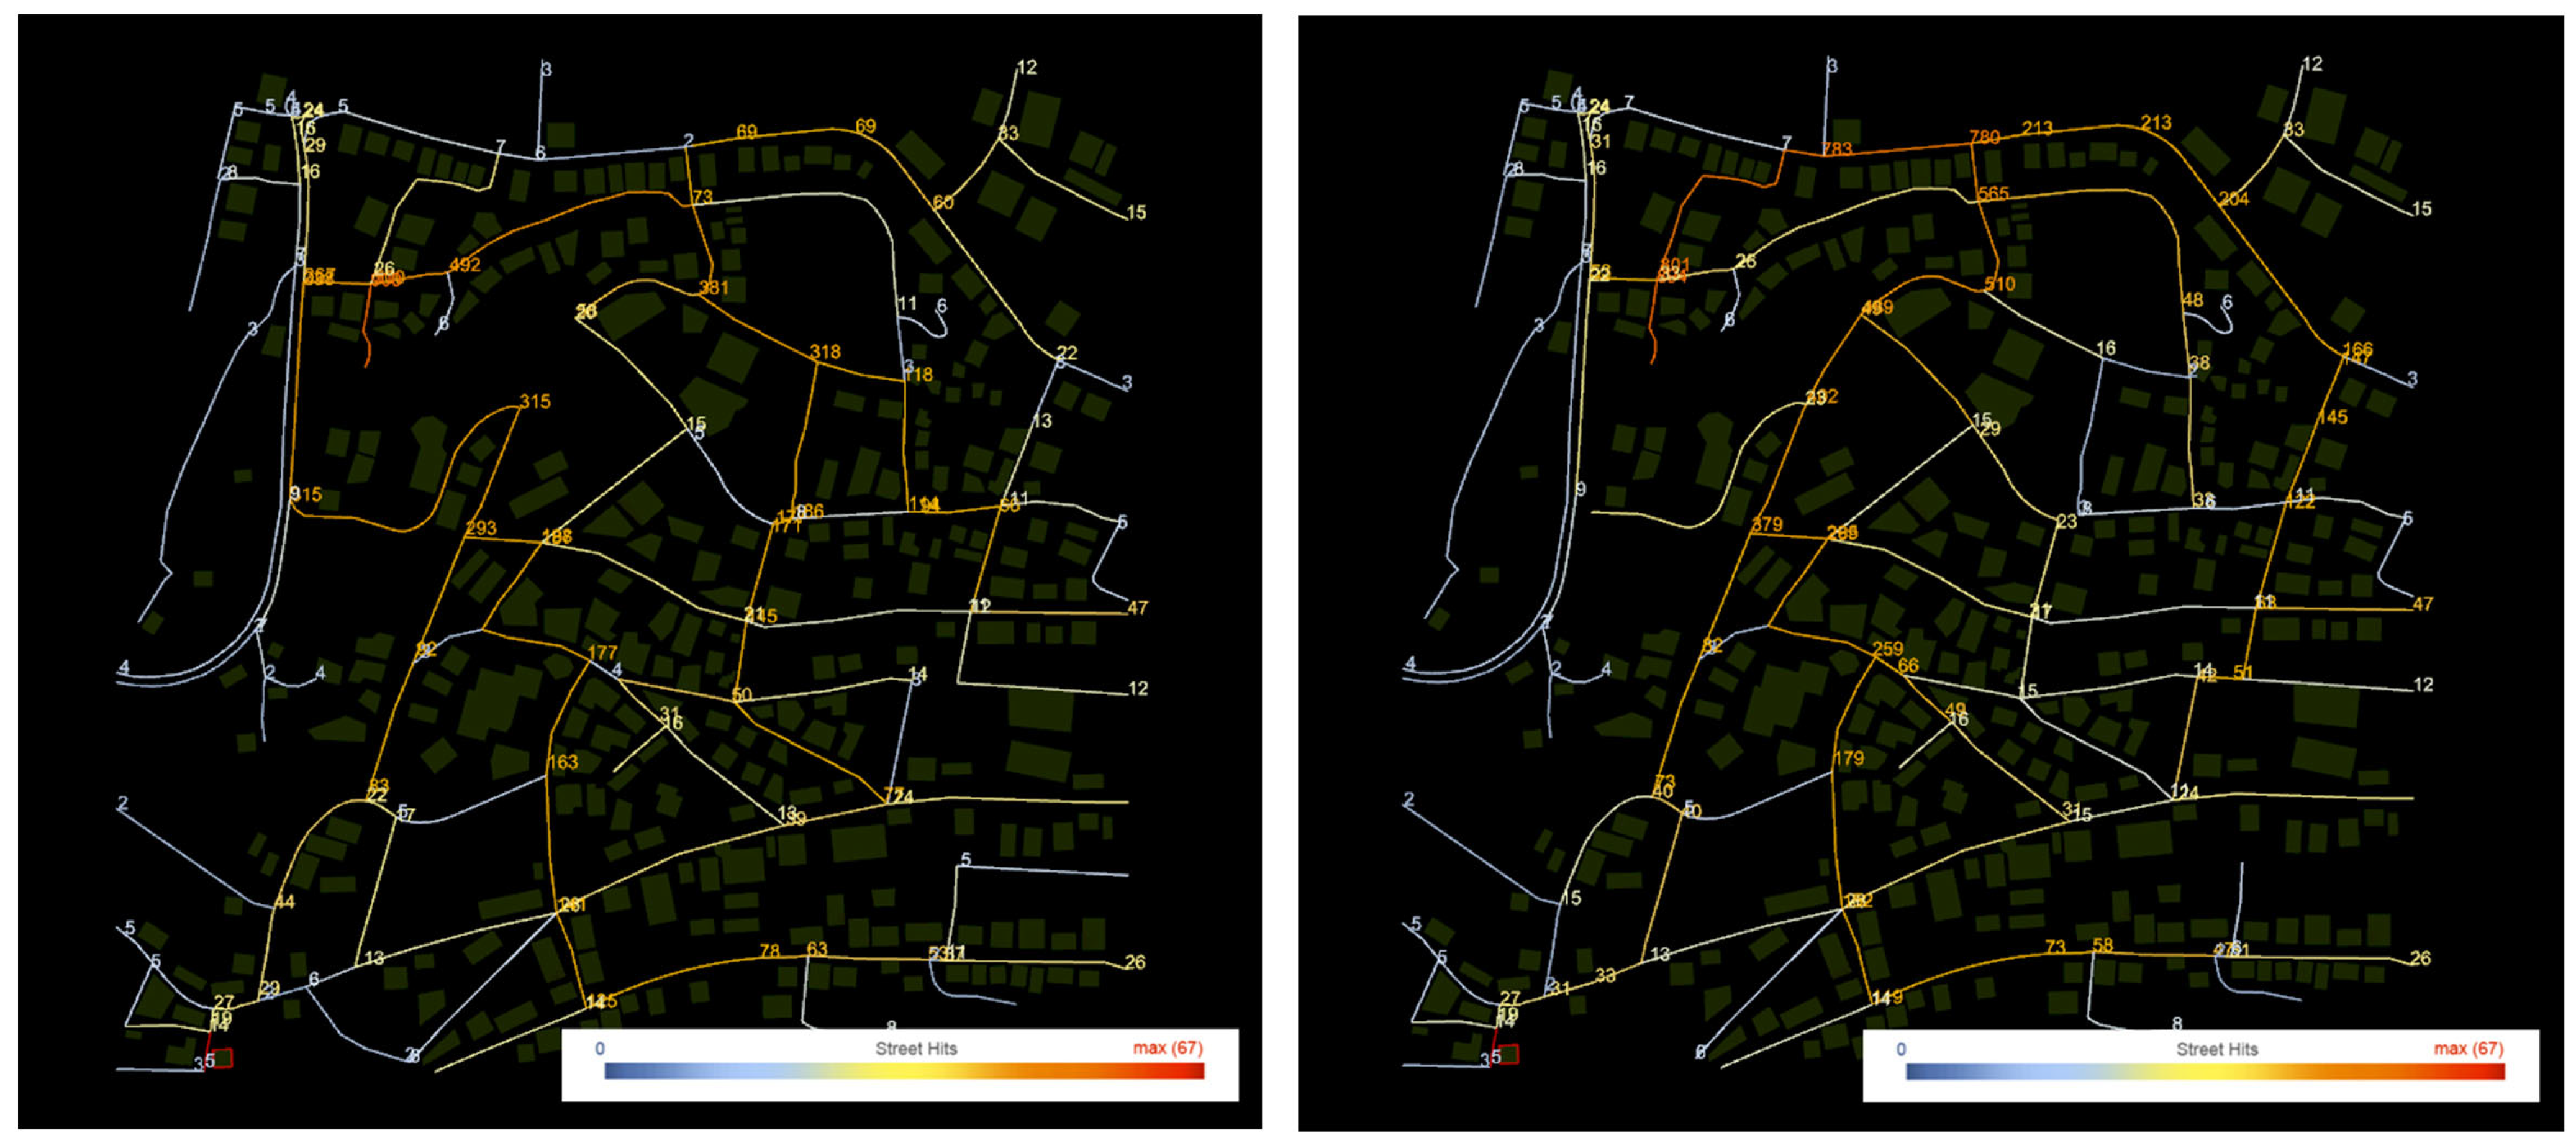
Connected streets refer to the experience of accessibility and walkability in neighborhoods. They refer to promoting transportation efficiency and encouraging public physical activity. In a quantitative sustainable context, internal connectivity requires preserving 54 intersections per square kilometer, and the circulation network is required to be open for public use, with no gated streets. Surrounding connectivity requires at least 35 intersections per square kilometer or ¼ mile (400 m). Al-Mreij neighborhood is 409 donum (0.409 square kilometers), which requires 22 intersections to satisfy the numeric requirement. The neighborhood has 23 internal intersections, which satisfies the needed number of intersections.
The results of connectivity testing using Urbano showed a range of different values on the street hits. For the pedestrian score, the lowest values, indicated in blue, referred to a couple of short and internal streets, and tertiary intersections. On the other hand, the highest values, indicated in red or orange, were noticed in continuous streets and around landmarks, as seen in
Figure 8. The majority of streets in Al-Mreij were orange, which refers to moderate street scores in the neighborhood. Another noticeable result was the inconsistency in values of street segments. In comparison, street scores were higher for the simulation of car transit. The highest score was related to Yafa Street.
3.2.7. Access to Civic and Public Space
This aspect highlights the use of open spaces close to work and home to sustain a healthy and social neighborhood. It specifies that a 1⁄6 acre (675 square meters) square, park, or plaza should be located within 400 m walking distance. The fieldwork conducted in Al-Mreij did not find any available open space used for recreation, seating, or outdoor gatherings. Though the neighborhood includes open spaces, they are not used by the public.
3.3. Green Infrastructure and Buildings
3.3.1. Heat Island Reduction
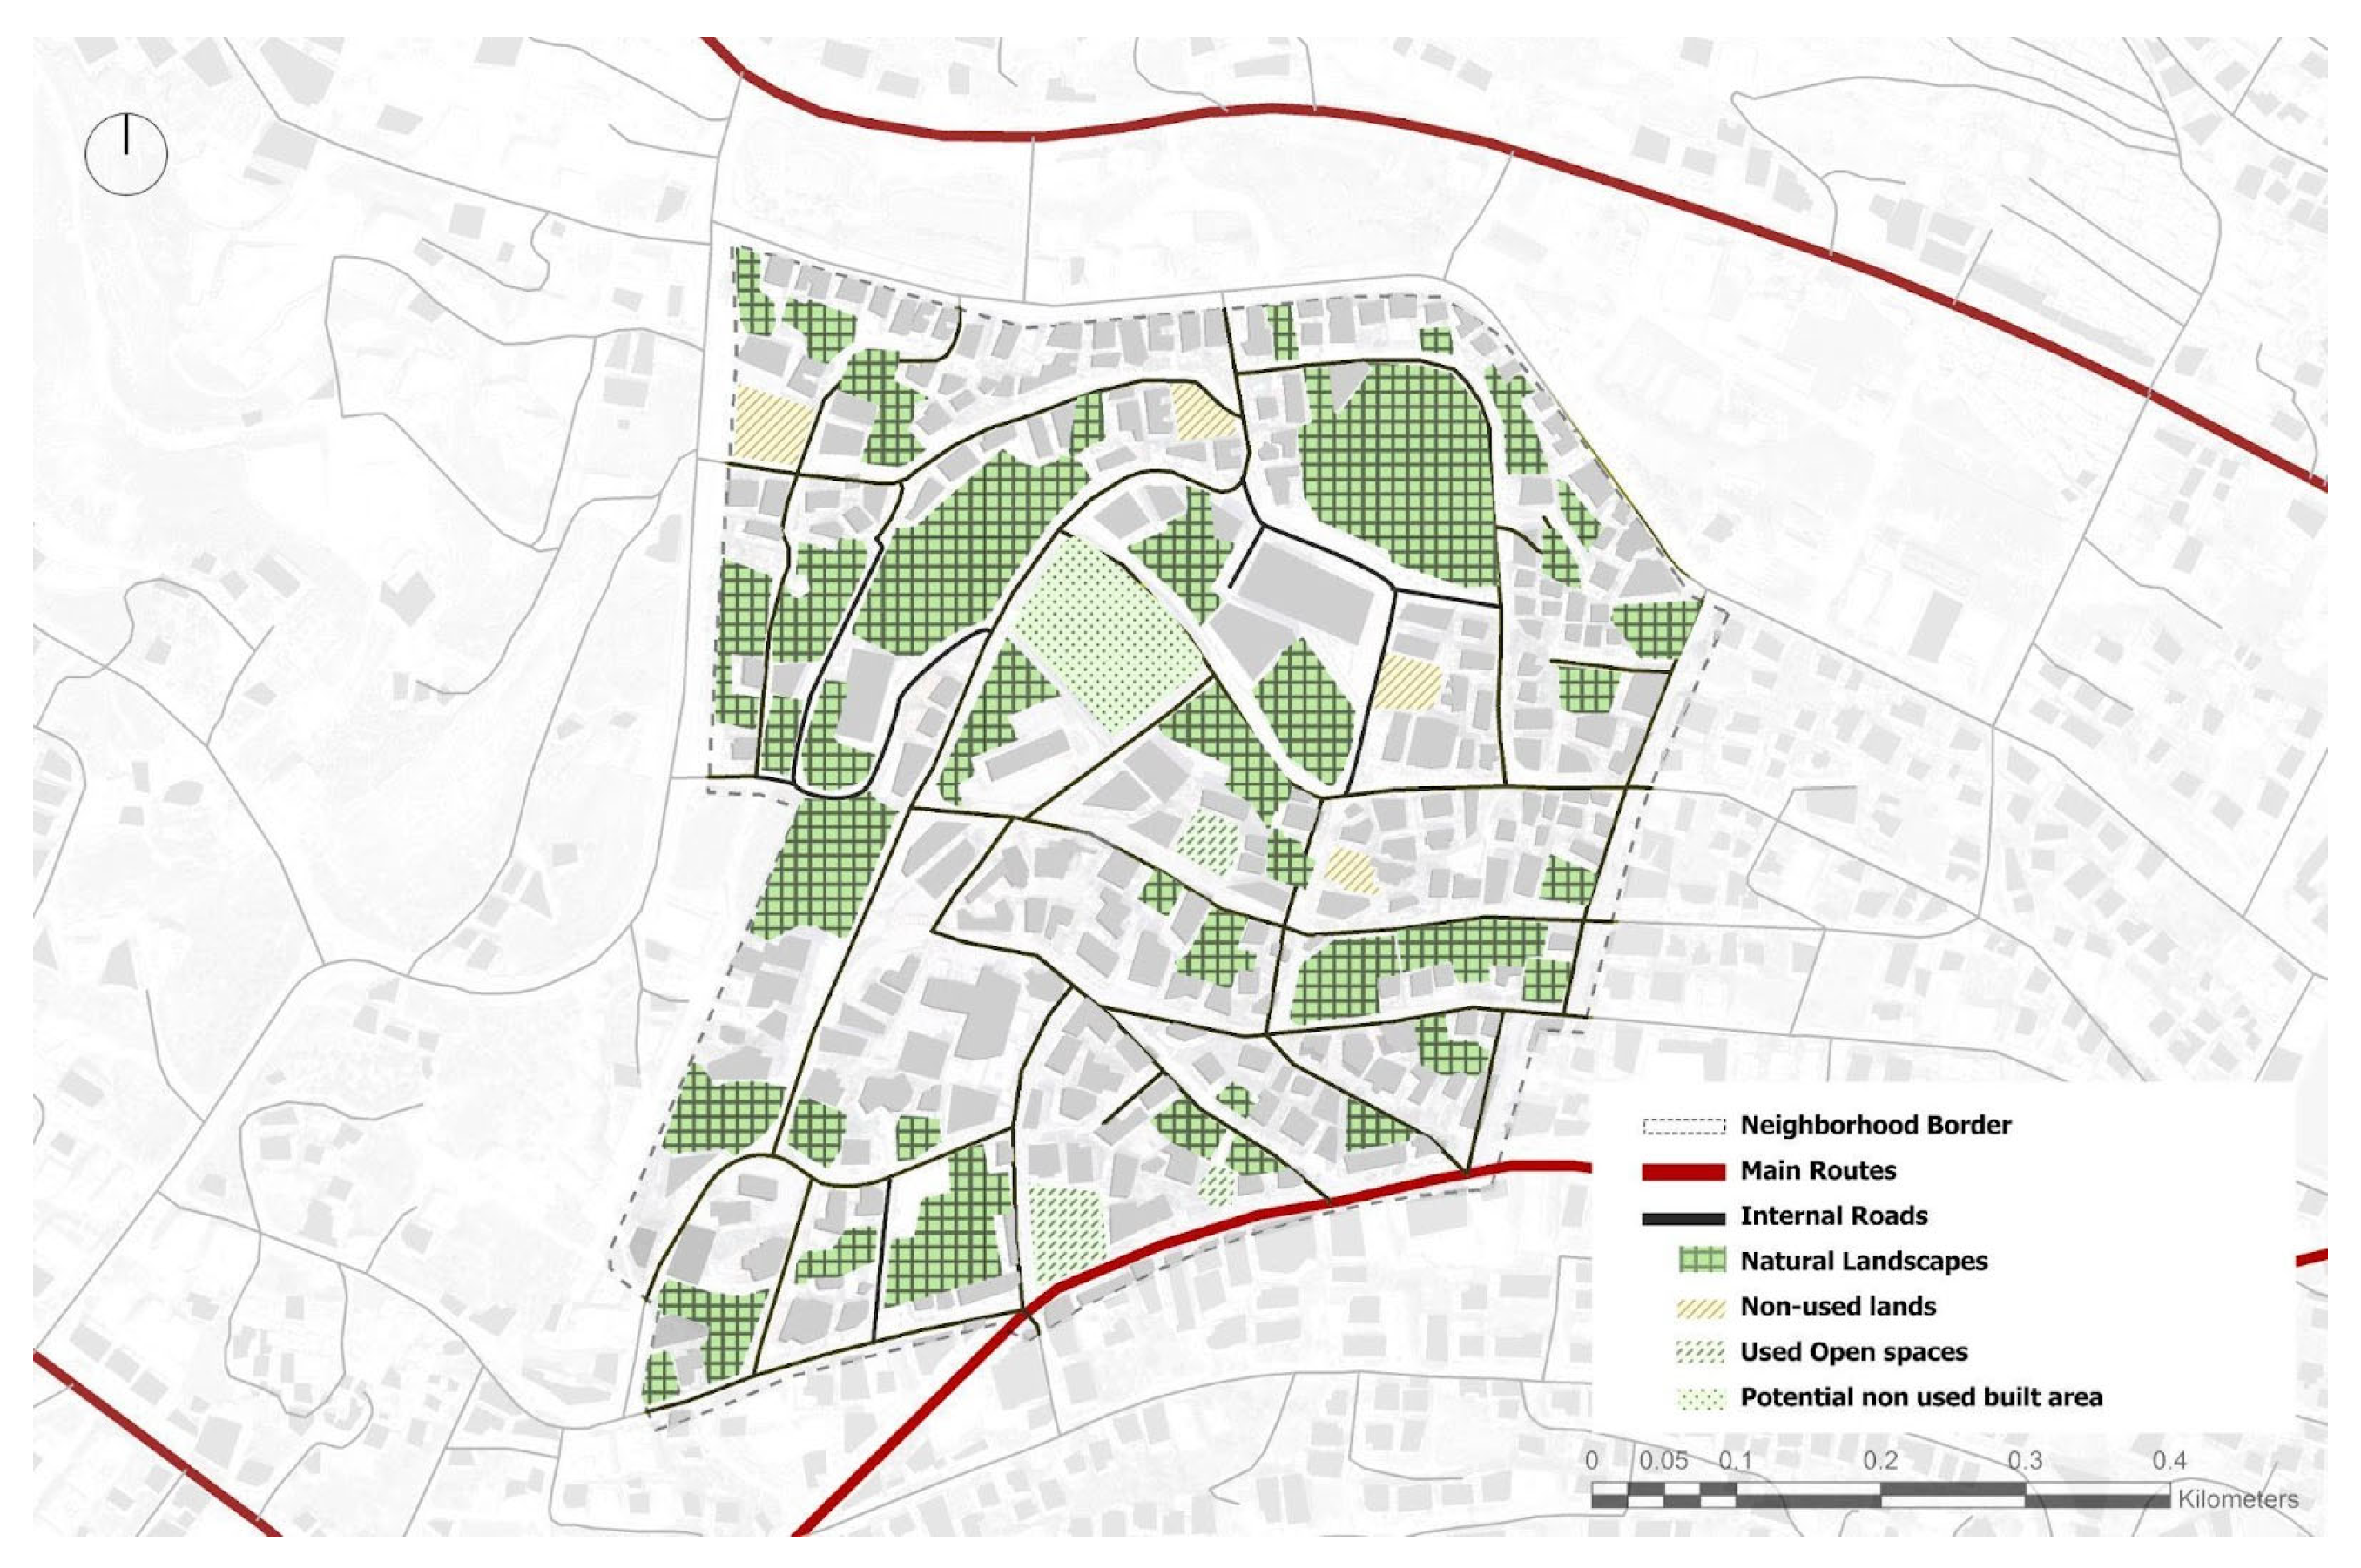
This factor intends to reduce negative impacts on the microclimate and population. Measuring the impact of the urban heat island phenomenon is strictly connected to the ratio of built-up areas and the materials used for construction. According to stored data in Geomolg, the neighborhood includes 80 donum of empty area [
29]. Al-Mreij includes multiple open areas, as seen in
Figure 9, some of which are used as parking and others unbuilt spaces. In terms of buildings, roofs do not include any specific coatings for mitigating the heat impact. Instead, they are typically used for water tanks, satellite dishes, etc. The roofs of the three public buildings include energy generation systems, such as solar panels. Streets barely include shading systems, and not all buildings are designed to provide shade for pedestrians.
3.3.2. Building Reuse
The concept of building reuse has emerged to lower the waste of materials, energy, and infrastructure required for the execution of all construction. Reusing a building refers to the use of most of the original building components when adapting renovations or changing its use. The detection of older buildings in the context of Nablus neighborhoods can be obtained by different means: facade texture, facade colors, aging marks, massing of low-height buildings, opening sizes and styles, and some informal urban elements such as exposed HVAC systems. Most of these old buildings are still occupied by residents, and only a few are neglected and unutilized. There is indeed the issue of aesthetic informalities caused by the contrast of older buildings; therefore, renovation and retrofitting are required to create a better harmony with the neighborhood buildings.
3.4. Social and Economic Wellbeing
3.4.1. Demographic Needs and Priorities
Demographic needs and profiles, current and future trends, and priorities are essential to the success of spaces. Local authorities must have demographic profiles and census data that include several aspects: age, gender, religion, household size, values, tenure and change, population projections, headship rates, deprivation, employment (sectors, incomes, businesses, and unemployment), and education, skills and training. Those parameters form the general conceptions of housing, services, facilities, and amenities. Some of the local demographic data are provided in the PCBS [
30], as stated in
Table 4,
Table 5 and
Table 6.
According to the collected data, 88% of the housing units in Al-Mreij Neighborhood are purchased. This can be explained by the cultural preference of owning houses, rather than an indication of residents income. To measure income more precisely, the employment rate is investigated. Almost 42.9% of all residents are employed and 1% are uneducated, which generally indicates the average economic activity of the neighborhood. Ties between demographic needs and the current urban fabric of spaces were found to be missing, as no flexible facilities are allocated. Conventionally, the integration of these data happens in projects led by municipalities and local authorities. The local authorities state that the majority of projects are led by the private sector and investors, which may not be part of a national plan. Thus, demographic priorities do not get covered.
3.4.2. Inclusive Design
Ensuring accessibility for all residents is essential to the livability of neighborhoods. Part of practicing social justice is to cover the needs of all genders, ages, and disabilities with the same efficiency. Community engagement and inclusivity usually come under a national plan for the vision of sustainable neighborhoods. This is transferred to design implications for housing, transport methods, emergency strategies, and the overall distribution of services and spaces. Observations on inclusivity can be pointed out from the aspects of urban form, urban functions, urban elements, and urban mobility. Generally, local neighborhoods do not have distinguished areas in terms of building designs and there is a general rigidity in how the city looks and functions. The diversity of space uses does not extend to more than residential, commercial, and administrative (very few), and within these uses little diversity is implemented to allocate for diverse needs. Also, a few strategies in transportation are set to reform the gap in accessibility. Urban elements like streetscape lack measures for people with disabilities, and rarely do entrances of buildings have ramps.
3.5. Land Use and Ecology
Landscapes are crucial to the introduction of how spaces are used and how they are communally perceived. A healthy and aesthetically pleasing landscape reflects efforts in resource management, design, and maintenance. Several aspects, like planting design, site protection measures, the inclusion of native species, and the management of irrigation and water efficiency systems, shape the interest in preserving and strengthening ecological value. This consideration extends to the scheme of existing and new landscapes.
Locally, the natural green landscape is part of the defining characteristics of Nablus city. Unfortunately, developments that took place in urban areas were not focused on preserving the features and components of landscapes. The city grew to be less green and more confined, with buildings that did not have enough landscape designs. Rarely is it possible to find residential complexes with landscapes for seating or social use, except for single-use typologies. In local regular construction, the remaining landscapes of land, if any, remain neglected lands of projects that pile up waste. Moreover, there is a lack of diverse green infrastructure and used landscapes: wetlands, embankments, gardens, parks, etc.
3.6. Integrated Development Strategy
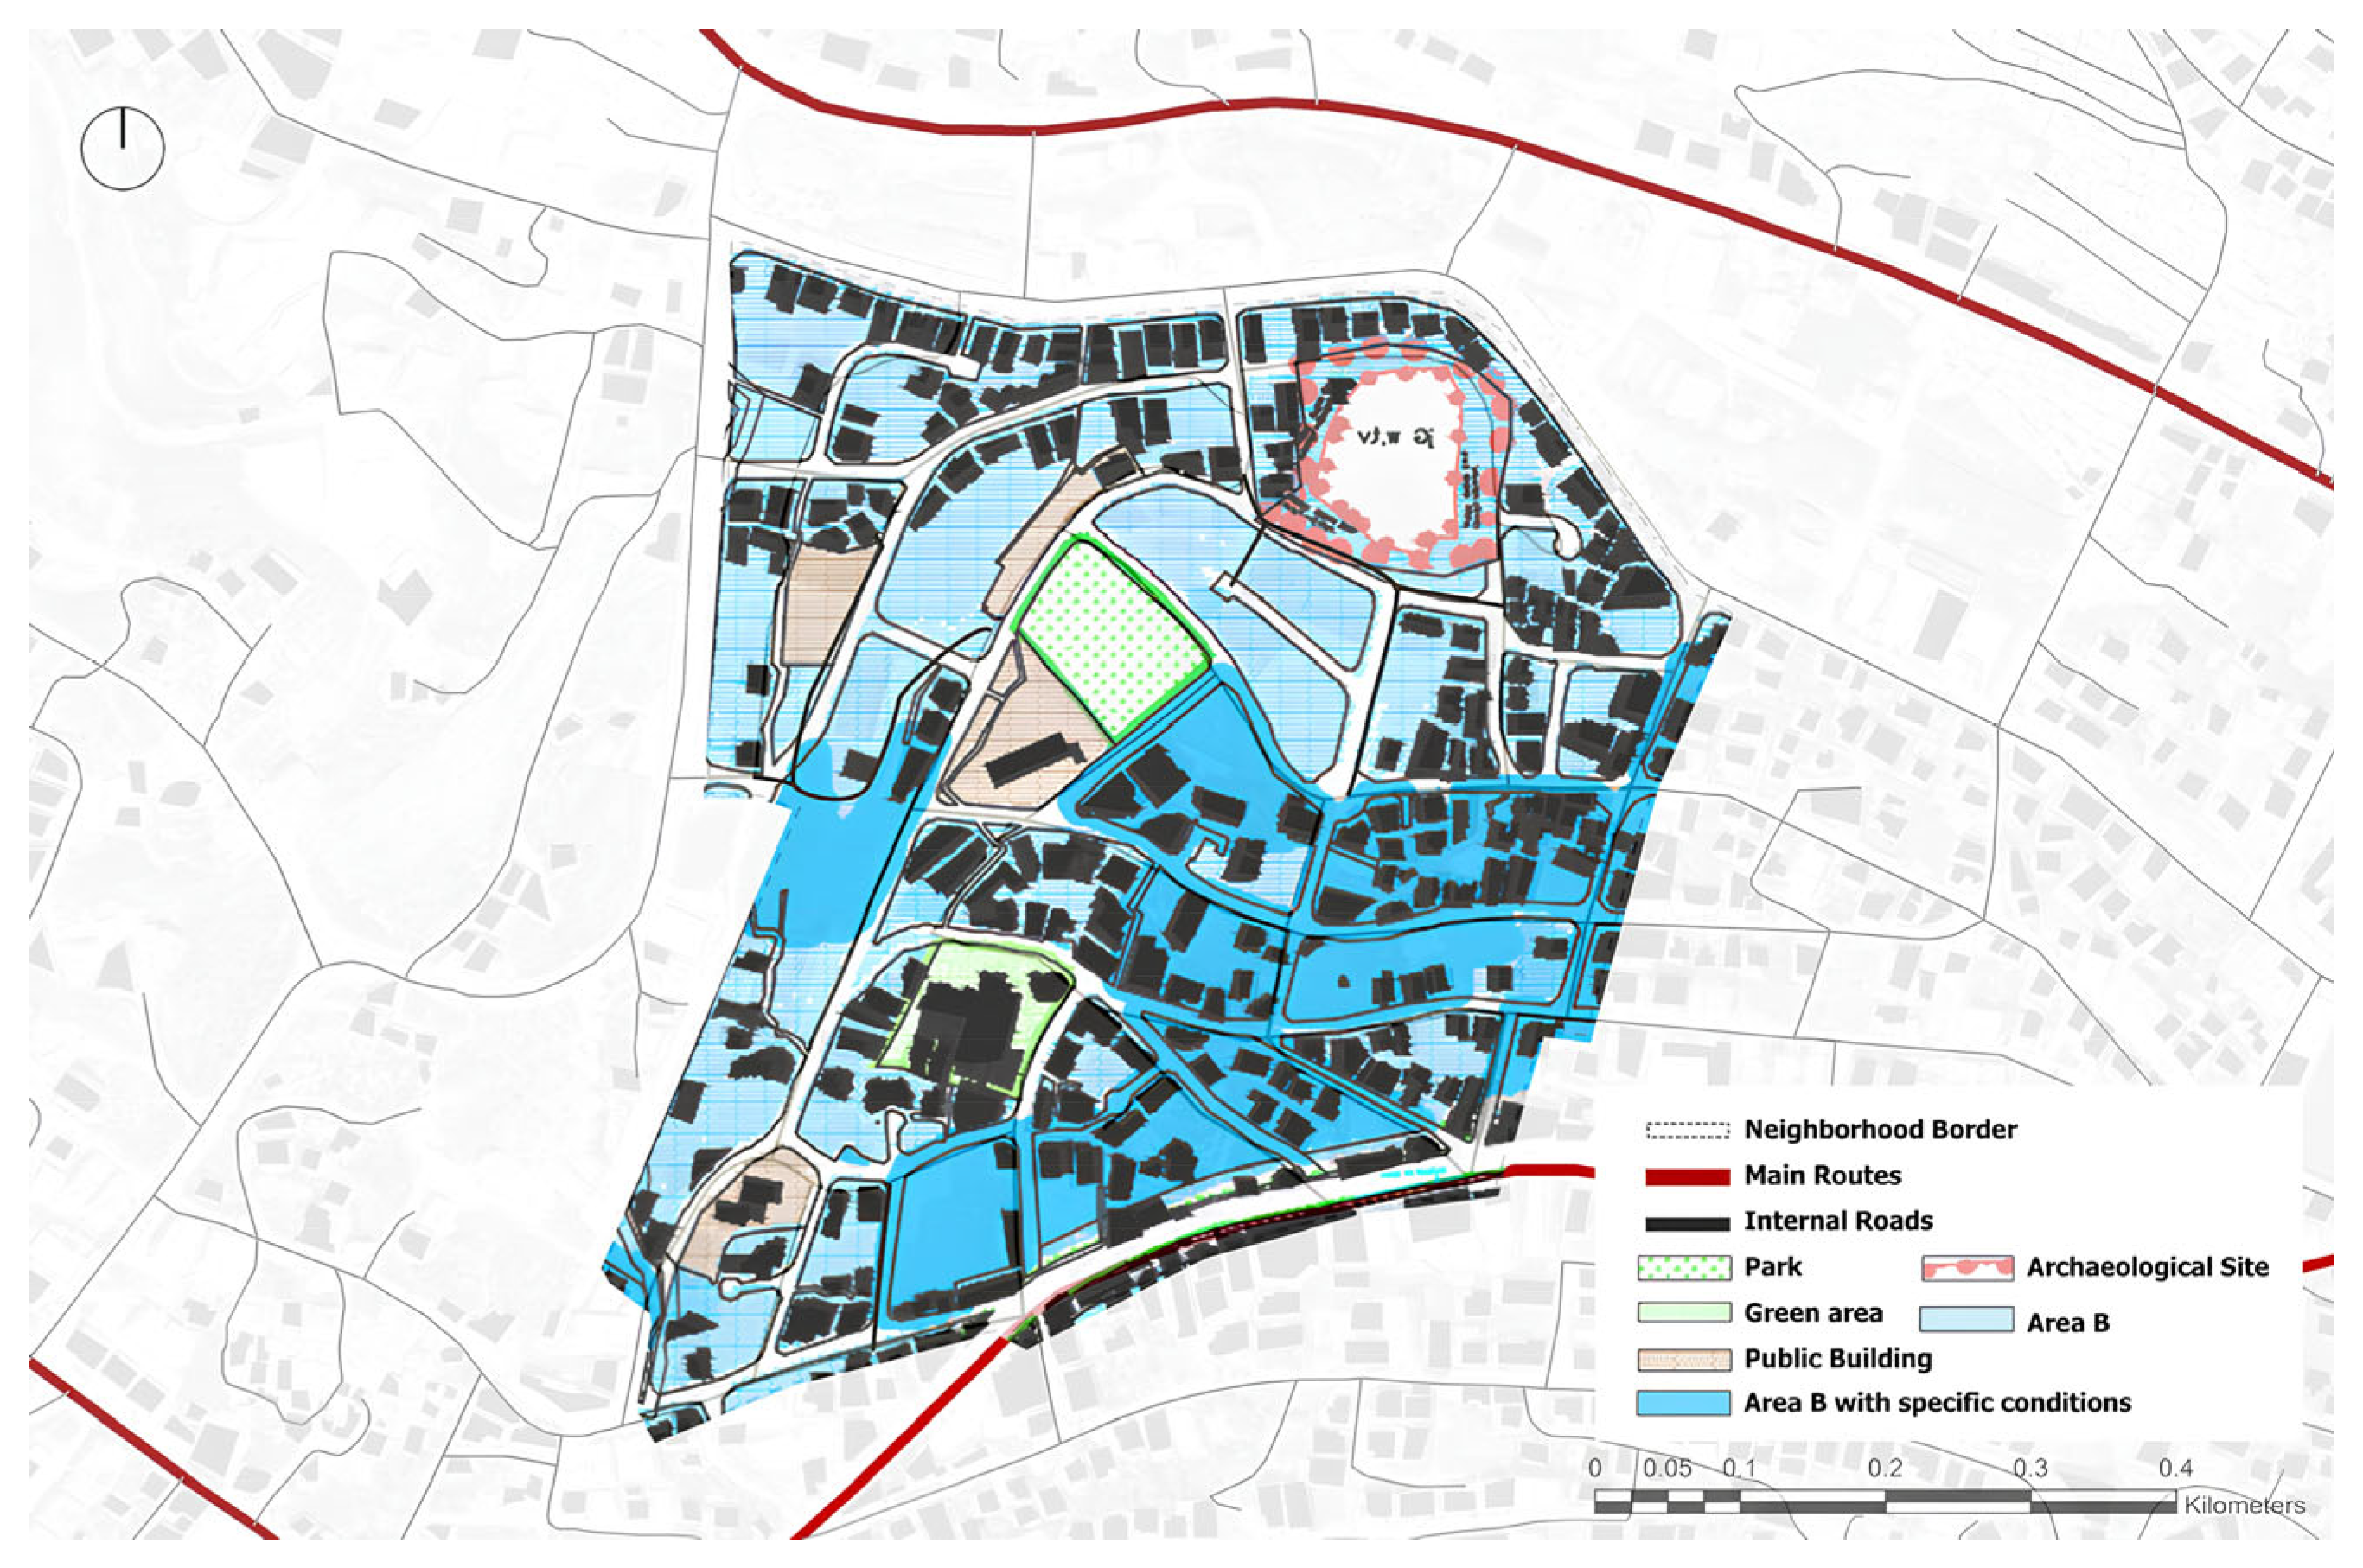
In the local context, there are huge issues with managing the formation of neighborhoods and their development. The majority of lands are privately owned, which favors the construction of commercial, high-rise buildings. The role of the municipality is to assign land uses of city land and assign building permits and regulations based on a set of bylaws and master plans; see
Figure 10. However, it does not participate in supervising the development of neighborhoods by ensuring harmony and compatibility or studying the impact of projects on each other. In other words, the one who owns the land might not be the one who applies the construction plans, nor the one who coordinates and supervises the prospective output, nor the one who assigns the target users of space.
Though Nablus City has a land-use plan, violations of its application exist in the context of both area and building uses, and the neighborhood of Al-Mreij is no exception. For instance, the area assigned for a park was converted to a stadium, and the project did not resume due to financial issues. The land is not even accessible today. In addition, the assigned green area is used as a government hospital. The lack of neighborhood development management is evident in the fragmentation of construction as a process and as a product.
3.7. Livable Communities
Safety and security insurance relies on systems, strategies, and risk assessments. In the context of buildings, a safety and security layout plan measures the allocation of adequate setbacks and the relation of their entrances to transportation routes for the safety of passengers from traffic. Emergency vehicular access routes, external evacuation routes, emergency care facilities, control centers, civil defense stations, and awareness centers are tangible spatial measures and systems for safety on the scale of neighborhoods, often addressed under territoriality, natural surveillance, access control, and activity support.
In our analysis of the local context, the general strategies for the safety of neighborhoods were missed. The neighborhood of Al-Mreij does not include any institution or facility for safety except healthcare facilities. Internal roads do not have service areas for drop-off in front of any building, and neither internal nor external roads are wide enough or dedicate specific lanes for emergencies. A couple of observed elements were visualized as potential threats. The use of corrugated sheet roofs (Zinco) for the indication of a nursery entrance is a violation of the bylaws of the designated area and a threat to users in case of damage or deterioration. In addition, the majority of vacant land is available to access, but with few precautions for safety. Substances and softscapes like rocks and disposable and indisposable waste might be risky for kids or elders walking down the sidewalks opposite these lands. Moreover, the availability of buildings-in-process and unfinished constructions elevates the potential for suspicious activity at night, especially since they are kept open without restriction of access. Some temporary fences are observed in a couple of unfinished projects; however, their openings are not sealed, therefore threatening the protection of the property.
3.8. Economic Quality
3.8.1. Lifecycle Cost (Building and Land Cost)
The lifecycle cost is about ensuring comprehensive consideration of the operation and production costs of a project from the early planning stage until reaching the development stage. Energy costs, changes in the interest rate, price increases, maintenance and repair costs, conversion, replacement or modernization costs, and cleaning are part of managing the related costs. Heating, cooling, electricity, and water are parameters that need to be measured, mainly during operation.
Locally, there is a general notion of high construction costs, due to the local prices of materials and building logistics. This follows the fact that the building sector gains a significant value of local investment, which also leads to the high cost of lands. Regarding managing local projects, some of the local big-scale or municipality/governmental-related projects were evaluated as tenders; however, the breakdown of the project’s budget is mainly due to production costs. Moreover, there is a general lack of adequate and consistent inspections into the treatments and construction processes of buildings. Good practices are found for sure; however, the majority of implementations favor saving the cost of materials rather than studying the long-term effects of using a specific material.
3.8.2. Land Use Efficiency (Ownership)
A rising quality of life and population mean significantly more use of land. The concept of land use efficiency puts forth a strategy to overcome the resulting urban sprawl by emphasizing development efficacy and density. The efficient use of land is essential to maintaining sustainable urban developments that incorporate increased building land, minimized land use, and minimized space for streets. Land use efficiency manages lifecycle costs and takes control of production costs and building prices; otherwise, the focus of developments in specific urban areas increases land and building prices. Locally, this is exactly one of the narratives for the high prices of land, the excessive purchase of land from individuals, and the use of land for private sectors. There is a lack of land use efficiency, which leads to rising uses of land.
The development efficiency ratio is calculated with consideration of two parameters (NBA: Net building area; GBA: gross building area) as follows: DEI = NBA [m2]/GBA [m2]. The calculation of development efficiency emphasizes publicly used lands and public service areas. Locally, the establishment of a building is layered on a maximized building area, but with little attention to efficiency for the public. Building usually takes over a widespread area that solely emits setbacks and entrances for ground or underground parking and is used for private investments.
3.9. Material and Waste Management
Sustainable applications of managing earthworks suggest designing with minimal impact on earthwork and adopting the reuse of excavated materials. While cut and fill might refer to excavation for piling and foundation work for construction projects, the topographic nature in the local context exaggerates portions of land excavation and earthwork. Some lands have access from two levels, and this is what drives excavation to continue to a high depth. Most of the designs in Nablus City are based on design proposals that work on emptying and flattening the surfaces. They even use the whole surface area of the land, and the only restrictive constraints are the setbacks of 3 m, 4 m, and 5 m. A further issue is the transfer of the extracted earthworks. Some projects rely on transferring sand and rocks from the project site to another vacant land area or to areas on the city peripherals. In Al-Mreij, extracted land can be found with no coordination to the adjacent land at the upper level. The radical difference in levels must, at least, have fences or protecting parapets to mitigate the high risk of danger.
3.10. Environment Resources and Quality
This concept is directed at measuring the status and the rate of rainwater utilization for indoor and outdoor uses. The management of rainwater is tied to physical implementations and regulations. The current infrastructure of local pavements is not made of permeable material, which causes relative floods during rainy seasons. Since vacant lands are left with no boundaries to their surroundings, rainwater mixes with non-porous ground surfaces such as clay, which affects the walkability of residents in rainy times. Strategies to benefit from direct and stored rainwater for rooftop greening are not adopted in any of the neighborhood buildings. Gutters or any convenience system connecting apartment buildings’ roofs to ground levels lead water to the streets; thus, collected water from the catchment surface is not integrated.
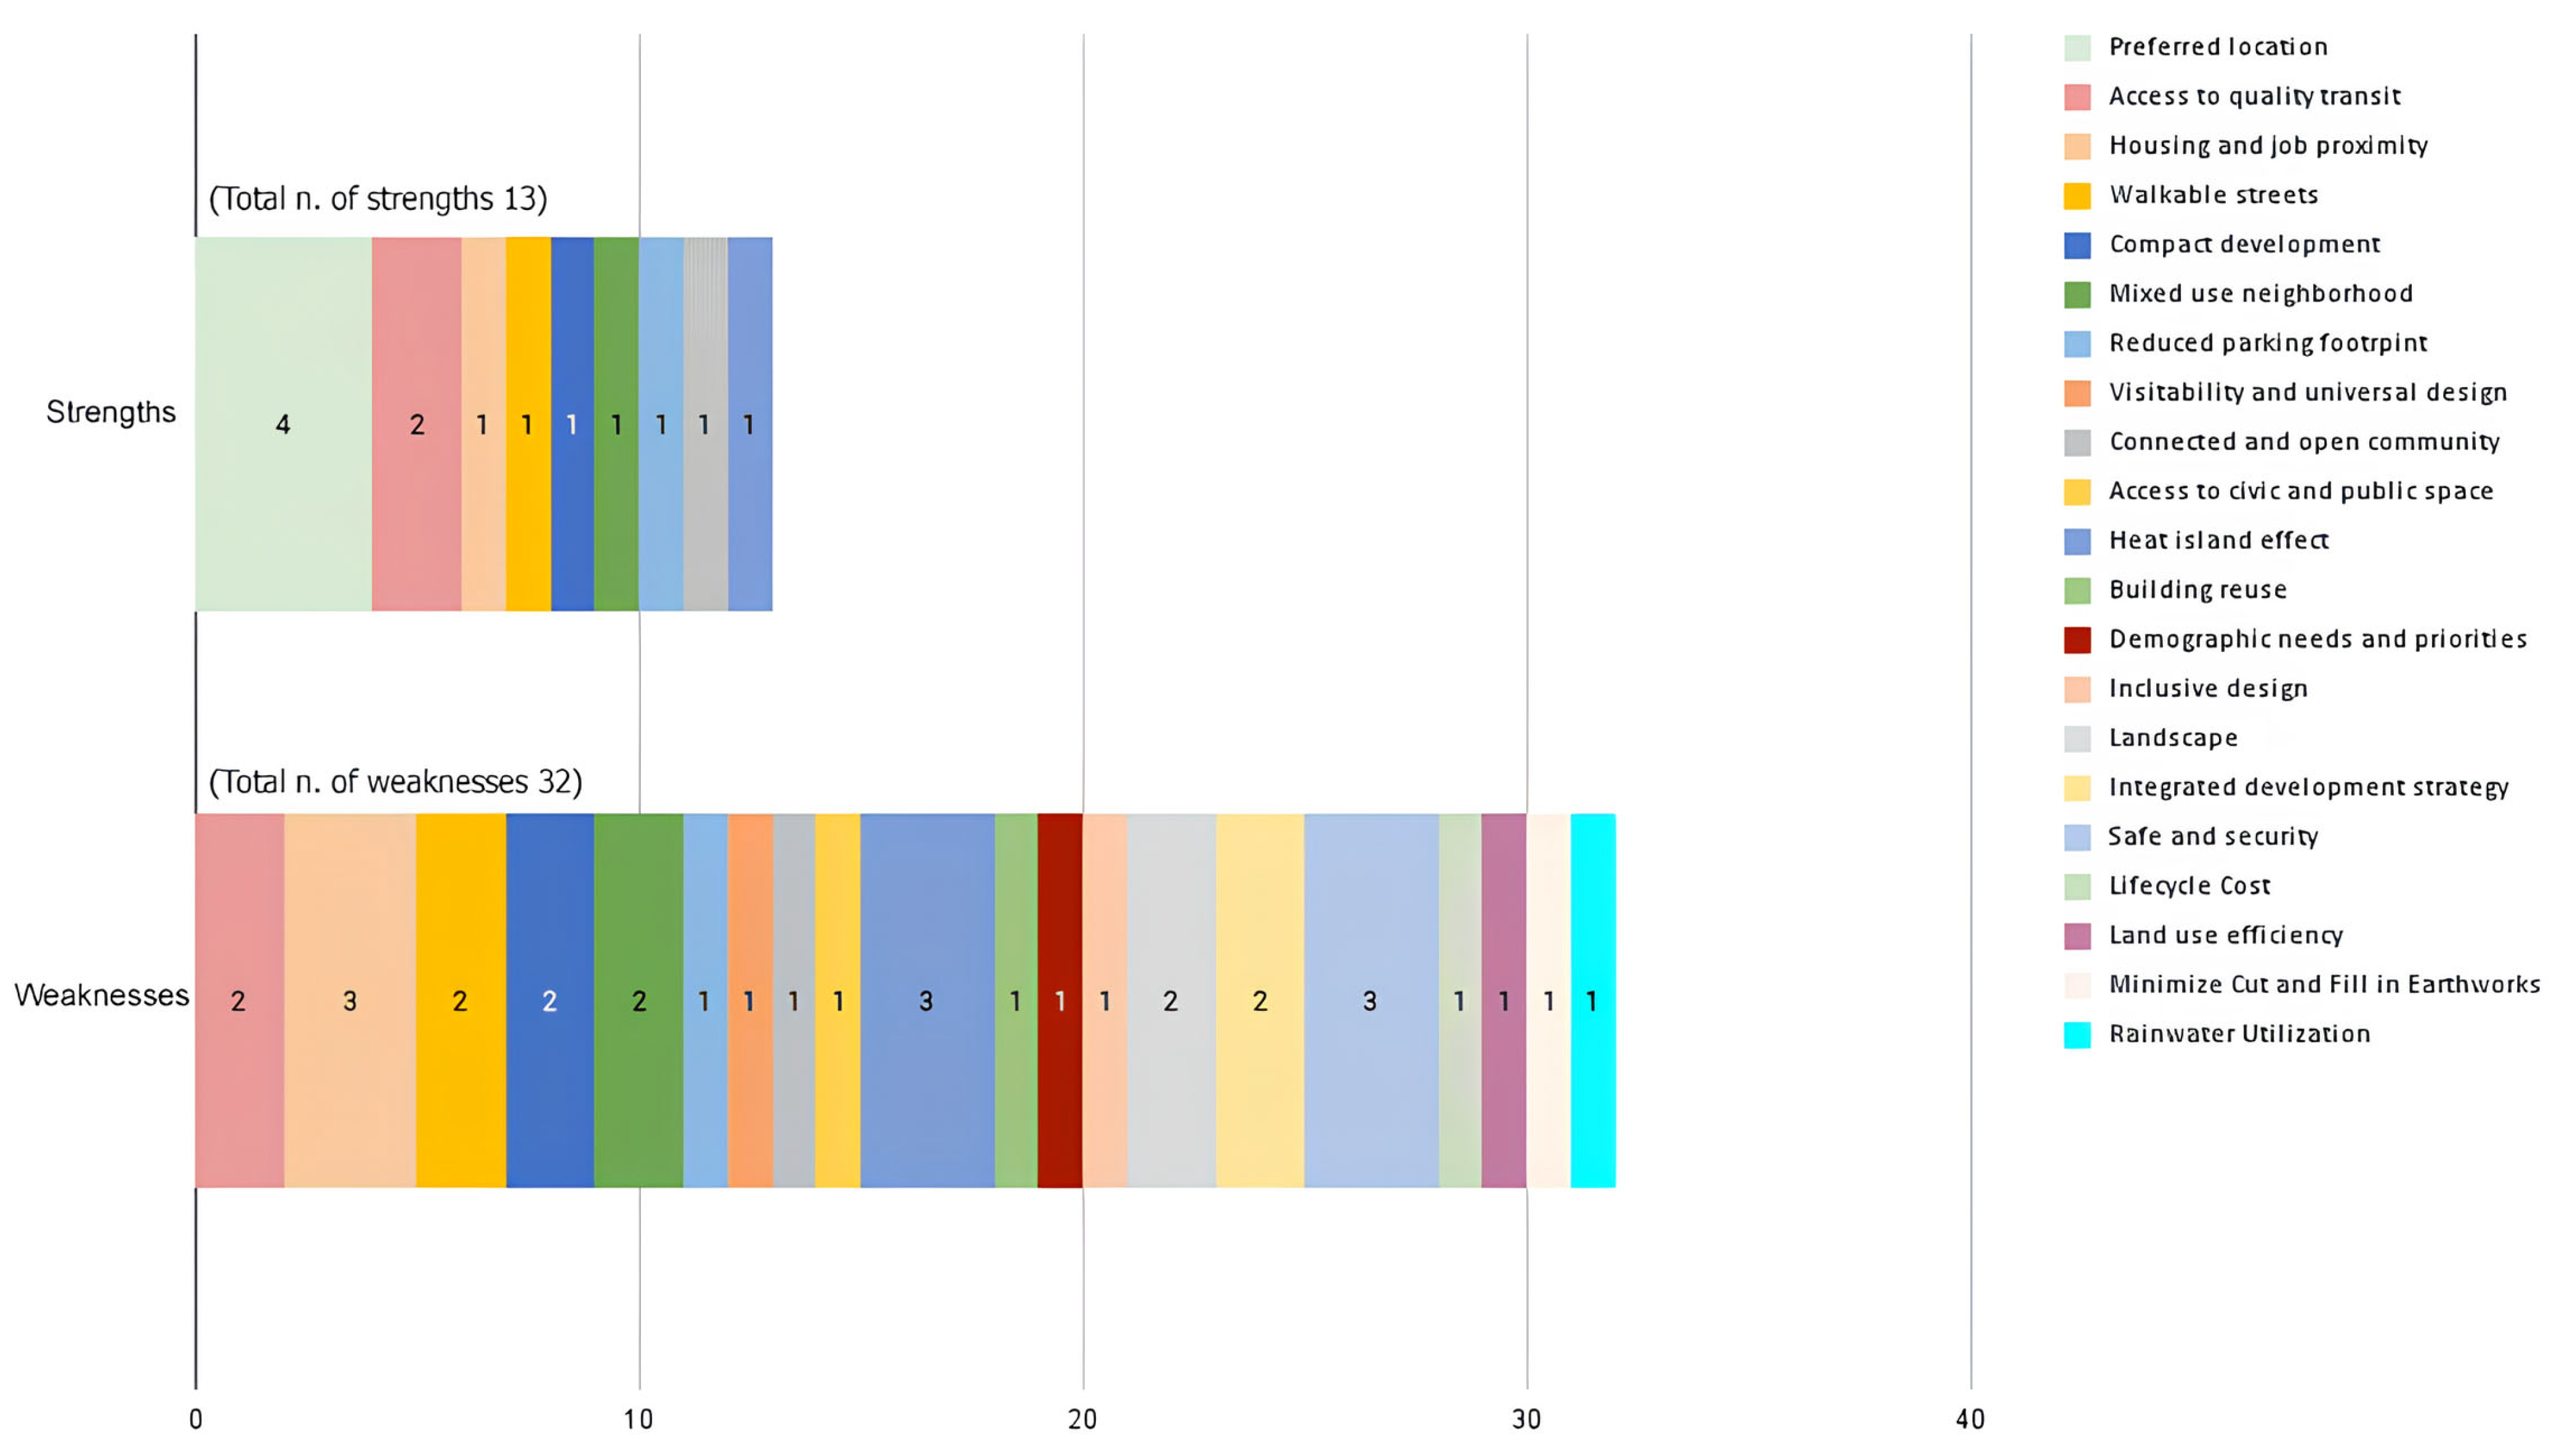
The assessment of Al-Mreij neighborhood quantitatively and qualitatively evaluated the inclusion of neighborhood sustainability parameters. For each studied indicator, a set of weaknesses and strengths was note; see
Figure 11. Indicators of their weight were obtained by counting the number of those strengths and weaknesses. The total count of strengths in Al-Mreij was 13, while the total count of weaknesses was 32. Strengths are represented by eight indicators that relate to transit, density, diversity of uses, and natural open spaces. The indicator of Preferred Location scored the highest number of strengths (4 points), followed by the indicator of Access to Quality Transit (2 points). Seventeen indicators, which exceeds two thirds of all indicators, scored 1 pointed-out weakness. Only one indicator scored zero weaknesses, which was the Preferred Location. Indicators that scored the maximum number of weaknesses were Housing and Job Proximity, Safety and Security, and the Heat Island Effect.
4. Discussion
The developed framework delivered an inclusive indication of the level of sustainability of local neighborhoods. Despite the absence of various sustainable attributes, development tendencies and potentials existed in some characteristics of the case study’s current condition: the flow of transit, accessibility from street patterns, availability of vacant lands, the existence of the natural landscape, and compactness and its relation to the active location it has.
The local model was distinguished from other accredited NSA tools in its cultural, social, and physical characteristics. The notion that it was built from local challenges makes it responsive and extremely related to its context. The process by which the model was established, significantly, led to the exposure of several gaps: gaps in the literature of selected NSA tools, gaps in the application of the methodological framework, and gaps addressed in the selected neighborhood. The coverage of those gaps makes the study available for local and international contextualization.
Regarding the literature of NSA tools, some aspects were noticed as either not being covered, or not being sufficiently addressed in the NSA tools. The major two points to highlight are the lack of addressing of human behavior and the lack of addressing of architectural (third) dimension in the NSA tools.
For the human behavior aspects, four points were noted. First, limits were shared regarding nighttime vs. daytime urbanism, and none of the NSAs introduced the necessity of regulating public transportation at night, contextual and cultural nightlife, seasonal night activity, walkability, and the pedestrian use of streets during the night in terms of social and physical aspects. Second, the impact of informal urbanism on spaces was missing from the coverage of NSA tools. Third, none of the NSA tools had a body text of words like [textures], and [geometries] to set measures for the holistic and synthesized perception of aesthetics, though they are hosts for impacting and changing human behavior. Fourth, the relationship of streets to society and the environment is poorly addressed. For three-dimensional aspects related, three points were noted. The first aspect to discuss is topography. None of the NSA tools indicate how topography influences established indicators of walkability, accessibility, job proximity, and distribution of services. Second, privacy and visibility, or any social and cultural-related measures are not addressed in the orientation or form of buildings in NSA. Third, the relation of buildings to each other is not sufficiently emphasized. There is a lack of addressing the connection between buildings (buildings of the same blocks or neighboring buildings) in terms of orientation, size, setback, uses, etc. It is understood that this work is a result of planning, and maybe this is why NSA tools do not intervene in these settings of buildings. These gaps led to evaluative studies that pointed out gaps in NSA: a lack of equitable consideration of the four sustainability pillars, the lack of cross-scale studies, and the lack of consistent assessment [
31].
The addressed gaps in the literature also translated into gaps in the application of the model to the local neighborhood. Together with the uncovering of some specificities, researchers found a gap between the qualitative and quantitative attainment of assessed indicators. Though the evaluations of some sustainable parameters were numerically obtained successfully, there is a major gap in qualitative implementations. For instance, a street can be wide enough but without incorporating any safety measures, walkable lanes, or landscape features. As another example, buffer areas for measuring job proximity cover the required number of buildings, but the buildings themselves miss the inclusion of flexible and mixed-use spaces and are not designed to offer responsive spaces to the changing patterns of employment. The result is a neighborhood that has many repetitive buildings that are superficial to stimulate job creation among the residents themselves or to bring in investments.
Among the synthesized assessment framework, the local neighborhood satisfied some of the LEED ND sustainable indicators and almost none of the other tools. The researchers made the assumption that the description of indicators in the reference of LEED contributed to this result. The description of LEED ND was simpler, more concise, and much more readable than other NSAs, which made the assessment easier to follow. Other tools generally included many practical and descriptive details which were already limited or constrained to the local context. This may have influenced the grasp of requirements, and therefore the evaluation of the assessment. Generally, the assessment pointed out a lack of strengths in the addressed indicators under BREEAM COMM, DGNB UD, GMD, and CASBEE UD metrics. For the PCRS, the indicator of culture had some satisfactory aspects; other than this, the rest of the indicators had weaknesses or limitations in coverage of sustainable aspects.
Overall, the estimated strengths out of the assessment, and other indicators, did not score as optimal in satisfaction, and this is tied to the existence of mentioned gaps in multiple aspects.
5. Conclusions and Recommendations
According to the raised argument of the paper, the satisfaction of the preferred location indicator, which scored the highest number of strengths (4 points) in the Mreij neighborhood, was not sufficient alone for maintaining its sustainability. The assessment of measured indicators found that the counted weaknesses were almost double the count of satisfied aspects (32 points/13 points). The local condition of the assigned neighborhood made sense for the number and the type of addressed weakness.
The reasons behind the partial or total dissatisfaction of some of the indicators, were that some gaps appeared in the achievement of the NSA tools because of the poor existing condition such as the lack of consideration of social and ecological aspects, and the poor grasp of contextually related urban aspects in the NSA tools such as the economic and environmental elements, as mentioned in the discussion. The selected neighborhood showed a lack of physical attributes related to job creation, the coverage of future needs, land use efficiency and ownership. To undertake those gaps and weaknesses, the following part proposes some urban interventions and recommendations to improve local neighborhood sustainability. Assigning interventions relies on the importance, availability in the literature and practice, and/or the feasibility of concepts. The results from this study are in line with the results comparing the implementation of NSA tools at international level, which highlighted differences in both the quality and the quantity of sustainability and resilience aspects covered by different international NSA systems [
32]. These distinctions and similarities in the international NSA serve as a base for enhancing these existing systems and establishing modified versions according to the local contexts and regional priorities, which was one of the aims from this study. The new proposed model can serve the future sustainability and resilience of neighborhoods taking into account the specificity of different contexts.
The objective of reforming the aspect of job proximity is to increase job opportunities for residents in their neighborhoods. Policies should encourage the use of residential spaces for remote work and encourage investments in commercial activities within an 800-meter range. Possible areas for employment include infrastructure projects, job creation facilities, new developments, and investments in tourism and education programs using local resources. The overall objectives are to improve employment and training opportunities for residents in their direct surroundings.
- 2.
Transit Access, Parking and environmental performance of streets and spaces
The aim of this is to enhance transit access, the management of parking areas, and environmental performance in Al-Mreij neighborhood. Suggested actions include adding secondary public transit stations along busy streets, and encouraging different transportation modes with bus services and bicycle rentals. Moreover, improvements to sidewalk, plazas, and parks are suggested to enhance walkability and safety. Parking strategies aim to have free or subsidized parking areas by incorporating environmental materials and a rainwater management system. To reduce urban heat islands, the proposals of using vegetation for shade on paved areas and rooftops, installing skylights, using high-reflectance roofs, including solar panels, and encouraging open-grid pavement systems are suggested. Moreover, the increase in green and open spaces helps decrease the thermal impact of buildings [
33]. Trees and greenery in these areas offer cooling benefits based on density, location, and arrangement in the built environment [
34].
- 3.
Density, Accessibility and Inclusivity
In Nablus, high buildings and population density are the main reasons for compactness; however, much consideration should be paid for old populations, and other specific groups in terms of reduced mobility. Services must be well distributed to ensure safety and accessibility whilst addressing uneven distribution among old groups [
35]. Reforms in architecture and urban design, using organic urban forms and neglected spaces to bridge service gaps without compromising compactness, are needed. The existence of different densities in the neighborhoods support slow densification over time [
36]. By increasing public spaces, dense areas can effectively be managed. Investments in flexible architecture can experiment with service locations and durations to meet increasing population needs and enhance urban resilience [
37]. Differentiating compactness from overcrowding is crucial to maintain a healthy living environment, and any increase in density should be carefully studied for visibility, environmental impact, and limits of densification.
- 4.
Governance
The land ownership culture undermines the government’s strategic development plan for livable urban spaces. The resident’s main investment in purchasing land leads to higher land prices without understanding its uses. There must be strategies to encourage investors, developers and landowners to work together to build pioneering projects based on land policies and development plans. Regulations for investment must evaluate the type, rate, and necessity of investments to local and future needs. Planning and construction practices should be the basis for integrated management, including resource management and life cycle costing.
The limitations of this study can be summarized concerning the distinctions of the size, spread, and density of neighborhoods in Nablus. These attributes of local neighborhoods are not uniform, which might create a shortage in the generalization of the study’s findings and recommendations.


