Article

The Spatial Pattern Evolution of Urban Innovation Actors and the Planning Response to Path Dependency: A Case Study of Guangzhou City, China

1
Department of Spatial Planning and Landscape Design, Guangzhou University, Guangzhou 510006, China
2
Guangdong Guodi Planning Technology Co., Ltd., Guangzhou 510650, China
*
Author to whom correspondence should be addressed.
Urban Sci. 2024, 8(3), 111; https://doi.org/10.3390/urbansci8030111
Submission received: 3 June 2024 / Revised: 22 July 2024 / Accepted: 5 August 2024 / Published: 13 August 2024

Abstract

:
The capacity for urban innovation is a significant symbol of contemporary urban development. In order to promote sustainable urban innovation, it is crucial to match and optimize innovation spaces, actors, and their behavioral needs. Based on the data from patent inventions, which are commonly used to represent urban innovation, in this study, we investigated the formation mechanism of Guangzhou’s innovation pattern and its characteristics from 1990 to 2020 using Geographic Information System (GIS) technology. The results indicated that Guangzhou’s innovation spaces developed a center-radiation structure of “two districts and seven cores”. We investigated the path dependence of spaces, actors, and behavioral needs by examining the interaction between the innovation space layout and behavioral needs. The findings provide theoretical support for the city’s sustainable development in terms of innovation in the future.

1. Introduction

Since World War II, the rapid development of the knowledge economy has alerted researchers to the increasingly prominent role of technological factors in driving urban economic growth, with the efficiency of innovation contributions becoming more evident. The focus of studies on the distribution of innovative spaces has shifted from addressing the optimal allocation of traditional resources, such as land, capital, and labor, to exploring the scientific distribution of knowledge-based resources, including intellect, technology, and information, within urban spaces [1]. In the 21st century, the innovation economy developed rapidly, and the transition from investment-driven to innovation-driven development became essential for upgrading the economic development model in developing countries such as China. The growth momentum of dominant industries has shifted from factors such as capital to innovation, creation, and creativity [2]. Innovation, serving as a perennial and dependable catalyst for urban development, remains a focal point of interest across multiple disciplines. In the past decade, the discourse on the factors influencing the spatial distribution of innovation has grown to encompass several dimensions, including innovative enterprise clusters [3,4]; the occurrence mechanism of innovation activities [5,6,7,8,9,10,11]; the construction of cooperation networks of innovation actors [12,13,14,15,16,17,18,19,20,21]; the continual evolution and iterative development of innovative technologies [22,23,24,25,26]; the ramifications of innovation input and output on urban space, economy, and culture [27,28,29,30,31]; and various other topics. Researchers have endeavored to discern the knowledge and economic spillover effects arising from the connections among nascent cooperative actors, thereby elucidating the inherent drivers and mechanisms underlying the spatial configuration of innovation actors. Nonetheless, there remains a gap within the extant research corpus, specifically concerning the insufficient exploration by geographical studies of the intricate and dynamic interactions between key external infrastructure, such as urban educational facilities, transportation systems, and office environments, which require substantial financial investments, and the innovation actors themselves. Scant attention has been devoted to examining how infrastructure development can guide and facilitate the expansion of innovation spaces. For cities in need of urban regeneration, especially those developing cities with urbanization trajectories, enhancing infrastructure is paramount to amplifying their attractiveness to innovation actors, and thus is a cornerstone for boosting urban economic vitality.
Innovation spaces span diverse typologies, encompassing innovation cities [32], smart cities [33,34,35], smart districts [36], and the widely debated 15 min city concept [37] and walkable innovation districts [38], which are all intricately tied to the clustering patterns of innovation actors. Contemporary research has predominantly focused on the examination of planning philosophies and design methodologies, with few ontological perspectives that extend conventional monodisciplinary geographic inquiries into a pluralistic research paradigm incorporating behavioral sciences and urban planning, among other disciplines [39]. This paradigmatic shift aspires to delve deeply into the complex and dynamic interdependencies between “behavioral demands” and “external facilities”, leveraging interdisciplinary research methodologies to attain a more holistic and nuanced understanding.
In terms of the scale of investigation into the distribution of innovation spaces, the existing research, due to a scarcity of data with precise geographical coordinates, has largely relied upon urban economic panel datasets. Consequently, the focus has primarily been on macro-regional analyses, encompassing countries [40,41,42,43,44,45,46,47], city clusters [48,49,50,51,52,53], and provinces [54,55]. In the era of big data, extensive datasets and advanced processing technologies enable a more precise interpretation of the interplay between innovation activities and the internal spatial structure of cities. With few studies having been conducted at this scale, the interpretation of the spatial and temporal distribution of urban innovation spaces at the microcity [56,57] and neighborhood scales [58] and the innovation actor perspective [59,60] have become a focus of attention. In terms of research methodology, empirical analyses have begun using big data, such as patents, as a characterization parameter of urban innovation spaces [61,62,63,64,65], to decipher and explain the spatiotemporal evolution of innovation spaces, as well as utilizing intrinsic paths as a reliable research tool. In this study, we leveraged the cross-scale research capabilities of urban big data, thereby enhancing the granularity and specificity of our findings and enabling a more precise depiction of the multi-layered and multidimensional characteristics inherent in the spatial organization of innovation.
Previous patent studies have centered on validating the efficacy of patent data as a credible metric of innovative activity [22,66], and examining how patent authorization and transfer reflect the geographic dispersion of innovation and the flow of knowledge [67,68]. There remains a lack of research that, from the core perspective of innovation actors, delves into their behavioral requirements and the implications these have on the innovation environment. This gap stands in contrast to the conventional geographical research paradigm that has predominantly focused on dissecting the spatial characteristics and changes in various patent distributions, often overlooking the intricate and dynamic interplay between innovation actors and their environments. In this study, from the vantage point of the behavioral needs of urban innovation actors, we harnessed urban big data to integrate the social demands of these actors with geographical components. By doing so, a more nuanced understanding of the divergent pathways of internal and external demands was obtained, along with the dependencies and reciprocal relationships among different types of urban innovation actors. This integrated approach aimed to illuminate how high-quality living and productive infrastructure can invigorate urban innovation dynamics.
In this study, we examined the spatiotemporal evolution of innovation spaces and the various actors in Guangzhou, as well as the behavioral dependence pathway of innovation spaces. The definition of innovation spaces was based on previous research [11,22,28,47,53,60,61,65,69], establishing the innovation spaces database with the patent application address, taking the patent application subject as the innovation actor in accordance with China’s patent statistics standard, and making use of GIS tools such as a kernel density analysis, hotspot analysis, standard deviation ellipse definition, and exploratory spatial data analysis. Precise geospatial positioning was used to analyze the spatiotemporal evolution of innovation spaces and the different actors, and to clarify the spatiotemporal evolution characteristics of urban innovation. The geographical detector model was also used to study the spatial correlation between innovation spaces, actors, and the supporting elements of innovation needs in Guangzhou City.
In this study, we concentrated on addressing the fundamental requirements of innovative behaviors, particularly those catering to the production and living necessities of highly skilled talent, a topic intimately linked to urban innovation spaces [70,71]. Our analysis centered on three pivotal factors, accessibility of transportation, educational resources, and the spatial carriers of innovative work environments, with the latter referring specifically to settings that facilitate innovative activities, such as office buildings and industrial parks. Educational resources span the entire spectrum from kindergarten to higher education institutions, with the objective of providing education and training to innovators. Transportation accessibility emphasizes the refinement of public transit networks, focusing particularly on the distribution of bus stops and subway entrances. By scrutinizing the case of Guangzhou, a pioneering megacity of innovation with a population exceeding 18 million, we not only highlighted its successes but also identified areas in need of improvement. The findings have significant relevance for other large cities, offering invaluable insights for developing cities and undertaking urban renewal. This case study demonstrated how enhancing and optimizing infrastructure for both production and living can effectively elevate a city’s overall capacity for innovation. This serves as an example of the potential for strategic infrastructure improvements to catalyze urban innovation ecosystems.

2. Materials and Methods
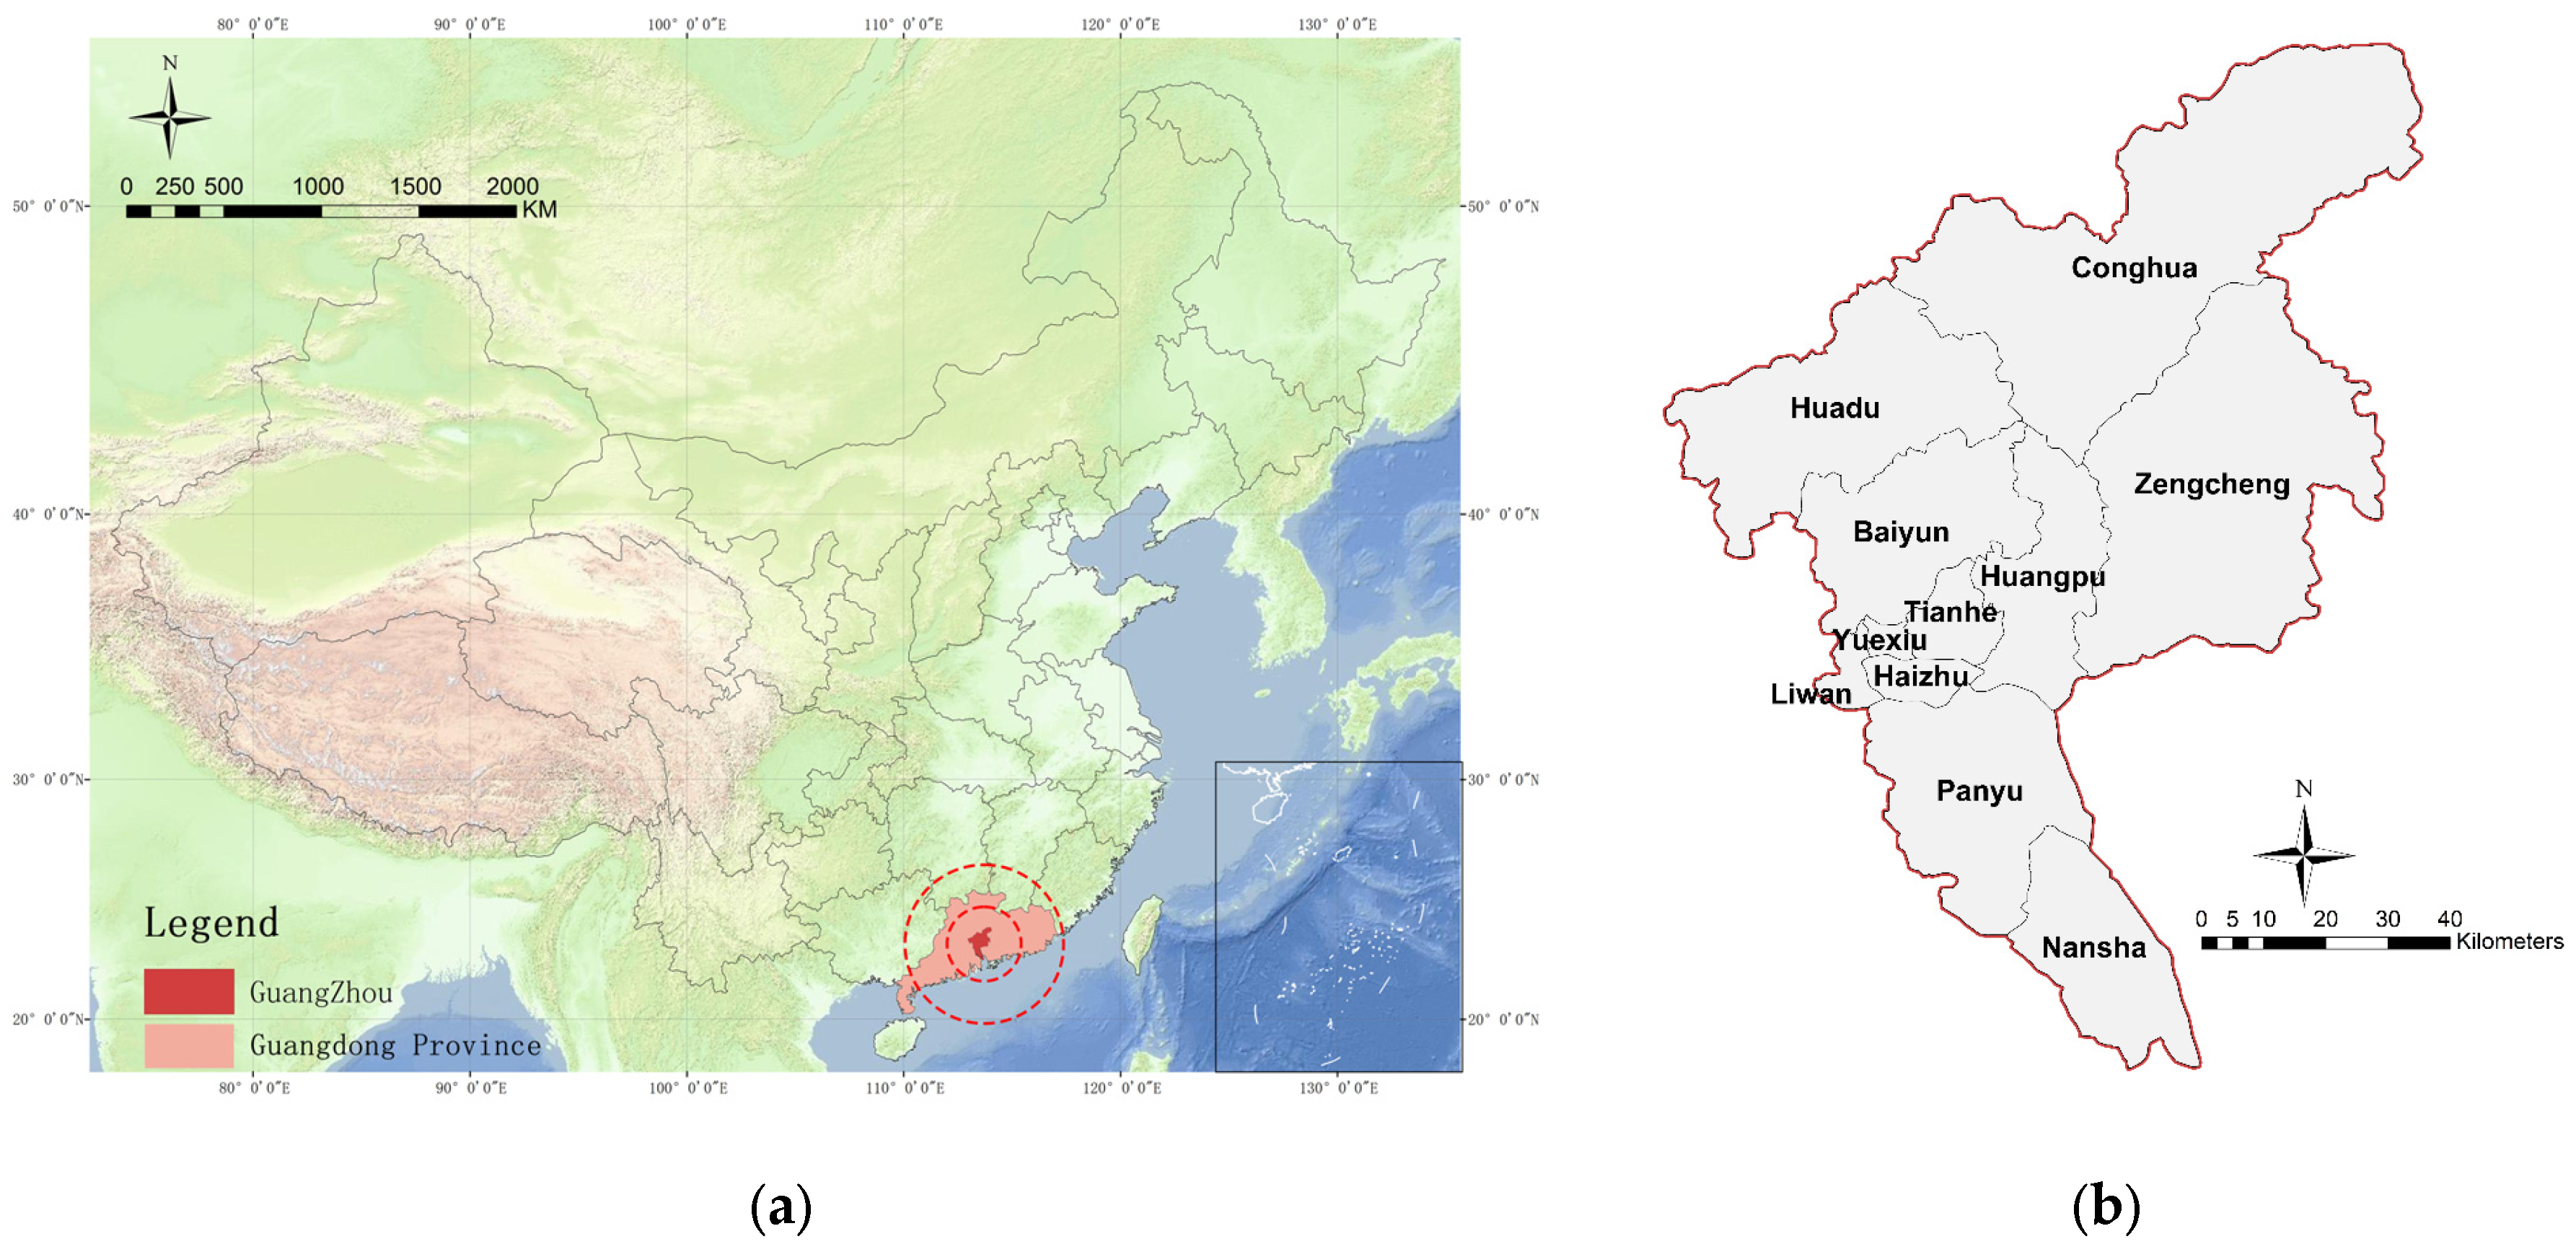
2.1. Study Area

Guangzhou, one of the top four cities in China and the seventh largest economy in Asia, has a strong focus on innovative industries to transform its economy. As an important city in China’s innovation movement, Guangzhou was recognized as the fourth most innovative city in China in 2023. “The 2ThinkNow Innovation Cities TM Index 2021”, from the Australian think tank “2ThinkNow”, showed that Guangzhou had climbed 23 places from 2019, ranking 51st in the world. This study focused on Guangzhou as a representative example of innovation development in China, and specifically covered 11 administrative districts within the city limits (Figure 1), over a total area of 7434 square kilometers.

2.2. Data Source

The main data used in this study included the following: (1) Scale data: City-scale data were obtained and organized according to the Guangzhou Statistical Yearbook and the Statistical Bulletin of the Guangzhou Municipal Bureau of Statistics in previous years. (2) POI data: Through the API interface of the Google Maps platform, we obtained and organized a total of 7711 points of interest of bus stations, 317 points of interest of subway stations, 4217 points of interest of educational resources, and 6001 points of interest of office buildings in the city of Guangzhou. (3) Patent approval data: The Wanfang Patent Database (https://c.wanfangdata.com.cn/patent (accessed on 19 November 2021)), whose patent resources are from Chinese and foreign patent databases, began in 1985, with more than 130 million domestic and foreign patent datapoints reliably covering all disciplines of the natural sciences. The data are synchronized with the State Intellectual Property Office, accurately reflecting the latest patent applications and approvals in China. For this study, we used the Wanfang Chinese and Foreign Patent Database as our primary data source. Using web page retrieval and information mining techniques, we obtained patent approval data in Guangzhou from 1990 to 2020. This included details such as the patent type, number, filing date, publication date, public number, applicant (patentee), inventor, and address. We collected a total of 457,527 records. To create a spatial database of innovation activity, we converted structured addresses, such as the address of the main applicant, into geographic coordinates using coding technology.

2.3. Research Methods

2.3.1. ArcGIS Spatial Analysis

According to the patent ownership address, the spatial landing point of the patent authorization data was used as the spatial distribution characterization of urban innovation actors, and the kernel density analysis, hotspot analysis, definition of standard deviation ellipse, and spatial autocorrelation analysis functions in the ArcGIS platform were used to derive the spatial distribution intensity, morphology, and potential spatial correlation differences of urban innovation actors.

Kernel Density Analysis

A kernel density analysis is used to calculate the estimated value of each point in the density function of the distribution of the target element in its surrounding neighborhood, and combine it with the established distance decay function to measure the change in the agglomeration density of the target element in the spatial range, and to illustrate the intensity of the aggregation of this element in the space. ArcGIS could then be used to draw a heat map of the spatial distribution of innovative activities, giving the spatial region of the hotspot distribution status of various elements, and the change characteristics.
For points x 1 , x 2 , …, x n , the specific KDE calculation formula is as follows:
D = 1 n h 2 n = 1 n k x x i h
where k(x) is the kernel function; n is the number of patent authorization datapoints; and h is the bandwidth. The bandwidth calculation formula is as follows:
h = 0.9 × m i n S D , 1 ln ( 2 ) × D m × n 0.2
where D m is the median value of the distance from each point to the mean entre; n is the number of patent application datapoints; and SD is the standard distance. The standard distance calculation formula is as follows:
S D = i = 1 n ( x i X ¯ ) 2 n + i = 1 n ( y i Y ¯ ) 2 n
where x i and y i are the coordinates of element i; X and Y denote the mean entre coordinates; and n is the number of patent application datapoints.

Hotspot Analysis

A hotspot analysis calculates the Getis–Ord Gi* statistic for each element in the statistical dataset, to obtain the location of the spatial clustering of high- or low-value elements. Using this method, we derived the hot and cold spot areas of the spatial distribution of innovative activities. It can be expressed as follows:
G i = j   w i j x j j   x j
z ( G i ) = G i E ( G i ) V A R ( G i )
where x j is the spatial unit observation and w i j is the spatial weight matrix of units i and j.

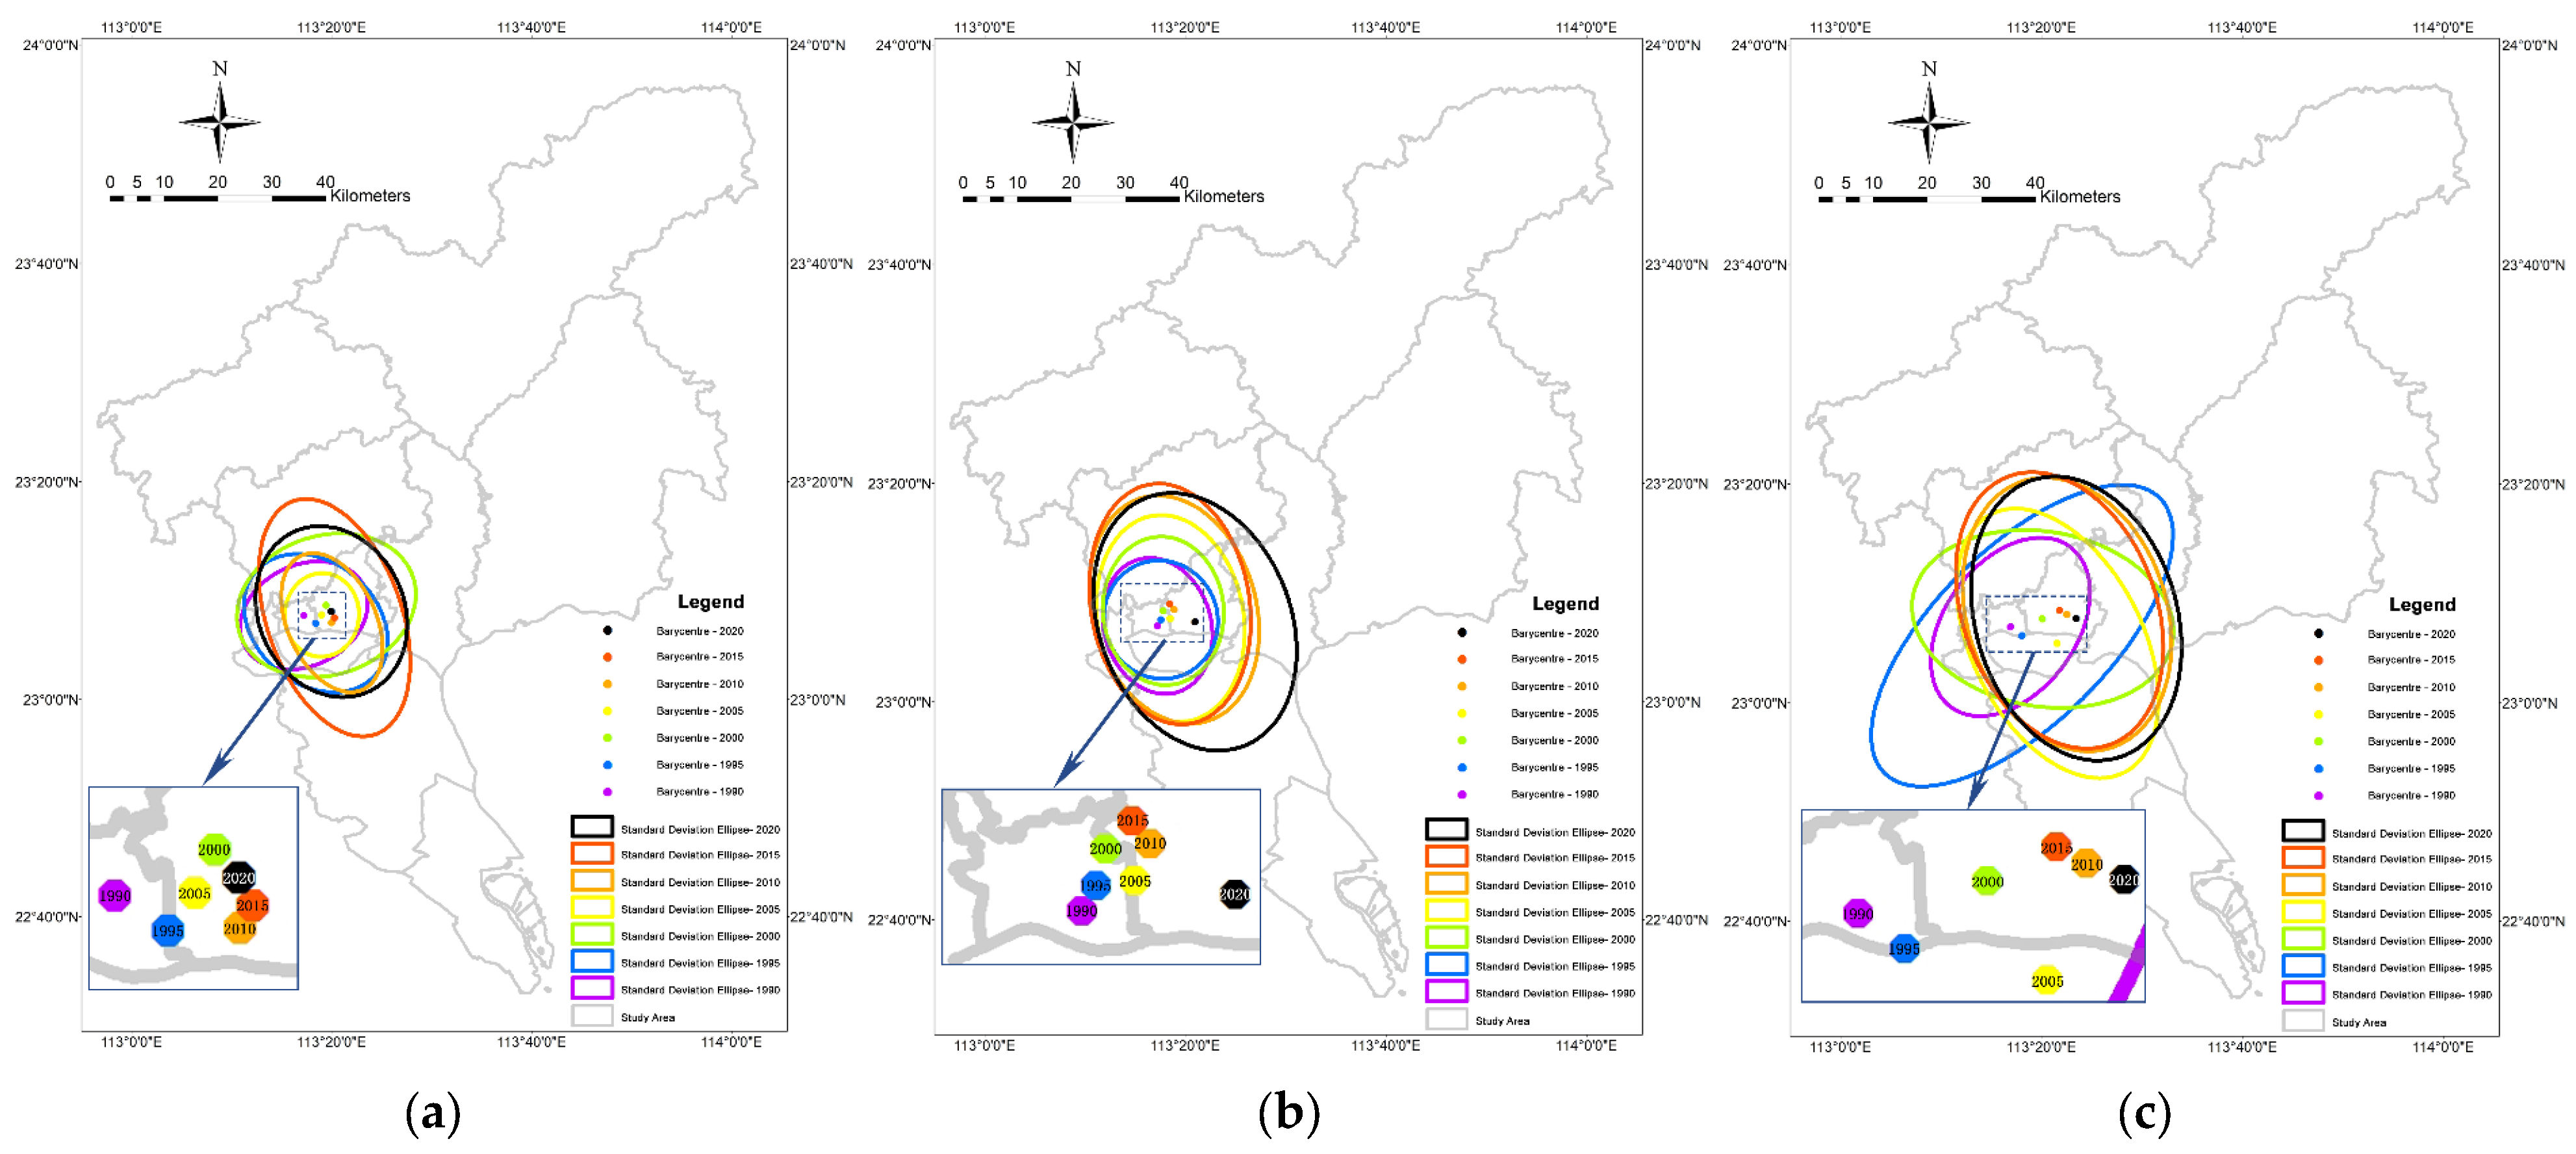
Standard Deviation Ellipse Definition

The standard deviation ellipse is a closed curve containing all the datapoints realized on the basis of the standard distance defined in the x and y directions of the projected coordinates of the spatial point data, which can reflect the overall distribution profile of the spatial elements of the nodes in geospatial space, the trend of the dominant direction of distribution, and the degree of dispersion. By defining the standard deviation ellipse of patent approval data in Guangzhou and extracting the surface attributes of the ellipse, including the calculation of parameters such as the average distribution center, the standard deviation distance of the long and short axes of the ellipse, and the ellipse azimuth angle tanθ, we were able to accurately depict the overall spatial distribution characteristics of the various innovation actors in the city. The formulas are as follows.
Average distribution center (center of gravity):
X w ¯ = i = 1 n w i x i i = 1 n w i ,   Y w ¯ = i = 1 n w i y i i = 1 n w i
Azimuth:
tan θ = i = 1 n w i 2 x ¯ i 2 i = 1 n w i 2 y ¯ i 2 + ( i = 1 n w i 2 x ¯ i 2 i = 1 n w i 2 y ¯ i 2 ) 2 + 4 i = 1 n w i 2 x ¯ i 2 y ¯ i 2 2 i = 1 n w i 2 x i ¯ y i ¯
X-axis standard deviation:
σ x = i = 1 n ( w i x i ¯ cos θ w i y i ¯ sin θ ) 2 i = 1 n w i 2
Y-axis standard deviation:
σ y = i = 1 n ( w i x i ¯ sin θ w i y i ¯ cos θ ) 2 i = 1 n w i 2
Here, n is the number of patent authorization datapoints; ( x i , y i ) is the geographical coordinate of the i t h Guangzhou patent authorization datapoint; w i denotes the weight; ( X w ¯ , Y w ¯ ) are the coordinates of the mean center of the distribution (the center of gravity); x i ¯ and y i ¯ denote the value of the geographical coordinates of the i t h Guangzhou patent authorization datapoint relative to the center of gravity; and σ x and σ y are the standard deviations along the x-axis and y-axis, respectively.

Exploratory Spatial Data Analysis

Moran’s I index is one of the most commonly used indicators to determine whether there is autocorrelation in entity space. Global Moran’s I was calculated by GeoDa software to determine whether there was a spatial correlation of urban innovation actors using a patent grant as a proxy parameter. The significant value of Global Moran’s I indicated the existence of spatial correlation of entities in the study area.
The value interval of Moran’s I is [−1, 1]; Moran’s I > 0 indicates the existence of positive spatial correlation in the spatial distribution, Moran’s I < 0 indicates the existence of negative spatial correlation in the spatial distribution, and Moran’s I = 0 or infinitely close to 0 indicates that the spatial distribution has no obvious correlation. On this basis, the local spatial autocorrelation (local Moran’s I) LISA index was used to quantify the correlation of the spatial distribution of patent grant data in Guangzhou. The specific calculation process of global Moran’s I is as follows.
We constructed the spatial weight matrix W for each administrative district within Guangzhou City. The principle of constructing the matrix element w i j is as follows:
W i j = 1           When   administrative   districts   i   and   j   are   adjacent   to   each   other   0     When   administrative   districts   i   and   j   are   not   adjacent   to   each   other
The spatial weight matrix was successfully constructed and the global Moran’s I index was calculated using the following formula:
I = n S 0 i = 1 n j = 1 n w i j z i z j i = 1 n z i 2
where z i is the deviation of the attribute of element i from its mean value; W i j is the spatial weight between elements i and j; n is the total number of patent authorization datapoints; and S0 is the aggregation of all the spatial weights. S0 was calculated using the following formula:
S 0 = i = 1 n j = 1 n w i j

2.3.2. Statistics of the Spatial Gini Coefficient

The spatial Gini coefficient is an indicator used to measure the degree of industrial spatial agglomeration. We used the spatial Gini coefficient to assess the degree of agglomeration in the spatial distribution of urban innovation actors in Guangzhou, characterized by patent grant data. The value of the spatial Gini coefficient is within [−1, 1], and the larger the value, the higher the degree of agglomeration of innovation of actors distributed in geographical space, and vice versa. G = 0 meant that innovative activities were evenly distributed throughout the geographical space. The specific calculation formula is as follows:
G = 1 2 m 2 X ¯ i = 1 m j = 1 m x i x j
where G is the spatial Gini coefficient; m is the number of patent datapoints in the region; x i and x j denote the numbers of patent datapoints in the i t h and j t h regions, respectively; and X ¯ is the average value of the variable x i .

2.3.3. The Geographical Detector Model

The geographical detector model is a set of statistical methods used to detect the spatial dissimilarity of a dependent variable, and thus clarify its causes [72]. The method can simultaneously detect two combinations of factors that interact on the dependent variable, and the interaction is identified by adding the product term of the two factors to the model and testing its statistical significance. The q-value of the detector explains the degree of influence of the independent variable on the spatial distribution pattern of urban innovation actors of the dependent variable, and it is between 0 and 1. The larger the value, the greater the influence on the spatial layout of urban innovation actors, and vice versa [73].

2.3.4. Research Process

We examined the spatial and temporal changes in innovation spaces and the intrinsic correlation between spatial representation and behavioral needs using data from Guangzhou City over the past 30 years. The aim was to identify pathways for optimizing the pattern of innovation spaces from the perspective of the needs of innovation actors. The research process was as follows. First, we analyzed the evolution characteristics of urban innovation spaces and the spatial distribution of their inherent entities. The specific process was as follows: (1) establish a measurement standard and apply the spatial Gini coefficient and kernel density method analysis to assess the temporal development characteristics and spatial agglomeration degree of urban innovation actors; (2) analyze the evolution characteristics of the spatial distribution and the intensity of spatial agglomeration with the standard deviation ellipse method; (3) apply a spatial autocorrelation analysis to examine both global and local spatial correlation characteristics. The geographical detector model was then employed to identify the inherent correlation between the spatiotemporal evolution and the three types of supporting elements, spatial carriers, educational services, and transport accessibility, which were classified based on the behavioral needs of innovation actors. Finally, the spatial and temporal evolution characteristics of Guangzhou’s innovation spaces and the intrinsic dynamic mechanism were summarized, and policy recommendations were provided for the future sustainable development of the innovative city.

3. Results

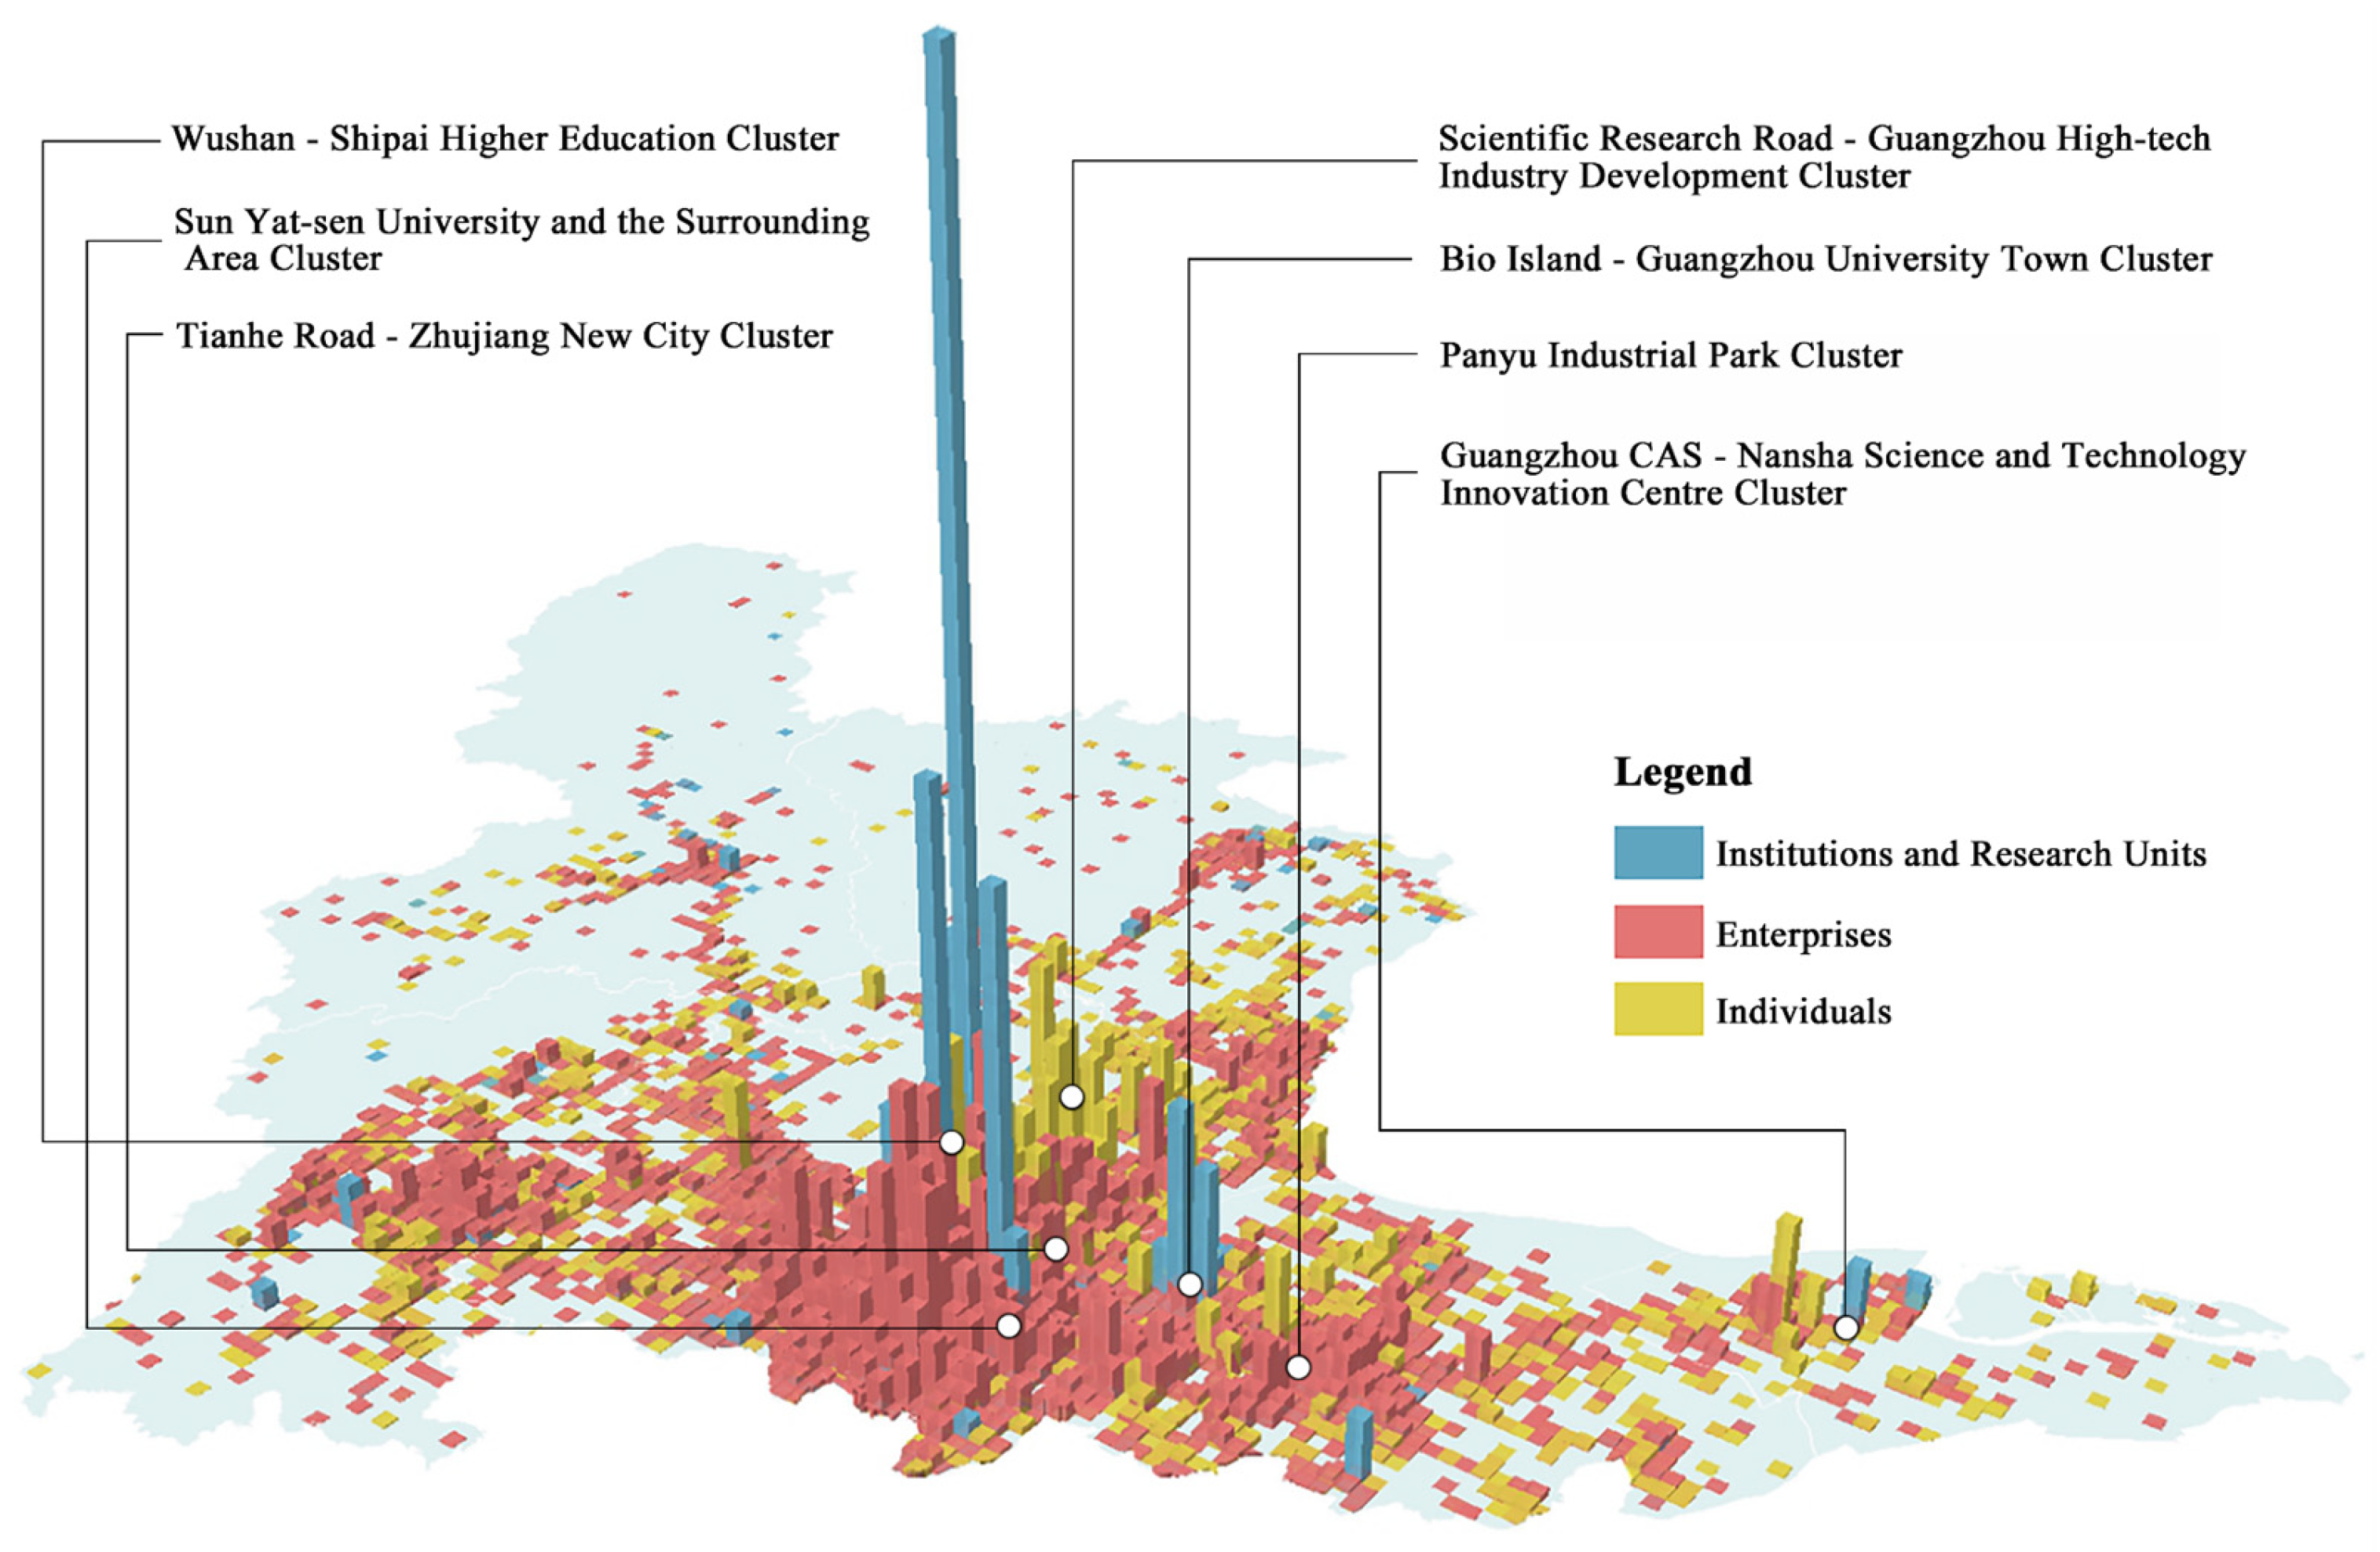
3.1. Innovation Space Distribution Characteristics

We first analyzed the distribution of patent grants in Guangzhou over the past three decades using the spatial Gini coefficient (Table 1) and the kernel density method (Figure 2) to investigate whether the spatial distribution of Guangzhou’s innovation spaces showed an evolution of agglomeration or diffusion effects over the period of 1990–2020.
In the past 30 years, the overall spatial Gini coefficient of innovation spaces in Guangzhou has remained within the range of 0.38 to 0.55, indicating that there has been a spatial agglomeration of innovation activities in Guangzhou as a whole, concentrated in multiple areas within the city. According to the results of seven temporal distribution profiles in the patent granting space of Guangzhou (Figure 2), the innovation spaces are mainly concentrated in two districts, the Tianhe and Yuexiu Districts, and have gradually spread to the periphery to form seven core districts, “Wushan—Shipai Higher Education Cluster”, “Scientific Research Road—Guangzhou High-Tech Industry Development Cluster”, “Sun Yat-sen University and the Surrounding Area Cluster”, “Tianhe Road—Zhujiang New City Cluster”, “Bio Island—Guangzhou University Town Cluster”, “Guangzhou CAS—Nansha Science and Technology Innovation Centre Cluster”, and “Panyu Industrial Park Cluster”, which all have a significantly higher number of urban innovation spaces than other areas (Figure 3). The “Wushan—Shipai Higher Education Catchment Area” has the highest innovation spatial intensity, with the density of patent data in the plate exceeding 6000 pieces/km2. The “Scientific Research Road—Guangzhou High-Tech Industrial Development Catchment Area” and “Zhongshan University and Surrounding Areas Catchment Area” have the second highest intensity of activities, with the average density of patent data in the plate ranging from 3000 to 4000 pieces/km2. The two districts, as well as the seven core districts, are connected into one piece and radiate outwards to other districts, forming an overall structure of center radiation.

3.2. Spatial–Temporal Evolution of Innovation Spaces

To investigate the characteristics of the evolution of the distribution pattern of urban innovation spaces in Guangzhou, we used the standard deviation ellipse method to define the standard deviation ellipse of the patent spatial distribution data, with a 1 km2 network unit as the fundamental spatial unit. Subsequently, seven different time slices were obtained, covering the years 1990, 1995, 2000, 2005, 2010, 2015, and 2020, which together represented 98% of the data volume. The analysis focused on examining the evolution of the center of gravity of the distribution of innovation spaces, along with its associated distribution direction, within Guangzhou across these time slices. The specific computational results are presented in Table 2 and Figure 4.
In terms of the trajectory of the center of gravity in the distribution of urban innovation spaces, the center of gravity in Guangzhou during the period of 1990–2020 was concentrated in the 113.28–113.36-degree eastern longitude and 23.13–23.16-degree northern latitude area. It was mainly located at the intersection of the Yuexiu and Tianhe Districts in Guangzhou. Over the past three decades, the center of gravity of innovation spaces (Table 3) has shifted from the northeast of Yuexiu District to the southwest of Tianhe District, “Guangdong Provincial People’s Stadium in Yuexiu District—The First Hospital Affiliated to Sun Yat-sen University—Guangdong Provincial Academy of Sciences—Yucai School in Yuexiu District, Guangzhou—Guangdong Provincial Government Compound in Tianhe District—Guangzhou Sports Institute—Shipaiqiao”, along the trajectory of movement. The standard deviation ellipse area showed an increasing trend of development, indicating that the scope of innovation spaces in Guangzhou from 1990 to 2020 showed a tendency of outward expansion and dispersion, mainly covering the Yuexiu, Tianhe, Haizhu, Liwan, Panyu, Huangpu, and Baiyun Districts, while the number of innovation spaces in the Zengcheng, Huadu, Conghua, and Nansha Districts was relatively small. This reflected the overall distribution pattern of “Core Concentration—Edge Sparseness” in urban and rural areas of Guangzhou. The overall trend of the flatness of the standard deviation ellipse was increasing, indicating that the spatial distribution of innovation spaces in Guangzhou along the northwest–southeast axis from 1990 to 2020 showed a gradual pattern of increasing diffusion. However, after 2015, there was an increasing trend of diffusion along the east–west axis.
The changes in the standard deviation ellipse (Figure 5) of the distribution of innovation spaces of the three different types of actors were analyzed. The evolution of innovation spaces of Guangzhou institutions and research units could be divided into four stages. In the first stage, from 1990 to 2000, the ellipses were all expanding, which indicated that innovation spaces were expanding to the periphery in a discrete manner. In the second stage, from 2000 to 2005, the ellipse was shrinking, indicating that innovation spaces tended to be concentrated, while the growth rate of innovation activities accelerated. In the third stage, from 2005 to 2015, the innovation spaces expanded dramatically, indicating a rapid expansion of innovation spaces, while the innovation spaces in areas originally distributed outside the ellipse grew, and the growth rate of the innovation spaces inside the ellipse was relatively slow compared to the previous stage. The fourth stage was from 2015 to 2020; the pace of innovation space development picked up and the contraction of innovation spaces gradually emerged.
The evolution of the standard deviation ellipse for individual-based innovation actors in Guangzhou City followed a similar pattern to that of the city as a whole. The long and short axes, as well as the total area, showed an increasing trend, indicating a discrete evolution of the spatial distribution of individual-based innovation actors from 1990 to 2020. The main direction of diffusion was along the northwest–southeast axis, but there was a clear tendency for diffusion to increase in the east–west direction after 2015.
Finally, the standard deviation ellipse of the spatial distribution of enterprises in Guangzhou was relatively complex, with the distribution direction changing from northeast–southwest to northwest–southeast before 2005, and the change in the overall distribution direction being completed in 2005. After this, the standard deviation ellipse of innovation actors of Guangzhou enterprises gradually expanded, indicating that the growth rate of innovation actors of enterprises outside the ellipse was accelerating, and their influence on the overall development of enterprise innovation was increasing. Correspondingly, the innovation speed of enterprises inside the ellipse was slowing down, and the level of innovation output was decreasing, resulting in a spatial expansion trend.
Overall, between 1990 and 2020, the degree of spatial agglomeration of innovation in Guangzhou showed a decreasing trend, indicating an increase in the degree of spatial decentralization of innovation over time. Although there was a short-lived clustering trend from 2015 to 2020, the overall trend was discrete. Over the past three decades, there has been a growth in agglomeration within the innovation spaces of institutions and research units. In contrast, the innovation spaces of individuals and enterprises have shown discrete diffusion, with a relatively high degree of individual innovation spaces.

3.3. Temporal Evolution of the Spatial Correlation

To analyze the evolving dynamics of the distribution of innovation activity in the broader spatial context, we examined the agglomeration characteristics of innovation actors across 7700 1 km×1 km spatial units in Guangzhou City. We used the ESDA method to compute the global Moran’s I index, which measured the spatial autocorrelation of patent grants in Guangzhou City over seven time periods (Table 4).
The Moran’s I index for innovation actors in Guangzhou from 1990 to 2020 was greater than 0 and passed the significance level test. This indicated a significant positive spatial correlation in the distribution of urban innovation actors in Guangzhou, suggesting that the spatial arrangement was not random. Areas with similar levels of innovation output in Guangzhou showed a clustered distribution pattern, where regions with higher levels of innovation activity were spatially close to each other, while areas with lower levels of innovation activity also shared a neighborhood relationship. These findings highlighted the presence of a significant spillover effect in urban innovation actors within Guangzhou. Over the past three decades, the Moran I index of overall innovation activity in Guangzhou has shown a pattern of initial decline followed by recovery. This suggests a weakening and subsequent strengthening of the positive spatial correlation. From 1990 to 2010, the Moran’s I index declined from 0.421 to 0.260, indicating an intensification of spatial heterogeneity in the output of innovation actors in Guangzhou and, accordingly, the spatial pattern tended to be polarized. However, from 2010 to 2020, the Moran’s I index gradually increased and reached 0.375. This indicated an increasing spatial correlation in the performance of innovation actors in Guangzhou. During this period, innovation linkages between different regions in Guangzhou were strengthened, leading to an increase in innovation synergies.

3.4. Path Dependence Research on Urban Innovation Spaces, Actors, and Behavioral Needs in Guangzhou City

3.4.1. Influencing Factors

As demonstrated previously, Guangzhou’s innovation spaces have been concentrated in the city center and seven cores, including the “Wushan—Shipai Higher Education Cluster”, “Scientific Research Road—Guangzhou High-Tech Industry Development Cluster”, and “Sun Yat-sen University and Surrounding Areas Cluster”, over the course of 30 years of development. Referring again to the results of existing research on the demand for innovative behavior [2,3,6,8,9,11,16,27,41,48,57], we assumed that there are three main types of support elements for the behavioral needs of innovative actors: transportation accessibility, educational resources, and spatial carriers.
  • Transportation accessibility
As a social common capital for high-quality urban development, the convenience of urban transportation is related to urban commuting, and the higher the accessibility of urban transportation, the better the circulation and interaction of factors of production between urban areas, and the more efficient the urban innovation [74]. Transportation accessibility can usually be assessed based on three main elements: the density of urban roads and the spatial density of bus stops and subway stations. Based on these considerations, we hypothesized that the convenience of urban transport conditions directly influences the spatial layout and development of urban innovation spaces. It was expected that areas with more convenient transport conditions would have a higher intensity of the distribution of innovation spaces.
2.
Educational resources
Education is a fundamental driver of urban innovation spaces, and the level of education in a city plays an important role in determining the local innovation capacity [75]. Educational resources are not only important for the education of the inventor’s children, but also for the inventor’s own continuing education. They are one of the main factors of urban innovation, and their spatial distribution density in a city significantly affects the spatial pattern of urban innovation spaces. We proposed the hypothesis that the spatial distribution of educational resources within a city has a direct impact on the spatial layout and development of urban innovation spaces. It was expected that regions with a denser distribution of educational resources would have a higher level of innovation output.
3.
Spatial carriers
Office buildings, as the main spatial carrier of innovation activities, are not only conducive to the creation of innovation spaces, but also attract innovation actors and capital [76]. As an important hub for urban patent output, the spatial distribution of urban office buildings (Table 5) influences the spatial pattern of urban innovation spaces to some extent. Based on this, the following hypothesis was proposed in this study: the spatial distribution of office buildings within the city directly influences the layout and development of urban innovation spaces. It was expected that regions with a denser distribution of spatial carriers would have a higher intensity of innovation activities.

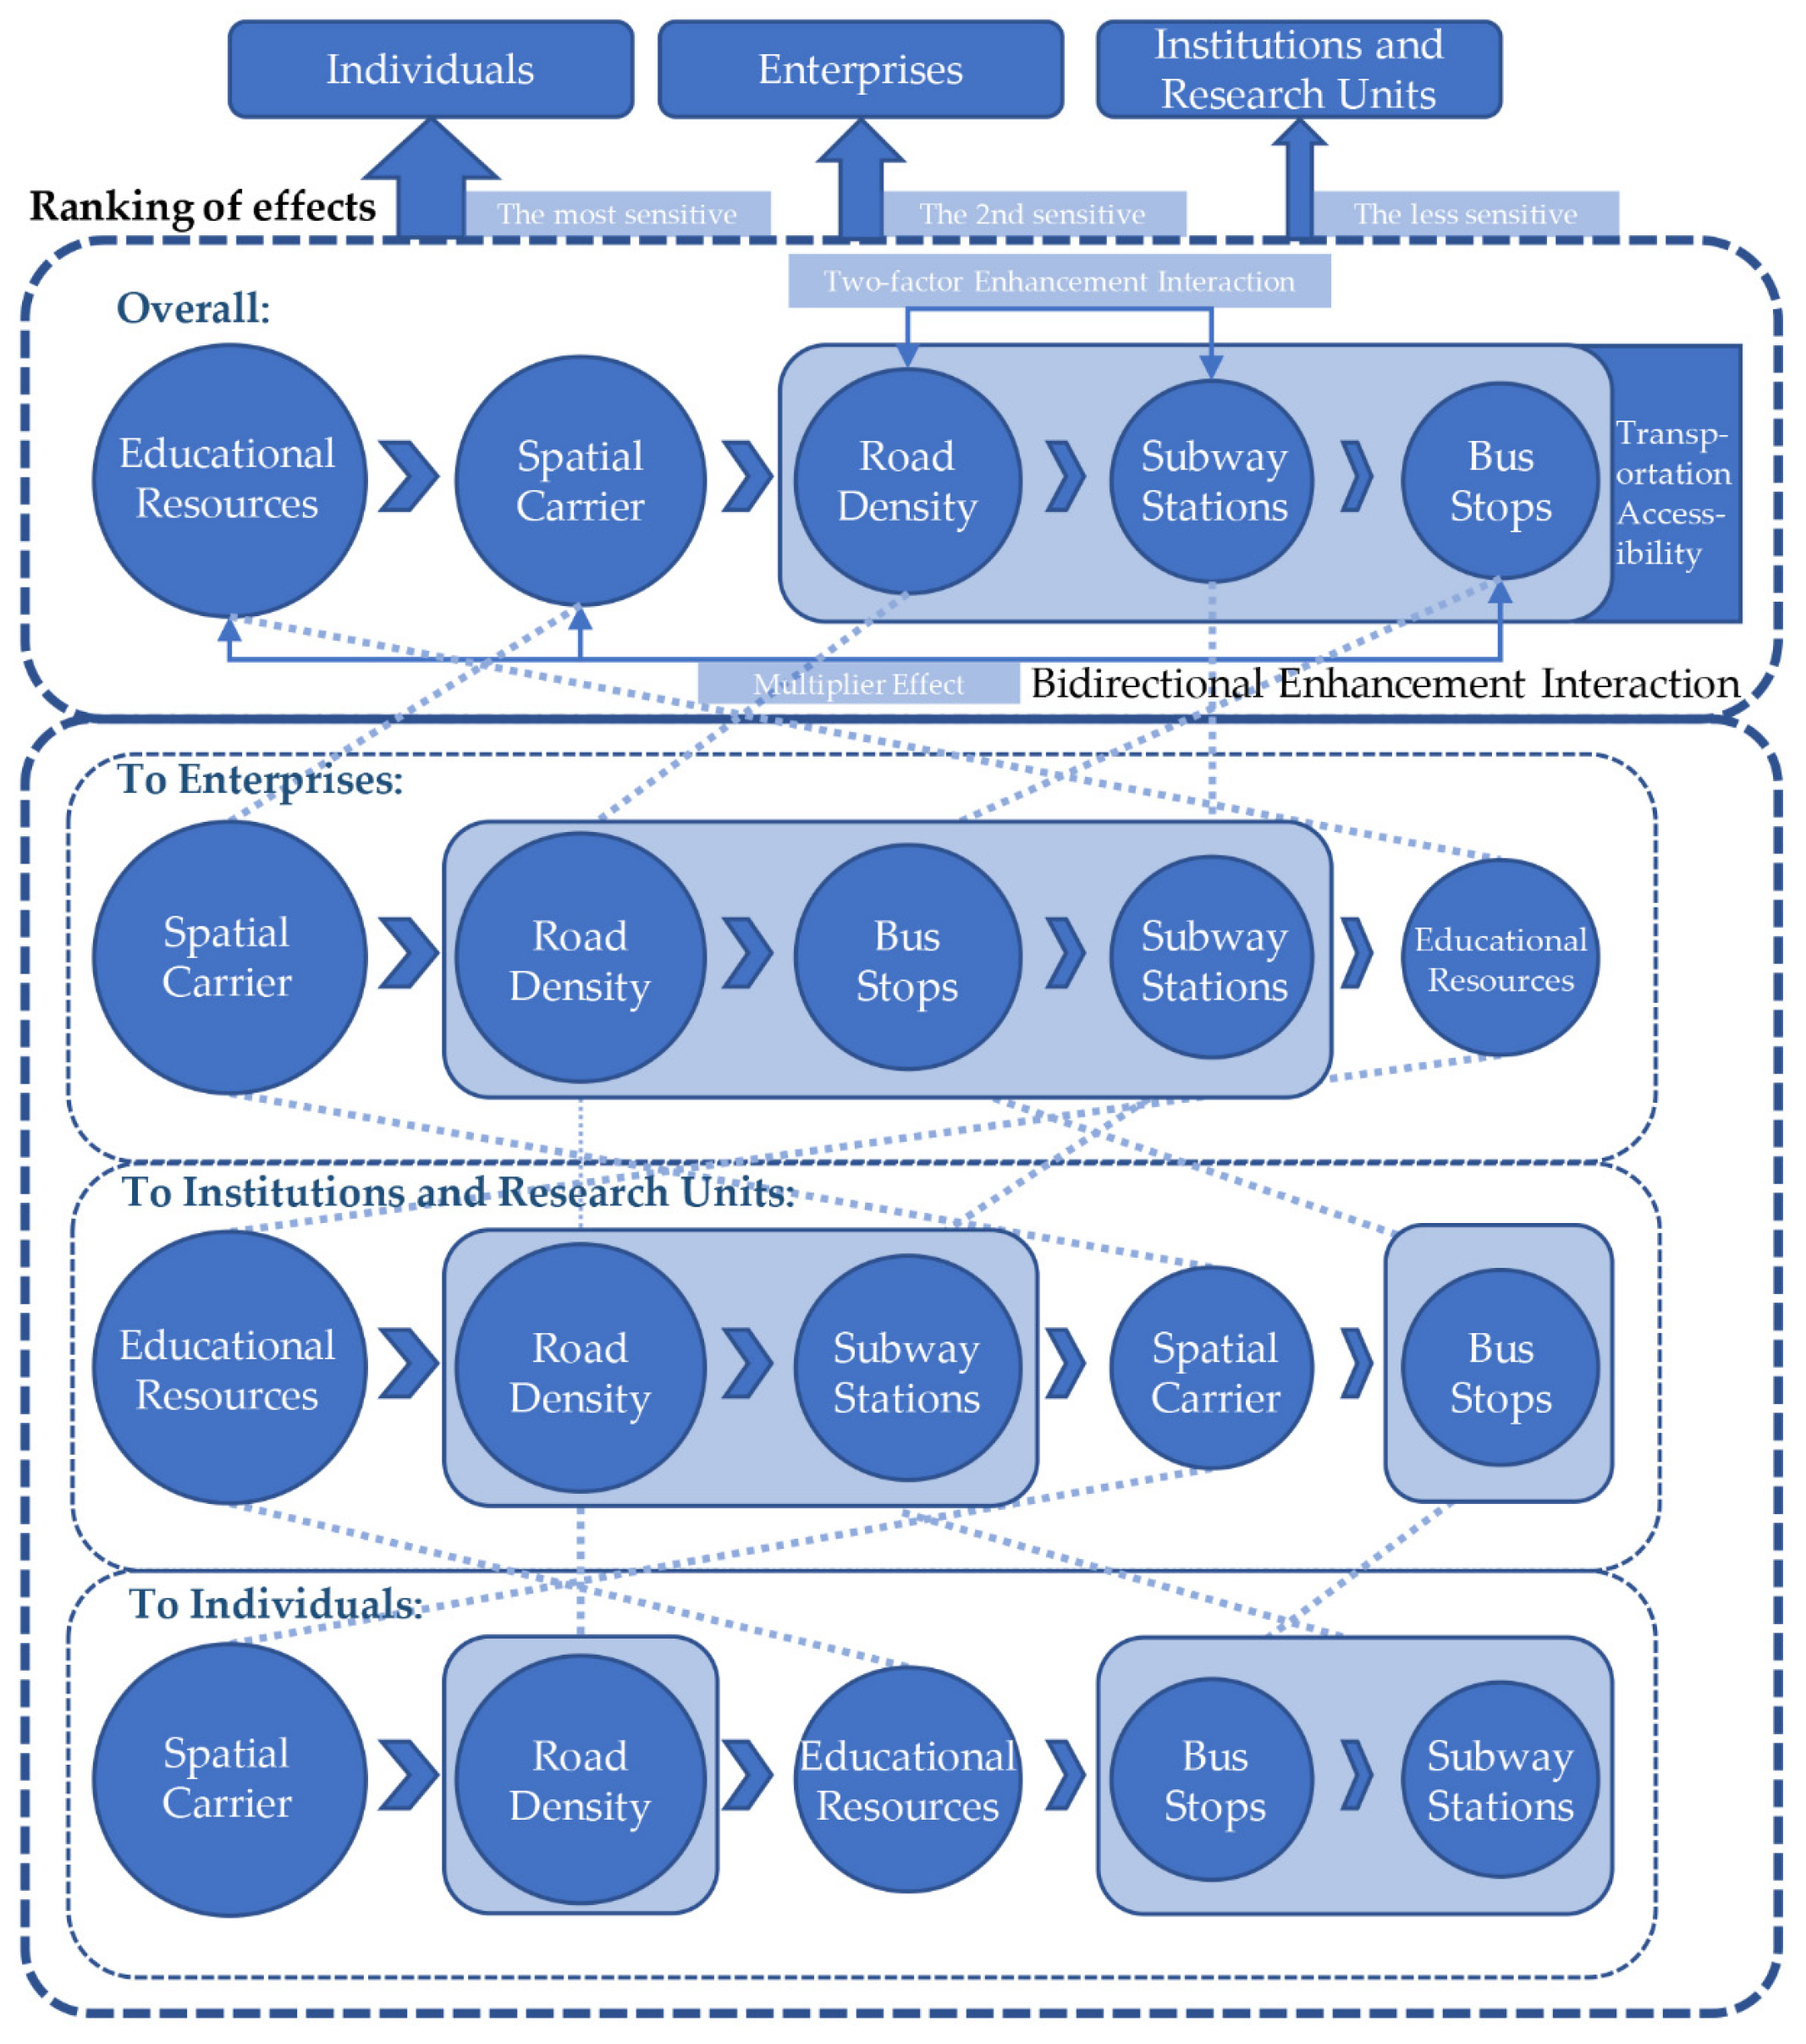
3.4.2. Path Dependence Research

We examined the entire spatial extent of Guangzhou City as the sample area. The spatial density of patent grants in Guangzhou City over the past thirty years, from 1990 to 2020, was used as the dependent variable. The independent variable indices included the current road network, bus stops, subway stations, educational resources, and the density of the distribution of office building points of interest (POIs) in Guangzhou. Based on previous research, the ArcGIS Reclass tool was used to classify the values of each continuity detection factor into five classes, and the resulting output is shown in Figure 6. The geographic detector was used to perform a single-factor detection analysis for each hypothesized factor, and the specific results are presented in Table 6.
All five independent variables passed the significance test (Table 6), indicating a strong relationship between these influencing factors and the distribution of innovation spaces. Among them, individuals were the most sensitive to these five factors, followed by the overall level, and then enterprises. Institutions and research units were relatively sensitive only to the distribution of educational resources, with little correlation with other factors. Overall, educational resources had the greatest influence on the distribution of innovation in Guangzhou, followed by spatial carriers, road density, metro stations, and bus stops. This suggested that educational resources play a crucial role in the city’s distribution of innovation. The distribution of innovative individuals was most affected by spatial carriers, followed by road density, educational resources, bus stops, and subways. This suggested that individuals are primarily concentrated in urban centers and sub-centers, with convenient learning and office environments promoting the agglomeration of innovative individuals. The distribution of firms was mainly influenced by spatial carriers, followed by road density and bus stops, while the influence of metro stations and educational resources was relatively weak. This indicated that the innovation of existing firms relies heavily on good transportation locations, and the innovation link between universities and firms is relatively weak. These findings demonstrated that innovation actors rely on transportation accessibility, educational resources, and spatial carriers to varying degrees, with both similarities and differences observed.
To explore the interaction between these factors in more detail, and to investigate whether their combined effect increases or decreases the spatial arrangement of urban innovation actors, or whether the influence of these factors on the spatial pattern of urban innovation actors is independent of each other, the interaction detector was used to identify mutual interactions between pairs of factors, resulting in the generation of interaction detections [77]. In total, five types of interactions were identified. (1) If the q-value of the two-factor interaction was smaller than the minimum q-value observed when each of these two factors acted individually on the dependent variable, it was classified as a nonlinear attenuated interaction. (2) If the q-value of the two-factor interaction fell between the minimum and maximum q-values observed when each of these two factors acted on the dependent variable individually, it was classified as a single-factor unilinear attenuated interaction. (3) If the q-value of the two-factor interaction was greater than the maximum q-value observed when each of these two factors acted on the dependent variable individually, it was classified as a bidirectional enhancement interaction. (4) If the q-value of the two-factor interaction was equal to the sum of the q-values of the two factors when each of these factors acted individually on the dependent variable, it was classified as an independent interaction. (5) If the q-value of the two-factor interaction was greater than the sum of the q-values of the two factors when each of these factors acted on the dependent variable individually, it was classified as a nonlinear enhancement interaction. The results of the specific operations are shown in Table 7.
In Table 6, the q-value on the diagonal of the table is smaller than the q-value in the lower triangle, which indicates that the effect of two factors was greater than that of one factor on the spatial pattern of urban innovation actors, and thus, all five influencing factors showed bidirectional enhancement interactions. For the innovation actors such as universities and research institutes, among the five influencing factors, except for the interaction between subway stations and road density, which is a two-factor enhancement interaction, all other factors were nonlinear enhancement interactions, showing the multiplier effect of 1 + 1 > 2. This indicated that the five factors had a particularly obvious influence on universities and research institutes.

4. Discussion

Guangzhou’s innovation spaces have expanded rapidly from a single core driven by the central city in the early stage, and the spillover has formed multiple cores synchronously. Knowledge innovation spillover diffusion and specialization agglomeration developed simultaneously, and the innovation spaces showed different trends. With the expansion of urban land use, innovative spaces spread to areas located in central and sub-central districts, illustrating knowledge overflow. The spillover effect was particularly evident in the expansion of patent individuals and enterprises. The direction and speed of the expansion of patent individuals aligned with the city’s development, while patent enterprises displayed fluctuations and instability, and institutions and research units exhibited diffusion followed by agglomeration.
In terms of influencing factors, urban innovative land frog-leap development led to the rapid development of enterprise spaces, but innovation spillovers to the periphery were significantly different for institutions and research units, as well as individuals. Transportation accessibility, educational resources, and spatial carriers all had a significant impact on the pattern of urban innovation spaces, and the difference in the intensity was obvious, in which the spatial carrier layout had the greatest impact, followed by road density, the layout of educational resources, and bus stops and subways. The influencing factors of innovation were shown to be a two-factor enhancement in the interaction, in which the impact of the combination of spatial carriers and educational resources was higher than the impact of other combinations.
Regarding specific pathways of innovation dependence, spatial carriers remained the most influential factor for innovative individuals. The strongest interactions were with educational resources, subway stations, road density, and bus stops, which also provided reference factors for the location of spatial carriers. For enterprises, the role of spatial carriers and bus stops was the strongest, followed by spatial carriers and educational resources, road density, and subway stations. When selecting the location for colleges and research institutes, the optimal area can be determined by assigning values to bus stops, road density, and subway stations, which have the strongest mutual reinforcement, being twice as effective as the sum of two alone. The force between spatial carriers and educational resources, road density, and subway stations was 1.3–1.5 times as effective, followed by other factors (Figure 7).
To enhance the provision efficiency of these elements, we propose leveraging existing data models to promote the spatial clustering of educational resources and spatial carriers within the allowable limits of urban spatial capacity. This would facilitate a beneficial synergy and cumulative effects among resource components, concurrently advancing the creation of an easily accessible innovative milieu within a 15 min walking radius [37], thereby fostering an environment conducive to spontaneous ideation and collaboration. Of particular note is the striking heterogeneity exhibited by innovation actors in their respective dependency patterns. Individuals and enterprises tend to place greater emphasis on the support provided by spatial carriers, whereas institutions and research organizations exhibit a heightened reliance on the abundance of educational resources. Furthermore, there exists a conspicuous variation among actors in the prioritization of these three crucial supporting elements. Urban planning practices should ingeniously harness the strategic placement of transportation resources [34], while reinforcing connectivity and synergy between educational resources and spatial carriers. This integrated approach could facilitate a deep integration and optimized allocation of these three resources, thereby accelerating the clustering of innovation actors and stimulating regional innovative vitality. To attain these objectives, maximize resource utilization, and circumvent the adverse effects of over-concentration, including skyrocketing living expenses, it will be imperative to integrate meticulous data modeling techniques into smart city governance [33]. Incorporating multi-faceted assessments, including environmental impact evaluations and housing price dynamics, into decision-making processes would ensure a comprehensive and scientifically grounded approach. Only through such a holistic strategy can we simultaneously foster innovation and development, safeguard the sustainable progression of our cities, and secure a steady enhancement in residents’ living standards.

5. Conclusions

The capacity for urban innovation has become a symbol of contemporary urban development. To promote sustainable urban innovation, it is crucial to match and optimize innovation spaces, innovation actors, and their behavioral needs. Therefore, in this study, we focused on the spatial correlation of innovation spaces, actors (i.e., institutions and research units, individuals, and enterprises entities), and the supporting elements of their behavioral needs (i.e., transport accessibility, educational resources, spatial carriers) in Guangzhou City, and investigated the path dependence of spaces, actors, and behavioral needs from the perspective of the interaction between innovation space layouts and behavioral needs. Distinct from prior geographical studies that solely investigated spatial distribution patterns and inferred underlying motivations, this research directly bridged the gap between inherent demands and external environments. It further established a quantifiable research model for the “behavioral needs–external facilities” interaction, thereby illuminating the intricate and dynamic interplay amongst diverse innovation actors. Concurrently, we established an empirical grounding for spatial planning decisions, contributing a practical dimension to the theoretical comprehension of innovation ecosystems.
We utilized GIS tools, including a kernel density analysis, a hotspot analysis, the standard deviation ellipse definition, an exploratory spatial data analysis, and the spatial Gini coefficient, to analyze patent grant data from 1990 to 2020. The findings indicated that the innovation spaces of Guangzhou have expanded from a monocenter to the peripheral north–west–south–east axis, presenting a center-radiation structure of ‘two districts and seven cores’. Different innovation actors exhibited diverse characteristics. Subsequently, we employed the Geodetector model to conduct an in-depth analysis, revealing that during their development process, the core supporting elements for different innovation actors significantly converged on two primary aspects: educational resources and spatial carriers. In conclusion, the three major innovation support elements have aligned well with the spatial development of urban innovation in Guangzhou over the past 30 years. This will provide theoretical support for the city’s sustainable innovation development in the future.
The findings of this study indicated that, in developing cities similar to Guangzhou, knowledge innovation relies on aggregating public facilities, such as education centers, well-equipped office spaces, and effective transportation systems. This is a typical feature of infrastructure-led economic activity aggregation. When making decisions about the layout and construction of innovation spaces, the government should prioritize infrastructure construction based on the demand characteristics of different invention subjects. This can be achieved by utilizing the different dependency pathways and paths of innovation demand, and by reasonably matching multiple groups of facilities to achieve the maximum use of resources. This will promote the sustainable development of innovation spaces.
In addition, while we capitalized on urban patent and infrastructure big data to delve into the behavioral needs and dependency pathways of innovation actors, several limitations are acknowledged. Primarily, this research was concentrated on the interactive influence of public service facilities in urban planning and management on the spatial distribution of innovation actors. However, we did not further refine the categorization of innovation actors based on variables such as age, education level, workforce size, or industry scope. Additionally, we did not validate the practical application efficiency of patents, nor undertake a more nuanced classification of infrastructure types; for instance, educational facilities could be segmented into those catering to school-aged children versus adult education, among others. Furthermore, we did not extensively examine policy environments and cultural and recreational amenities—like parks, green spaces, and cultural facilities—that also impact the clustering of innovation actors, nor did we consider variations in residential environment quality, property management services, living expenses, commuting times, and land costs across different locations, all of which play a pivotal role in shaping the spatial decisions made by these actors. These unexplored dimensions, including the influence of leisure facilities and living conditions, represent avenues for future research.

Author Contributions

Conceptualization, L.Q. and Y.C.; Data curation, Y.Z. and Y.C.; Methodology, L.Q., Y.Z. and Y.C.; Resources, Y.C. and X.W.; Supervision, L.Q. and X.W.; Validation, Y.C., L.C. and S.Z.; Visualization, Y.Z. and Y.C.; Writing—original draft, Y.Z. and Y.C.; Writing—review and editing, L.Q. and X.W. All authors have read and agreed to the published version of the manuscript.

Funding

This research was funded by the Natural Science Foundation of Guangdong Province (2016A030313557), and Philosophy and Social Science Planning of Guangdong Province, in 2023 (GD23XYS031).

Data Availability Statement

The data supporting the findings of this research are available within the article.

Conflicts of Interest

Author Yuanyi Chen was employed by the Guangdong Guodi Planning Technology Co., Ltd. The remaining authors declare that the research was conducted in the absence of any commercial or financial relationships that could be construed as a potential conflict of interest.

References

  1. Feldman, M.P. The Geography of Innovation; Springer Science & Business Media: Berlin/Heidelberg, Germany, 1994; Volume 2, ISBN 0-7923-2698-9. [Google Scholar]
  2. Du, D. Glocal S&E Innovation Centre: Motivation and Model Shanghai; Shanghai People’s Publishing House: Shanghai, China, 2015; ISBN 978-7-208-12794-4. [Google Scholar]
  3. Mendoza-Silva, A. Innovation Capability: A Systematic Literature Review. Eur. J. Innov. Manag. 2021, 24, 707–734. [Google Scholar] [CrossRef]
  4. Lachang, L.; Ru, H.; Qian, L. Several Theoretical Issues on Innovation Geography. Sci. Geogr. Sin. 2016, 36, 653–661. (In Chinese) [Google Scholar]
  5. Florida, R. The Rise of the Creative Class–Revisited: Revised and Expanded; Basic Books (AZ): New York, NY, USA, 2014; ISBN 0-465-04248-1. [Google Scholar]
  6. Drivas, K.; Economidou, C.; Karkalakos, S.; Tsionas, E.G. Mobility of Knowledge and Local Innovation Activity. Eur. Econ. Rev. 2016, 85, 39–61. [Google Scholar] [CrossRef]
  7. Qiao, Y.; Ding, C.; Liu, J. Localization, Knowledge Spillover, and R&D Investment: Evidence of Chinese Cities. J. Urban Manag. 2019, 8, 303–315. [Google Scholar]
  8. Drivas, K.; Economidou, C.; Karamanis, D.; Sanders, M. Mobility of Highly Skilled Individuals and Local Innovation Activity. Technol. Forecast. Soc. Chang. 2020, 158, 120144. [Google Scholar] [CrossRef]
  9. Wang, J.; Liu, N.; Ruan, Y. Influence Factors of Spatial Distribution of Urban Innovation Activities Based on Ensemble Learning: A Case Study in Hangzhou, China. Sustainability 2020, 12, 1016. [Google Scholar] [CrossRef]
  10. Brown, P.; Bocken, N.; Balkenende, R. Why Do Companies Pursue Collaborative Circular Oriented Innovation? Sustainability 2019, 11, 635. [Google Scholar] [CrossRef]
  11. Lima, V.A.; Da Silva Müller, C.A. Why Do Small Businesses Innovate? Relevant Factors of Innovation in Businesses Participating in the Local Innovation Agents Program in Rondônia (Amazon, Brazil). RAI Rev. Adm. Inovação 2017, 14, 290–300. [Google Scholar] [CrossRef]
  12. Liefner, I.; Brömer, C.; Zeng, G. Knowledge Absorption of Optical Technology Companies in Shanghai, Pudong: Successes, Barriers and Structural Impediments. Appl. Geogr. 2012, 32, 171–184. [Google Scholar] [CrossRef]
  13. Stejskal, J.; Mikušová Meričková, B.; Prokop, V. The Cooperation between Enterprises: Significant Part of the Innovation Process: A Case Study of the Czech Machinery Industry. Bus. Adm. Manag. 2016, 19, 110–122. [Google Scholar] [CrossRef]
  14. Duan, D.Z.; Du, D.B.; Chen, Y.; Zhai, Q.H. Spatial-Temporal Complexity and Growth Mechanism of City Innovation Network in China. Sci. Geogr. Sin. 2018, 38, 1759–1768. (In Chinese) [Google Scholar]
  15. Zhou, C.; Zeng, G.; Shang, Y. Progress and Prospect of Research on Innovation Networks: A Perspective from Evolutionary Economic Geography. Econ. Geogr. 2019, 39, 27–36. (In Chinese) [Google Scholar]
  16. Liu, N.; Wang, J.; Song, Y. Organization Mechanisms and Spatial Characteristics of Urban Collaborative Innovation Networks: A Case Study in Hangzhou, China. Sustainability 2019, 11, 5988. [Google Scholar] [CrossRef]
  17. Hernández-Trasobares, A.; Murillo-Luna, J.L. The Effect of Triple Helix Cooperation on Business Innovation: The Case of Spain. Technol. Forecast. Soc. Chang. 2020, 161, 120296. [Google Scholar] [CrossRef]
  18. Feng, Z.; Cai, H.; Chen, Z.; Zhou, W. Influence of an Interurban Innovation Network on the Innovation Capacity of China: A Multiplex Network Perspective. Technol. Forecast. Soc. Chang. 2022, 180, 121651. [Google Scholar] [CrossRef]
  19. Zhao, W.; Zhu, C.; Zhu, Y. The Comparative Advantage of Cities and Innovation Value Chain: Evidence from China. Sustainability 2022, 14, 3510. [Google Scholar] [CrossRef]
  20. Anttonen, M.; Lammi, M.; Mykkänen, J.; Repo, P. Circular Economy in the Triple Helix of Innovation Systems. Sustainability 2018, 10, 2646. [Google Scholar] [CrossRef]
  21. Wang, Y.; Liu, Z. Research on the Regional Cooperation Innovation Network of Universities in the Guangdong–Hong Kong–Macao Great Bay Area. Sustainability 2023, 15, 9838. [Google Scholar] [CrossRef]
  22. Acs, Z.J.; Anselin, L.; Varga, A. Patents and Innovation Counts as Measures of Regional Production of New Knowledge. Res. Policy 2002, 31, 1069–1085. [Google Scholar] [CrossRef]
  23. Huang, H.-C.; Su, H.-N. The Innovative Fulcrums of Technological Interdisciplinarity: An Analysis of Technology Fields in Patents. Technovation 2019, 84, 59–70. [Google Scholar] [CrossRef]
  24. Xue, L.; Zhang, Q.; Zhang, X.; Li, C. Can Digital Transformation Promote Green Technology Innovation? Sustainability 2022, 14, 7497. [Google Scholar] [CrossRef]
  25. Zhang, Z.; Jin, J.; Li, S.; Zhang, Y. Digital Transformation of Incumbent Firms from the Perspective of Portfolios of Innovation. Technol. Soc. 2023, 72, 102149. [Google Scholar] [CrossRef]
  26. Wu, K.; Chen, Y.; Liu, Y.; Wang, M.; Ye, Y.; Gong, W. ICTs Capability and Strategic Emerging Technologies: Evidence from Pearl River Delta. Appl. Geogr. 2023, 157, 103019. [Google Scholar] [CrossRef]
  27. Teirlinck, P.; Spithoven, A. The Spatial Organization of Innovation: Open Innovation, External Knowledge Relations and Urban Structure. Reg. Stud. 2008, 42, 689–704. [Google Scholar] [CrossRef]
  28. Zhu, K. The “Group” Pattern and “Weave” Guidance of Urban Innovation Space from the Perspective of Government Involvement: A Case Study of Nanjing. City Plan. Rev. 2015, 39, 49–53+64. (In Chinese) [Google Scholar]
  29. Sheng, L.; Hong, N.; Huang, L.; Zhang, H. From a Capital-Driven to an Innovation-Driven Global City: How New York City Emerged as a Science and Technology Innovation Center. Urban Dev. Stud. 2015, 22, 92–101. (In Chinese) [Google Scholar]
  30. Wang, L.; Xue, Y.; Wang, Z. Urban Renewal, Innovative Neighborhoods and High Quality Urban Development. Urban Dev. Stud. 2020, 27, 67–74. (In Chinese) [Google Scholar]
  31. Taddeo, R.; Simboli, A.; Ioppolo, G.; Morgante, A. Industrial Symbiosis, Networking and Innovation: The Potential Role of Innovation Poles. Sustainability 2017, 9, 169. [Google Scholar] [CrossRef]
  32. Lee, B.-Y. Innovation City and Competitiveness of Region and Nation. J. Econ. Geogr. Soc. Korea 2011, 14, 1–18. [Google Scholar]
  33. Borruso, G.; Balletto, G. The Image of the Smart City: New Challenges. Urban Sci. 2022, 6, 5. [Google Scholar] [CrossRef]
  34. Qi, L.; Jia, L.; Luo, Y.; Chen, Y.; Peng, M. The External Characteristics and Mechanism of Urban Road Corridors to Agglomera-tion: Case Study for Guangzhou, China. Land 2022, 11, 1087. [Google Scholar] [CrossRef]
  35. Arghittu, A.; Balletto, G.; Dettori, M. Smart City and Well-Being: Opinions by the Guest Editors. Urban Sci. 2023, 7, 28. [Google Scholar] [CrossRef]
  36. Neumannová, M. Smart districts: New phenomenon in sustainable urban development Case Study of Špitálka in Brno, Czech Republic. Folia Geogr. 2022, 64, 27. [Google Scholar]
  37. Mocák, P.; Matlovičová, K.; Matlovič, R. 15-minute city concept as a sustainable urban development alternative: A brief out-line of conceptual frameworks and Slovak cities as a case. Folia Geogr. 2022, 64, 69. [Google Scholar]
  38. Bereitschaft, B. Are Walkable Places Tech Incubators? Evidence from Nebraska’s “Silicon Prairie”. Reg. Stud. Reg. Sci. 2019, 6, 339–356. [Google Scholar] [CrossRef]
  39. Matlovič, R.; Matlovičová, K. Polycrisis in the Anthropocene as a Key Research Agenda for Geography: Ontological Delinea-tion and the Shift to a Postdisciplinary Approach. Folia Geogr. 2024, 66, 5–33. [Google Scholar]
  40. Fornahl, D.; Brenner, T. Geographic Concentration of Innovative Activities in Germany. Struct. Chang. Econ. Dyn. 2009, 20, 163–182. [Google Scholar] [CrossRef]
  41. Poon, J.P.; Kedron, P.; Bagchi-Sen, S. Do Foreign Subsidiaries Innovate and Perform Better in a Cluster? A Spatial Analysis of Japanese Subsidiaries in the US. Appl. Geogr. 2013, 44, 33–42. [Google Scholar] [CrossRef]
  42. Wong, C.-Y.; Ng, B.-K.; Azizan, S.A.; Hasbullah, M. Knowledge Structures of City Innovation Systems: Singapore and Hong Kong. J. Urban Technol. 2018, 25, 47–73. [Google Scholar] [CrossRef]
  43. Rodríguez-Pose, A.; Wilkie, C.; Zhang, M. Innovating in “Lagging” Cities: A Comparative Exploration of the Dynamics of Innovation in Chinese Cities. Appl. Geogr. 2021, 132, 102475. [Google Scholar] [CrossRef]
  44. Fan, F.; Dai, S.; Zhang, K.; Ke, H. Innovation Agglomeration and Urban Hierarchy: Evidence from Chinese Cities. Appl. Econ. 2021, 53, 6300–6318. [Google Scholar] [CrossRef]
  45. Xiao, Z.; Du, X.; Wu, C. Regional Difference and Evolution and Convergence of Innovation Capability in China: Research on Space and Factorial Levels. Sustainability 2017, 9, 1644. [Google Scholar] [CrossRef]
  46. Li, Y.; Tang, Y.; Wang, K.; Zhao, Q. Environmental Regulation and China’s Regional Innovation Output—Empirical Research Based on Spatial Durbin Model. Sustainability 2019, 11, 5602. [Google Scholar] [CrossRef]
  47. Roth Cardoso, H.H.; Dantas Gonçalves, A.; Dambiski Gomes De Carvalho, G.; Gomes De Carvalho, H. Evaluating Innovation Development among Brazilian Micro and Small Businesses in View of Management Level: Insights from the Local Innovation Agents Program. Eval. Program Plan. 2020, 80, 101797. [Google Scholar] [CrossRef] [PubMed]
  48. Wang, J.; Chen, M.; Zhong, S.; Li, J. Impact of Urban Innovation Ability on Industrial Pollution Governance in Chinese Cities: Taking the Yangtze River Economic Belt as an Example. Environ. Sci. Pollut. Res. 2023, 30, 13283–13316. [Google Scholar] [CrossRef] [PubMed]
  49. Yin, H.; Wu, Z. Polarization and Flatten-Out: A Comparative Study on the Spatial Pattern of the Innovation Activities between the Bay Area and the Yangtze River Delta Region. Urban Plan. Forum 2015, 59, 50–56. (In Chinese) [Google Scholar]
  50. De Prato, G.; Nepelski, D. Global Technological Collaboration Network: Network Analysis of International Co-Inventions. J. Technol. Transf. 2014, 39, 358–375. [Google Scholar] [CrossRef]
  51. Sheng, Y.; Zhao, J.; Zhang, X.; Song, J.; Miao, Y. Innovation Efficiency and Spatial Spillover in Urban Agglomerations: A Case of the Beijing-Tianjin-Hebei, the Yangtze River Delta, and the Pearl River Delta. Growth Chang. 2019, 50, 1280–1310. [Google Scholar] [CrossRef]
  52. Tang, Z.; Zhang, Z.; Zuo, L.; Wang, X.; Hu, S.; Zhu, Z. Spatial Econometric Analysis of the Relationship between Urban Land and Regional Economic Development in the Beijing–Tianjin–Hebei Coordinated Development Region. Sustainability 2020, 12, 8451. [Google Scholar] [CrossRef]
  53. Mikhaylova, A.A.; Mikhaylov, A.S.; Savchina, O.V. Macroeconomic Dataset for Comparative Studies on Coastal and Inland Regions in Innovation Space of Russia. Data Brief 2019, 27, 104640. [Google Scholar] [CrossRef] [PubMed]
  54. Wu, Y.; Li, X.; Yang, Y.; Xu, W. Correlation between Urban Commercial Nodes and the Development of Sci-Tech Enterprises in Hangzhou West High-Tech Corridor, China. Land 2022, 11, 2086. [Google Scholar] [CrossRef]
  55. Yu, G.; Wan, Y.; Jiang, C. Complex Network Analysis on Provincial Innovation Development in China. Appl. Math. Comput. 2023, 455, 128103. [Google Scholar] [CrossRef]
  56. Duan, D.; Du, D.; Liu, C. Spatial-Temporal Evolution Mode of Urban Innovation Spatial Structure: A Case Study of Shanghai and Beijing. Acta Geogr. Sin. 2015, 70, 1911–1925. (In Chinese) [Google Scholar]
  57. Hu, E.; Hu, D.; He, H. Spatial Patterns of Urban Innovation and Their Evolution from Perspectives of Capacity and Structure: Taking Shenzhen as an Example. ISPRS Int. J. Geo-Inf. 2021, 11, 7. [Google Scholar] [CrossRef]
  58. Li, L.; Zhang, X. Spatial Evolution and Critical Factors of Urban Innovation: Evidence from Shanghai, China. Sustainability 2020, 12, 938. [Google Scholar] [CrossRef]
  59. Chen, S.; Huang, T.W. Cooperative Game Analysis on Three Main Entities of Regional Technology Innovation System in China. In Proceedings of the Twelfth International Symposium-Management Science & Engineering, Harbin, China, 17–19 July 2013; pp. 93–99. [Google Scholar]
  60. Zhu, Y.; Yang, F.; Gong, B.G.; Zeng, W. Assessing the efficiency of innovation entities in China: Evidence from a nonhomogeneous data envelopment analysis and Tobit. Electron. Commer. Res. 2022, 23, 175–205. [Google Scholar] [CrossRef]
  61. Zhang, Z.; LI, Z.; Xiao, Y. The Micro-Scale Spatial Features of Innovative Activities in Shanghai: A Research Based on the Patent Data. Mod. Urban Res. 2018, 33, 80–85+93. (In Chinese) [Google Scholar]
  62. Chen, J.; Huang, H.; Chen, X. The Evolution of Urban Innovation Spatial Structure on the Basis of Spatial Grids: A Case Study of Guangzhou. Mod. Urban Res. 2018, 33, 84–90. (In Chinese) [Google Scholar]
  63. Jin, P.; Mangla, S.K.; Song, M. The Power of Innovation Diffusion: How Patent Transfer Affects Urban Innovation Quality. J. Bus. Res. 2022, 145, 414–425. [Google Scholar] [CrossRef]
  64. Yan, D. Measurement and Comparison of the Innovation Spatial Spillover Effect: A Study Based on the Yangtze River Delta and the Pearl River Delta, China. Systems 2023, 11, 90. [Google Scholar] [CrossRef]
  65. Zhu, K.; Xu, J.L.; Wang, X.Y. The evolution of urban innovation space and its spatial relationships with talents’ living demands: Evidence from Hangzhou, China. Int. J. Urban Sci. 2023, 27, 442–460. [Google Scholar] [CrossRef]
  66. Jaffe, A.B.; Trajtenberg, M.; Henderson, R. Geographic Localization of Knowledge Spillovers as Evidenced by Patent Citations*. Q. J. Econ. 1993, 108, 577–598. [Google Scholar] [CrossRef]
  67. Drivas, K.; Economidou, C.; Karkalakos, S. Spatial Aspects of Innovation Activity in the US. J. Knowl. Econ. 2014, 5, 464–480. [Google Scholar] [CrossRef]
  68. Feldman, M.P.; Florida, R. The Geographic Sources of Innovation: Technological Infrastructure and Product Innovation in the United States. Ann. Assoc. Am. Geogr. 1994, 84, 210–229. [Google Scholar] [CrossRef]
  69. Kang, S.Y.; Sonn, J.W.; Seo, I. Space versus networks in the geography of innovation: A European analysis. Pap. Reg. Sci. 2007, 86, 471–493. [Google Scholar]
  70. Florida, R.; Adler, P.; Mellander, C. The city as innovation machine. Reg. Stud. 2017, 51, 86–96. [Google Scholar] [CrossRef]
  71. Schmidt, S.; Németh, J. Space, place and the city: Emerging research on public space design and planning. J. Urban Des. 2010, 15, 453–457. [Google Scholar] [CrossRef]
  72. Song, Y.; Wang, J.; Ge, Y.; Xu, C. An Optimal Parameters-Based Geographical Detector Model Enhances Geographic Characteristics of Explanatory Variables for Spatial Heterogeneity Analysis: Cases with Different Types of Spatial Data. GIScience Remote Sens. 2020, 57, 593–610. [Google Scholar] [CrossRef]
  73. Wang, J.; Xu, C. Geodetector: Principle and Prospective. Acta Geogr. Sin. 2017, 72, 116–134. (In Chinese) [Google Scholar]
  74. Yang, M.; Jin, F. Transportation technology innovation and the corresponding evolution of urban spatial patterns. Geogr. Territ. Res. 1999, 15, 45–48+81. (In Chinese) [Google Scholar]
  75. Liang, S.; Jiang, W. The Change and the Innovation Performance of Spatial Distribution of Higher Education Resources: Base on the Three Urban Agglomerations in China. China High. Educ. Res. 2021, 37, 78–85. (In Chinese) [Google Scholar]
  76. Tang, C.; Guo, X.; Zhou, G.; Wu, J.; Chen, W. Spatial Distribution and Influencing Factors of Innovation Platforms in Urban Agglomerations of the Middle Reaches of the Yangtze River Basin. Prog. Geogr. 2020, 39, 531–541. (In Chinese) [Google Scholar] [CrossRef]
  77. Zhao, X.F.; Liu, M.L.; Wang, B.Y. Spatio-Temporal Disparity of Urban Construction Land and Its Impact Factors in China Based on Geodetector. China Land Sci. 2018, 32, 29–35. (In Chinese) [Google Scholar]
Figure 1. (a) Location of Guangzhou in China; (b) administrative divisions of Guangzhou.
Urbansci 08 00111 g001
Figure 2. Schematic diagrams of the evolution of the hot and cold zones of the overall innovation spaces in Guangzhou, 1990–2020.
Urbansci 08 00111 g002
Figure 3. A schematic diagram of the spatial distribution intensity of the overall innovation activities in Guangzhou, 1990–2020.
Urbansci 08 00111 g003
Figure 4. A schematic diagram of changes in the direction of the distribution of innovation spaces in Guangzhou over the years of 1990–2020.
Urbansci 08 00111 g004
Figure 5. Diagram of changes in direction of distribution of spaces of institutions and research units (a), individuals (b), and enterprises (c) in Guangzhou, 1990–2020.
Urbansci 08 00111 g005
Figure 6. Schematic representation of spatial distribution of probe factor categorization.
Urbansci 08 00111 g006
Figure 7. Influence elements and path dependence of urban innovation spaces.
Urbansci 08 00111 g007
Table 1. Spatial Gini coefficient statistics of patent grant data in Guangzhou, 1990–2020.
Category1990199520002005201020152020Overall
Innovation Spaces0.5500.5380.4980.4550.4320.3810.3910.380
Institutions and Research Units0.5580.5560.5870.7240.6810.5470.5740.582
Individuals0.6400.5920.5300.4650.4160.3890.3250.354
Enterprises0.5430.4790.4290.3770.4620.4110.4440.403
Table 2. Distribution density statistics within the basic spatial units of patent grant data in Guangzhou, 1990–2020.
CategoryMinimumMaximumMean StandardDeviation
Innovation Spaces013,03951.89284.50
Institutions and Research Units012,1808.79174.17
Individuals0132415.0165.76
Enterprises0720228.08157.38
Table 3. Standard deviation ellipse parameters of patent grant data in Guangzhou, 1990–2020.
YearX-Axis Standard Deviation (km)Y-Axis Standard Deviation (km)Azimuth θ (degrees)Area (km2)
19909.9510.5237.79328.84
19959.7910.82139.08332.78
200011.3612.493.60445.75
200511.7916.62169.77615.59
201012.7418.41162.39736.84
201513.1220.68167.01852.38
202015.5421.36157.741042.80
Table 4. Statistics of global Moran’s I of innovation actors in Guangzhou, 1990–2020.
Year1990199520002005201020152020Overall
Moran’s I0.4210.4210.3810.3910.2600.3400.3750.411
p-value0.0010.0010.0010.0010.0010.0010.0010.001
Table 5. Spatial distribution parameters of POI points related to roads and innovative activities in the basic spatial unit of Guangzhou City.
CategoryMinimum ValueMaximum ValueMean ValueStandard Deviation
Transportation AccessibilityRoad Network036.233.093.79
Bus Stops03112.1
Subway Stations050.040.22
Educational Resources0750.552.27
Spatial Carriers0840.783.79
Table 6. Statistics on the results of the risk factor detector operation.
Innovation ActorsNumerical ValueTransportation AccessibilityEducational ResourcesSpatial Carriers
Road DensityBus StopsSubway Stations
Overallq-value0.26800.14730.15610.33620.2772
significant level0.0000.0000.0000.0000.000
Institutions and Research Unitsq-value0.06970.00780.02080.36470.0166
significant level0.0000.0000.0000.0000.000
Individualsq-value0.46990.36610.32880.41560.6450
significant level0.0000.0000.0000.0000.000
Enterprisesq-value0.14450.12830.10100.10380.2443
significant level0.0000.0000.0000.0000.000
Table 7. Interaction detection results.
Innovation ActorsFormTransportation AccessibilityEducational ResourcesSpatial
Carriers
Road
Density
Bus StopsSubway
Stations
OverallRoad Density0.2680----
Bus Stops0.30950.1473---
Subway Stations0.30630.22460.1561--
Educational Resources0.46400.39920.40620.3362-
Spatial Carriers0.35630.31720.32390.55780.2772
Institutions and Research UnitsRoad Density0.0697----
Bus Stops0.16440.0078---
Subway Stations0.07190.05150.0208--
Educational Resources0.48770.43180.41720.3647-
Spatial Carriers0.11300.02600.04890.58370.0166
IndividualsRoad Density0.4699----
Bus Stops0.56010.3661---
Subway Stations0.57700.52380.3288--
Educational Resources0.57980.56820.57390.4156-
Spatial Carriers0.72740.69790.72950.74940.6450
EnterprisesRoad Density0.1445----
Bus Stops0.18040.1283---
Subway Stations0.17850.17140.1010--
Educational Resources0.18020.16950.15270.1038-
Spatial Carriers0.28130.31360.26970.28890.2443
Disclaimer/Publisher’s Note: The statements, opinions and data contained in all publications are solely those of the individual author(s) and contributor(s) and not of MDPI and/or the editor(s). MDPI and/or the editor(s) disclaim responsibility for any injury to people or property resulting from any ideas, methods, instructions or products referred to in the content.

