Article

Logit and Probit Models Explaining Mode Choice and Frequency of Public Transit Ridership among University Students in Krakow, Poland

by
Houshmand Masoumi
1,2,*,
Melika Mehriar
1 and
Katarzyna Nosal-Hoy
3
1
Zentrum für Technik und Gesellschaft, Technische Universität Berlin, 10553 Berlin, Germany
2
Department of Transport and Supply Chain Management, College of Business and Economics, University of Johannesburg, Johannesburg 2092, South Africa
3
Department of Transportation Systems, Cracow University of Technology, 31-155 Krakow, Poland
*
Author to whom correspondence should be addressed.
Urban Sci. 2024, 8(3), 113; https://doi.org/10.3390/urbansci8030113
Submission received: 5 July 2024 / Revised: 1 August 2024 / Accepted: 12 August 2024 / Published: 14 August 2024
(This article belongs to the Special Issue Sustainable Transportation and Urban Environments-Public Health)

Abstract

:
The predictors of urban trip mode choice and one of its important components, public transit ridership, have still not been thoroughly investigated using case studies in Central Europe. Therefore, this study attempts to clarify the correlates of mode choices for commute travel and shopping, and entertainment travel to distant places, as well as the frequencies of public transit use of university students, using a wide range of explanatory variables covering individual, household, and socio-economic attributes as well as their perceptions, mobility, and the nearby built environment. The correlation hypothesis of these factors, especially the role of the street network, was tested by collecting the data from 1288 university students in Krakow and developing Binary Logistic and Ordinal Probit models. The results show that gender, age, car ownership, main daily activity, possession of a driving license, gross monthly income, duration of living in the current home, daily shopping area, sense of belonging to the neighborhood, quality of social/recreational facilities of the neighborhood, and commuting distance can predict commute and non-commute mode choices, while gender, daily activity, financial dependence from the family, entertainment place, quality of social/recreational facilities, residential self-selection, number of commute trips, time living in the current home, and street connectivity around home are significantly correlated with public transit use. Some of these findings are somewhat different from those regarding university students in Western Europe or other high-income countries. These results can be used for policy making to reduce students’ personal and household car use and increase sustainable modal share in Poland and similar neighboring countries.

1. Introduction

Serious investigations into the motives and preferences of people choosing personal cars as the dominant mode choice in emerging markets have increased recently. Mode choice behavior has attracted the attention of scholars, since automobile orientation has bidirectional correlations with different socioeconomic features, like income, gender, age, urban form, and land use, and since it is also related to the attitude and perception of residents. In addition, it has many impacts on energy consumption, greenhouse gas emissions, and urban development among other aspects. Sustainable urban development goals could be achieved more easily by having a clearer understanding of travel behavior in different geographical, social, cultural, and economic contexts.
The personal car continues to be the dominant model in the developed world, and, also, in developing countries in recent decades. Hence, mode choice behavior, i.e., using a personal car, public transit use, and active mobility are concerns of healthy cities and the environment. There is a strong body of research on urban travel behavior in developed regions, as most of our knowledge on this topic comes from Western and high-income countries [1,2,3]. Existing urban travel behavior literature is rich in defining different socioeconomic aspects, as well as psychophysical behavior [4,5] and land-use and urban form features [6,7], focusing on this set of countries; but still, our knowledge suffers from the research gap in urban travel behavior in developing countries and emerging markets. To achieve sustainable urban mobility and green transportation, there is a real need to have a better understanding of various social, economic, geographical, and cultural mechanisms that have impacts on travel behavior in various realities. In the absence of adequate and appropriate information, the urban planning system is limited by general policies and strategies that may not be suitable solutions for problems and challenges in urban transportation in special contexts. However, while the correlates of mode choice and public transport use have been well studied in Western and high-income countries, our knowledge suffers from shortcomings in developing countries, particularly in post-socialist cities in Central and Eastern Europe. Social, economic, and cultural perspectives, as well as people’s attitudes, can affect travel behavior. Therefore, the lack of research on the socioeconomic and cultural aspects of travel behavior in less-studied contexts, such as Polish cities, can lead to a misunderstanding of urban mobility. To gain a better and clearer understanding of the socioeconomic and perceptual behavior related to urban transportation, more studies are needed in post-socialist cities.
In addition to different contexts, studying the socioeconomic and perceptual behavior of various socioeconomic groups, such as specific groups, genders, or ethnic groups, would provide a deeper understanding of travel behavior among different socioeconomic segments. University students are an increasingly important social group whose travel habits are less studied. Particularly, according to the theory of reasoned action (TRA) [8] and the theory of planned behavior (TBP) [9], a person’s behavior is determined by their behavioral intention to do it. This intention itself is determined by the person’s attitudes and norms towards the behavior. So, various social, cultural, and economic circumstances in different contexts could influence travel behavior.
For example, Polish cities were transformed during the times of transition from socialism to post-socialism; therefore, they have faced new changes in urban lifestyle, and economic and political systems that massively influenced urban areas. Contextual studies on urban travel habits, the perception of residents, and socioeconomic status are necessary to tackle transportation problems in the context of the Polish city typology to avoid blind generalization and the transferring of Western knowledge into a different kind of urban planning system.
The objective of the current paper is to realize and model mode choice behavior in the context of the post-socialist city type. In other words, finding out the different socioeconomic determinants influencing the use of personal cars and frequency of public transport use, such as income, gender, age, daily activity, and car ownership, is one of the goals of this paper. Another objective of this paper is to understand the relationships of land use, the perceptions of residents, and travel habits with mode choice behavior among university students in Krakow as an example of a large city in Eastern and Central Europe.
This paper aims to study the travel behavior of university students, as a particular social group that is often less considered by scholars. There is a need to assess the perceptual and travel behavior of different socioeconomic groups to gain a better understanding of their needs and behaviors in various contexts. Particularly, there are a growing number of cities with a focus on universities. Therefore, the travel habits of students are very important and should be considered.
The paper is structured as follows: Section 2 reviews the determinants of mode choice and public transit use in different contexts, particularly in Eastern European countries. Section 3 explains the research questions and hypotheses, data and variables, and methods for analyses. Section 4 describes the summary of the results obtained by employing statistical modeling methods. Section 5 discusses the findings of this paper in Poland and the similarities and dissimilarities with developed and high-income countries. Finally, Section 6 concludes the paper with suggestions for future work.

2. Literature Review

Understanding mode choice behavior is the first step for predicting future travel demands; nonetheless, travel behavior literature currently has a strong body of research only in Western and high-income countries, as mentioned beforehand. The lack of knowledge from analyzing the mode choice behavior of younger generations, like university students, needs, therefore, to be covered by future studies [10]. An example of such a study from a Western country, focusing on the travel behavior determinants amongst university students, was concluded in Canada. The result of this study on Canadian university students showed that increasing awareness of sustainability is correlated with increases in public transit use and sustainable mode choices. In another investigation on sustainable mode choice of Canadian university students by Moniruzzaman et al. (2018), transit pass and bike ownership are significant determinants of sustainable transportation among the university population in Toronto [10]. Another study in Toronto examined the mode use behavior of post-secondary students by using multinomial logit, nested logit, and cross-nested logit models. The mode choice of students varies in sprawled areas and downtown, particularly among women, as they use active mobility in the central parts of the city [11]. On the other hand, the dominant mode choice of university students in Nigeria, for example, is walking for on-campus and commercial trips, while the bus is for off-campus students. Additionally, a few university students use motorcycles [12].
The relationship between the attitude of university students in Italy and transportation mode choice was studied by Cattaneo et al. (2017) [13], which showed that awareness about environmental issues as well as improvements in the public transit service have an impact on sustainable mode choice amongst Italian students.
The different correlates of travel behavior were studied well in developed countries. Mouratidis et al. (2019) showed residents of compact neighborhoods use walking and cycling as dominant travel modes, while suburban residents walk and cycle less and use cars more [14]. So, the characteristics of compact neighborhoods, such as street connectivity, higher population density, and mixed land-use structure could play an important role in choosing different modes. The impacts of built environment characteristics and street network configuration were studied in the U.S., in 2006. According to that study, residential density and mixed land use (compact form) are the most influential determinants of travel mode. However, the results of that study do not confirm associations between travel mode and street configuration forms [15]. Næss (2011) indicated neighborhood street patterns were not associated with traveling by car in the Copenhagen Metropolitan Area, although the location of residences relative to the main city center was related to the use of cars [16]. Determinants of mode choice were studied in the Netherlands [17] by assessing the relationship between active mode choices and different categories of determinants including personal features, household characteristics, weather conditions, trip characteristics, built environment, and work conditions. According to that study, mixed land-use structure is positively associated with active mode use in the Netherlands. Although the results show that gender is not an influential factor in active mode choice in the Netherlands [17], the findings of other studies presented a strong association between gender and bicycle use [18,19]. Heinen et al. (2010) indicated that in terms of cycling, in rich countries such as the Netherlands, women ride bicycles more often than men [18]. The determinants of mode choice not only may be different between developed and developing countries but also among developed contexts; so, there is a need for more investigations to reach a consistent perspective in the literature. Ramezani et al. (2018) compared determinants of sustainable mode choice (active and public) in two different socioeconomic cultural contexts: Rome and San Francisco. That investigation studied the correlations of the built environment, socioeconomic attributes, and attitudinal factors with mode choice. According to that study, the street network configuration has a stronger relationship than the built environment and attitudinal factors with mode choice in both Rome and San Francisco. However, mode choices are more affected by attitudinal factors and socioeconomic features in San Francisco than in Rome [20]. Roos et al. (2020) showed men tend to drive cars more than women in Sweden. Also, older people and higher-income people drive cars more than others in Sweden while public transport users are represented more by more highly educated people [21].
The impacts of built environment characteristics on travel behavior, particularly mode choices have been confirmed by scholars; these factors include street connectivity (link density, intersection density, link-node ratio), population density, urban design, and mixed land-use areas (e.g., the presence of shops and parks), and the distance from city center [22,23,24,25]. Those factors are less affected by social and cultural contexts. Some similarities were found between developed and developing countries. The positive relationship of street connectivity with active mobility was approved for large cities in Pakistan, Lahore, and Rawalpindi [26]. Soltani et al. (2018) studied built environment determinants of using the car as a dominant mode choice in Tehran, Iran. According to that study, mixed land use structure is negatively associated with car dependency in commuting trips in Tehran [27]. Although a considerable number of studies assessed the relationship of built environment features with travel mode choice, there are still two gaps: our understanding is limited regarding socioeconomic features, perceived and attitudinal barriers of active transport and using public transit; and, there is not enough literature to determine how sustainable mode choice will be affected by the perceptual and attitudinal behavior or socioeconomic characteristics in different social and cultural contexts.
The Central and Eastern European countries have experienced the transition from socialism to post-socialism in various aspects of the political and economic system and, consequently, changes in lifestyles, urbanization, as well as social and psychological behavior. Still, the specific circumstances of each country vary from others affected by similar transformative processes. Even so, each former socialist country in these regions of Europe has moved towards democracy and market orientation. These changes also had crucial impacts on the transportation system. For example, increasing car ownership is one of the results of the new economic approach in post-socialist countries. The modal shift of passengers from public transport to driving private cars is an important trend in the transportation system in Eastern European countries based on the level of motorization in post-socialism [28]. Purchasing cars not only covers transportation needs but is also a symbol of the free market and a higher socio-economic status [29]. Cars as a sign of socio-economic status amongst the youth in Tirana, as an example of a post-socialist city, was studied in the conceptual framework of planned behavior theory [30]. This study revealed that cars are a strong status symbol among university students in the capital city of Albania, particularly as perceived by men. The characteristics of commuting trips such as modal choice, travel time and distance, and demographic features of passengers in suburban areas of Budapest were also studied in 2010 [31] to determine determinants of traditional, reverse-, and cross-commuting trips in Budapest. Stenning [32] discussed that the mobility system and travel behavior have changed in post-socialist cities based on the pushing of people to choose new places and opportunities in new development areas and suburbs. Hence, new demands for mobility have shaped post-socialist cities [32]. The daily needs and commuting trips of passengers under socialism were provided by heavily subsidized public transport, while road infrastructures suffered from shortcomings [33]. Therefore, the transformation from socialism to post-socialism brings a considerable number of shifts in the transportation system. A study compared the travel behavior between the north-west (Sweden) and east (Estonia) of Europe to understand how different conditions could influence travel behavior. According to this study, using a car in Estonia is correlated with a higher socioeconomic position, while this pattern is not seen in Sweden [34]. The study also confirmed that spatial stratification has an association with travel habits in Estonia, but not in Sweden. The travel behavior in two Eastern European cities, Brno (Czech Republic) and Bratislava (Slovakia), was also studied to determine similarities and dissimilarities between patterns. In this case, age was an important factor for predicting public transit in Brno [35].
Topically related studies in the Polish context are rather rare, though, for example, socio-demographic features of people and access to a cars by households as predicator variables for driving cars in daily trips have been studied in Łódź, Poland [36]. On the other hand, the investigation analyzed the relationship between socioeconomic aspects, travel patterns, perception of university students in Krakow, and urban sprawl by employing Weighted Least Square regression models to determine travel habits based on urban forms [37]. Another study examined travel patterns among young students in the Tricity area of Poland using Factor analysis and Analysis of Variance (ANOVA), underlining that luxury and self-expression, freedom and comfort, safety, and environmental friendliness are the main factors that have associations with active commuting amongst young adult students in the area [38]. Urban public transit determinants in Poland were studied according to achieving sustainable development goals [39]. The role of urban street networks on travel distance, mode choice, and safety was investigated by studying street network structures and laws in Poland [40]. Still, such studies on Polish cities do not provide a comprehensive and consistent conclusion about the topic at hand. Given the transformative character of the Central European context, it could be concluded that in order to understand the challenges and needs of sustainable transportation there is a vehement need to analyze travel behavior in a Polish city, for urban planners and decision-makers need to have a clear understanding of the association of mobility mode choice, public transit with urban forms, social behavior, and socio-economic features, so they can create and support efficient policies according to local needs and demands without the need to reproduce already existing general ones. The different travel habits, psychological aspects of travel behavior, attitudes and perceptions of people regarding travel patterns and urban form, and socio-economic structures in the context of post-socialism are less-studied topics that require a quantitative approach, and which should be included in studies to achieve a more holistic image of the demands of a Polish city typology in urban transportation.
To conclude this paragraph, the identified knowledge gap is seen in the methodological approach of studies in transportation. There are few studies employing mathematical models and using disaggregated data on land use, travel habits, and socioeconomic features. Employing disaggregated data provides reliable results that can create a clearer picture of the correlations between land use determinants and mobility in the Central European context; however, due to the difficulties of generating such data, using them as the basis of statistical models related to mode choice have been limited in the region. Predicating travel behavior including modeling car use and public transit use is necessary for emerging markets with growing economies that will influence greenhouse gas emissions, land, and energy consumption in the future.

3. Methodology

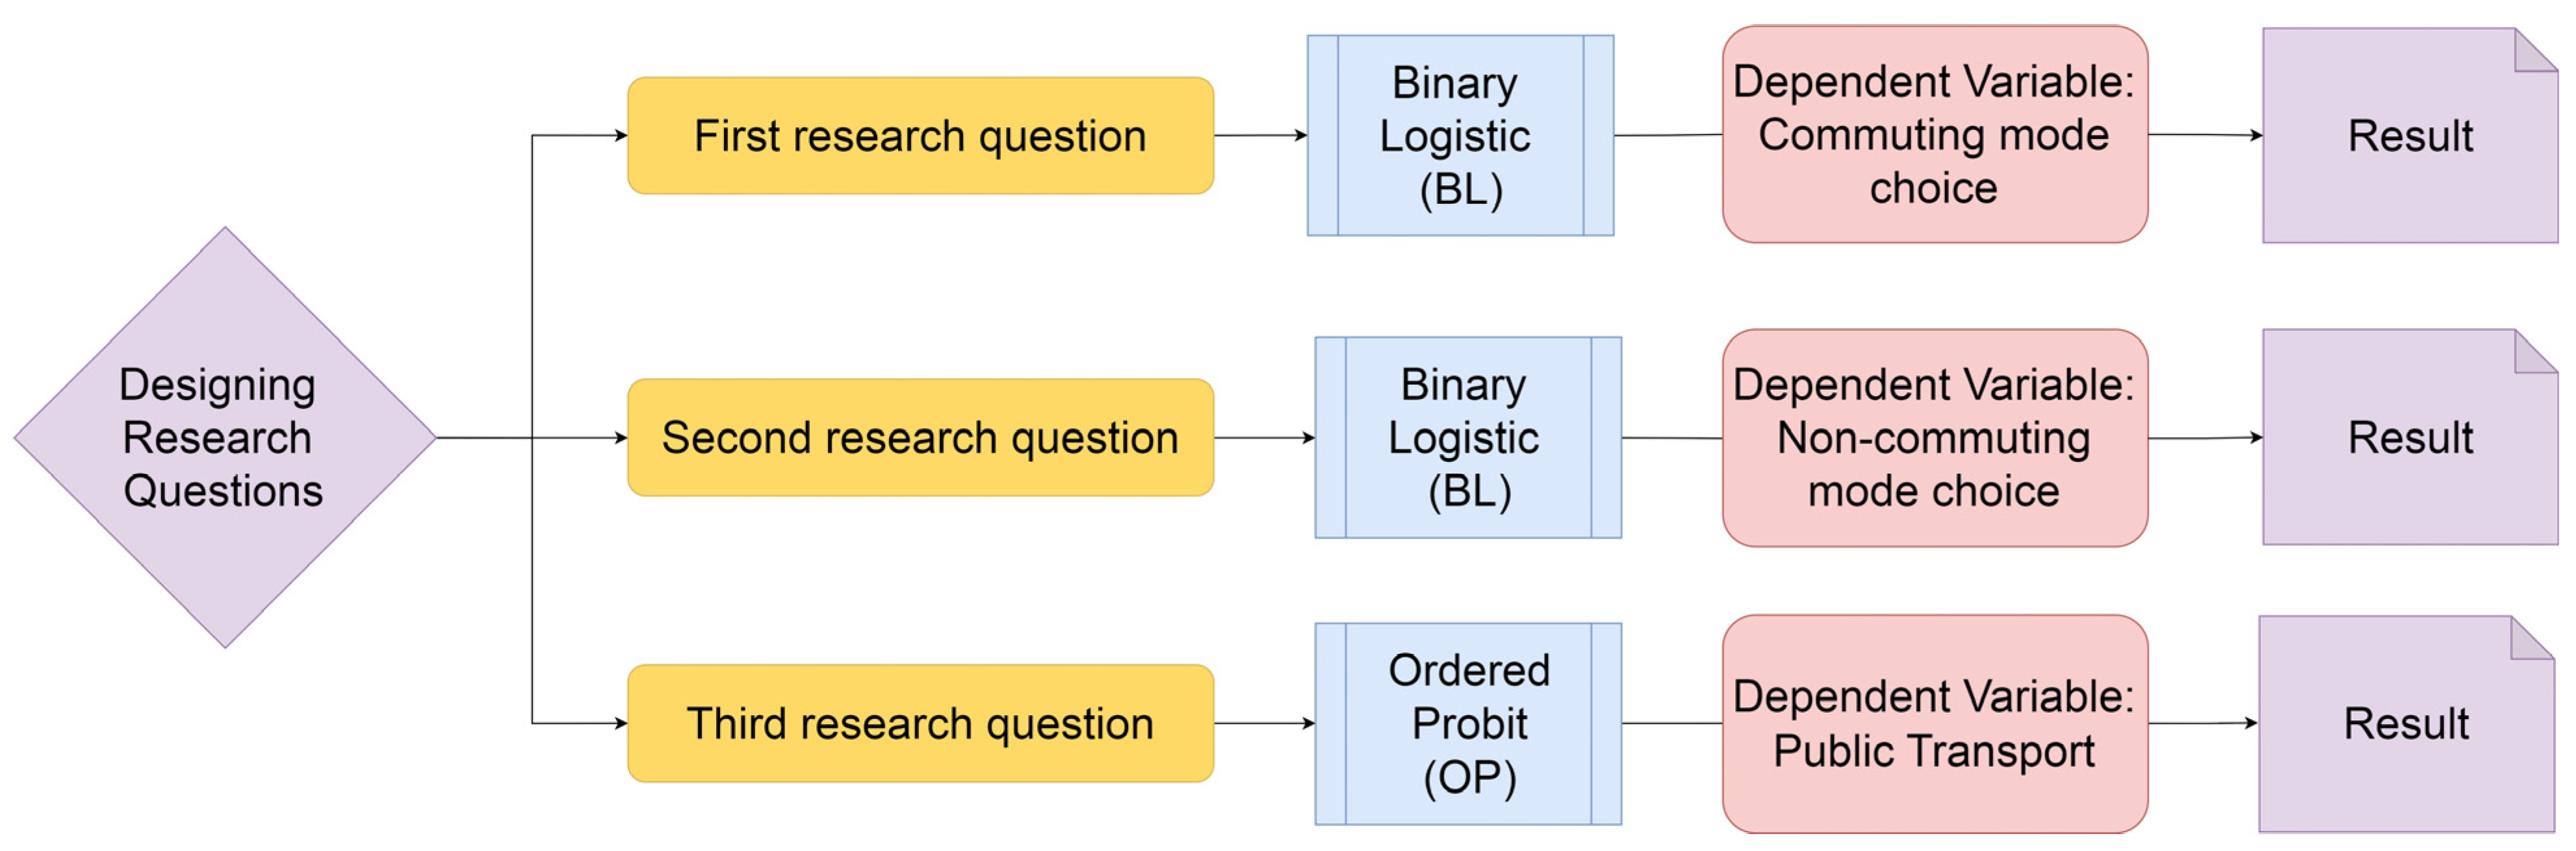
3.1. Questions and Hypotheses

The current study presents the answer to three research questions, as follows:
(1)
Which individual, household, socio-economic, and land use variables correlate with the commute-to-university mode choice of students in the large cities of Poland?
(2)
How are these factors associated with the mode choices of shopping and entertainment trips of Polish students taken towards urban destinations far away from their homes?
(3)
What determines the frequency of public transit use of Polish university students? It is hypothesized that some limited number of subjective and objective factors including personal and spatial issues are correlated with mode choices and public transportation ridership of university students in the large cities of Poland. These correlates are sometimes different from their counterparts in the West European countries.

3.2. Case Study

Krakow was taken as the representative of large cities in Eastern and Central Europe. The city is located on the Vistula River in the South of Poland; it has been known as an urban area since the 9th century. Krakow has a rectangular Market Square in the center of the town with grid-like streets [41]. The city covers 326.8 km²- of area and had 760,000 inhabitants in 2015 [42]. When considering suburban areas, the population has reached one million people. The population density of Krakow was 2310 persons/square kilometer in 2011 [43]. This city is the second largest and one of the oldest cities in Poland. Krakow is highly urbanized, with different types of buildings, including tenements, residential areas with detached housing, high-rise blocks of flats, four-story blocks of flats, and scattered buildings on the city’s outskirts.
A series of transformations happened in Krakow regarding changes in the political and economic system. The modern economy and new approachs in the political system led to rapid urbanization post-socialism. The transformations affected Krakow based on shifts from centralization to decentralization, industrialization to deindustrialization, being underrated to being recognized as a valuable city, and the inclusion of large marginal areas into the city, as well as suburbanization. Krakow is known as one of the biggest academic centers in the country with ~178,807 students in 2015 [41], and 21 higher education centers in both public and private sectors. Eighty-six percent of students are studying in public universities. Jagiellonian University and Andrzej Frycz Modrzewski Cracow University have the biggest share of students in the public and private sectors, respectively [37].

3.3. Data and Variables

The basic dataset of this study is the result of an online mobility survey conducted in the winter of 2019 in Krakow, Poland. The target subjects were the university students of Krakow. The link to the online questionnaire was sent to university departments and dormitories in Krakow, where the university authorities forwarded the link to their students, and after some time, the filled questionnaires were collected. The survey instrument included 23 questions touching on socio-economic aspects such as age, gender, daily activity, possession of a driving license, car ownership, financial dependence, monthly income and expenditure, as well as mobility habits including commute trip generation, commute mode choice, non-commute trip generation, shopping place, shopping/leisure mode choice near home, shopping/leisure mode choice for long distances, public transit use frequency, and, finally, variables regarding perceptions about or qualities of the urban environment (sense of belonging to neighborhood, perceptions of attractiveness of shops, entertainment place, evaluation of recreational facilities, residential self-selection, and duration of living in the neighborhood). Using these two addresses, several land use, street network, and urban sprawl-related variables were generated. The questionnaire was designed by reviewing the literature to identify which variables have been studied by other scholars in both developed and developing countries. Additionally, it considered which factors and features should be addressed in a post-socialist context according to the knowledge gap (Appendix A).
At the end of February 2019, the sample size reached 1324 respondents. After data cleaning and validation, the sample size reached 1288 subjects. Land use factors were of great importance in this study, so the generation of the related variables was a major goal in developing the dataset. The nearest points to the home and university places were asked for, though the respondents could give only the names of the two streets that made up the nearest intersection to their home or university. This method was adopted to not violate the respondents’ privacy. By pinpointing the home and university places on Google Earth and then importing them into ArcGIS, the location of the nearest intersections to homes and universities were provided. Later, the land use variables explained in Table 1 were quantified by the means of ArcGIS tools. These variables included the link density of the home area, the intersection density of areas around the home, the link-node ratio of the surroundings of the home, the inverse Building Coverage Ratio (BCR) for homes, the link density for the university, the intersection density of the university, the link node-ratio of the university, inverse Building Coverage Ratio (BCR) for universities, the Shannon entropy of the surroundings of the home, and the Shannon entropy of the university surroundings. Urban sprawl was quantified by using Shannon entropy, which is a widely used method for modeling chaos in systems in physical sciences. In this study, Shannon entropy refers to the dispersal of urban development, such as a mix of uses and leapfrog development. Higher entropy values address higher levels of urban or suburban sprawl. Another variable that was indirectly related to sprawl was the Building Coverage Ratio (BCR), which resulted by dividing the built-up area by the overall area of catchment areas around homes and universities. Commute distances from home to university were quantified using the home and university locations in ArcGIS employing the calculation of the shortest distances based on street networks. The catchment areas mentioned above were defined based on 600-m areas on the street network around the home and university locations. Eleven urban form, street network, and commuting distance variables were developed and added to twenty-one variables that were already generated using the results of interviews, so in general thirty-two variables were developed (Table 1). The main variables of this study were mode choices for commuting and shopping/entertainment tips outside of the respondents’ neighborhood (far-away places like the city center) as well as the frequency of public transportation ridership. The commute mode choice variable was developed by asking the students “Which mode of transportation do you use most frequently in your trips to the university?” and several options including motorbike, bicycle, Uber or similar apps, taxi, walking, personal/household car, carpooling (e.g., BlaBlaCar), bus/minibus, and tram/train were given to them. Later, for modeling purposes, the modes were coded into 0 for personal/household car and 1 for other modes. The other mode choice variable was developed by asking the respondents, “Which mode of transportation do you use most frequently for shopping/entertainment trips outside your neighborhood?”. The options were the same as for commute trips, but the coding was performed in another way that fit the needs of non-work mobility better. Two categories were made for the shopping/entertainment mode choices: 1 for walking, biking, bus use, and train use, and 0 for all other remaining modes. The reason for this categorization was because the number of students who used cars for their non-work trips, was not so large. Therefore, it was required to avoid a bias in modeling, while active transport and more sustainable modes of public transport were taken for the sustainable transport group, and all others, including taxis, were grouped in less sustainable or as unsustainable modes. In order to quantify the frequency of public transit ridership, the students were asked “How often do you use public transit?” and a Likert-scale range of almost never, rarely, a few times per month, a few times per week, and every day was given to them in the data collection phase.

3.4. Analysis Methods

For answering three research questions, two Binary Logistic (BL) regression models and an Ordered (ordinal) Probit (OP) regression model were used. The structure of the methodology is presented in Figure 1.
In order to answer the first research question of this study, Binary Logistic (BL) regression modeling was applied, by using the dependent variable of commute mode choice (personal/household car versus other modes as explained above). Twenty-six variables were taken in the first round of the BL model, then the variables with the highest p-values were eliminated from the model until a model with the most significant variables was the result. Nineteen variables were eliminated from the model in this succession: those were inversed BCR around the university, possession of a driving license, the attractiveness of shops, number of commute trips, duration of time living in the current home, number of shopping/entertainment trips, Shannon entropy around the university, link density around the home, link-node density around the university, link-node density around the home, residential self-selection, intersection density around the university, Shannon entropy near home, link-density around the university, financial dependence on family, main daily activity, entertainment place preference, intersection density near home, and inversed BCR near home. The twentieth model was taken as the highest quality, including in regards to having the most significant explanatory variables.
The same procedure of development of a BL model was applied to shopping/entertainment trips outside the living neighborhood (research question 2). The aim was to find correlations between different explanatory variables and trips that are taken for non-work purposes in ranges of distances in which active modes are difficult. Before starting the modeling procedure, all of the categorical variables with more than two variables were transformed into dummy variables. This was completed for the ease of model interpretation. The modeling procedure gave satisfactory results after eighteen models. In other words, seventeen independent variables were eliminated from the model in separate rounds. These variables were the Shannon entropy in the catchment area of home, number of commute trips, Shannon entropy around university, financial dependence on family, residential self-selection, quality of social facilities, link-node ratio near the university, gross monthly income, age, inversed BCR near the university, attractiveness of shops, i BCR near home, link density around university, link density around home, entertainment place, link-node density around home, and intersection density near university. For the testing of the validity of the BL models, the Omnibus test was applied, wherein p-values of less than 0.05 indicated a significantly accurate prediction power of the models. The Nagelkerke R2 values were taken to test if the models including all the independent variables were a good fit to the data, where higher values show a better fit just as R2 in linear regression.
In order to answer research question 3 concerning the frequency of public transit use, Ordered (ordinal) Probit (OP) regression modeling was applied. As explained above, a five-point Likert scale was taken to quantify frequencies. The same procedure of elimination of insignificant predictors was taken for the OP model. As a result, the following seventeen variables were omitted from the model: BCR around university, age, gross monthly income, possession of driving license, BCR near home, Shannon entropy near university, sense of belonging, commute length, number of shopping/entertainment trips, attractiveness of shops, intersection density near university, link density near university, link-node ratio near university, Shannon entropy near home, link-node ration near home, link density around home, and car ownership. The validity of the model was tested by the Omnibus test as explained for the BL model. In order to test the goodness of fit of the BL model, the proportion of the Chi-square value to degrees of freedom for the model deviance was calculated and checked if its value was less than one; if so, it was concluded that the model enjoys a good fit.

4. Findings

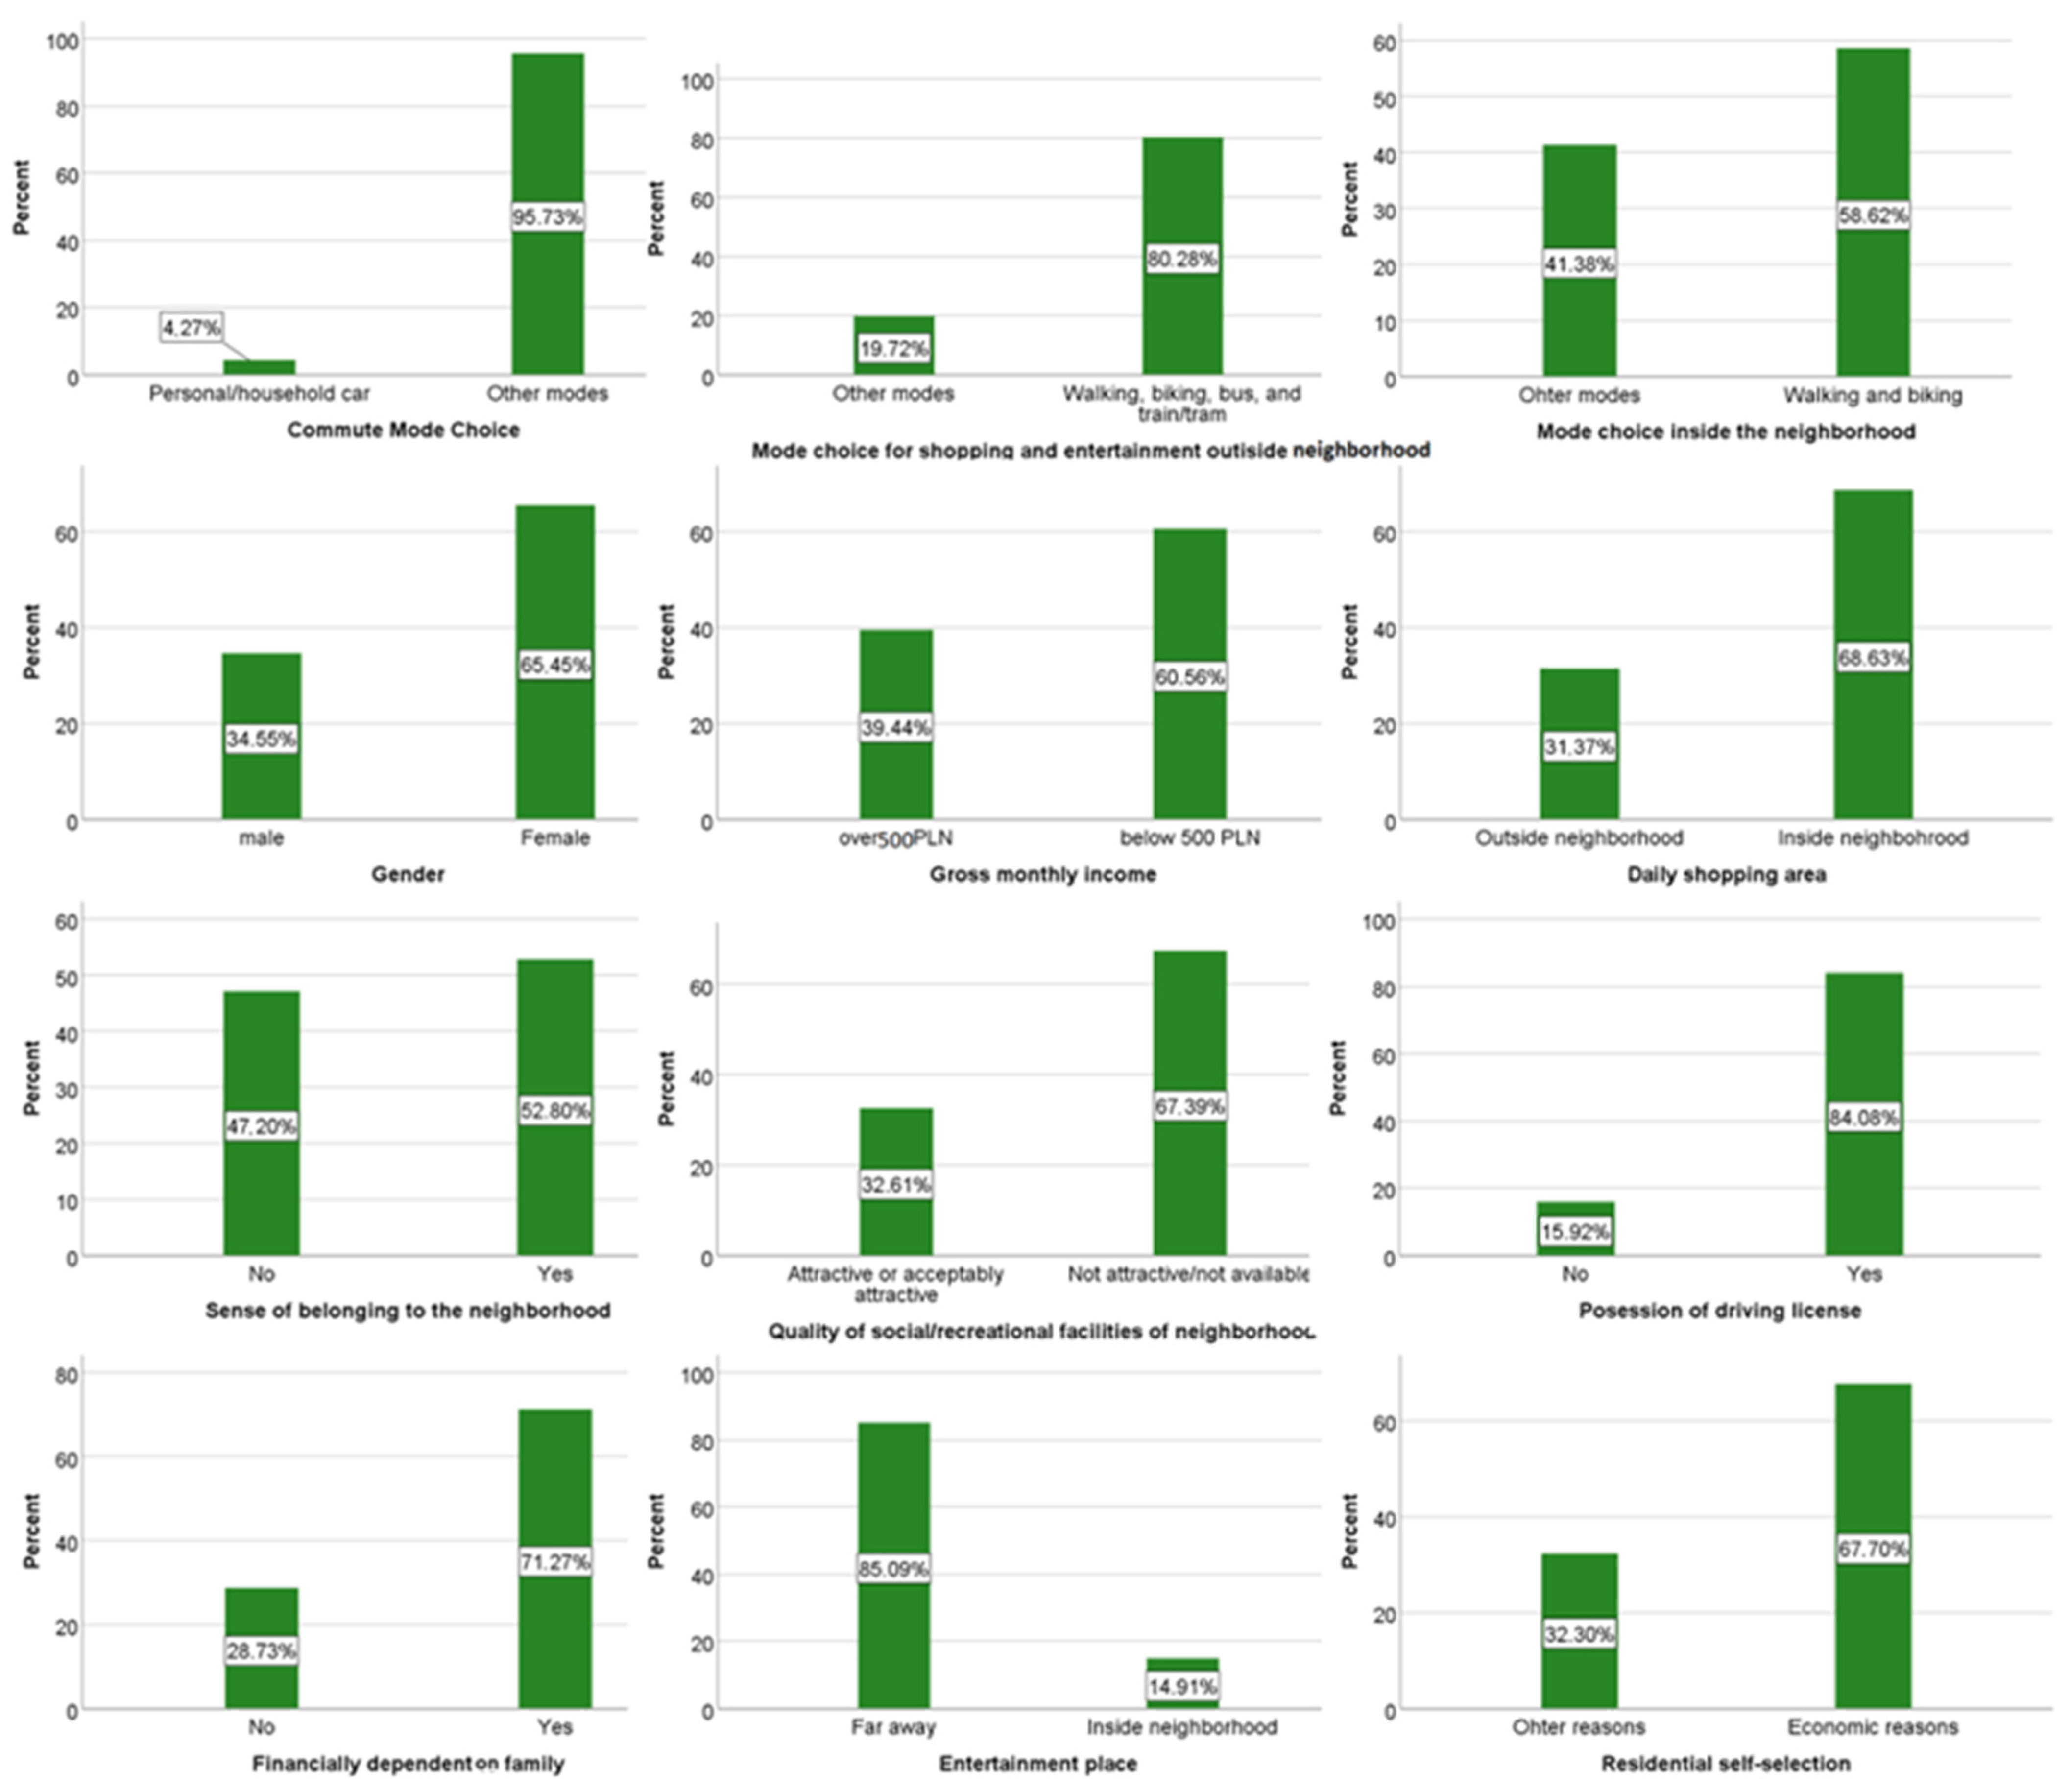
4.1. Descriptive Statistics

The survey respondents were all students, so they were in a 20-year age range with a lower limit of 17 and a mean age of 22.1 years (see Table 2 for the descriptive statistics of continuous variables). The number of commute trips of the respondents in the last seven days before filling out the questionnaire ranged between 6 and 40 activities, averaging 11.1. The number of years passing from the time that the respondents moved into their current home was 5.9 years. The density of intersections per hectare near the respondents’ homes had a mean value of 0.0462, meaning that in every hectare in the walking catchment area around their homes, there were more than 0.04 junctions. In other words, each junction was located in a 21.6-ha piece of land. Finally, the one-way commute distances of the interviewees ranged between nearly zero (very near to the university campus or inside it) to 18,519 m, averaging 5164 m. Since this length was calculated based on the street network, it is possible to conclude that each student of the sample commutes to the university and back home in a 10,328 m journey (Table 2).
About 1% of the respondents used public transportation “almost never”, and 3.8% of them used it “rarely”. Less than 3.5% use public transit “a few times per month”, about 21% use it “a few times per week”, and less than 71% are the most frequent users who have declared they use public transit every day. This variable was kept as it was in the questionnaire because the form was suitable to be applied as the dependent variable of the Ordinal Probit model. The rest of the categorical variables were transformed into binary form. Figure 2 summarizes the frequencies of the categorical variables that were kept in the final models after the elimination of insignificant predictors. More than 4% of the respondents commuted to their university by car. These students are the target of the first research question of this study. It is meant to understand the circumstances of using planning policies to make them refrain from car use for the purpose of commuting. More than 80% of them walk or use bikes, buses, trams, and trains to reach their shopping and entertainment destinations outside their neighborhood. This study seeks methods of encouraging the other 20% to do the same. More than 41% of them do not walk or bike inside their living area (to near destinations) for shopping/entertainment purposes. This finding reveals a gap that deserves much work for the improvement of active mobility on the local scale in Krakow. Among all respondents, 65.45% were females, and about 40% earned more than PLN 500 per month ( PLN 500 was equal to EUR 11,694 as of 1 February 2019 according to www.oanda.com, Accessed: 1 February 2019). This amount of money could be the result of working or financial assistance from the family or elsewhere. This corresponds to another piece of information revealed by another financial question: nearly 72% were financially dependent on their family. More than 31 percent of the respondents preferred to have entertainment outside their living neighborhood and 47% felt no sense of belonging to their living environment. About one-third found the quality of social and recreational facilities around their home acceptable, somewhat, or very good, and nearly 16% did not have a driving license. An overwhelming 85% majority chose far-away places rather than their own neighborhood for entertainment. This reflects failing urban planning and design in providing accessible leisure infrastructure around the living places of the youth in Krakow. Finally, two-thirds of the respondents had chosen their living place because of economic reasons, i.e., the price or rent of the house will rise in the future or it is affordable now.

4.2. Model Fit

Two BL models and one OP model were developed to answer the questions of this study. Here the final models after the elimination of insignificant variables are presented. The implications and feedback on the literature will be discussed in the next sections.

4.2.1. BL Model for Commute Mode Choice

The aim of the BL model for commute mode choice is to find ways to encourage student commuters to refrain from the use of personal or household cars. The model includes eight predictors including four highly significant variables of gender, car ownership, gross monthly income, and commute distance (p < 0.01); one significant variable (0.01 < p < 0.05), namely sense of belonging to a neighborhood; and three marginally significant variables (0.05 < p < 0.1), i.e., age, daily shopping area, and the quality of social/recreational neighborhood facilities. The model including the related validity tests can be observed in Table 3. According to the model, gender has a strong prediction power: it is 3.5 times more probable that male students use a car for commuting compared to female students. Car ownership is very strongly associated with mode choice, as expected. Gross monthly income is negatively associated with using modes other than the personal and household car: students with a monthly income of more than 500 PLN are 11% more likely to commute by car. Daily shopping places have also produced interesting results: if students do their daily shopping inside their own neighborhood, it is 228% more likely that they commute by modes other than car. This finding relates to the inter-relations between commute and non-commute trips. Surprisingly, if students feel a sense of belonging to their neighborhood, they are 35% more likely to take the car for commuting. The perceptions of students on the quality of social and recreational facilities in their neighborhood are strongly connected to their commute mode. If they perceive such facilities as unattractive, then they are 2.38 times more likely to commute by car. Again, the model shows that non-work activities are strongly correlated with commuting behaviors. Finally, as expected, commuting distance is positively correlated with car use: each additional 10 Km of commute distance is associated with 20% more car use. With a Nagelkerke R2 of 91%, the model has a very good fit to the data (Table 3). The Omnibus test approves that the model has a strong power to predict the variances of commuting by personal or household car (p < 0.001).

4.2.2. BL Model for Non-Work Trips outside the Neighborhood

A separate BL model was developed for travels to destinations that are located in distant places from the living neighborhood with the purpose of shopping and entertainment. It may be decisive for policymakers and planners to know what interventions can lead to a change from less sustainable modes to more sustainable modes like walking, cycling, bus, tram, and train trips. Thus, these modes were put in one category (1) and the other modes were classified as less sustainable modes (0). As a result of the BL modeling, nine variables are correlated with mode choices of non-work trips to distant destinations.
These variables include six highly significant variables of main daily activity, possession of a driving license, car ownership, sense of belonging to a neighborhood, the time passed since moving into the current home, and commute distance. Gender and intersection density around the home are significant correlates, while the daily shopping area is marginally significant. According to the final BL model that is summarized in Table 4, a female student is 1.8 times more likely to use sustainable modes than a male student. Those students who study and work at the same time are 51% more likely to use sustainable modes; in other words, students, whose main daily activity is only studying, are 51% more likely to use unsustainable modes. Having a driving license is associated with 38% more usage of unsustainable modes like a personal/household car, taxis, carpooling, car-sharing, and motorbikes. Car ownership is also correlated with the mode choice of non-work trips. Students who have expressed that they do their daily shopping inside their neighborhood (near their home) are 1.5 times more likely to use sustainable modes for shopping and entertainment in farther places. The results of a sense of belonging to the neighborhood are again unexpected: if a student does not feel a sense of belonging to their neighborhood, it is 51% more likely that they choose sustainable modes for non-work purposes in farther destinations. It is also important how long the students have lived in their current homes. For every additional year living in their current place, it is 95% more probable that they take unsustainable modes for non-work trips. As expected, students who live in areas with less connected street networks are more likely to take unsustainable modes for non-commute trips. Finally, every one km of additional commute distance is associated with a 1% higher probability of unsustainable mode usage. This BL model can predict 64% of the variance of mode choices (Nagelkerke in Table 4). The results of the Omnibus test for a highly significant approval of the prediction validity power of the model (p < 0.001) can be seen below.

4.2.3. OP Model for Frequency of Public Transit Ridership

After eighteen times running the model, the best model, including nine variables, resulted. This model included two highly significant variables (residential self-selection and the number of commute trips), three significant variables representing gender, financial dependence from family, and entertainment place, and four marginally significant variables (main daily activity, quality of the social and recreational facilities of the neighborhood, time living in the current home, and the intersection density in the home area). As summarized in Table 5, if the respondents are male, it is 30% less likely that they use public transport, one unit more frequently in the five-point Likert scale compared to female participants (e.g., a few times per week instead of a few times per month). This result can also be interpreted in this way: a male is 30% less likely to use public transit compared to a female for every given public transit frequency level. With a similar interpretation approach, for every given public transport frequency level, it is 27% less probable for a student whose activity is only studying to use public transit compared to a student who works and studies at the same time. Students who only study have simpler travel patterns than those who both work and study, and they hypothetically use public transit less for commuting. This could be due to various reasons, such as potentially living near the university (for example in dormitories) and walking or cycling more often. Alternatively, they might have a higher economic status and are supported by their families, probably allowing them to use cars for commuting trips.
Students who are not dependent on their families are 35% less likely to use public transit, one frequency level more than the students who are dependent on their families. Students who have their usual entertainment far away from their homes are 42% more probable to use public transit, one level (one-fifth) more frequently than those students who entertain themselves around their home area. Students who live in their current home for all reasons other than economic ones are 45% less probable to have one unit higher frequent public transit use compared to those who live in their home for economic reasons like an increase in rent/price or its general affordability. The results for the perceived quality of social/recreational facilities are somehow unexpected.
Students who find the quality of these facilities not acceptable are 23% less likely to use public transit one level higher than those who find the quality of these facilities acceptable or good. In other words, there are higher odds of using PT more frequently for those students who have a more positive perception of the quality of the neighborhood facilities. It is probably related to travel distances for non-commuting purposes; if students think the quality of the neighborhood facilities is high, then it is more probable that they will use public transit for such short-length trips.
The number of commute trips is positively associated with the frequency of public transit ridership. If the students take one more commute trip, the odds of increasing public transit use by as much as one level on the Likert scale will increase by 5%. This association is because many of the students commute by public transit. The length of time that the respondents have lived in their current home is negatively correlated with the frequency of their public transport use; in other words, students who have recently relocated to their current home are likely to have higher levels of public transit use. The odds of having one level more frequent public transit use in the Likert scale, e.g., moving from a few times per week to every day, increases by 1.6% for each year of shorter accommodation in the current home. Finally, the number of intersections per density (representing street network connectivity) is positively correlated to public transit use. If the number of intersections within the 600 m catchment area around a house increases by one, then it is probable that the frequency of public transit use jumps to a higher level by less than 1%. Thus, the more connected is the street network, the more likely is more frequent public transit use.
For testing the goodness of fit, the proportion of Chi-square to degrees of freedom of the model deviance was calculated. This ratio shows a value of 0.353 as seen in Table 5. Generally, if the value of this ratio is equal to or less than one, it means that the model has yielded a good fit. Moreover, the result of the Omnibus test shows a significant prediction power for the model (p < 0.001). A descriptive investigation of the significant variables of the above models provides interesting insights into our understanding of non-commute trip mode choice and public transportation use.
Figure 3 provides some of these insights. As seen in Figure 3a (top-left), many of the students who use buses, trams, and trains are those who live in neighborhoods with higher street connectivity. The diagram shows how the number of these students using mass public transit and living in such urban environments is more than car users living in the same type of areas. On the other hand, the number of everyday public transit users of mass transport services who live in areas with more connected street networks is more than car users living in the same areas (see yellow interpolation line). Figure 3b 2-illustrates a positive relationship between the sustainability of the non-commute mode choices for trips outside of the living district with the frequency of public transit use for commute trips to the university. The modes of the former variable have been sorted based on their suitability and sustainability, starting from the worst sustainability, namely personal and household cars, to the most sustainable and desirable one, bicycles. Biking is set as the most sustainable mode, even more wanted than walking, because it provides higher levels of physical activity, higher speed, and shorter travel time. This positive interrelation is seen for both activity types: students who only study and students who work and study at the same time. However, the rate of change (coefficient) is higher for students who work and study. Figure 3c shows a relative negative correlation between public transit use and the length of years living in the current home. In other words, the more recently the students have come to their current homes, the more public transportation they will use. This association is found for both types of daily activity, but for work/study activity, it seems to be steeper. Finally, Figure 3d depicts a clear positive association between the frequency of public transit use and street connectivity around the home, whereas there is no observable difference between genders.

5. Discussion

Mode choices of residents have associations with socioeconomic status, travel behavior, and the people’s perceptions. Therefore, scholars in high-income countries have investigated this topic thoroughly, mostly concentrating on socioeconomic and land use determinants of urban travel behavior [44,45,46], while knowledge on this subject is limited in Polish cities if they are to be considered an example of a post-socialist city in the emerging market. This paper generates two models for forecasting mode choice and frequency of public transit by employing socioeconomics, travel habits, and perceptions of university students in Krakow.
Our findings show that income is a significant variable in predicting mode choice among Polish students. Therefore, this result confirms as well the conclusions of a study on travel behavior in German cities that indicated higher-income residents prefer to drive cars more than use other mode choices [47]. This result on the positive correlation between income and driving cars is consistent as well with a study in Toronto that showed that, in low-income neighborhoods, residents use fewer cars as a dominant mode choice in comparison to other neighborhoods [48]. Nonetheless, this conclusion is inconsistent with the results of a study in England, arguing that high incomes reduce commuting by car [49] Giuliano (2005) discussed how low-income households use public transit more frequently than other socioeconomic classes in Canada [50]. There is no significant correlation between income and the frequency of using public transit. However, there are differences between the results for Krakow University students and those in the Canadian study. The results of the two studies cannot be compared because there is a significant difference between the incomes of university students in Krakow and those in high-income countries such as Canada.
The two models in this paper show the positive association between car ownership and driving cars in commuting and non-commuting trips and confirm the investigation on the cities in England [49]. According to the findings of this study, age and car ownership are highly significant variables that were connected to driving a car for commuting and non-commuting trips of students in Krakow, even though age has been proven to have a negative correlation with commuting by car. Both variables representing an individual attribute (age) and household attribute (car ownership) were studied in urban travel studies in different contexts. For example, a study on mode-choice behavior in Nanjing, China, indicated that different age groups and car ownership are two influential variables in detecting the residents’ mode choice [51]. The current study considered only the correlations of age with mode choice among university students. Hence, the impact of age on car usage may differ for other socioeconomic groups of residents in Krakow.
In addition, car ownership is a significant correlate of mode choice and driving in Germany and the U.S.A. [52]. The findings of this paper are in the same direction as Buehler’s study, confirming that having fewer cars in the household is correlated with lower numbers of trips by personal car. Our results also show that men are more dependent on private cars than women are. So, gender is a significant variable for predicting mode choice and frequency of using public transit in Krakow, and this confirms the result of another study in the Netherlands [53].
The perception of residents about their neighborhoods is an important determinant for planning urban travel in Krakow. Exiting entertainment places in the neighborhood, quality of social and recreational facilities in the neighborhood, residential self-selection, and time spent living in the current home, along with street connectivity, play a significant role in defining the frequency of using public transit among university students in Poland.
In contrast, a study on the influence of residential self-selection in Norway showed that the economic reason for choosing the current home location has an important role in using public transit. According to our results, students who chose neighborhoods based on economic reasons used less public transit than those who had other preferences for selecting residential areas. Although in Norway, residential self-selection has impacts on mode choice, it is not an important predictor for it [54]. Additionally, this paper has the same results with an investigation confirming the positive association between street connectivity and public transit use in the USA [55].
According to our interpretation of results, the designing of more connected street networks is associated with increased usage of public transit in Krakow. Moreover, our results about the positive association between street connectivity and public transit confirm the investigation on American cities from 2009 [55]. According to this study, residents who live in neighborhoods with more intersections and a higher level of connectivity use more public transit than those who live in auto-oriented neighborhoods with weak connectivity of street networks [56]. The relationship between some explanatory variables, including accessibility to entertainment places inside the living neighborhood, quality of social and recreational facilities, daily shopping area, and sense of belonging to the neighborhood, are among the less-studied variables for modeling mode choice and public transit among developed and developing countries.
The theory of planned behavior (TPB) predicts and explains human behavior intention based on attitudes, subjective norms, and perceived behavioral control [9]. The TPB has been used in choice behavioral studies and has shown a good explanatory power for behavioral intentions. The impacts of psychological features like value systems, beliefs, and individual norms are highlighted as essential [57]. In the current study, students with higher incomes preferred to travel by car in Krakow. This result confirms a previous investigation in Eastern European countries that emphasized higher economic position shaping travel by car [34]. Carrasco et al. (2014) discussed how cultural and socio-structural context shapes personal attitudes and behaviors [58]. Therefore, socioeconomic and cultural conditions of the post-socialist society have, as well, impacts on psychology, behavior, personal beliefs, and norms.
According to the results of this study, men use cars for commuting and non-commuting trips more than women do. In addition, women use public transit more than men do. People with higher incomes prefer to choose a car as the most used mode choice for daily trips. Economic reasons for selecting residential choice have a positive relationship with the frequency of use of public transit. Students with a weaker sense of belonging to the neighborhood drive cars on daily trips more than those who have a stronger sense of belonging. Weak quality of social and recreational activities is associated with lower numbers of public transit use in Krakow. Hence, according to our findings, socioeconomic and perception variables correlate with mode choice and public transit and are in line with the TPB, confirming that norms, attitude, and perceived behavioral control can explain mode choice.
Our findings show that in Krakow, frequent use of public transit is correlated with street connectivity for university students, as mentioned before. Hence, urban planners and decision-makers can improve connectivity and so strengthen sustainable transportation as a means of increasing the intersection density in new master plans for street networks or enhancing connectivity in urban regeneration plans. According to the results of this paper, streets with longer lengths with a smaller number of intersections and separated places led residents to prefer to drive more cars than active transport modes, i.e., walking and biking. Also, university students who live in neighborhoods with entertainment facilities prefer to have recreational activities inside the neighborhood, so they use less public transit than those who have to travel to other neighborhoods to access entertainment places. In addition, the daily shopping area has a relationship with mode choice in commute and non-commute trips in Krakow. In other words, university students who live in neighborhoods with acceptable quality of facilities like shopping centers and social and entertainment facilities have fewer trips to other neighborhoods for this purpose and, as a result, they drive fewer private personal cars. Therefore, urban planners in Eastern and Central Europe are recommended to design mixed-use neighborhoods and add different land uses and facilities to residential areas to reduce the number of long-distance entertainment trips of students by car. On the other hand, commuting distance is positively correlated with driving a personal car. Hence, the separation of workplaces or university areas from residential areas will cause an increasing number of commuting trips by car. Therefore, the creation of mixed-use areas is a crucial issue that should be considered by urban policymakers in both new plans and regeneration and rehabilitation plans for Krakow and similar cities in the neighboring countries and regions. Moreover, income is a significant predictor of car usage and using less public transport in Krakow. Students with high incomes prefer to drive a car and use less public transit; but, to achieve sustainable development, it is necessary to consider different income groups in designing development areas by urban planners and policymakers. In addition to income, gender is also an important socioeconomic variable for predicting mode choice in Krakow, so it is essential for decision-makers to consider this variable as well when it comes to reducing discrimination among men and women in the share of urban travel.

6. Conclusions

This paper develops two Binary Logistic (BL) models for modeling mode choice in commuting and non-commuting trips of university students in Krakow. In addition, the Ordinal Probit (OP) model is generated for forecasting the frequency of public transit use in Krakow. The BL model for commuting purposes indicates that commuting by car is strongly correlated with gender, car ownership, gross monthly income, and commute distance among university students. Moreover, driving a car on the work trips has a significant relationship with the sense of belonging to the neighborhood, while age, daily shopping area, and the quality of social/recreational neighborhood facilities have a marginal association with driving on commuting trips. Driving a car or riding a motorbike on non-work trips is correlated with nine variables, including main daily activity, possession of a driving license, car ownership, a sense of belonging to the neighborhood, the time passing from residing in the current home, commute distance, gender, intersection density around the home, and daily shopping area. Residential self-selection and the number of commute trips have strong influences as explanatory variables for modeling the frequency of public transit among university students in Krakow. In addition to the self-selection of residence and number of commuting trips, frequency of public transit use is correlated with gender, daily activity, financial dependence, entertainment place, quality of social and recreational facilities, time living in the current home, and street connectivity in Krakow. We can conclude that these three models can explain clearly the mode choice behavior among university students and that the data contributes to filling the research gap existing in the context of post-socialist cities. Still, it also highlights the long way that is still ahead as there is a strong need for more studies on different socioeconomic variables and urban travel habits from various cities in Eastern and Central European countries, which could contribute to more versatility, sustainability, and a better focus regarding policy-making on actual demands of citizens monitored through their urban travel behavior. The current study is limited to examining travel behavior among university students. Future studies can assess travel behavior among different socioeconomic groups of residents. It is also necessary to conduct more studies that use disaggregated data for modeling mode choices in these regions in order to provide a holistic view to municipalities and other researchers. The needs and determinants of sustainable development have been studied and identified for developed countries. On the other hand, travel habits, attitudes, social norms, and value systems can influence sustainable development. Increasing the awareness of university students through the education system can have positive impacts on travel behavior. Therefore, it is suggested that future studies assess the impact of the education system on raising awareness of sustainable travel and travel habits. This paper is a reaction to the identification of this need. Moreover, the evidence-based recommendations of this paper direct the urban planners and decision-makers of developing regions to use the potential in redesigning urban street networks to support less car-dependent urban mobility, i.e., reducing the number of long-distance entertainment trips by personal car.

Author Contributions

Conceptualization, H.M. and M.M.; methodology, H.M.; software, H.M. and M.M.; validation, M.M. and K.N.-H.; formal analysis, H.M.; investigation, M.M.; resources, M.M.; data curation, M.M. and K.N.-H.; writing—original draft preparation, H.M. and M.M.; writing—review and editing, H.M.; visualization, H.M.; supervision, H.M.; project administration, H.M. All authors have read and agreed to the published version of the manuscript.

Funding

The cooperation between researchers of this study was funded by the German Academic Exchange Service (DAAD). Grant number: DAAD-Personenkennziffer: 91722843 to the first author for guest-lecturing at Cracow University of Technology (15 October 2018–15 April 2019).

Data Availability Statement

The data presented in this study are available on request from the corresponding author due to the need for authorization from the third author.

Acknowledgments

The authors would like to thank the German Academic Exchange Service (DAAD) for providing funding.

Conflicts of Interest

The authors declare no conflicts of interest.

Appendix A

Questionnaire for Krakow
City Code:Neighborhood Code
Questionnaire codeDate
(1) ☐ Male
   ☐ Female
(2) Age
(3) What is your daily activity?

Only Study ☐


Work and Study ☐
(4) Do you have a driving license?

No ☐


Yes ☐
(5) How many cars do you own?
0 ☐     1 ☐     2 or more ☐
(6) Are you financially dependent on your family?
No ☐             Yes ☐
(7) What is your gross monthly income (including financial support received from your family)?

Below 500 PLN
From 500 to 1000 PLN
From 1001 to 2000 PLN
Above 2000 PLN
(8) How much money do you spend per month?

Below 500 PLN
From 500 to 1000 PLN
From 1001 to 2000 PLN
Above 2000 PLN
(9) How many trips to and from the university did you have during the last week?

(10) Which mode of transportation do you use most frequently in your trips to the university?

Motorbike ☐
Bicycle ☐
Uber of similar apps ☐
Taxi ☐
Walking ☐
Personal/household car ☐
Carpooling (e.g., BlaBlaCar) ☐
Bus/minibus ☐
Tram/Train ☐
(11) How many times did you go out for shopping or entertainment during the last week?

(12) Where do you buy everyday articles more often–inside your neighborhood or outside?

Outside ☐                    Inside ☐
(13) Which mode of transportation do you use most frequently for shopping/entertainment trips inside your neighborhood?

Motorbike ☐
Bicycle ☐
Uber or similar apps ☐
Taxi ☐
Walking ☐
Personal/household car ☐
Carpooling (e.g., BlaBlaCar) ☐
Bus/minibus ☐
Tram/Train ☐
(14) Which mode of transportation do you use most frequently for shopping/entertainment trips outside your neighborhood?

Motorbike ☐
Bicycle ☐
Uber of similar apps ☐
Taxi ☐
Walking ☐
Personal/household car ☐
Carpooling (e.g., BlaBlaCar) ☐
Bus/minibus ☐
Tram/Train ☐
(15) How often do you use public transit?
Almost never ☐      Rarely ☐        Every day ☐
A few times per week ☐         A few times per month ☐
(16) Do you feel belonging to your neighborhood?
No ☐ Yes ☐
(17) Are there attractive shops or shopping centers in your neighborhood?
No ☐ Yes ☐
(18) Where do you usually prefer to have entertainment?
Far away ☐                Inside my neighborhood ☐
(19) How do you think about the social/recreational facilities of your neighborhood?
Medium ☐                Very attractive ☐
Acceptably attractive ☐     Not attractive/not available ☐
Little attractive ☐
(20) Why did you choose this neighborhood to live in?

The house was affordable to buy or rent ☐
The house was near to my working place/school ☐
The surrounding environment is attractive ☐
The house will have a higher price in the future ☐
To be near to our relatives/friends ☐
I have lived here since I was born/childhood ☐
(21) How many years do you live in this neighborhood?
(22) Please, indicate your place of residence

Please indicate on the map below the point (e.g., square) or the intersection of the streets nearest to your place of residence according to the scheme: City, Street, Street (e.g., Kraków, Warszawska, Szlak).

(23) Please indicate the place where you are studying (campus where your classes take place most often)

Please indicate on the map below the point (e.g., square) or the intersection of the streets nearest to your place of learning according to the scheme:
City, Street, Street (e.g., Kraków, Warszawska, Szlak).

Thank you for your participation in this survey!

References

  1. Murtagh, N.; Gatersleben, B.; Uzzell, D. Multiple identities and travel mode choice for regular journeys. Transp. Res. Part F Traffic Psychol. Behav. 2012, 15, 514–524. [Google Scholar] [CrossRef]
  2. Zhu, S.; Masud, H.; Xiong, C.; Yang, Z.; Pan, Y.; Zhang, L. Travel Behavior Reactions to Transit Service Disruptions. Transp. Res. Rec. 2017, 2649, 79–88. [Google Scholar] [CrossRef]
  3. Zhu, S.; Levinson, D.M. (Eds.) Disruptions to Transportation Networks: A Review. In Selected Papers from the Fourth International Symposium on Transportation Network Reliability; Springer: New York, NY, USA, 2011. [Google Scholar]
  4. Vij, A.; Carrel, A.; Walker, J.L. Incorporating the influence of latent modal preferences on travel mode choice behavior. Transp. Res. Part A Policy Pract. 2013, 54, 164–178. [Google Scholar] [CrossRef]
  5. Wang, T.; Chen, C. Attitudes, mode switching behavior, and the built environment: A longitudinal study in the Puget Sound Region. Transp. Res. Part A Policy Pract. 2012, 46, 1594–1607. [Google Scholar] [CrossRef]
  6. Bruns, A.; Matthes, G. Moving into and within cities—Interactions of residential change and the travel behavior and implications for integrated land use and transport planning strategies. Travel Behav. Soc. 2019, 17, 46–61. [Google Scholar] [CrossRef]
  7. Eldeeb, G.; Mohamed, M.; Páez, A. Built for active travel? Investigating the contextual effects of the built environment on transportation mode choice. J. Transp. Geogr. 2021, 96, 103158. [Google Scholar] [CrossRef]
  8. Fishbei, M.A.; Ajzen, I. Belief, Attitude, Intention and Behaviour: An Introduction to Theory and Research; Addison-Wesley: Reading, MA, USA, 1975; ISBN 0-201-02089-0. [Google Scholar]
  9. Ajzen, I. From Intentions to Actions: A Theory of Planned Behavior. In Action Control; Kuhl, J., Beckmann, J., Eds.; Springer: Berlin/Heidelberg, Germany, 1985; ISBN 978-3-642-69748-7. [Google Scholar]
  10. Moniruzzaman, M.; Farber, S. What drives sustainable student travel? Mode choice determinants in the Greater Toronto Area. Int. J. Sustain. Transp. 2018, 12, 367–379. [Google Scholar] [CrossRef]
  11. Hasnine, M.S.; Lin, T.; Weiss, A.; Habib, K.N. Determinants of travel mode choices of post-secondary students in a large metropolitan area: The case of the city of Toronto. J. Transp. Geogr. 2018, 70, 161–171. [Google Scholar] [CrossRef]
  12. Moses, O. Mode choice of undergraduates: A case study of lecture trips in Nigeria. Indones. J. Geogr. 2016, 18, 145–156. [Google Scholar]
  13. Cattaneo, M.; Malighetti, P.; Meoli, M.; Paleari, S. University spatial competition for students: The Italian case. Reg. Stud. 2017, 51, 750–764. [Google Scholar] [CrossRef]
  14. Mouratidis, K.; Ettema, D.; Næss, P. Urban form, travel behavior, and travel satisfaction. Transp. Res. Part A Policy Pract. 2019, 129, 306–320. [Google Scholar] [CrossRef]
  15. Leck, E. The Impact of Urban Form on Travel Behavior: A Meta-Analysis. Plan. J. 2011, 19, 37–56. [Google Scholar] [CrossRef]
  16. Næss, P. ‘New urbanism’ or metropolitan-level centralization? A comparison of the influences of metropolitan-level and neighborhood-level urban form characteristics on travel behavior. J. Transp. Land Use 2011, 4, 25–44. [Google Scholar] [CrossRef]
  17. Ton, D.; Duives, D.C.; Cats, O.; Hoogendoorn-Lanser, S.; Hoogendoorn, S.P. Cycling or walking? Determinants of mode choice in the Netherlands. Transp. Res. Part A Policy Pract. 2019, 123, 7–23. [Google Scholar] [CrossRef]
  18. Heinen, E.; van Wee, B.; Maat, K. Commuting by Bicycle: An Overview of the Literature. Transp. Rev. 2010, 30, 59–96. [Google Scholar] [CrossRef]
  19. Muñoz, B.; Monzon, A.; Daziano, R.A. The Increasing Role of Latent Variables in Modelling Bicycle Mode Choice. Transp. Rev. 2016, 36, 737–771. [Google Scholar] [CrossRef]
  20. Ramezani, S.; Pizzo, B.; Deakin, E. Determinants of sustainable mode choice in different socio-cultural contexts: A comparison of Rome and San Francisco. Int. J. Sustain. Transp. 2018, 12, 648–664. [Google Scholar] [CrossRef]
  21. Roos, J.M.; Sprei, F.; Holmberg, U. Sociodemography, Geography, and Personality as Determinants of Car Driving and Use of Public Transportation. Behav. Sci. 2020, 10, 93. [Google Scholar] [CrossRef] [PubMed]
  22. Winters, M.; Buehler, R.; Götschi, T. Policies to Promote Active Travel: Evidence from Reviews of the Literature. Curr. Environ. Health Rep. 2017, 4, 278–285. [Google Scholar] [CrossRef]
  23. Wang, Y.; Chau, C.K.; Ng, W.Y.; Leung, T.M. A review on the effects of physical built environment attributes on enhancing walking and cycling activity levels within residential neighborhoods. Cities 2016, 50, 1–15. [Google Scholar] [CrossRef]
  24. Handy, S.; van Wee, B.; Kroesen, M. Promoting Cycling for Transport: Research Needs and Challenges. Transp. Rev. 2014, 34, 4–24. [Google Scholar] [CrossRef]
  25. Mitra, R. Independent Mobility and Mode Choice for School Transportation: A Review and Framework for Future Research. Transp. Rev. 2013, 33, 21–43. [Google Scholar] [CrossRef]
  26. Mehriar, M.; Masoumi, H.; Aslam, A.B.; Gillani, S.M.; Suhail, T.; Zulfiqar, A. The Relations between Street Network Configuration and Travel Behavior in Pakistan; the Optimal Level of Street Connectivity for a More Active Mobility. Appl. Sci. 2021, 11, 11015. [Google Scholar] [CrossRef]
  27. Soltani, A.; Pojani, D.; Askari, S.; Masoumi, H.E. Socio-demographic and built environment determinants of car use among older adults in Iran. J. Transp. Geogr. 2018, 68, 109–117. [Google Scholar] [CrossRef]
  28. Pucher, J.; Buehler, R. Transport policies in central and Eastern Europe. In Transport Strategy, Policy, Institiutions; Emerald Publishing: Bingley, UK, 2005; pp. 725–744. [Google Scholar]
  29. Stead, D.; Pojani, D. The Urban Transport Crisis in Emerging Economies: A Comparative Overview; Springer: Cham, Switzerland, 2017. [Google Scholar]
  30. Pojani, E.; van Acker, V.; Pojani, D. Cars as a status symbol: Youth attitudes toward sustainable transport in a post-socialist city. Transp. Res. Part F Traffic Psychol. Behav. 2018, 58, 210–227. [Google Scholar] [CrossRef]
  31. Keserű, I. Cross-and reverse commuting: Are mobility patterns changing in the suburban areas of Central and Eastern Europe. In Proceedings of the European Transport Conference, Glasgow, UK, 11–13 October 2010. [Google Scholar]
  32. Stenning, A. Post-socialism and the changing geographies of the everyday in Poland. Trans. Inst. Br. Geogr. 2005, 30, 113–127. [Google Scholar] [CrossRef]
  33. Ferge, Z. And What if the State Fades Away?: The civilising process and the state 1. In The End of the Welfare State? Routledge: London, UK, 2012. [Google Scholar]
  34. Orru, K.; Poom, A.; Nordlund, A. Socio-structural and psychological factors behind car use: Comparing Northern and Eastern Europe. Transp. Res. Part A Policy Pract. 2019, 119, 313–325. [Google Scholar] [CrossRef]
  35. Šimeček, M.; Gabrhel, V.; Tögel, M.; Lazor, M. Travel behaviour of seniors in Eastern Europe: A comparative study of Brno and Bratislava. Eur. Transp. Res. Rev. 2018, 10, 16. [Google Scholar] [CrossRef]
  36. Wójcik, S. The determinants of travel mode choice: The case of Łódź, Poland. Bull. Geogr. Socio-Econ. Ser. 2019, 44, 93–101. [Google Scholar] [CrossRef]
  37. Mehriar, M.; Masoumi, H.; Nosal-Hoy, K. Correlations of urban sprawl with transport patterns and socioeconomics of university students in cracow, Poland. Sci. J. Silesian Univ. Technol. Ser. Transp. 2020, 108, 159–180. [Google Scholar] [CrossRef]
  38. Szmelter-Jarosz, A.; Suchanek, M. Mobility Patterns of Students: Evidence from Tricity Area, Poland. Appl. Sci. 2021, 11, 522. [Google Scholar] [CrossRef]
  39. Gałka, P.; Krzysztof, G.; Katarzyna, H.; Eamonn, J.; Olgierd, W. Urban public transport as a tool of sustainable mobility policy–the example of Poland. Ekon. Międzynarodowa 2020, 31, 154–184. [Google Scholar] [CrossRef]
  40. Rychlewski, J. Street Network Design for a Sustainable Mobility System. Transp. Res. Procedia 2016, 14, 528–537. [Google Scholar] [CrossRef]
  41. Romańczyk, K.M. Krakow—The city profile revisited. Cities 2018, 73, 138–150. [Google Scholar] [CrossRef]
  42. Bokwa, A.; Hajto, M.J.; Walawender, J.P.; Szymanowski, M. Influence of diversified relief on the urban heat island in the city of Kraków, Poland. Theor. Appl. Climatol. 2015, 122, 365–382. [Google Scholar] [CrossRef]
  43. Ciach, M.; Fröhlich, A. Habitat preferences of the Syrian Woodpecker Dendrocopos syriacus in urban environments: An ambiguous effect of pollution. Bird Study 2013, 60, 491–499. [Google Scholar] [CrossRef]
  44. Kattiyapornpong, U.; Miller, K. (Eds.) Understanding Travel Behavior Using Demographic and Socioeconomic Variables as Travel Constraints. In Proceedings of the ANZMAC 2006: Advancing Theory, Maintaining Relevance: Proceedings of the 2006 Australian & New Zealand Marketing Academy Conference, Brisbane, QLD, Australia, 4–6 December 2006. [Google Scholar]
  45. van Acker, V.; Witlo, F. The effects of the land use system on travel behaviour: Towards a new research approach. In Proceedings of the BIVEC-GIBET Transport Research Day, Leuven, Belgium, 1–2 June 2005; pp. 331–353. [Google Scholar] [CrossRef]
  46. de Abreu e Silva, J. Spatial self-selection in land-use–travel behavior interactions: Accounting simultaneously for attitudes and socioeconomic characteristics. J. Transp. Land Use 2014, 7, 63–84. [Google Scholar] [CrossRef]
  47. Jochem, P.; Lisson, C.; Khanna, A.A. The role of coordination costs in mode choice decisions: A case study of German cities. Transp. Res. Part A Policy Pract. 2021, 149, 31–44. [Google Scholar] [CrossRef]
  48. Yousefzadeh Barri, E.; Farber, S.; Kramer, A.; Jahanshahi, H.; Allen, J.; Beyazit, E. Can transit investments in low-income neighbourhoods increase transit use? Exploring the nexus of income, car-ownership, and transit accessibility in Toronto. Transp. Res. Part D Transp. Environ. 2021, 95, 102849. [Google Scholar] [CrossRef]
  49. Giuliano, G. Low Income, Public Transit, and Mobility. Transp. Res. Rec. 2005, 1927, 63–70. [Google Scholar] [CrossRef]
  50. Keyes, A.K.; Crawford-Brown, D. The changing influences on commuting mode choice in urban England under Peak Car: A discrete choice modelling approach. Transp. Res. Part F Traffic Psychol. Behav. 2018, 58, 167–176. [Google Scholar] [CrossRef]
  51. Cheng, L.; Chen, X.; de Vos, J.; Lai, X.; Witlox, F. Applying a random forest method approach to model travel mode choice behavior. Travel Behav. Soc. 2019, 14, 1–10. [Google Scholar] [CrossRef]
  52. Buehler, R. Determinants of transport mode choice: A comparison of Germany and the USA. J. Transp. Geogr. 2011, 19, 644–657. [Google Scholar] [CrossRef]
  53. Limtanakool, N.; Dijst, M.; Schwanen, T. The influence of socioeconomic characteristics, land use and travel time considerations on mode choice for medium- and longer-distance trips. J. Transp. Geogr. 2006, 14, 327–341. [Google Scholar] [CrossRef]
  54. Wolday, F.; Næss, P.; Cao, X. Travel-based residential self-selection: A qualitatively improved understanding from Norway. Cities 2019, 87, 87–102. [Google Scholar] [CrossRef]
  55. Ozbil, A.; Peponis, J.; Bafna, S. (Eds.) The Effects of Street Configuration on Transit Ridership. In Proceedings of the 7th International Space Syntax Symposium, Stockholm, Sweden, 8–11 June 2009; KTH School of Architecture and the Built: Stockholm, Sweden, 2009. [Google Scholar]
  56. Cervero, R.; Gorham, R. Commuting in Transit Versus Automobile Neighborhoods. J. Am. Plan. Assoc. 1995, 61, 210–225. [Google Scholar] [CrossRef]
  57. de Groot, J.I.M.; Steg, L. Value Orientations to Explain Beliefs Related to Environmental Significant Behavior. Environ. Behav. 2008, 40, 330–354. [Google Scholar] [CrossRef]
  58. Carrasco, J.A.; Farber, S. Selected papers on the study of the social context of travel behaviour. Transp. Res. Part A Policy Pract. 2014, 68, 1–2. [Google Scholar] [CrossRef]
Figure 1. The structure of the methodology.
Urbansci 08 00113 g001
Figure 2. Frequencies of the categorical variables.
Urbansci 08 00113 g002
Figure 3. Descriptive relations between non-commute mode choices, frequency of public transit use, and some of the significant variables of the models: (a) top-left: the relation between public transit use, non-work mode choice, and intersection density around home; (b) top-right: the relation between main daily activity, public transit use, and non-work mode choice; (c) bottom-left: the relation between daily activity, public transit use, and length of time living in the current home; and (d) bottom-right: the relation between gender, public transit use, and intersection density around home.
Urbansci 08 00113 g003
Table 1. Quantification methods of the dependent and independent variables of this study.
VariableSource/QuantificationCoding
GenderExtracted by questionnaireMale = 1, Female = 2
AgeExtracted by questionnaire
Main daily activityExtracted by questionnaireOnly study = 1
Work and study = 2
Driving licenseExtracted by questionnaire
Car ownershipExtracted by questionnaireWithout car = 1
1 car = 2, 2 cars or more = 3
Financial dependency statusExtracted by questionnaireNo = 0, yes = 1
Gross monthly incomeExtracted by questionnaireBelow PLN 500 = 1, from PLN 500 to 1000 = 2,
From PLN 1001 to 2000 = 3, above PLN 2000 = 4
Number of commute tripsExtracted by questionnaire/each respondent indicated the number of trips for last week
Mode of transportation for commuting trips Motorbike = 1, bicycle = 2, Uber or similar app = 3, taxi = 4, walking = 5, car = 6, carpooling = 7, bus/minibus = 8, tram/train = 9
Number of trips for shopping or entertainmentExtracted by questionnaire/each respondent indicated the number of trips for last week
Daily shopping areaExtracted by questionnaireOutside = 1, inside = 2
Mode choice for shopping/entertainment inside the neighborhood Extracted by questionnaireMotorbike = 1, bicycle = 2, Uber or similar app = 3, taxi = 4, walking = 5, car = 6, carpooling = 7, bus/minibus = 8, tram/train = 9
Mode choice for shopping/entertainment outside the neighborhoodExtracted by questionnaireMotorbike = 1, bicycle = 2, Uber or similar app = 3, taxi = 4, walking = 5, car = 6, carpooling = 7, bus/minibus = 8, tram/train = 9
Frequency of public transport useExtracted by questionnaireAlmost never = 1, rarely = 2, a few times per month = 3, a few times per week = 4, every day = 5
Sense of belonging to neighborhoodExtracted by questionnaireNo = 0, yes = 1
Attractiveness of shopsExtracted by questionnaireNo = 0, yes = 1
Entertainment placeExtracted by questionnaireFar away = 1, inside my neighborhood = 2
Quality of social/recreational facilitiesExtracted by questionnaireNot attractive = 1, a little attractive = 2, acceptably attractive = 3, medium = 4, very attractive = 5
Residential location choiceExtracted by questionnaireThe house was affordable to buy = 1, the house was near to my work = 2, the surrounding environment is attractive = 3, the house will have a higher price = 4, to be near my relatives = 5, I have been living here since I was born = 6
Length of time living in the current homeExtracted by questionnaire
Urban sprawl around homeMeasured by Shannon entropy/Krakow divided into 4256 grids in GIS and, after that, computed by employing zonal extension and spatial analysis tools; after that, home points joined to grids based on common spatial location to get the amount of disaggregated Shannon entropy
Link density around homeFor each respondent who indicated home place, the 600 m catchment area was calculated according to street network; after that, the total length of the street link in each catchment area was divided by the total area of catchment area
Intersection density around homeFor each respondent who indicated home place, the 600 m catchment area was calculated according to street network; after that, the number of intersections in each catchment area was divided by the total area of catchment area
Link-node ratio around homeFor each respondent who indicated home place, the 600 m catchment area was calculated according to street network; after that, the number of links in each catchment area was divided by the number of intersections in each catchment area
Inversed Building Coverage Ratio (BCR) around home For each respondent who indicated home place, the 600 m catchment area was calculated according to street network; after that, the area of buildings was divided by the area of the catchment area and then one divided by the amount of BCR in each catchment area.
Urban sprawl around universityMeasured by Shannon entropy/Krakow, divided to 4256 grids in GIS and, after that, computed by employing zonal extension and spatial analysis tools; after that, university points were joined to grids based on common spatial location to get their amount of disaggregated Shannon entropy
Link density around the universityFor each respondent who indicated the university place, the 600 m catchment area was calculated according to street network; after that, the total length of the street link in each catchment area was divided by the total area of catchment area
Intersection density around the universityFor each respondent who indicated the university place, the 600 m catchment area was calculated according to street network; after that, the number of intersections in each catchment area was divided by the total area of catchment area
Link-node ratio around the universityFor each respondent who indicated the university place, the 600 m catchment area was calculated according to the street network; after that, the number of links in each catchment area was divided by the number of intersections in each catchment area
Inversed Building Coverage Ratio (BCR) around the university For each respondent who indicated the university place, the 600 m catchment area was calculated according to street network; after that, the area of buildings was divided by the area of catchment area, and then one was divided by the amount of BCR in each catchment area
Commuting Distance (m)For each respondent who indicated home and university place by addressing the nearest intersection to their home and university, the points, pinned in Google Maps, were exported to GIS, and in GIS the shortest commute route based on the street network was calculated.
Table 2. Descriptive statistics of the continuous variables of the sample.
VariableNMinimumMaximumMeanStd. DeviationVariance
Age1287173722.12.14.6
Number of commute trips92164011.14.621.5
Length of time living in the current home12880285.97.555.9
Intersection density around home67000.16990.04620.02730.0007
Commuting distance (m)663018,519516430999,603,022
Table 3. Binary logistic regression model for commute mode choice.
Variable/MeasureBS.E.Walddfpβ
Gender1.2570.4677.26010.0073.516
Age−0.1560.0853.41110.0650.855
Car ownership6.6162.2798.43010.004747.015
Gross monthly income−2.2200.7927.85510.0050.109
Daily shopping area0.8250.4613.20610.0732.281
Sense of belonging to neighborhood−1.0380.5193.99410.0460.354
Quality of social/recreational facilities0.8690.4703.42110.0642.384
Commuting distance (m)−0.00020.000077.73310.0050.9998
Omnibus Tests of Model Coefficients
Chi-squaredfp
763.5248<0.001
Model Summary
−2 Log likelihoodNagelkerke R Square
155.590.912
Table 4. Binary logistic regression model for the mode choice of shopping/entertainment trips outside of the neighborhood (to far-away destinations).
Variable/MeasureBS.E.Walddfpβ
Gender0.5820.2385.99010.0141.790
Main daily activity−0.6660.2358.04610.0050.514
Driving license−3.2720.74419.3431<0.0010.038
Car ownership4.8621.01722.8401<0.001129.266
Daily shopping area0.4350.2423.23710.0721.545
Sense of belonging to neighborhood−0.6660.2556.81210.0090.514
Length of time living in the current home−0.0480.0159.92310.0020.953
Intersection density around home10.4004.6195.06810.02432,846.636
Commuting
distance (m)
−0.000120.000049.61410.0020.9999
Omnibus Tests of Model Coefficients
Chi-squaredfp
430.5159<0.001
Model Summary
−2 Log likelihoodNagelkerke R Square
483.0530.640
Table 5. Ordered Probit model for frequency of public transit use (Reference category of the independent variable: using public transport every day.
Parameter MeasureCategory of IVBStd. ErrorHypothesis Testβ
Wald
Chi-Square
dfp
ThresholdFrequency of PT use =
Almost never
−2.6560.447735.2001<0.0010.070
Frequency of PT use = Rarely−1.5830.309626.1571<0.0010.205
Frequency of PT use =
A few times per month
−1.2530.300717.3621<0.0010.286
Frequency of PT use =
A few times per week
−0.3500.29351.42110.2330.705
Gender = Male −0.2990.13434.95210.0260.742
Gender = FemaleReference
Main daily activity =
Only study
−0.2670.14413.42710.0640.766
Main daily activity =
Work and study
Reference
Financial dependency status −0.3470.16114.65210.0310.707
Financial dependency status =
Dependent
Reference
Entertainment place =
Far-away
0.4230.16616.48610.0111.527
Entertainment place =
Inside neighborhood
Reference
Quality of social/recreational facilities = Not acceptable −0.2270.13053.03810.0810.797
Quality of social/recreational
facilities = Acceptable or good
Reference
Residential location choice =
All other reasons
−0.4480.139710.26610.0010.639
Residential location choice =
Economic reasons
Reference
Number of commute trips 0.0470.01677.94710.0051.048
Length of time living in the
current home
−0.0160.00923.12610.0770.984
Intersection density around home 4.5952.47823.43810.06499.010
Goodness of Fit
ValuedfValue/df
Deviance668.44418910.353
Pearson Chi-Square1595.70118910.844
Log Likelihood−334.222
Omnibus Test
Likelihood Ratio Chi-Squaredfp
35.3299<0.001
Disclaimer/Publisher’s Note: The statements, opinions and data contained in all publications are solely those of the individual author(s) and contributor(s) and not of MDPI and/or the editor(s). MDPI and/or the editor(s) disclaim responsibility for any injury to people or property resulting from any ideas, methods, instructions or products referred to in the content.

