Abstract
The life quality of populations, especially in large agglomerations, is significantly reduced due to air pollution. Major sources of pollution include motor vehicles, industrial facilities and the burning of fossil fuels. A particularly significant source of pollution is thermal power plants and coal-fired power plants, which are widely used in developing countries. The Astana city in the Republic of Kazakhstan is a fast-growing agglomeration where air pollution is compounded by intensive construction and the use of coal for heating. The research is important for the development of urbanism in terms of ensuring the sustainable development of urban agglomerations, which are growing rapidly. Long memory in time series of concentrations of air pollutants (particulate matter PM10, PM2.5) from four stations in Astana using the fractal R/S analysis method was studied. The Hurst exponents for the studied stations are 0.723; 0.548; 0.442 and 0.462. In addition, the behavior of the Hurst exponent in dynamics is studied by the flow window method based on R/S analysis. As a result, it was found that the pollution indicators of one of the stations are characterized by the presence of long-term memory and the time series is persistent. According to the analysis of recordings from the second station, the series is defined as close to random, and for stations 3 and 4, anti-persistence is characteristic. The calculated Hurst exponent values explain the sharp increase in pollution levels in October 2021. The reason for the increase in polluting substances concentration in the air is the close location of thermal power plants to the city. The method of time series fractal analysis can be the ecological state indicator in the corresponding region. Persistent pollution time series can be used to predict the occurrence of a critical pollution level. One of the reasons for anti-persistence or the occurrence of a temporary contamination level may be the close location of the observation station to the source of contamination. The obtained results indicate that the fractal time series analysis method can be an indicator of the ecological state in the relevant region.
1. Introduction
According to the World Health Organization (WHO), air pollution is the external or internal environmental pollution by physical, chemical or biological agents that can change the atmosphere characteristics [1]. Common sources of pollution are motor vehicles, industrial facilities and burning of fossil fuels. There are a lot of other sources of pollution, including agricultural activities, waste disposal and landfill and mining activities.
One of the significant sources of pollution in developing economies is the intensive use of thermal power plants and coal-fired power plants. The thermal power plant operates based on a thermal motor and produces electrical energy by converting the chemical energy of the fuel during combustion into thermal energy and then into mechanical energy to rotate the electric generator. Coal-fired power plants generate electricity and generate heat during the heating season by cognominal fuel combustion. Carbon is known to be a strong pollutant. The burning of fossil fuels is a source of greenhouse gases, which may be a factor in climate change. However, since more than 30 years after the signing of the UN Framework Convention on Climate Change, the intensity of carbon emissions in the global energy system has decreased by less than 1%. Combustible fuels still prevail in global electricity production, while renewable energy accounts for only 8.2% of the total global volume. Total energy demand increased by 59%, which led to an increase in energy-related emissions to the highest record in 2021 [2]. Air pollution affects the general health of the population, causes respiratory, cardiovascular diseases, neurological disorders, negative consequences of pregnancy and may also be a cause of increased mortality in the population [2,3]. In addition to these diseases, there is evidence of increased mortality from type II diabetes due to increased air pollution [4]. The consequences are greater for children and pregnant women from climate change and air pollution caused by burning fuels. These consequences are significant and continue to grow [5].
Particulate matter, carbon monoxide, nitrogen dioxide, sulfur dioxide, etc. constitute a special danger to public health. In 2020, the impact of emissions of PM2.5 particles into the air caused 4.2 million deaths, which did not change compared to 2015. In addition, the average mortality rate per 100,000 population decreased by 5%. Furthermore, of these deaths, 80% were caused by anthropogenic emissions, 35% of which were directly related to the burning of combustible fuels. Deaths from coal burning decreased from 687,000 in 2015 to 561,000 in 2020 (by 18%) [2]. This is mainly due to strict air pollution control measures in China and the reduction of coal use in Europe [2]. Increased air pollution significantly affects the life quality of the population, especially in agglomerations with a large population. According to WHO [1], about 99% of the world’s population breathes air exceeding established pollution standards in at least one or more indicators. At the same time, middle- or low-income countries suffer more from this. Seven measurements based on the ISO 37120:2018 standard [6] were developed to assess the quality of life in cities [7]. They cover city services, the economy, cultural and recreational activities, urban transportation, social warmth, security and environmental well-being. The last indicator includes noise and air pollution, climate comfort, cleanliness and wastewater. The air pollution has a cumulative effect in large urban agglomerations due to the simultaneous action of several sources of pollution, in particular, the influence of developed transport infrastructure, emissions from coal-fired power plants, factories, etc. Therefore, the research aim is to research characteristics of pollutant emissions into the air of cities and to introduce systematic approaches to the monitoring of the atmospheric air pollution and air purification level, which are very relevant for urban planning and urban development. Achieving success in fulfilling these tasks might contribute to a reduction in the incidence rate and improve the life quality of the urban population.
The aim of this article is to study the long memory in time series of harmful substance concentrations recorded at four different stations within the city of Astana. To achieve this aim, the following tasks were set:
- To apply the method of air pollution time series fractal analysis for the Hurst exponent calculation and long-memory identification to further study the Hurst indicator behavior research in dynamics.
- To analyze the change in the level of pollution of harmful substances in Astana considering weather conditions and the location of potential sources of pollution by coal combustion products during the heating season.
2. Materials and Methods
2.1. Literature Review
The increase in air pollution in urban agglomerations is a complex problem, which is influenced by many factors. Each of the cities has its own characteristics (climatic, geographical, the presence of industrial production, the presence of transport hubs, etc.), which can affect the level of pollution. These features should be studied separately to ensure effective urban planning in the future. The purpose is to reduce the level of pollution in the city and improve the health and life quality of its residents. As already noted, the increase in the concentration of harmful substances in the air is a prerequisite for a wide range of diseases [2,3,4,8], which among other things entails an increased burden on the medical system of the state. Furthermore, in large cities consumption is constantly increasing with significant population growth, thus leading to increased pollution. Therefore, it is critically important to make efforts for the environmental situation improvement in the city. Moreover, in the case of cities that are growing it is recommended to immediately plan the placement of facilities that are potential pollutants away from the city, as well as to increase the use of renewable energy sources.
The problem of pollution is acute for large urban agglomerations and rapidly growing cities, for example, the capital of the Republic of Kazakhstan, Astana. According to the Bureau of National Statistics [9], the Astana city population for 1 May 2024 was 1458 thousand people. The balance of migration and natural population growth for the city of Astana is positive. The annual population growth of the city is more than 4%. Taking this into account, the city of Astana is constantly increasing the consumption of electricity and water resources including through intensive construction. The consequence of this is an increase in emissions of harmful substances. Another negative factor affecting the pollution level in the city is that most heating systems in the city operate by burning coal.
This leads to excessive concentrations of particulate matter (PM2.5) in the air during the heating season. And since Astana is in a sharply continental climate zone and is the second coldest capital in the world with an average annual temperature of 3.5 °C, the heating season period is significantly extended.
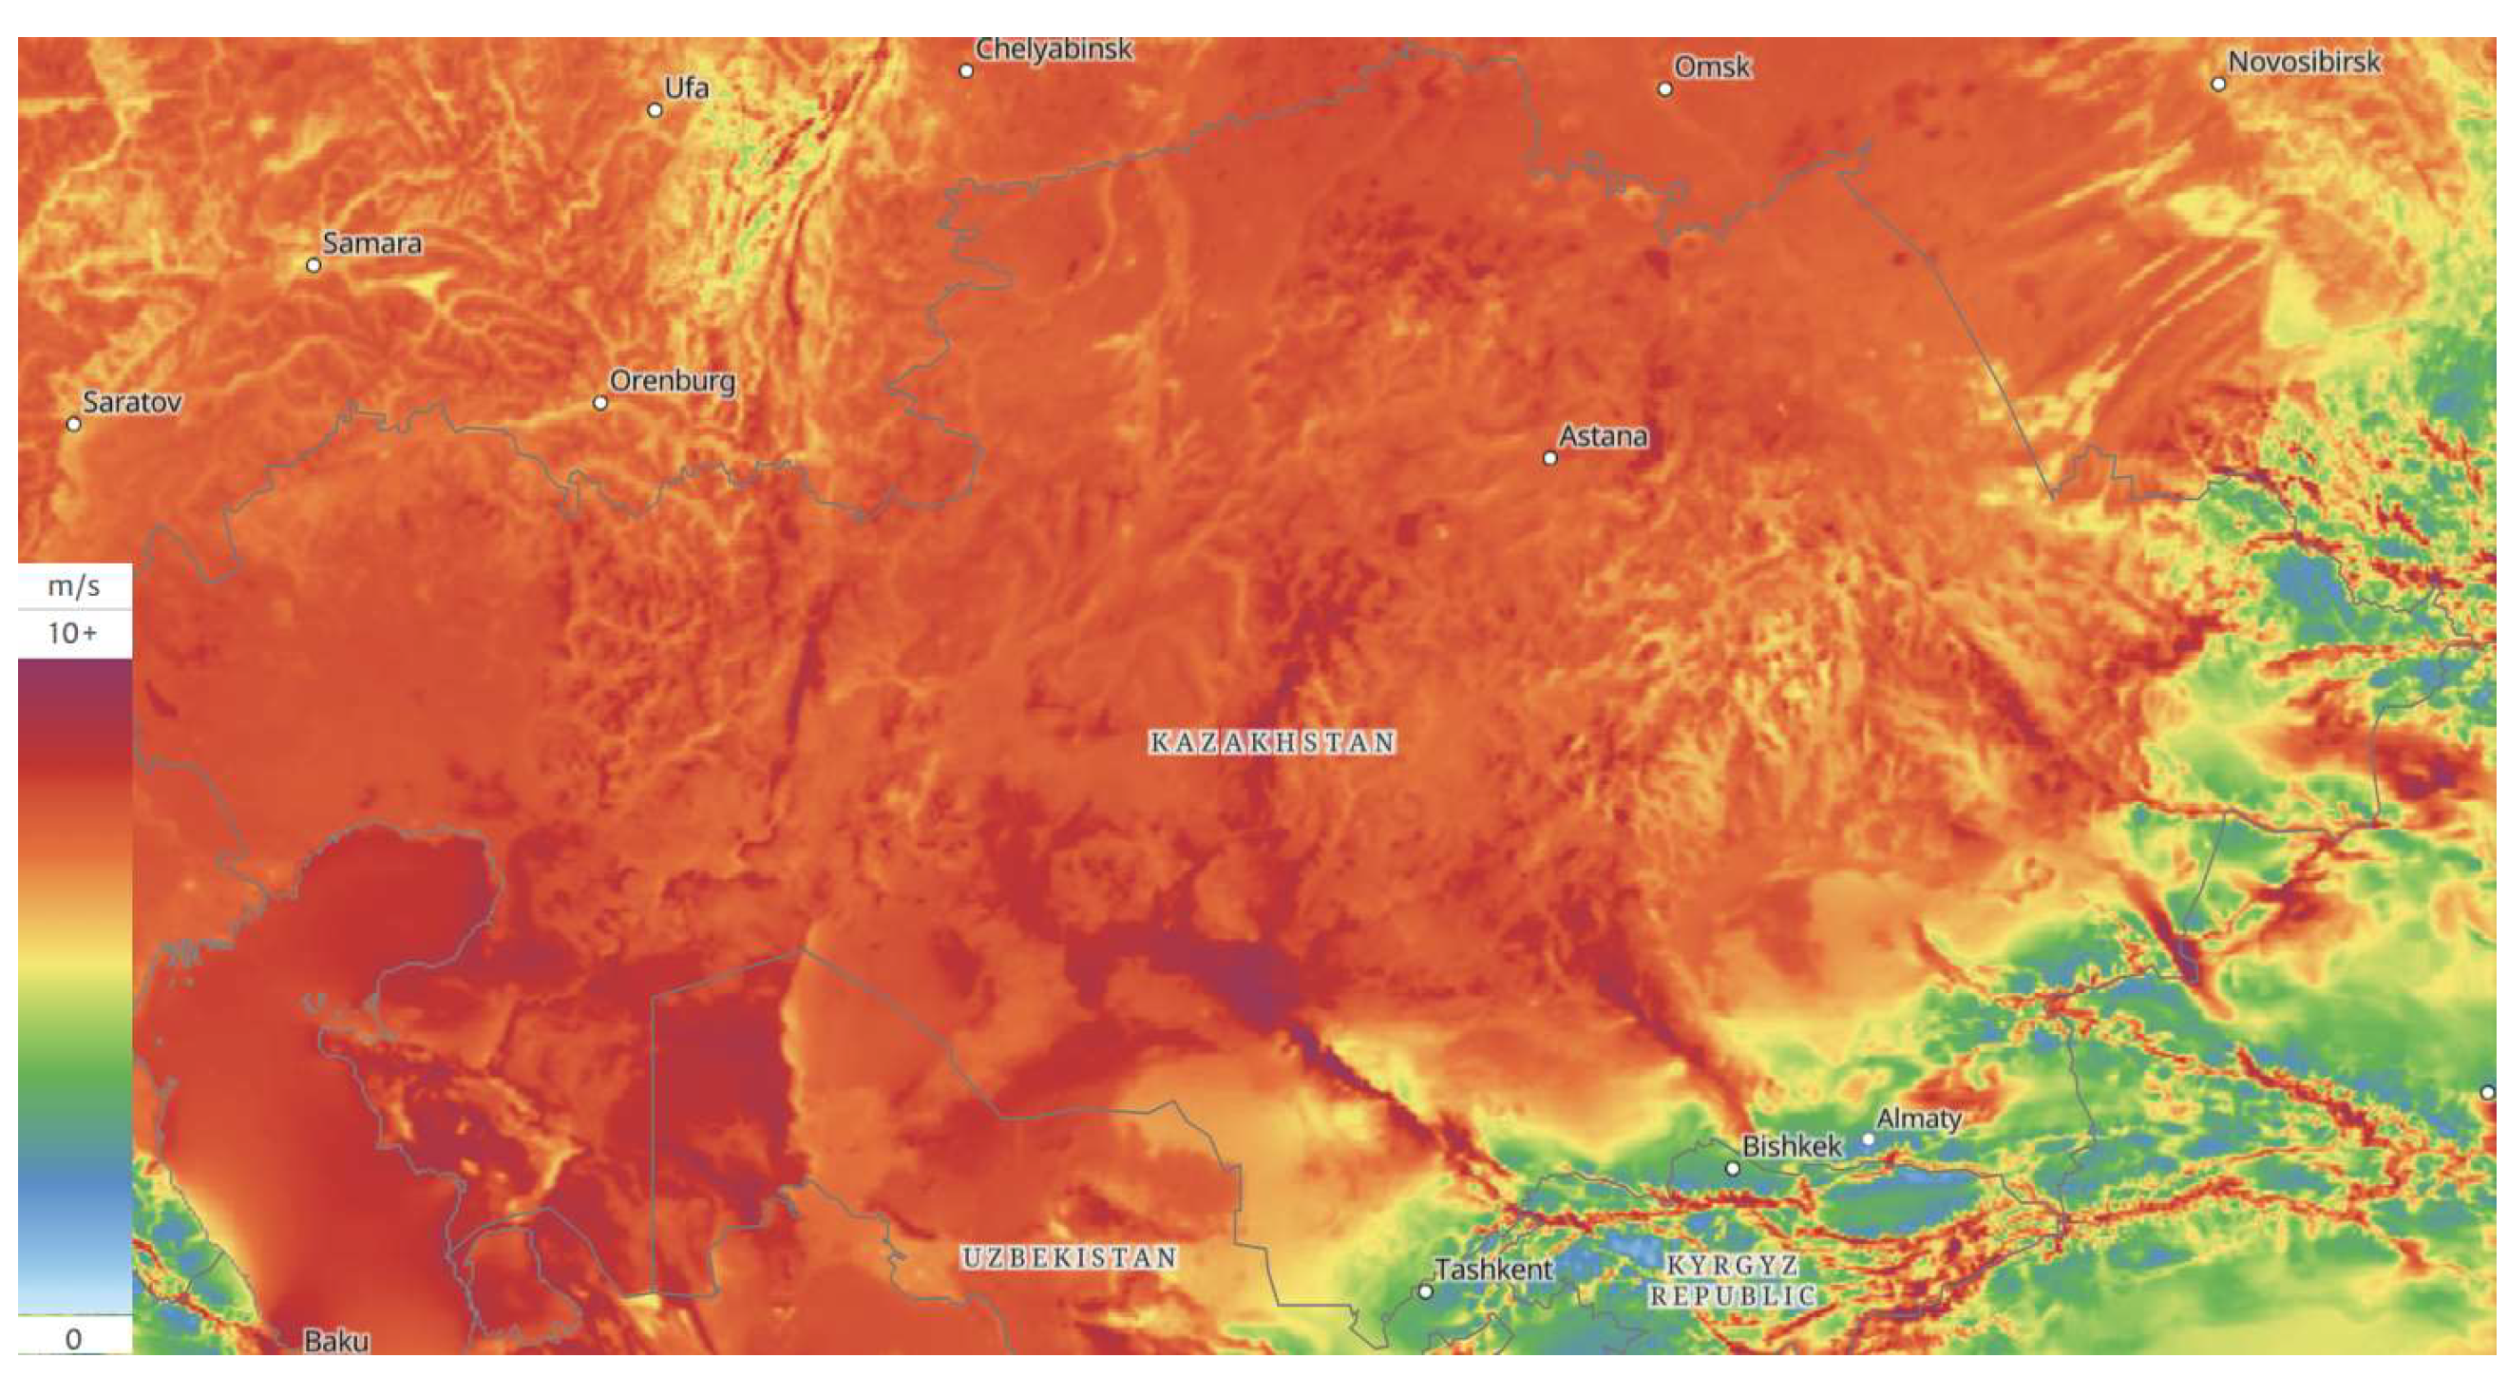
The peculiarities of the city of Astana are that it is under the influence of a sharply continental climate zone with cold winters. Despite the increased average annual wind speed, which naturally reduces the concentration of harmful substances in the air (the average annual wind speed in Astana ranges from 5 to 7 m/s [10]) (see Figure 1), the level of pollution in winter significantly exceeds the WHO normative indicators. This may be explained by the common coal use for energy systems of the city during the heating season. Since the centralized heating season in the city lasts for averagely almost seven months a year, the increased concentration of particulate matter and combustion products in the air lasts most of the year. At the same time, other factors that affect pollution in this city are not considered given the annual population growth of more than 4% on average. According to the study [11], most sources of pollution in Astana are stationary. The average annual air quality level is maintained at 53 points, in summer an average of 35 points [12] and this meets the requirements of WHO [13].
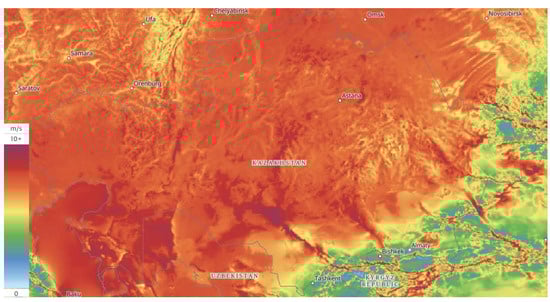
Figure 1.
The average annual wind speed at an altitude of 100 m. in the Republic of Kazakhstan according to Global Wind Atlas [10].
In general, according to the World Bank [14], 75% of the heating of the Republic of Kazakhstan is due to coal combustion. This includes the provision of central heating systems and coal-based electricity generation. As a result, the Republic of Kazakhstan has a high level of air pollution—about 22 micrograms/m3 of PM2.5 particulate matter, which is much higher than the WHO recommended level (5 micrograms/m3).
One of the solutions that will improve the air quality in the city is the biotechnological filter systems concept use. These systems use some types of mosses, which purify the air and contribute to the production of oxygen. In particular, the paper [15] describes the concept of creating a moss-based biotechnological purification filters network as the part of the Smart City. The system was installed and is being tested in Astana on the basis of Astana IT University. The model was developed in [16] to identify the best locations for biotechnological purification filters by solving a discrete optimization problem. This model enabled the prediction of the air quality index for a particular area, thereby ensuring the efficient placement of these biotechnological systems to enhance air quality and ensure effective monitoring [17]. However, considering the nonlinearity of the pollution spread and the Astana peculiarities, it is necessary to analyze the structure of such time series and investigate the presence of long-term memory before using methods for predicting time series of pollution levels. This can be done using fractal analysis methods, in particular Rescaled Range Analysis (R/S analysis) or Detrended Fluctuation Analysis (DFA).
The long-memory feature in the air pollutant series was used by various authors in their research. In particular, Ref. [18] analyzed the dynamic behavior of the relationship between atmospheric carbon emissions and the Organization for Economic Cooperation and Development (OECD) industrial production index (IPI) in the short and long term by applying multifractal techniques. The growth of urbanization and industrialization damages the natural balance and contributes to air pollution, therefore, the MF-DFA method was used in [19] to investigate whether the time series of polluted air has multiple characteristics. The study was carried out on the example of Zhengzhou City (China). Logistic graphs of fluctuation functions, the generalized Hurst index, the Renyi index and the spectrum of singularities indicate the multifractality of the time ranges of air quality in Zhengzhou. The study [20] analyzed data from long-term observations of the variability of particulate matter (PM2.5, PM10), gaseous pollutants (CO, NO2, NOX, SO2 and O3) and meteorological factors at 412 stationary monitoring stations from January 2008 to December 2018 in Germany. According to the analysis of the Hurst index, the trend of atmospheric pollution in Germany was persistent during the study period. Similar studies have also been conducted in other countries. In [21], the behavior of air quality time series in 50 US states was analyzed by studying the statistical properties of data sets on particulate matter (PM10 and PM2.5). In the article [21], a long-memory fractionally integrated framework is used for analysis. In general, the study showed mixed results by state. In the western states, there is a higher degree of persistence compared with the eastern states, where there is a general downward trend in the Hurst index. In [22], R/S analysis was used to establish the long-term dependence of air pollutants in Mexico City of Mexico. Although this property was not homogeneous over time. The article [23] also uses R/S analysis to establish the chaos and long-term memory of PM10 particulate emissions that were recorded in Athens, Greece. Other studies have used different nonparametric methods such as detrended fluctuation analysis (DFA) [24] and multifractal detrended fluctuation analysis (MF-DFA) [25] to estimate the Hurst parameter. In the case of short time series, the DFA method is used to analyze time series of air pollution [26,27]. All the described methods are based on long-term memory and are related, therefore they can be used to analyze time series of air pollution considering the corresponding empirical characteristics.
Therefore, the application of the fractal analysis of air pollution time series to establish long-term memory and identify the persistence of emissions of harmful substances into the air is an urgent task, especially in urban agglomerations.
2.2. Experimental Methods and Area of Study
Astana is an urban agglomeration with more than 1.4 million inhabitants [9]. The area of the city is 797.33 km2. The city is located on a steppe plain in a sharply continental climate, which is characterized by dry summers and cold long winters with strong winds. The geographical location of the city has a positive effect on the level of air pollution in the city. This is reasoned by wind masses mixing of the harmful substances concentration in the air to values that are normal according to WHO standards. However, during the cold season, which lasts here for almost 7 months the pollution level increases due to the operation of coal-fired power plants to provide centralized heating and the use of coal to heat private homes of the city residents.
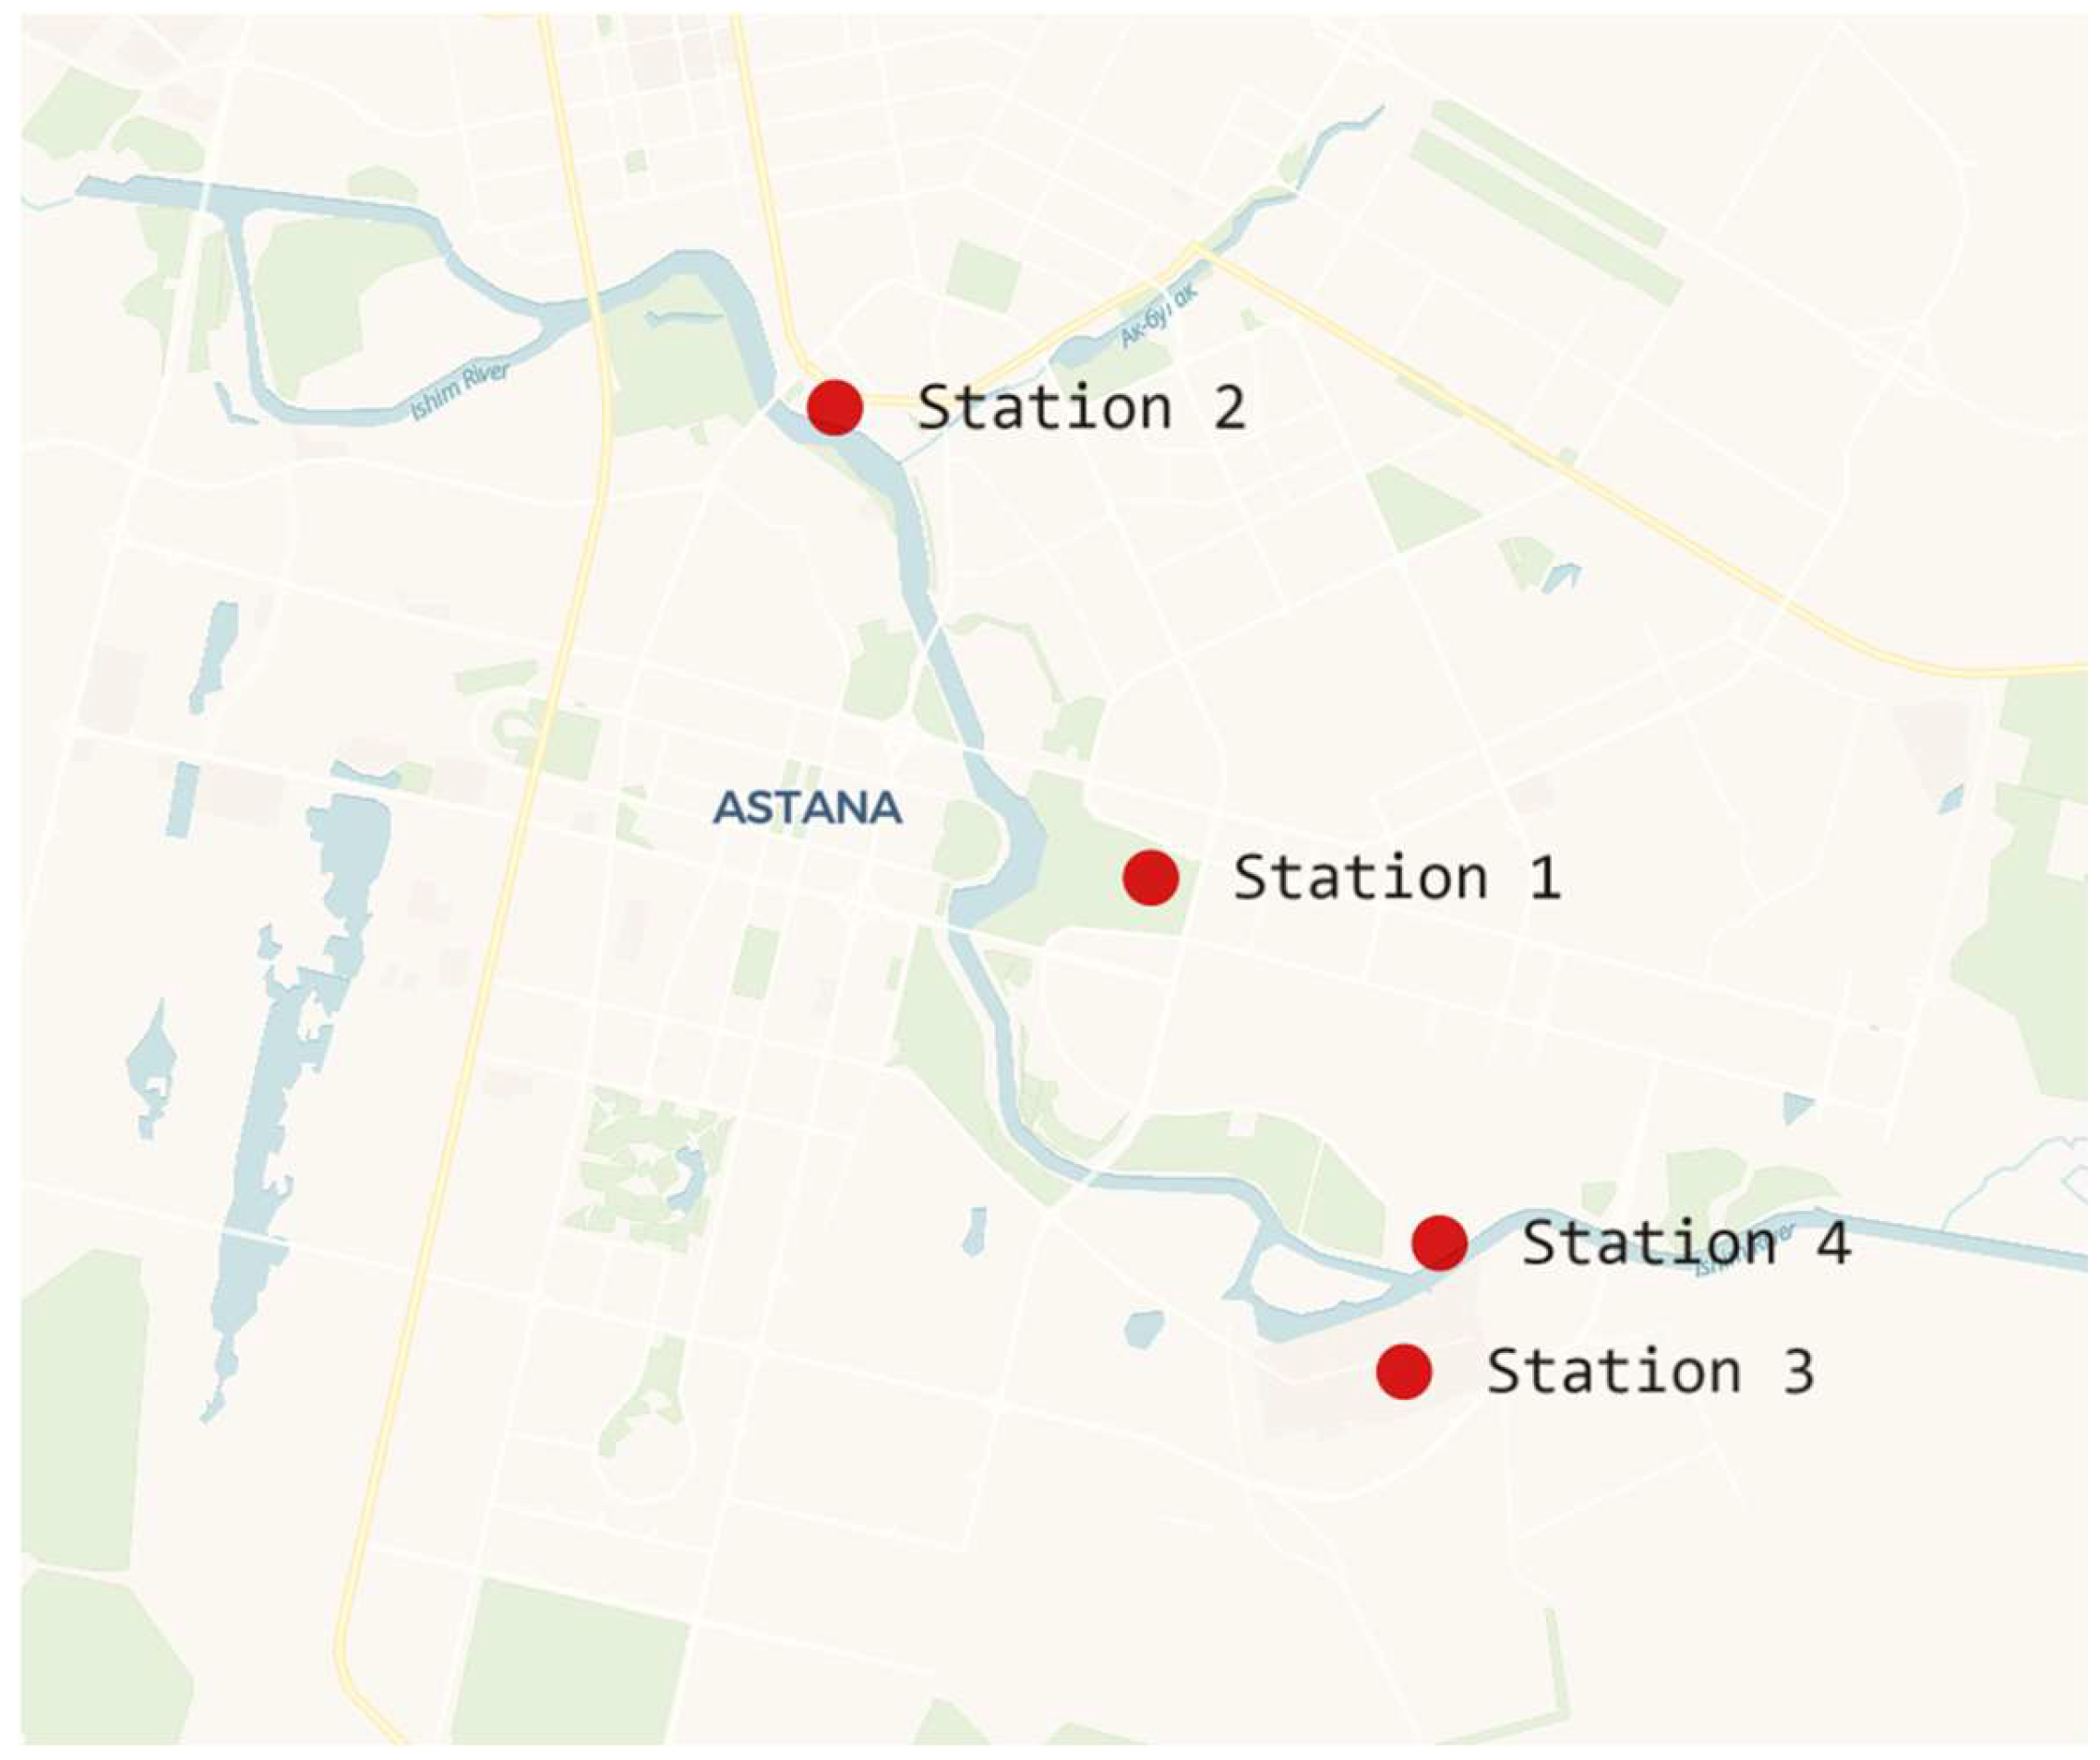
To study the level of air pollution in Astana, data on the concentration of PM10 and PM2.5 particulate matter in the air were analyzed within the framework of a state project with the participation of Astana IT University (Astana, Republic of Kazakhstan), Toraygyrov University (Pavlodar, Republic of Kazakhstan) and private companies LLP Promanalit (Pavlodar, Republic of Kazakhstan), Prometeo Chain System KZ Ltd. (Astana, Republic of Kazakhstan). (see the Funding Section). Stations for measuring pollution levels were in four locations within the city of Astana (see Figure 2). The automatic analyzers used for measurements provide data four times a day at 1:00 a.m., 7:00 a.m., 1:00 p.m., 7:00 p.m. Based on this data with the help of microprocessors located inside each automatic analyzer, time series of pollution are formed. All values are transmitted to the central station, where they are processed and stored. The data selected for analysis in this paper relate to the period from 1 June 2021 to 30 July 2022.
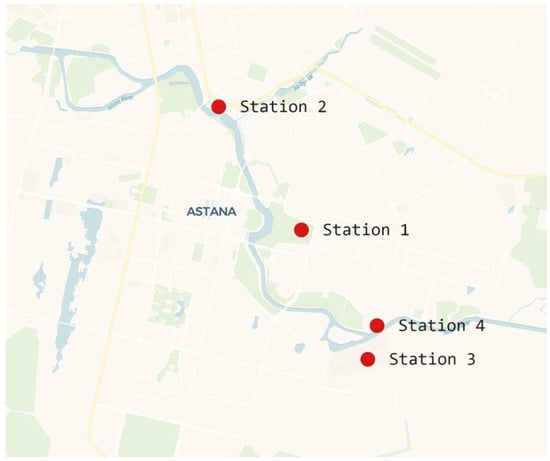
Figure 2.
Placement of stations for measuring the level of air pollution in the city of Astana.
2.3. R/S Analysis Method
The main application of the fractal analysis method of air pollution time series is to calculate the Hurst exponent and identify long memory in the time series. If there is enough data to analyze, R/S analysis can be used for this. The time series of environmental pollution Q can be defined as a discrete time series. Data on the pollution level are recorded at the relevant stations at time points , where is the initial moment of time, then
Based on the time series Q, a family of cumulative time series is constructed in the following form:
For each of the time series , the arithmetic mean can be calculated using the following formula:
where —arithmetic mean for time series .
The deviation can be calculated by the following formula:
From here, range can be found by the following formula:
then the standard deviation is determined by the following formula:
Through the relation
Then we can construct the equation
from where H is the Hurst exponent, as a coefficient for an independent variable, which is determined by the least squares method.
By calculating the Hurst index of the time series of environmental pollution parameters, it is possible to determine the presence of long-term memory in the time series and the presence of quasi-cyclic components. The latter can be identified based on the analysis of V statistics. The increase in these statistics with a higher number of observations suggests the persistence of the time series, while a stabilization or decrease indicates a growing influence of random factors. A sharp change in the ascending and descending trend may indicate the transformation of a series into white noise, which may be characteristic of a critical situation in changing the level of environmental pollution:
where is the value V of the statistics recorded for the time series .
The scheme of the results interpretation can be presented as follows:
- If the Hurst index is a time series , then this may indicate the presence of long-term memory or persistent character in the series. In the context of environmental pollution, this may mean that high levels of pollution tend to remain at high levels for a long time or to recover again after periods of decrease. The tendency to change the level of pollution remains. If we talk about forecasting, the higher the value of the Hurst indicator, the more likely it is that the current trend will continue in the future . At the same time, the theoretical value of the threshold for identifying the boundary between random and persistent series is determined by the number of levels of the series , which are analyzed according to the formula [28,29]:
- 2.
- If the value of the Hurst index is , then the time series is random. In the context of time series of environmental pollution parameters, this may mean that the pollution level in a certain area is very unstable and is associated with emissions of pollutants abnormally in various concentrations, which is not regulated. On the other hand, it means a state of emergency or an accident, if before that the series had a clearly defined tendency to rise or fall. If , then the time series is ergodic. In the context of environmental pollution, this may mean that pollution tends to decrease temporarily after certain peaks or high values.
The construction of the Hurst indicator for a time series of environmental pollution parameters in dynamics allows us to analyze how the structure of several pollution levels in the region changes and quickly react to possible deviations from threshold values. This is very important for building environmental pollution monitoring systems. This is especially true in urban agglomerations, where a sharp increase in the level of air pollution above the norm can lead to severe consequences for city residents.
Then, the time series family is built on the time series basis
where
then a time series of Hurst indicators for can be built and will have the following form:
then, if such a time series changes above the level , then most likely the pollution situation is stable or a decrease and increase in the pollution level is recorded, but the situation is predictable. To predict the level of pollution, the chosen methods should have a strong trend component. This is important for the effective construction of an environmental monitoring system. If the values of such a time series change below the level , then it may indicate the occurrence of a critical situation or that the pollution level is changing unstably. Also, if the values of the time series were above the threshold value at first , then they started to decrease and fell below this level, what may mean an increased influence of random factors on the process. This may mean possible critical situations with emissions, which should be promptly responded to.
The described method of fractal analysis of time series of environmental pollution parameters and the method of analyzing the Hurst indicator in dynamics provides important statistical estimates that can help in the development of forecasting models and the creation of an effective environmental monitoring system.
3. Results
3.1. Collection of Data
Time series of pollution levels were collected at four stations within the city of Astana (Republic of Kazakhstan) from 1 June 2021 to 30 July 2022 to analyze the air pollution level in Astana and identify long-term memory. Data were recorded four times a day at 1:00 a.m., 7:00 a.m., 1:00 p.m. and 7:00 p.m. The locations of the stations are shown in Figure 2. Three of the four stations are located on the right bank of the Ishim River, and one station is on the left bank. Indicators were recorded at each station every six hours for main indicators: particulate matter (PM10, PM2.5), sulfur dioxide, carbon oxide, nitrogen dioxide, hydrogen fluoride, benzopyrene, sulfates, nitrogen oxide, benzene, ethylbenzene, chlorobenzene, paraxylene, metaxylene, cumene, orthaxylene, cadmium (Cd), Copper (Su), Zinc (Zn), Chromium (6+) (Cr), Arsenic (As) and Benzapyrene. Since the vast majority of the time series of these indicators for stations are close to zero, a time series of suspended substances containing combined PM10 and PM2.5 particulate matter was selected for the study.
The dataset of indicators in CSV format can be downloaded from the Supplementary Materials. Table 1 shows descriptive statistics of the time series data.

Table 1.
Descriptive statistics of pollution time series.
The sliding window of one calendar month in length, 120 points, was used. The Pandas libraries rolling() method was used to implement fractal analysis in the time series processing. Table 2 shows descriptive statistics of the series data after smoothing.
Table 2.
Descriptive statistics of time series of pollution after smoothing.
The data smoothing made it possible to reduce the variance and span of the time series, as well as to avoid the problem of missing data.
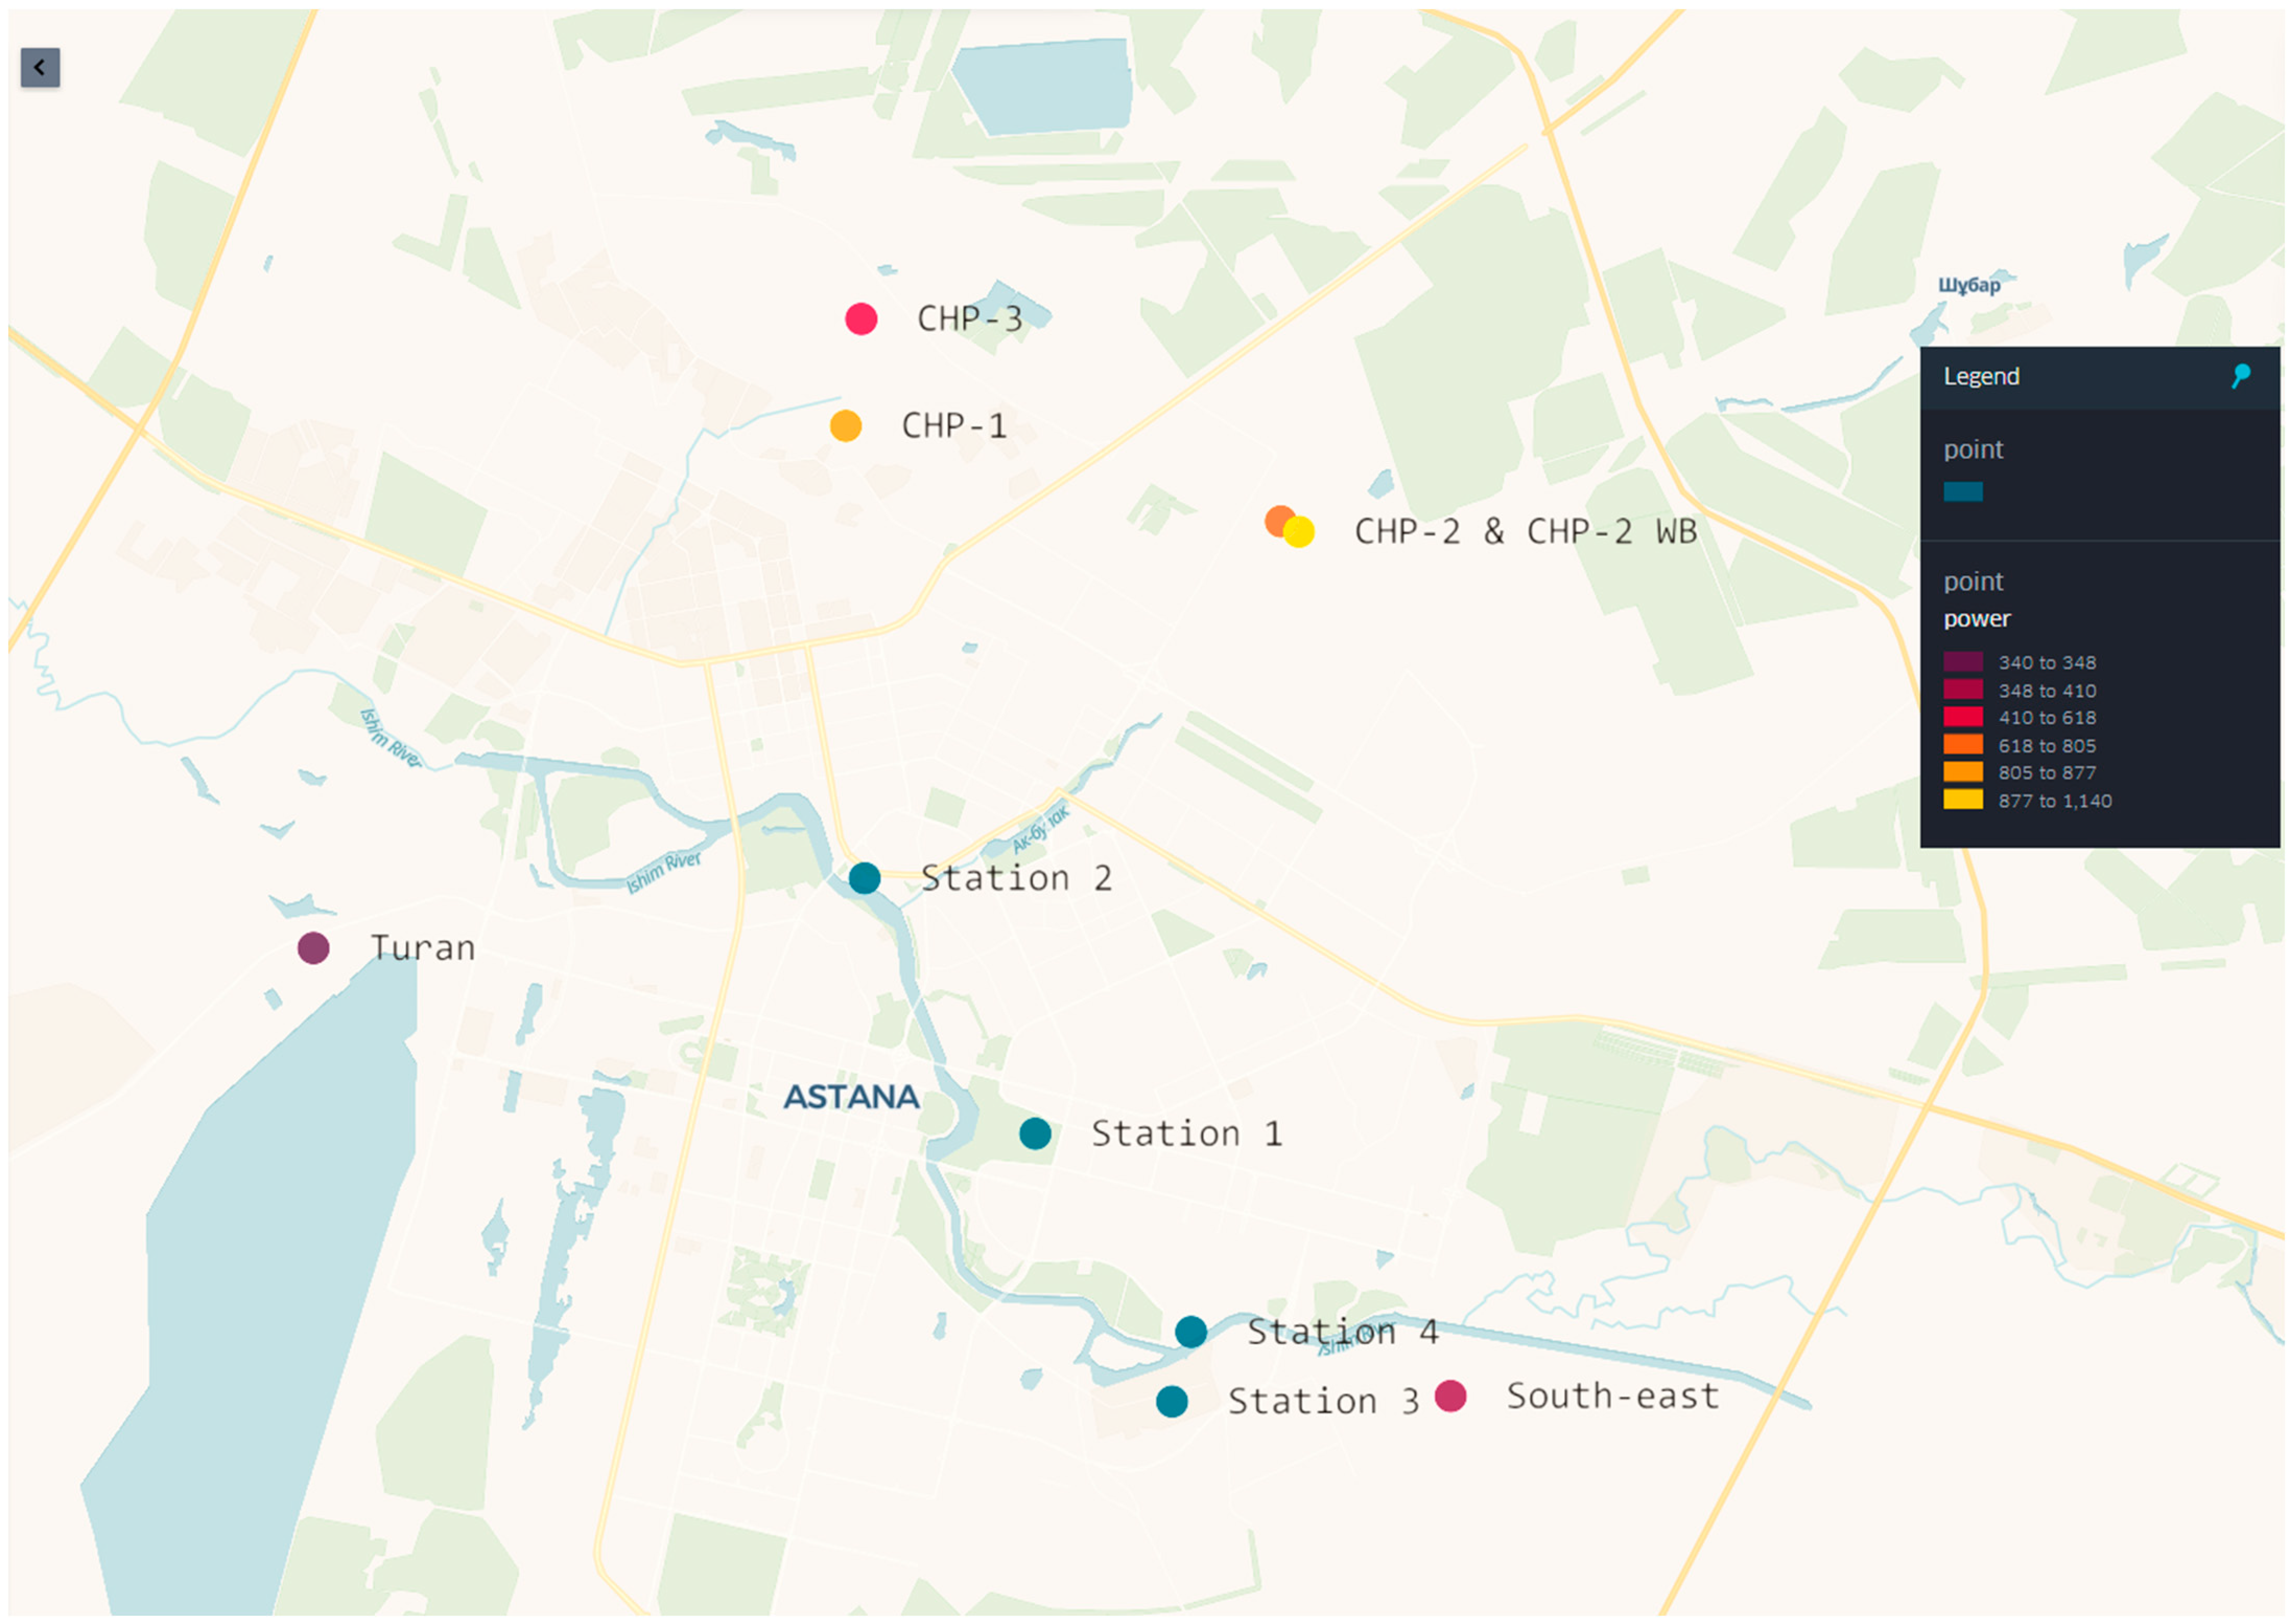
The information was collected on the location and operation of thermal power plants in Astana (see Figure 3) for an understanding of such a sharp PM10 and PM2.5 particulate matter emission nature. As it turned out, thermal power plants are located closer to stations 2, as well as 3 and 4. Therefore, the slow increase in the pollution level for the time series, which corresponds to station 1, is generally explained by the distance from the source of pollution. Table 3 shows the maximum capacity of thermal power plants and the distance between air quality monitoring stations and thermal power plants.
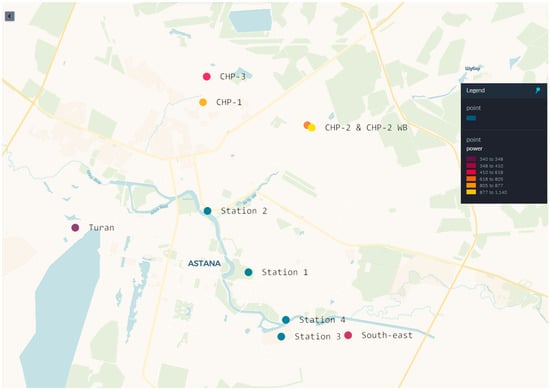
Figure 3.
Placement of air pollution monitoring stations and thermal power plants.
Table 3.
Distances between observation stations and thermal power plants.
Based on the R/S analysis, the Hurst index was calculated for each time series and the presence of long-term memory was investigated. Moreover, with consideration of the pollution specifics for this city, information was collected on the location of thermal power plants and a map of heating networks was analyzed.
3.2. The Results of Fractal Analysis of Air Pollution Time Series in the City of Astan
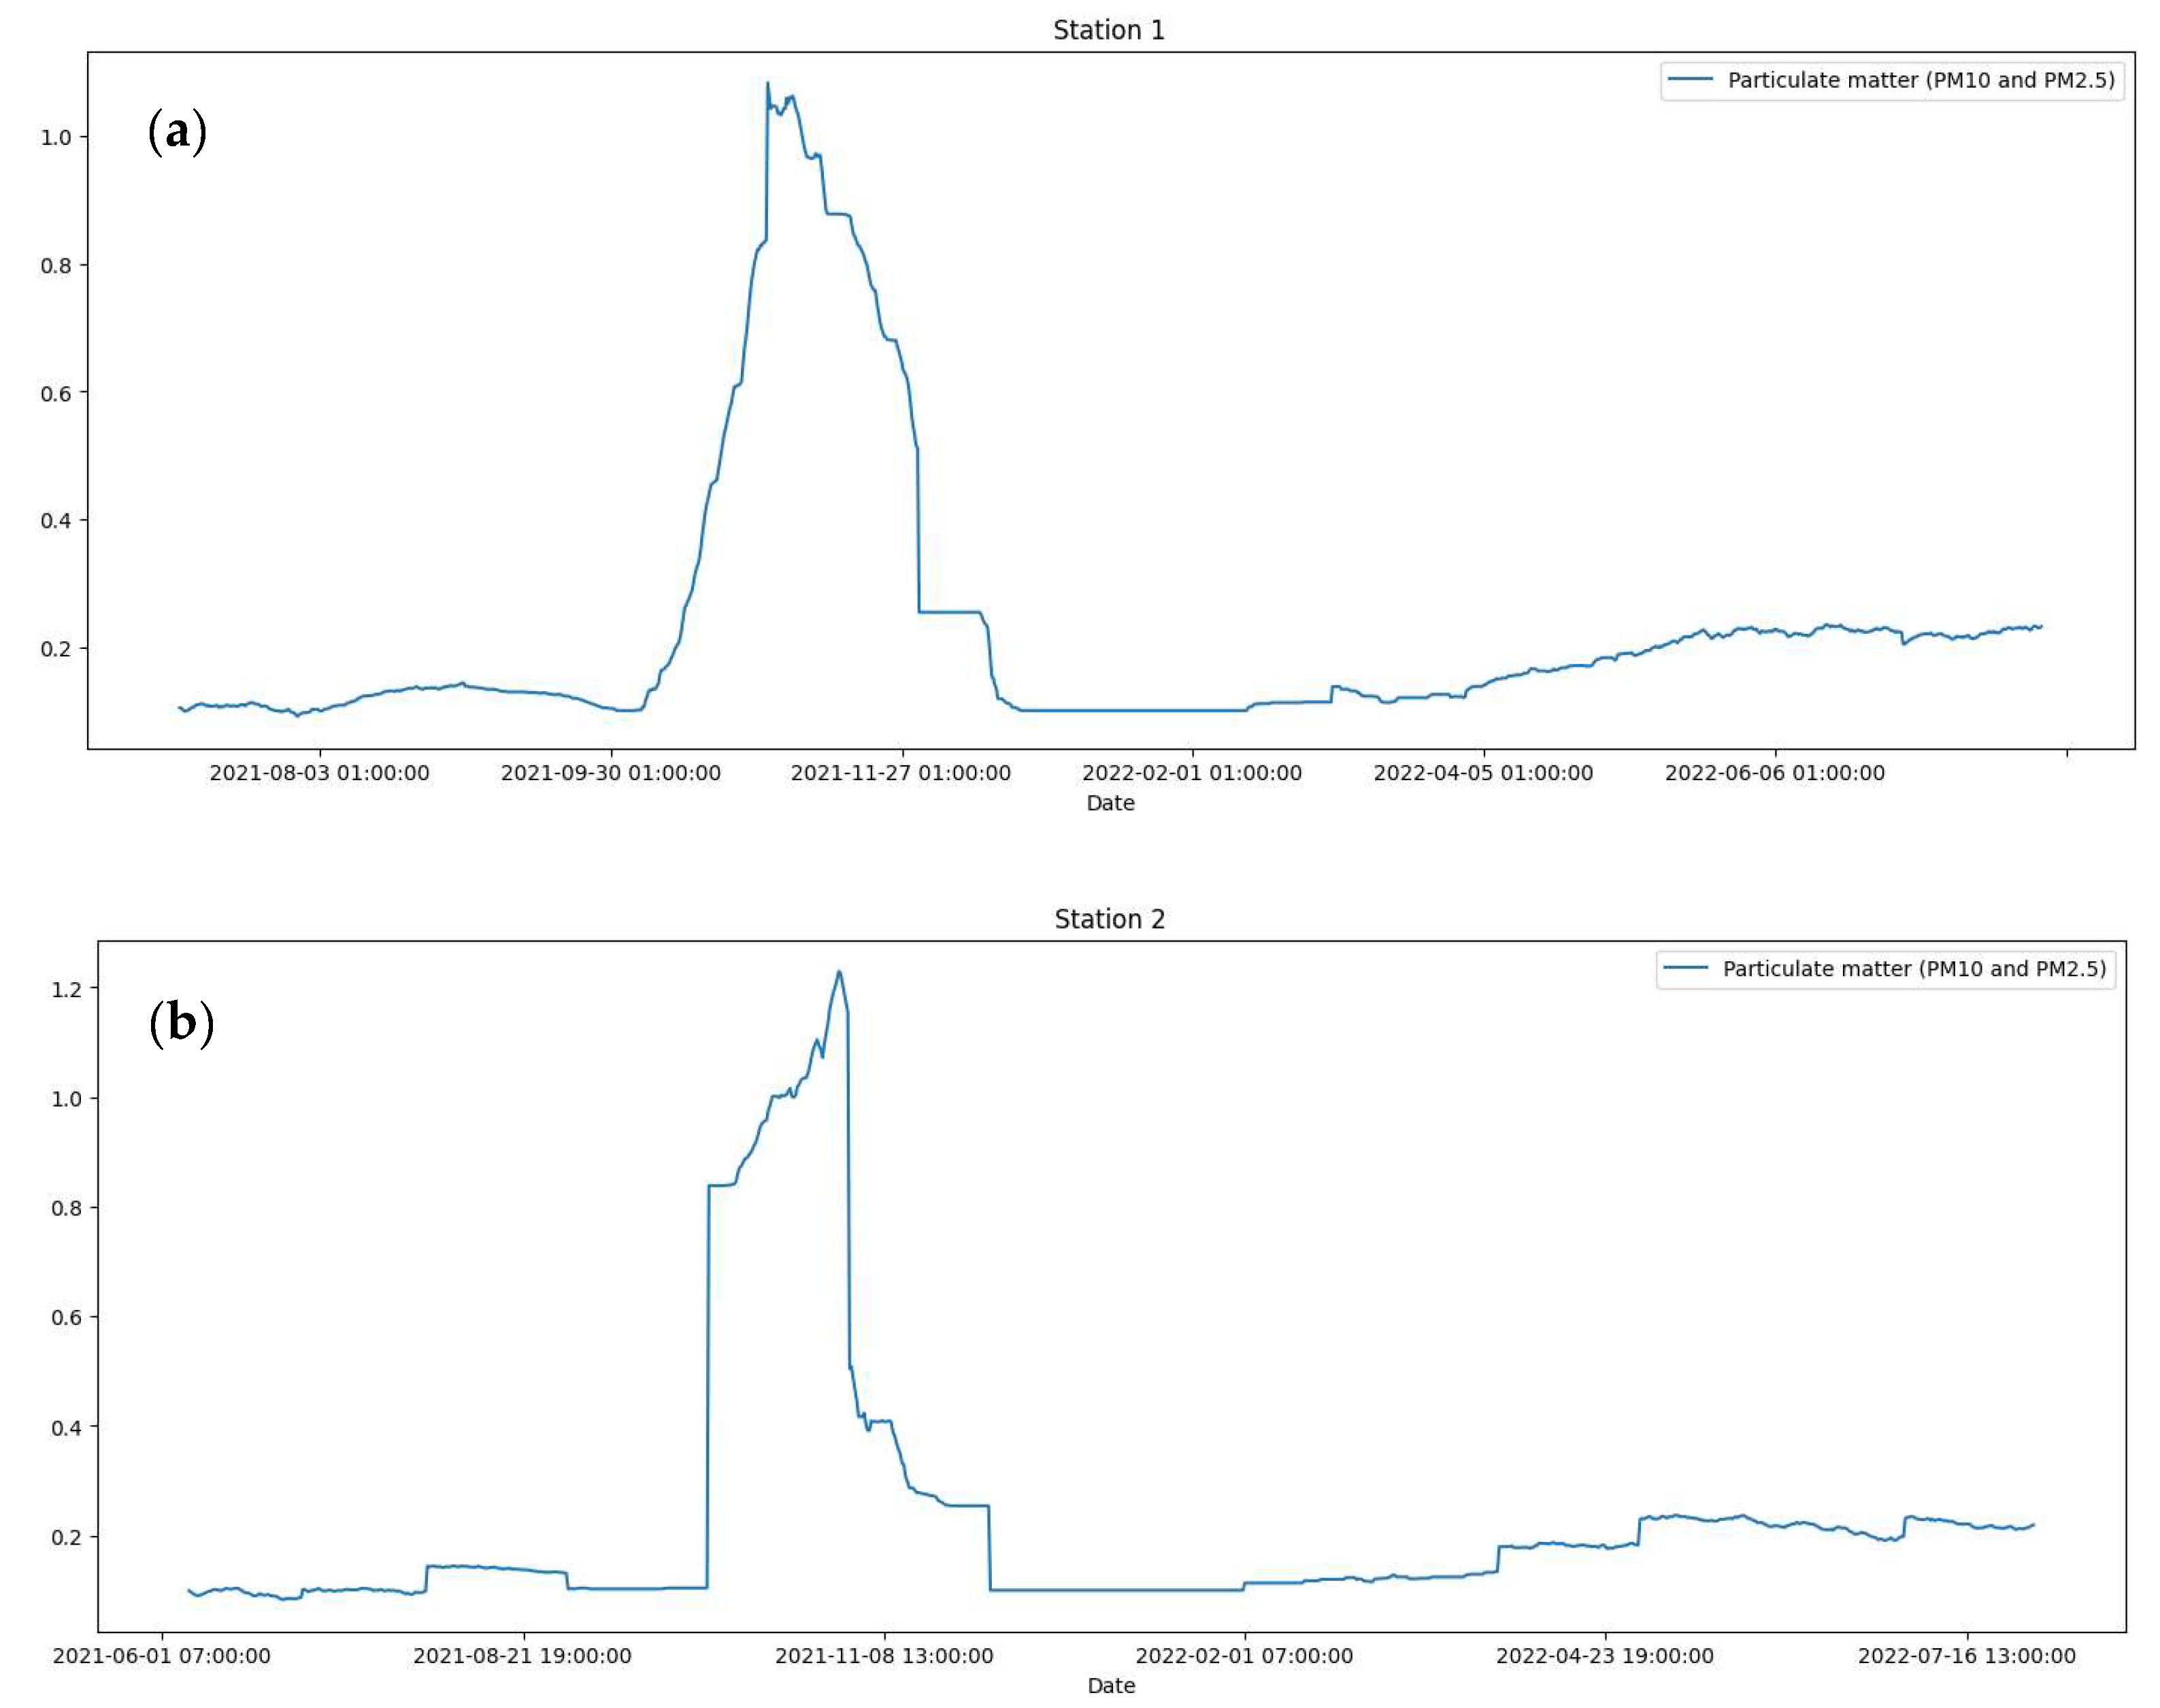
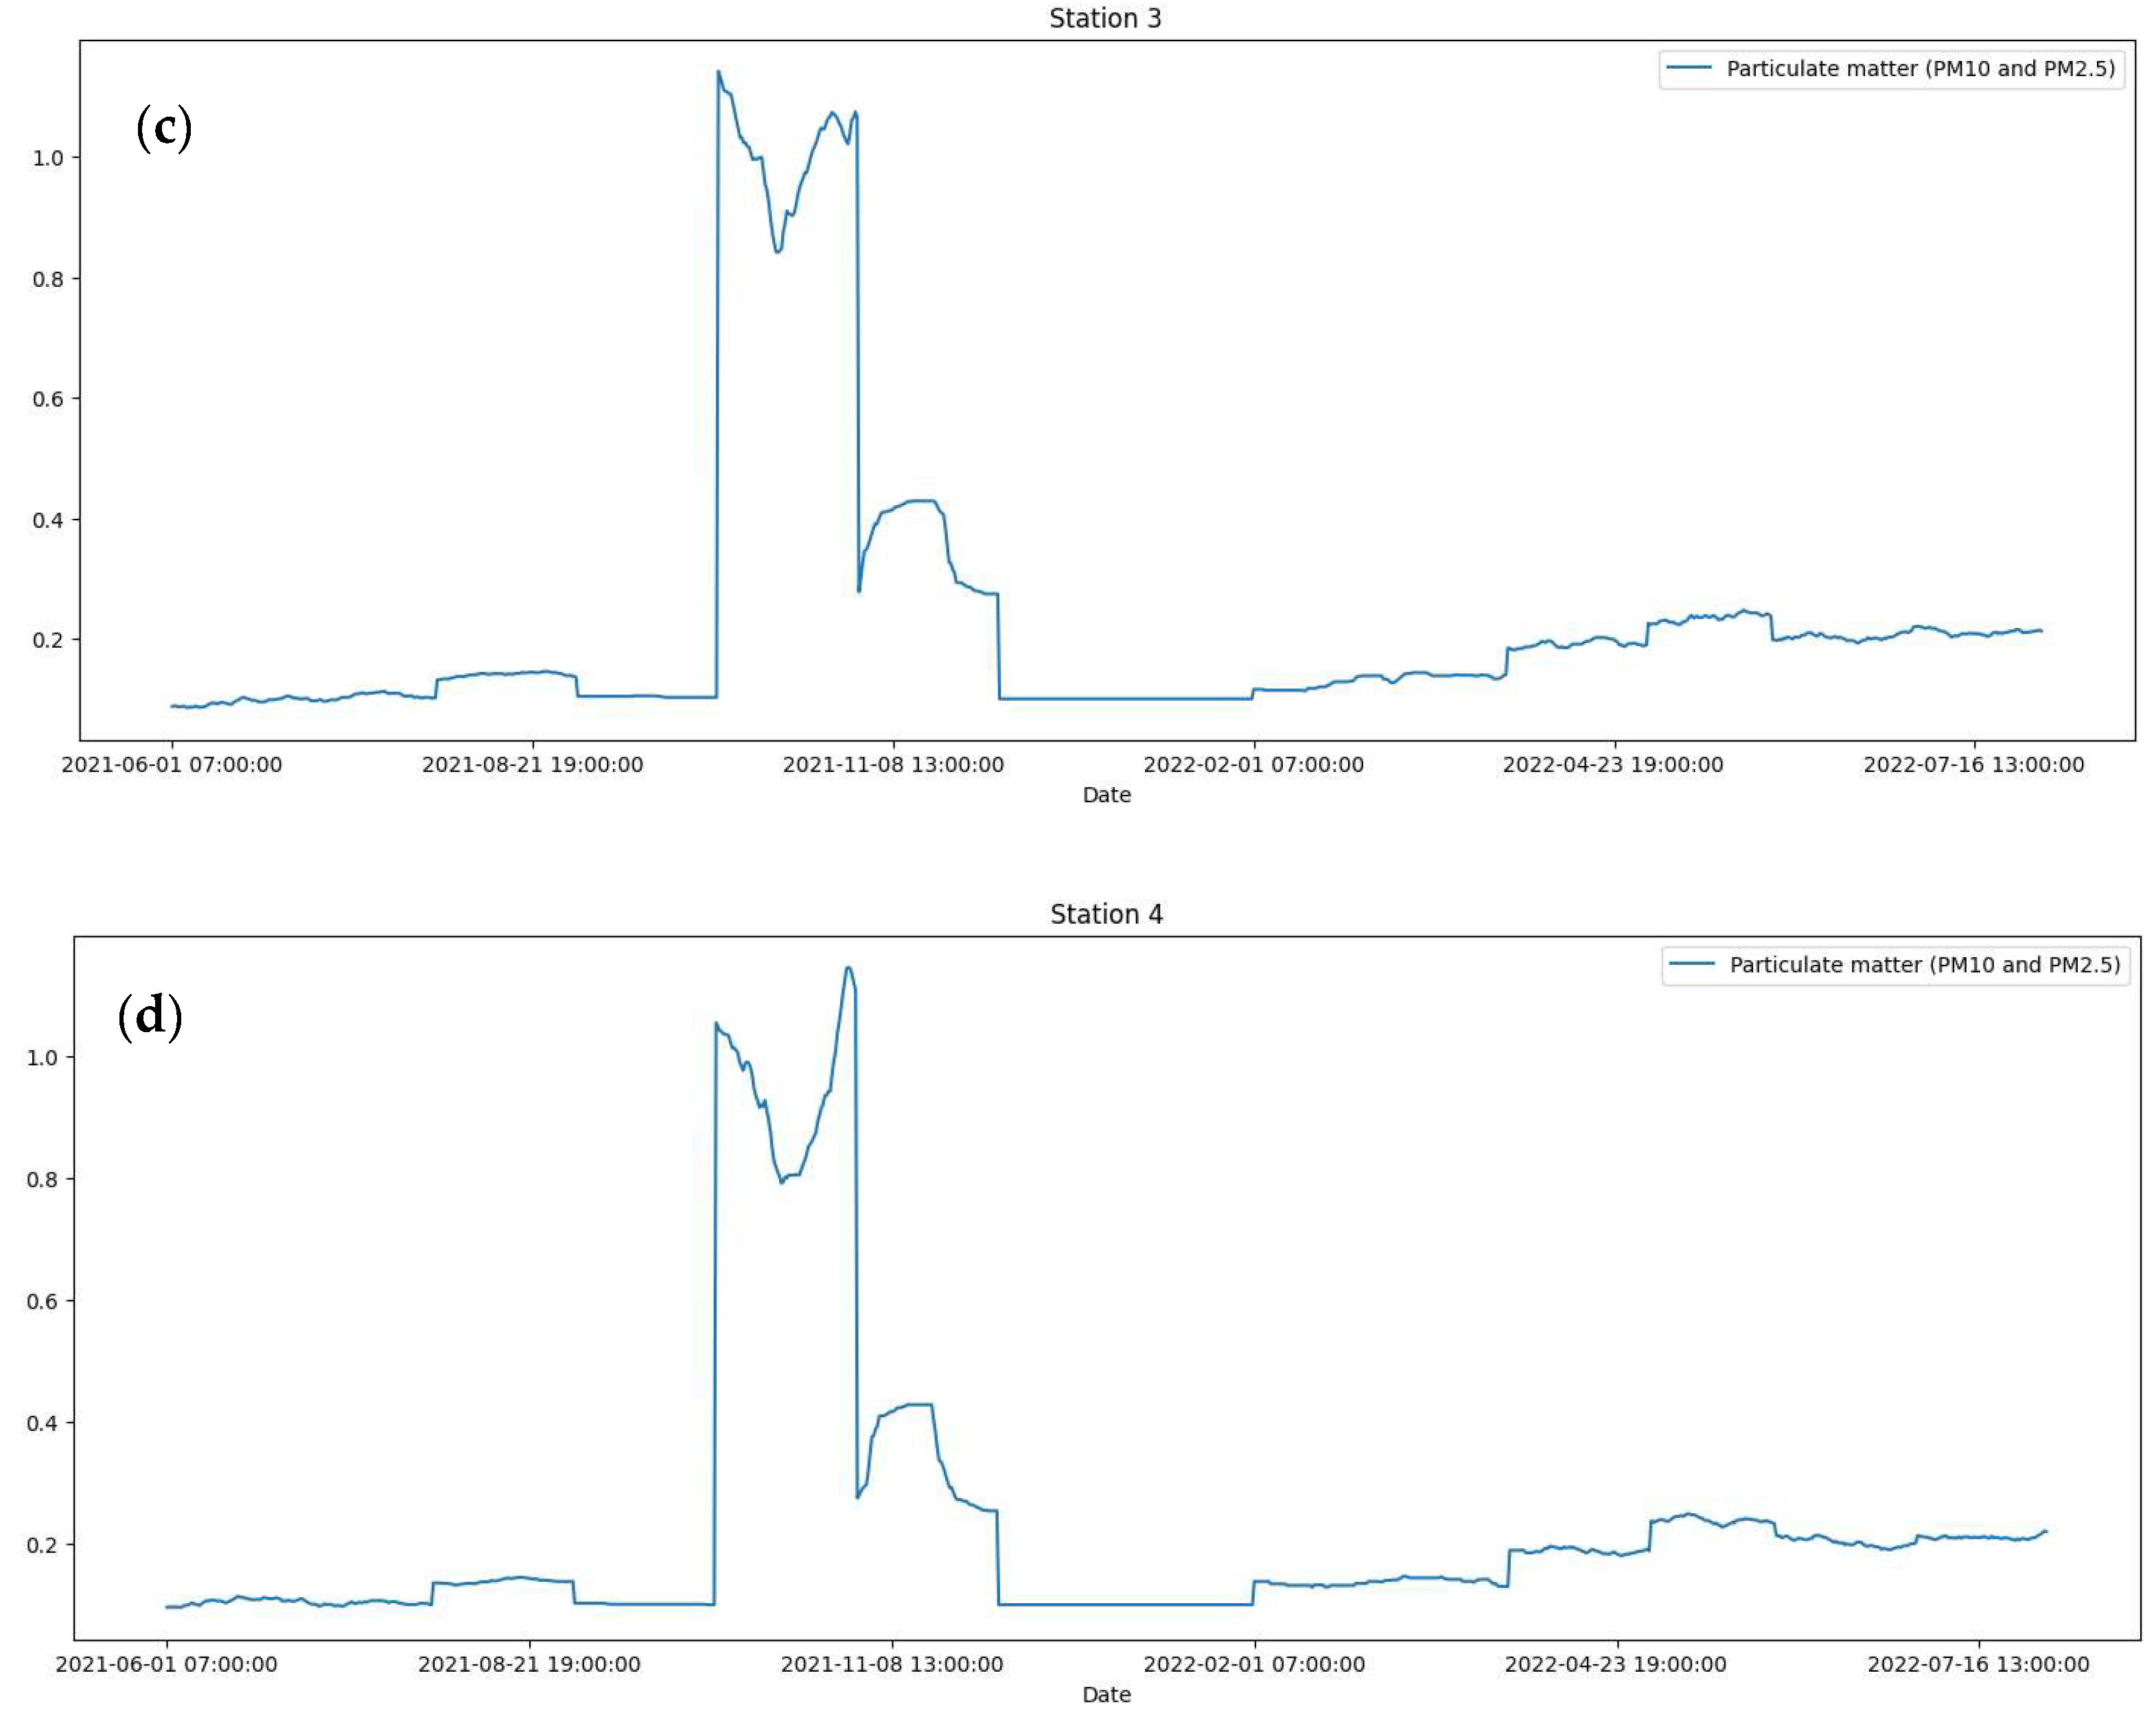
The method of fractal analysis of the collected air pollution time series within the city of Astana was applied at four stations. The method made the Hurst exponents for four time series calculations and the presence of long-term memory identification for the first time series (station 1) possible. Figure 4 shows data on particulate matters (PM10, PM2.5) for the established time period from 1 June 2021 to 30 July 2022 for Stations 1–4, respectively. The data were recorded every six hours.
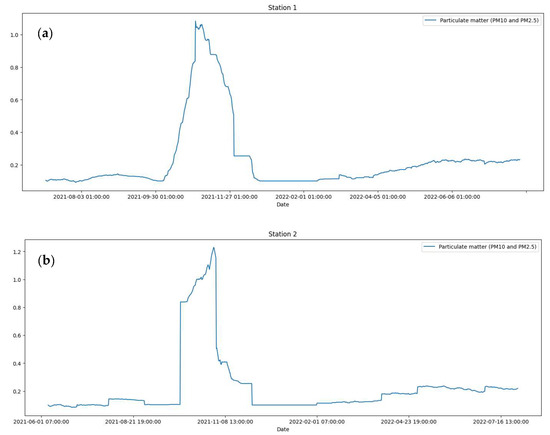
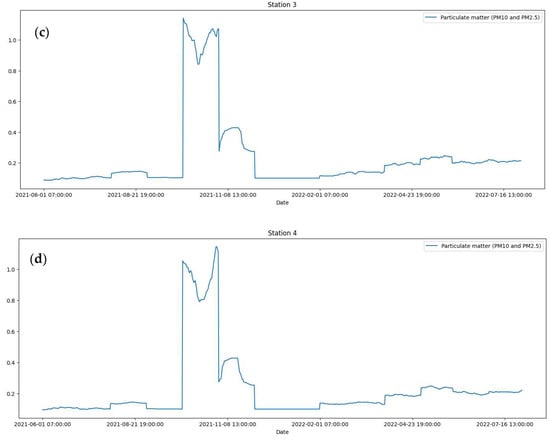
Figure 4.
Time series of PM10 and PM2.5 particulate pollution for the period from 1 June 2021 to 30 July 2022: (a) for station 1, (b) for station 2, (c) for station 3, (d) for station 4.
As can be seen from Figure 4, since the end of September 2021, there has been a sharp increase in the level of particulate pollution. This trend is observed until December 2021 and then stabilizes. A sharp increase in the level of pollution is observed for all four time series such a pollution level was recorded at all four observation stations. However, for the time series reflecting the pollution level at station 1, the growth is less sharp with one maximum peak. For the time series of pollution from station 2, a sharp increase with one peak is recorded. The time series for station 3 and 4 are similar and have two peaks. For these series, the stabilization of the pollution level is characterized by a repeated increase in the concentration of particulate matter in the air for a short period in November 2021. Whereas for time series from stations 1 and 2 this increase does not occur. The pollution level is gradually decreasing and reaches normal values in January 2021. For all series, there is also a certain increase in the pollution level in May–July 2022, but it does not exceed the standards established by WHO.
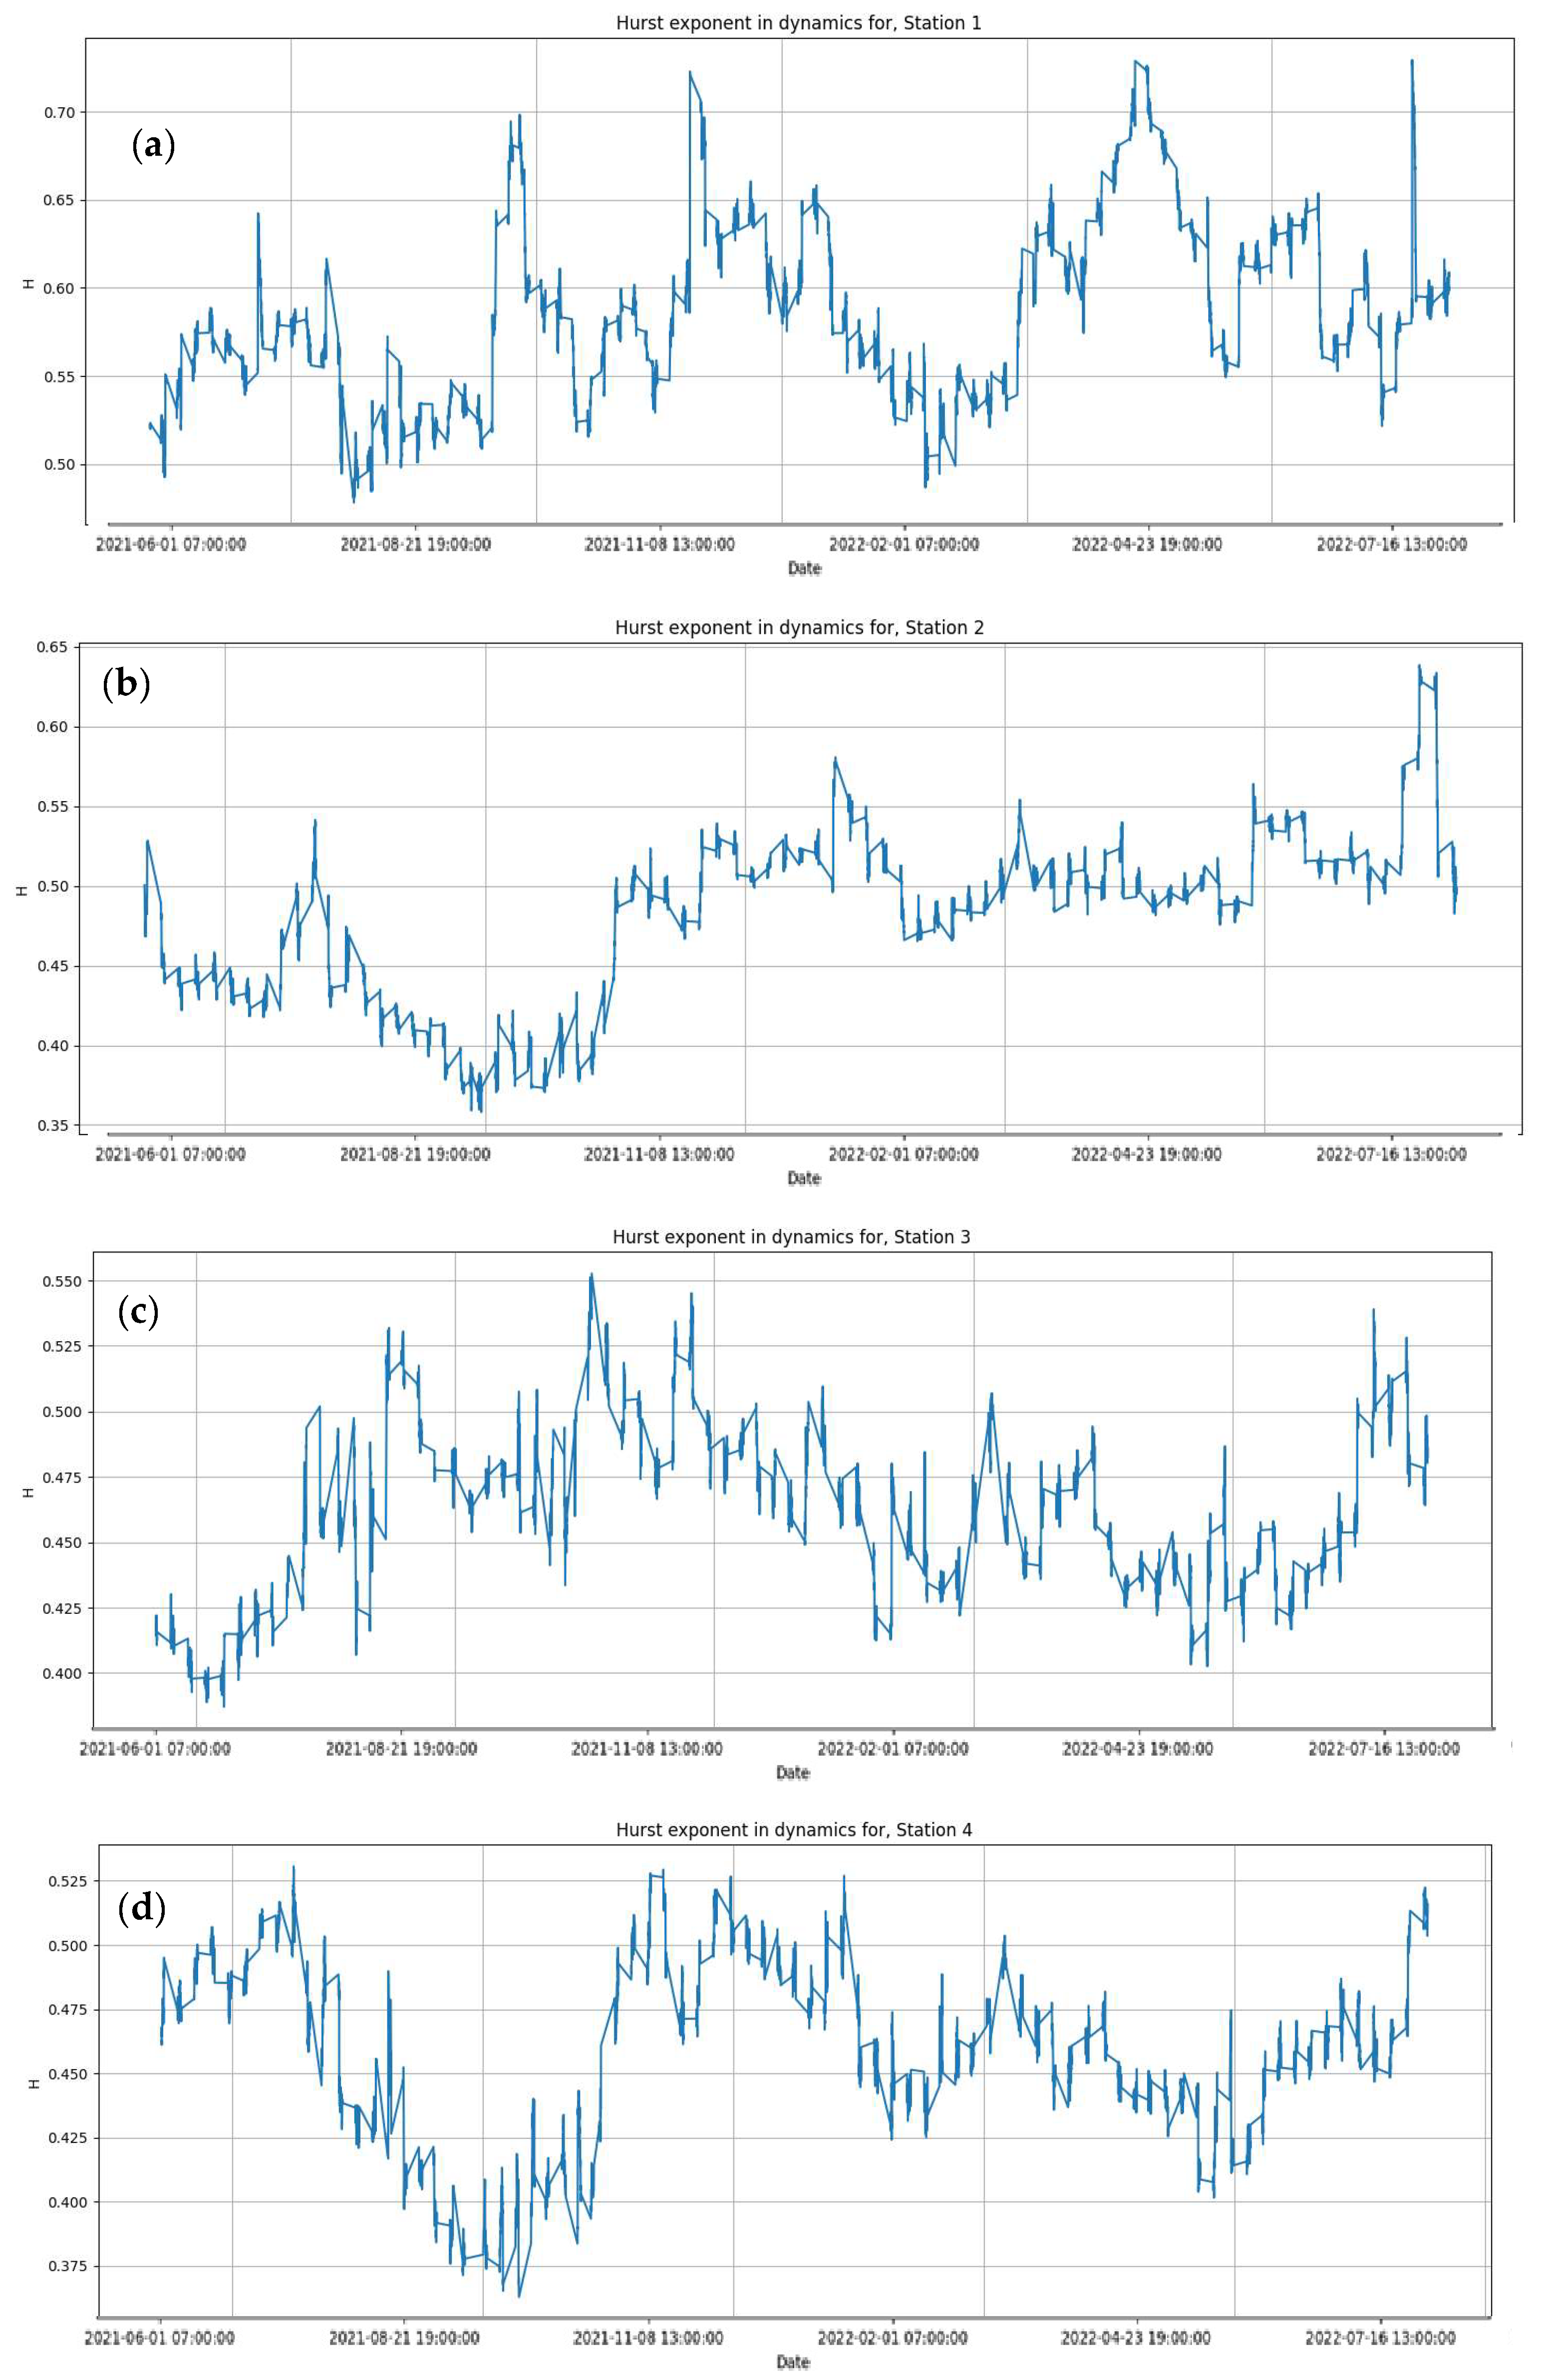
The Hurst exponent for these four-time series was calculated based on R/S analysis. The Hurst exponent for a time series that corresponds to the pollution level recorded at station 1 is H1 = 0.723. The Hurst exponent for a time series that corresponds to the pollution level recorded at station 2 is H2 = 0.548. For a time series from station 3—H3 = 0.442, for a time series from station 4—H3 = 0.462. In addition, a more detailed study of the Hurst exponent behavior in dynamics families of time series were formed. They are constructed from these series using the sliding window method. R/S analysis was used for Hurst exponents calculation. Figure 5 show the time series of values of the Hurst exponent calculated for these families of time series, which were built separately for the time series of air pollution at each of the four observation stations.
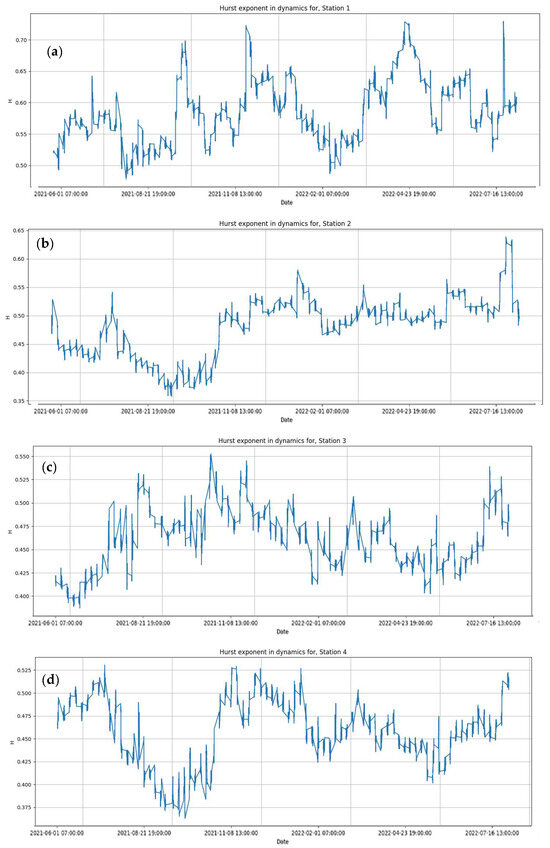
Figure 5.
Time series of changes in the value of the Hurst exponent in dynamics for a family of series constructed using the sliding window method for a time series of PM10 and PM2.5 solid pollution for the period from 1 June 2021 to 30 July 2022: (a) for station 1, (b) for station 2, (c) for station 3, (d) for station 4.
According to the results of the analysis, it can be concluded that the time series corresponding to station 1 is characterized by the presence of long-term memory, and the time series is persistent. The value of the Hurst exponent in dynamics changes generally above the threshold value. The Hurst exponent for a time series corresponding to the pollution level at station 2 was recorded and defined as a series close to random. The value of the Hurst exponent in dynamics for this time series fluctuates near the threshold value. The time series corresponding to the pollution level at stations 3 and 4 are characterized by anti-persistence. However, it is obvious that such values of the Hurst exponent are a consequence of a sharp increase in pollution levels in October 2021. This did not allow for the calculation of the real Hurst index for these time series.
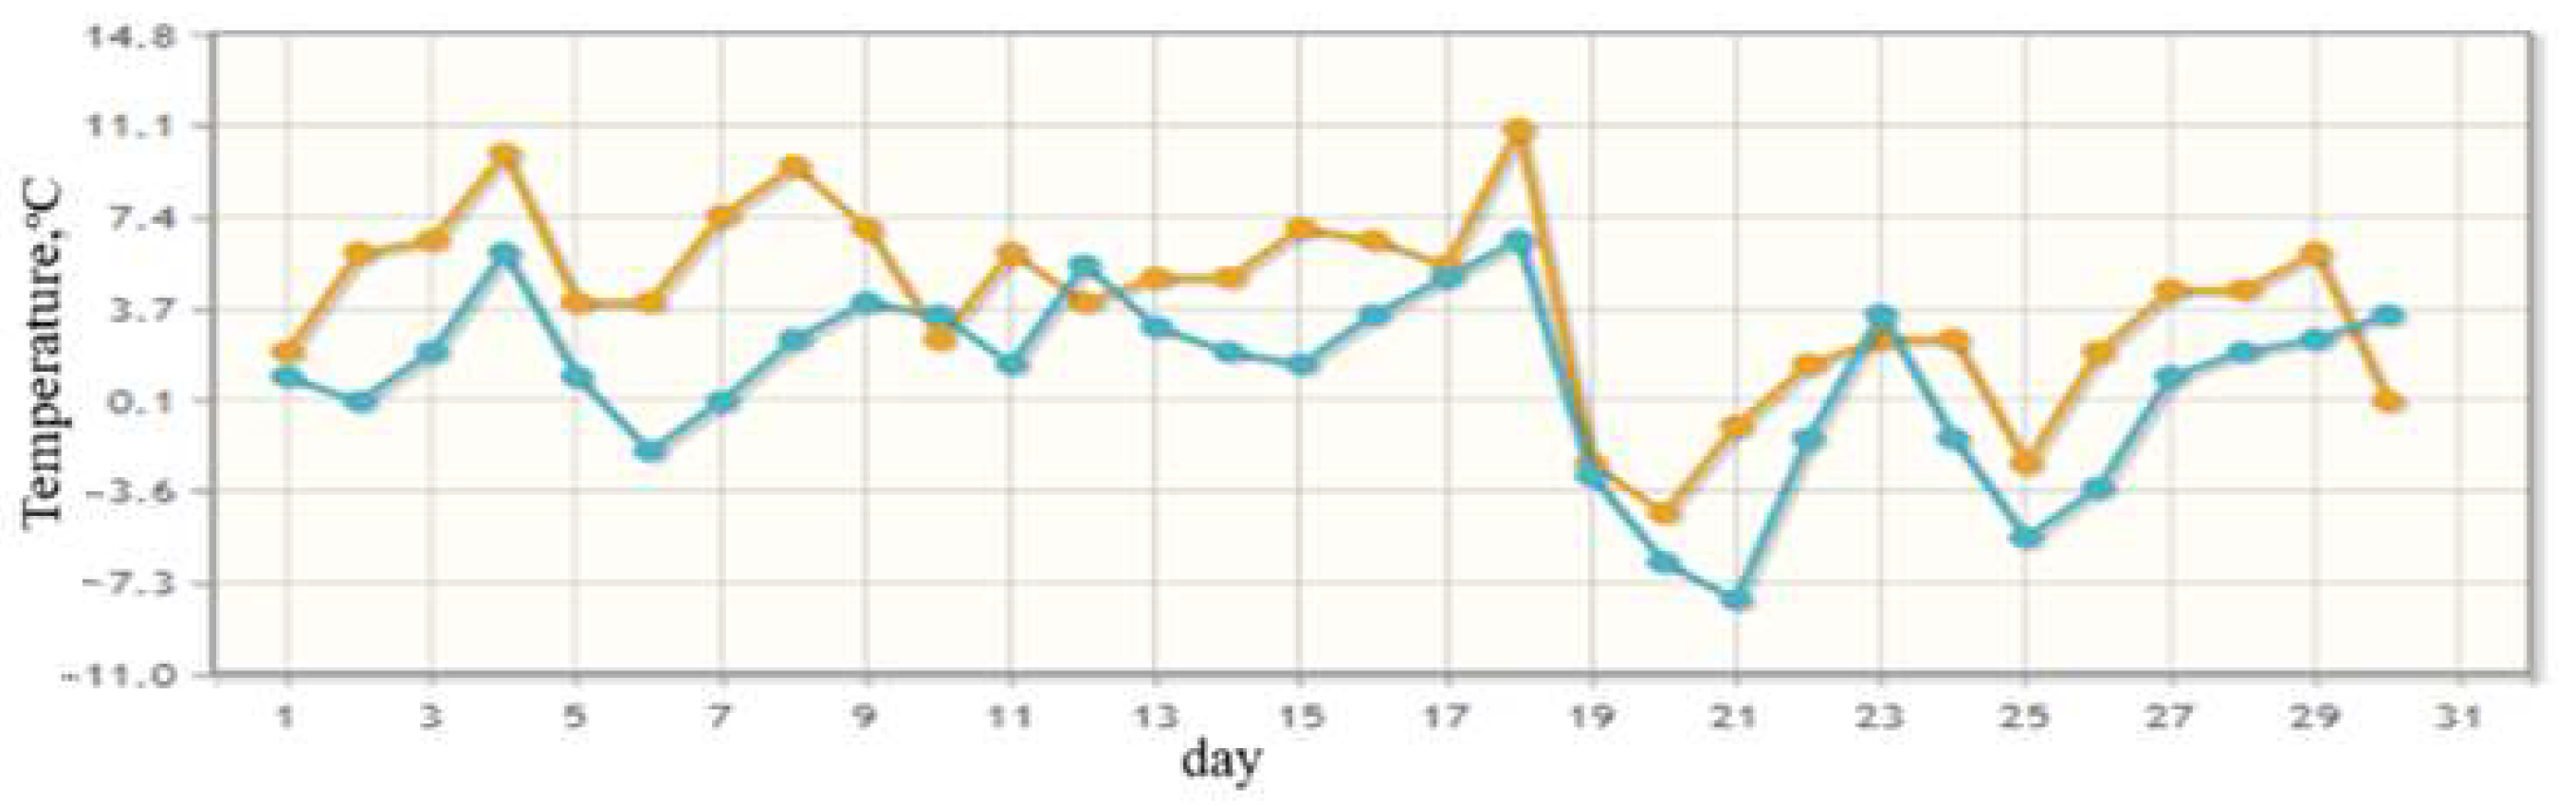
Also, the increase in pollution levels at the end of September 2021 is explained by the fact that on 29 September 2021, heating and thermal power plants were centrally turned on in Astana. Therefore, coal was actively burned, and polluting particles were released into the air. The increase in pollution levels occurred gradually, since weather conditions made it possible not to turn on thermal power plants at full capacity. The air temperature in Astana since mid-November has begun to decrease (Figure 6), and thermal power plants have increased their capacity. The decrease in emissions in January 2022 may be explained by the stabilization of the thermal power plants’ operation and the configuration of appropriate equipment. The impact on the pollutants’ emission level into the air from private households, which are heated mainly by burning fossil fuels and wood waste, should also be noted.
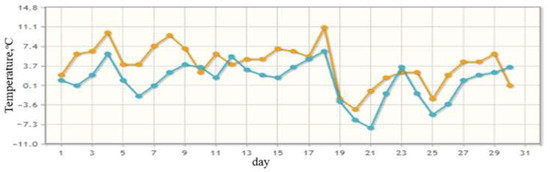
Figure 6.
Daytime (orange curve) and nighttime (blue curve) air temperatures recorded in Astana in November 2021.
The data obtained on the calculation of the value of the Hurst exponent in dynamics, as well as the placement of potential sources of pollution by coal combustion products during the heating season in Astana indicate that the described method can be an indicator of the ecological state in the corresponding region. If the Hurst exponent indicates the persistence of a pollution time series, then the source of pollution is most likely located far from the station. Such a time series can be predicted through the flatness of the increase in pollution levels. The appearance of a critical pollution situation can be foreseen in advance. In the case of anti-persistence or randomness of the time series of the pollution level, it can be argued about a critical or near-critical environmental situation with unstable emissions or in the case when the station is located close to the source of pollution.
4. Discussion
The results obtained from the application of the fractal R/S analysis of air pollution time series for the Astana city, which were collected from four observation stations, indicate the existing environmental problems in the city.
The presence of a long memory in the time series of the air pollutants concentration recorded at four stations in the city of Astana has been investigated. The method of fractal R/S analysis of air pollution time series was applied. For the studied observation stations, the Hurst exponent is 0.723; 0.548; 0.442 and 0.462. The behavior of the Hurst exponent in the dynamics of the sliding window method was investigated. Based on the results of the analysis, it can be concluded that the time series corresponding to station 1 is characterized by the presence of long-term memory and the time series is persistent. The series corresponding to the pollution level at station 2 is defined as a series close to random. The time series corresponding to the pollution level at stations 3 and 4 are characterized by anti-persistance. The obtained values of the Hurst exponent are the result of a sharp increase in pollution levels in October 2021.
As revealed, at the beginning of the heating season in October–December, the level of pollution with PM10 and PM2.5 particulate matters rises sharply to a critical level. This growth is explained by the imperfection of thermal power plants and coal-fired power plants, which are designed for centralized heating, as well as a significant proportion of the combustible fuels burning use for heating private households. It was revealed that the proximity of monitoring stations to sources of pollutant emissions affects the structure of the pollutant concentrations time series. In particular, the time series that were recorded for observation stations close to thermal power plants are anti-persistent or close to random. This is an exceptional situation indicating the difficulty of analyzing such time series using available methods. From the city pollution level point of view, this means sharp emissions that do not fit into a certain trend of changing the harmful substance concentrations in the air. This may indicate the emergence of a critical situation, to which the relevant environmental services of the city should respond.
It should be noted that for the time series of air pollution corresponding to station 1, which is located in the park area of the city and comparatively further from the sources of pollution, the Hurst exponent is more than 0.7. Thus, such a time series is persistent. This is also evidenced by the analysis of the Hurst exponent in dynamics for this time series. Nevertheless, this time series, as well as the time series recorded at other stations, is characterized by a sharp increase during the beginning of the heating season and a decrease in the average daily air temperature. Such an increase is less dramatic, which made the Hurst index calculation and such a time series as persistent with the presence of long-term memory identification possible. The obtained results correlate with similar studies, for example, fractal analysis of time series of PM10 concentration in the air of Athens [23].
The data on air pollution in Astana, which were provided for the study, were purified and ready for analysis. Data on the level of pollution were recorded at four observation stations with an interval of six hours. In other words, the amount of data is sufficient for analysis, but the period for which these data were collected is limited to a year (from June 2021 to July 2022). In this context, the limitation concerns the inability to assess how the level of pollution in Astana increased during the heating season in other years. Perhaps this information would help to understand the annual trend in the intensity and concentration of pollutant emissions in the autumn–winter period.
Another limitation that may influence the conclusion about the level of pollution in the city of Astana is that three of the four observation stations are located on the right bank of the Ishim River and only one on the left bank. This area is older than other areas of the city and was built decades ago. Therefore, thermal power plants and utilities in this area are outdated and need to be modernized. There is also a private sector in the area. It is known that private households mainly heat houses as a result of burning fossil fuels. Therefore, a sharp increase in air pollution was probably recorded at the beginning of the heating season in October–December. The part of the city that is located on the right bank of the Ishim River is new. The main construction in this area has been taking place over the past twenty years. Therefore, communications and the possibility of using natural gas for heating have been expanded here. It is likely that if the stations were located in this area of the city, such critical levels of pollution would not be recorded.
The results obtained are important for the environmental monitoring services of the city, since a quick response to such emissions of pollutants is the key to preserving the health of city residents and is the basis of environmental safety in the region.
5. Conclusions
The reason for the sharp release of PM10 and PM2.5 particulate matter is the operation of thermal power plants in Astana. It was found that thermal power plants are located closer to stations 2, 3 and 4. The smooth increase in the pollution level for the time series corresponding to station 1 is explained by its distance from the source of pollution. It was also found that the intensity of coal combustion and emissions of polluting particles into the air depend on weather conditions.
In general, the gradual transition to heating using natural gas and the development of appropriate infrastructure is a strategic task of the state. Therefore, in future studies, it would be interesting to analyze the impact of the gradual transition to natural gas heating on the environmental situation in Astana, in particular, the level of air pollution with PM10 and PM2.5 particulate matter. It is also interesting to explore what role the intensity of population growth in the city plays in this process. It is known that the annual population growth of the city is more than 4% and this puts a significant burden on the energy system. One of the most effective methods for air purification from pollutants is the use of modified biochar [30], especially by major polluters such as thermal power plants.
The results obtained in the article are important for the development of urbanism in terms of ensuring the sustainable development of urban agglomerations, which are growing rapidly. The obtained results indicate that the fractal time series analysis method can be an indicator of the ecological state in the relevant region. If the source of pollution is located far from the monitoring station and the Hurst exponent indicates the persistence of a time series of pollution, then a method for predicting the occurrence of a critical level of pollution can be used for such a time series. One of the reasons for the anti-persistence or randomness of the time series of the pollution level may be the proximity of the location to the source of pollution.
Supplementary Materials
The following supporting information can be downloaded at: https://zenodo.org/doi/10.5281/zenodo.12804873, Table S1: The dataset of pollution time series for Astana.
Author Contributions
Conceptualization, A.N. and A.B.; methodology, O.K.; software, Y.A.; formal analysis, S.B., A.N. and A.M.; investigation, O.K.; data curation, A.N.; writing—original draft preparation, O.K.; writing—review and editing, Y.A., S.B. and I.K.; visualization, Y.A.; supervision, A.N.; project administration, A.B. All authors have read and agreed to the published version of the manuscript.
Funding
This research was funded by the Science Committee of the Ministry of Science and Higher Education of the Republic of Kazakhstan within the project BR21882258 “Development of Intelligent Information and Communication Systems Complex for Environmental Emission Monitoring to Make Decisions on Carbon Neutrality”.
Data Availability Statement
All data are available in this publication.
Acknowledgments
The authors thank the reviewers and editors for their generous and constructive comments that have improved this paper.
Conflicts of Interest
The authors declare no conflicts of interest.
References
- WHO. Air Pollution. 2024. Available online: https://www.who.int/health-topics/air-pollution#tab=tab_1 (accessed on 2 July 2024).
- Romanello, M.; Di Napoli, C.; Drummond, P.; Green, C.; Kennard, H.; Lampard, P.; Scamman, D.; Arnell, N.; Ayeb-Karlsson, S.; Ford, L.B.; et al. The 2022 report of the Lancet Countdown on health and climate change: Health at the mercy of fossil fuels. Lancet 2022, 400, 1619–1654. [Google Scholar] [CrossRef] [PubMed]
- Manisalidis, I.; Stavropoulou, E.; Stavropoulos, A.; Bezirtzoglou, E. Environmental and health impacts of air pollution: A review. Front. Public Health 2020, 8, 14. [Google Scholar] [CrossRef]
- GBD 2017 Diet Collaborators. Health effects of dietary risks in 195 countries, 1990–2017: A systematic analysis for the Global Burden of Disease Study 2017. Lancet 2019, 393, 1958–1972. [Google Scholar] [CrossRef] [PubMed]
- Pereira, F.; Nadeau, K. Climate Change, Fossil-Fuel Pollution, and Children’s Health. N. Z. J. Med. 2022, 386, 2303–2314. [Google Scholar] [CrossRef]
- ISO 37120:2018; Sustainable Cities and Communities? Indicators for City Services and Quality of Life. International Organization for Standardization (ISO): Geneva, Switzerland, 2018. Available online: https://www.iso.org/standard/68498.html (accessed on 2 July 2024).
- Wesz, J.G.B.; Miron, L.I.G.; Delsante, I.; Tzortzopoulos, P. Urban Quality of Life: A Systematic Literature Review. Urban Sci. 2023, 7, 56. [Google Scholar] [CrossRef]
- To, T.; Zhu, J.; Terebessy, E.; Zhang, K.; Fong, I.; Pinault, L.; Jerrett, M.; Robichaud, A.; Menard, R.; van Donkelaar, A.; et al. Does exposure to air pollution increase the risk of acute care in young children with asthma? An Ontario, Canada study. Environ. Res. 2021, 199, 111302. [Google Scholar] [CrossRef]
- Bureau of National Statistics of Agency for Strategic Planning and Reforms of the Republic of Kazakhstan. Astana City. Summary of the Socio-Economic Development of the Region. 2018. Available online: https://stat.gov.kz/en/region/astana/ (accessed on 2 July 2024).
- Global Wind Atlas. 2018. Available online: https://globalwindatlas.info/en (accessed on 2 July 2024).
- Kerimray, A.; Bakdolotov, A.; Sarbassov, Y.; Inglezakis, V.; Poulopoulos, S. Air pollution in Astana: Analysis of Recent Trends and Air Quality Monitoring System. Mater. Today Proc. 2018, 5, 22749–22758. [Google Scholar] [CrossRef]
- IQAir. Air Quality in Astana. Available online: https://www.iqair.com/us/kazakhstan/astana (accessed on 2 July 2024).
- IQAir. New WHO Air Quality Guidelines Will Save Lives. Available online: https://www.iqair.com/us/newsroom/2021-WHOair-quality-guidelines (accessed on 2 July 2024).
- The World Bank. Strengthening Public Finance for Inclusive and Resilient Growth. Public Finance Review. 2023. Available online: https://thedocs.worldbank.org/en/doc/90dbef81d187b403bbb2a9acc2f460d8-0080062024/original/Kazakhstan-PFR-full-Report-January-2024-en.pdf (accessed on 2 July 2024).
- Biloshchytskyi, A.; Kuchanskyi, O.; Andrashko, Y.; Yedilkhan, D.; Neftissov, A.; Biloshchytska, S.; Amirgaliyev, B.; Vatskel, V. Reducing Outdoor Air Pollutants through a Moss-Based Biotechnological Purification Filter in Kazakhstan. Urban Sci. 2023, 7, 104. [Google Scholar] [CrossRef]
- Biloshchytskyi, A.; Kuchansky, A.; Andrashko, Y.; Neftissov, A.; Vatskel, V.; Yedilkhan, D.; Herych, M. Building a model for choosing a strategy for reducing air pollution based on data predictive analysis. East.-Eur. J. Enterp. Technol. 2022, 117, 23–30. [Google Scholar] [CrossRef]
- He, Y.; Kuchansky, A.; Paliy, S.; Shabala, Y. Problems in Air Quality Monitoring and Assessment. In Proceedings of the 2021 IEEE International Conference on Smart Information Systems and Technologies (SIST), Nur-Sultan, Kazakhstan, 28–30 April 2021; pp. 28–30. [Google Scholar] [CrossRef]
- Bozkus, S.K.; Kahyaoglu, H.; Mahamane Lawali, A.M. Multifractal analysis of atmospheric carbon emissions and OECD industrial production index. Int. J. Clim. Chang. Strateg. Manag. 2020, 12, 411–430. [Google Scholar] [CrossRef]
- Wang, Q.; Zhao, T.; Wang, R.; Zhang, L. Backward Trajectory and Multifractal Analysis of Air Pollution in Zhengzhou Region of China. Math. Probl. Eng. 2022, 2022, 2226565. [Google Scholar] [CrossRef]
- Liu, X.; Hadiatullah, H.; Tai, P.; Xu, Y.; Zhang, X.; Schnelle-Kreis, J.; Schloter-Hai, B.; Zimmermann, R. Air pollution in Germany: Spatio-temporal variations and their driving factors based on continuous data from 2008 to 2018. Environ. Pollut. 2021, 276, 116732. [Google Scholar] [CrossRef]
- Gil-Alana, L.A.; Yaya, O.S.; Awolaja, O.G.; Cristofaro, L. Long Memory and Time Trends in Particulate Matter Pollution (PM2.5 and PM10) in the 50 U.S. States. J. Appl. Meteorol. Climatol. 2020, 59, 1351–1367. [Google Scholar] [CrossRef]
- Meraz, M.; Rodriguez, E.; Femat, R.; Echeverria, J.C.; Alvarez-Ramirez, J. Statistical persistence of air pollutants (O3, SO2, NO2 and PM10) in Mexico City. Phys. A Stat. Mech. Its Appl. 2015, 427, 202–217. [Google Scholar] [CrossRef]
- Nikolopoulos, D.; Moustris, K.; Petraki, E.; Koulougliotis, D.; Cantzos, D. Fractal and Long-Memory Traces in PM10 Time Series in Athens, Greece. Environments 2019, 6, 29. [Google Scholar] [CrossRef]
- Varotsos, C.; Ondov, J.; Efstathiou, M. Scaling properties of air pollution in Athens, Greece and Baltimore, Maryland. Atmos. Environ. 2005, 39, 4041–4047. [Google Scholar] [CrossRef]
- Xue, Y.; Pan, W.; Lu, W.Z.; He, H.D. Multifractal nature of particulate matters (PMs) in Hong Kong urban air. Sci. Total Environ. 2015, 532, 744–751. [Google Scholar] [CrossRef]
- Thompson, J.R.; Wilson, J.R. Multifractal detrended fluctuation analysis: Practical applications to financial time series. Comput. Simul. 2016, 126, 63–88. [Google Scholar] [CrossRef]
- Kantelhardt, J.W.; Zschiegner, S.A.; Koscielny-Bunde, E.; Havlin, S.; Bunde, A.; Stanley, H.E. Multifractal detrended fluctuation analysis of nonstationary time series. Phys. A Stat. Mech. Its Appl. 2002, 316, 87–114. [Google Scholar] [CrossRef]
- Anis, A.; Lloyd, E. The expected value of the adjusted rescaled Hurst Range of independent normal summands. Biometrika 1976, 63, 111–116. [Google Scholar] [CrossRef]
- Peters, E.E. Fractal Market Analysis: Applying Chaos Theory to Investment and Economics; John Wiley & Sons Inc.: Hoboken, NJ, USA, 1994; p. 336. [Google Scholar]
- Jia, L.; Cheng, P.; Yu, Y.; Chen, S.H.; Wang, C.X.; He, L.; Nie, H.T.; Wang, J.C.; Zhang, J.C.; Fan, B.G.; et al. Regeneration mechanism of a novel high-performance biochar mercury adsorbent directionally modified by multimetal multilayer loading. J. Environ. Manag. 2023, 326, 116790. [Google Scholar] [CrossRef] [PubMed]
Disclaimer/Publisher’s Note: The statements, opinions and data contained in all publications are solely those of the individual author(s) and contributor(s) and not of MDPI and/or the editor(s). MDPI and/or the editor(s) disclaim responsibility for any injury to people or property resulting from any ideas, methods, instructions or products referred to in the content. |
© 2024 by the authors. Licensee MDPI, Basel, Switzerland. This article is an open access article distributed under the terms and conditions of the Creative Commons Attribution (CC BY) license (https://creativecommons.org/licenses/by/4.0/).