
The Impact of Social Distancing Policies on Water Distribution Systems During COVID-19: The Case of Maringá, Brazil

 ,
,
Abstract
:1. Introduction
2. Materials and Methods
2.1. Study Area
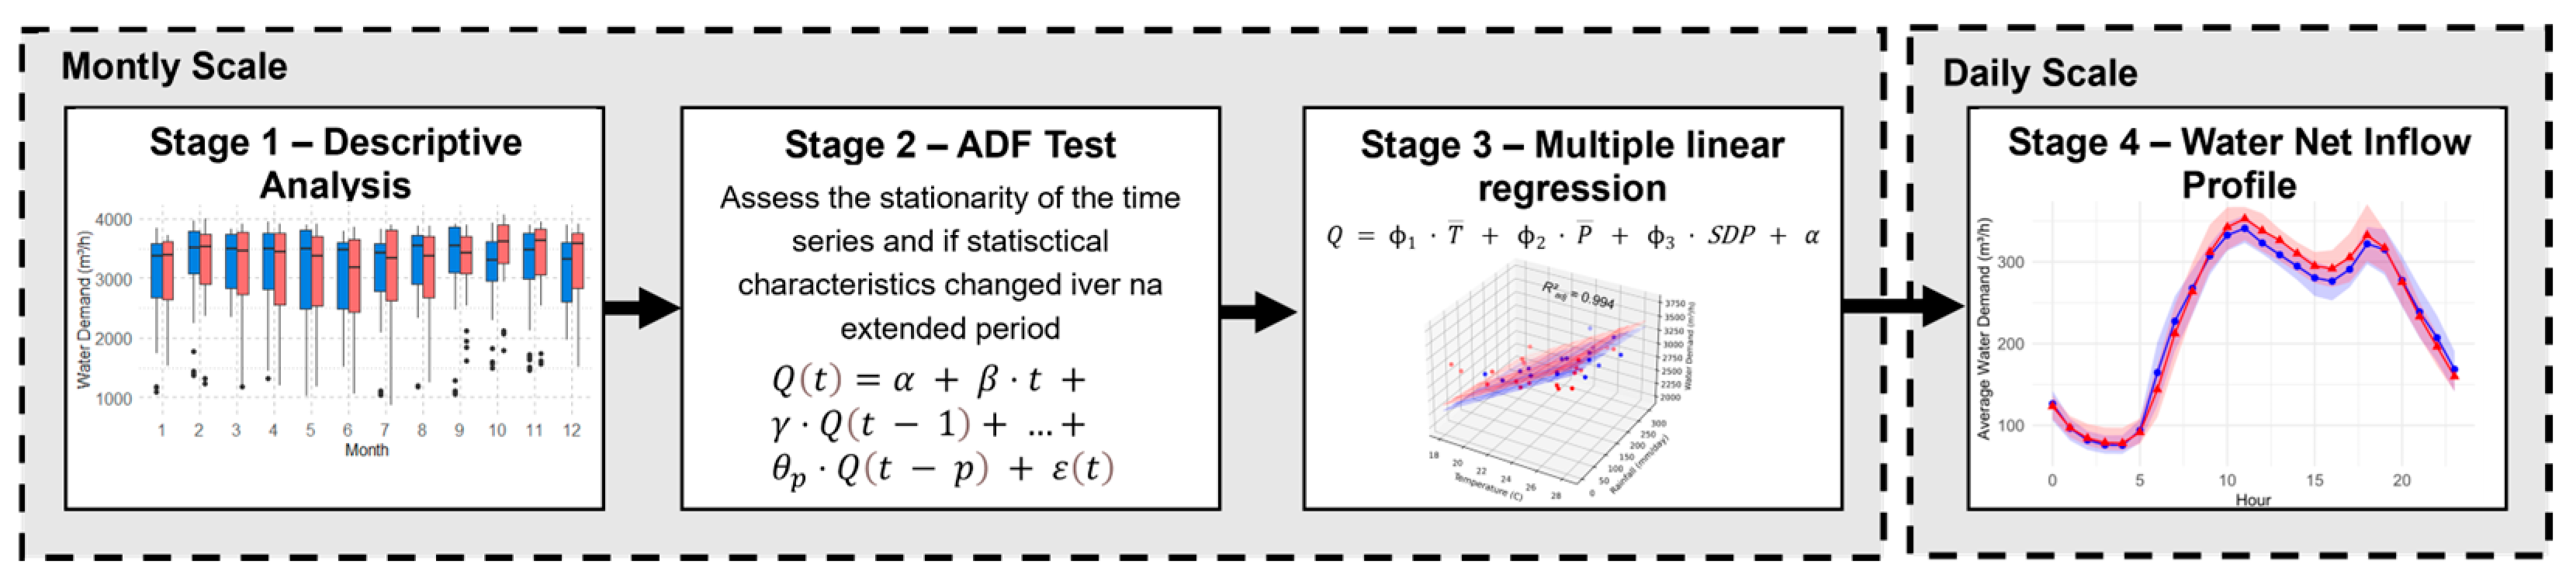
2.2. Method
3. Results and Discussion
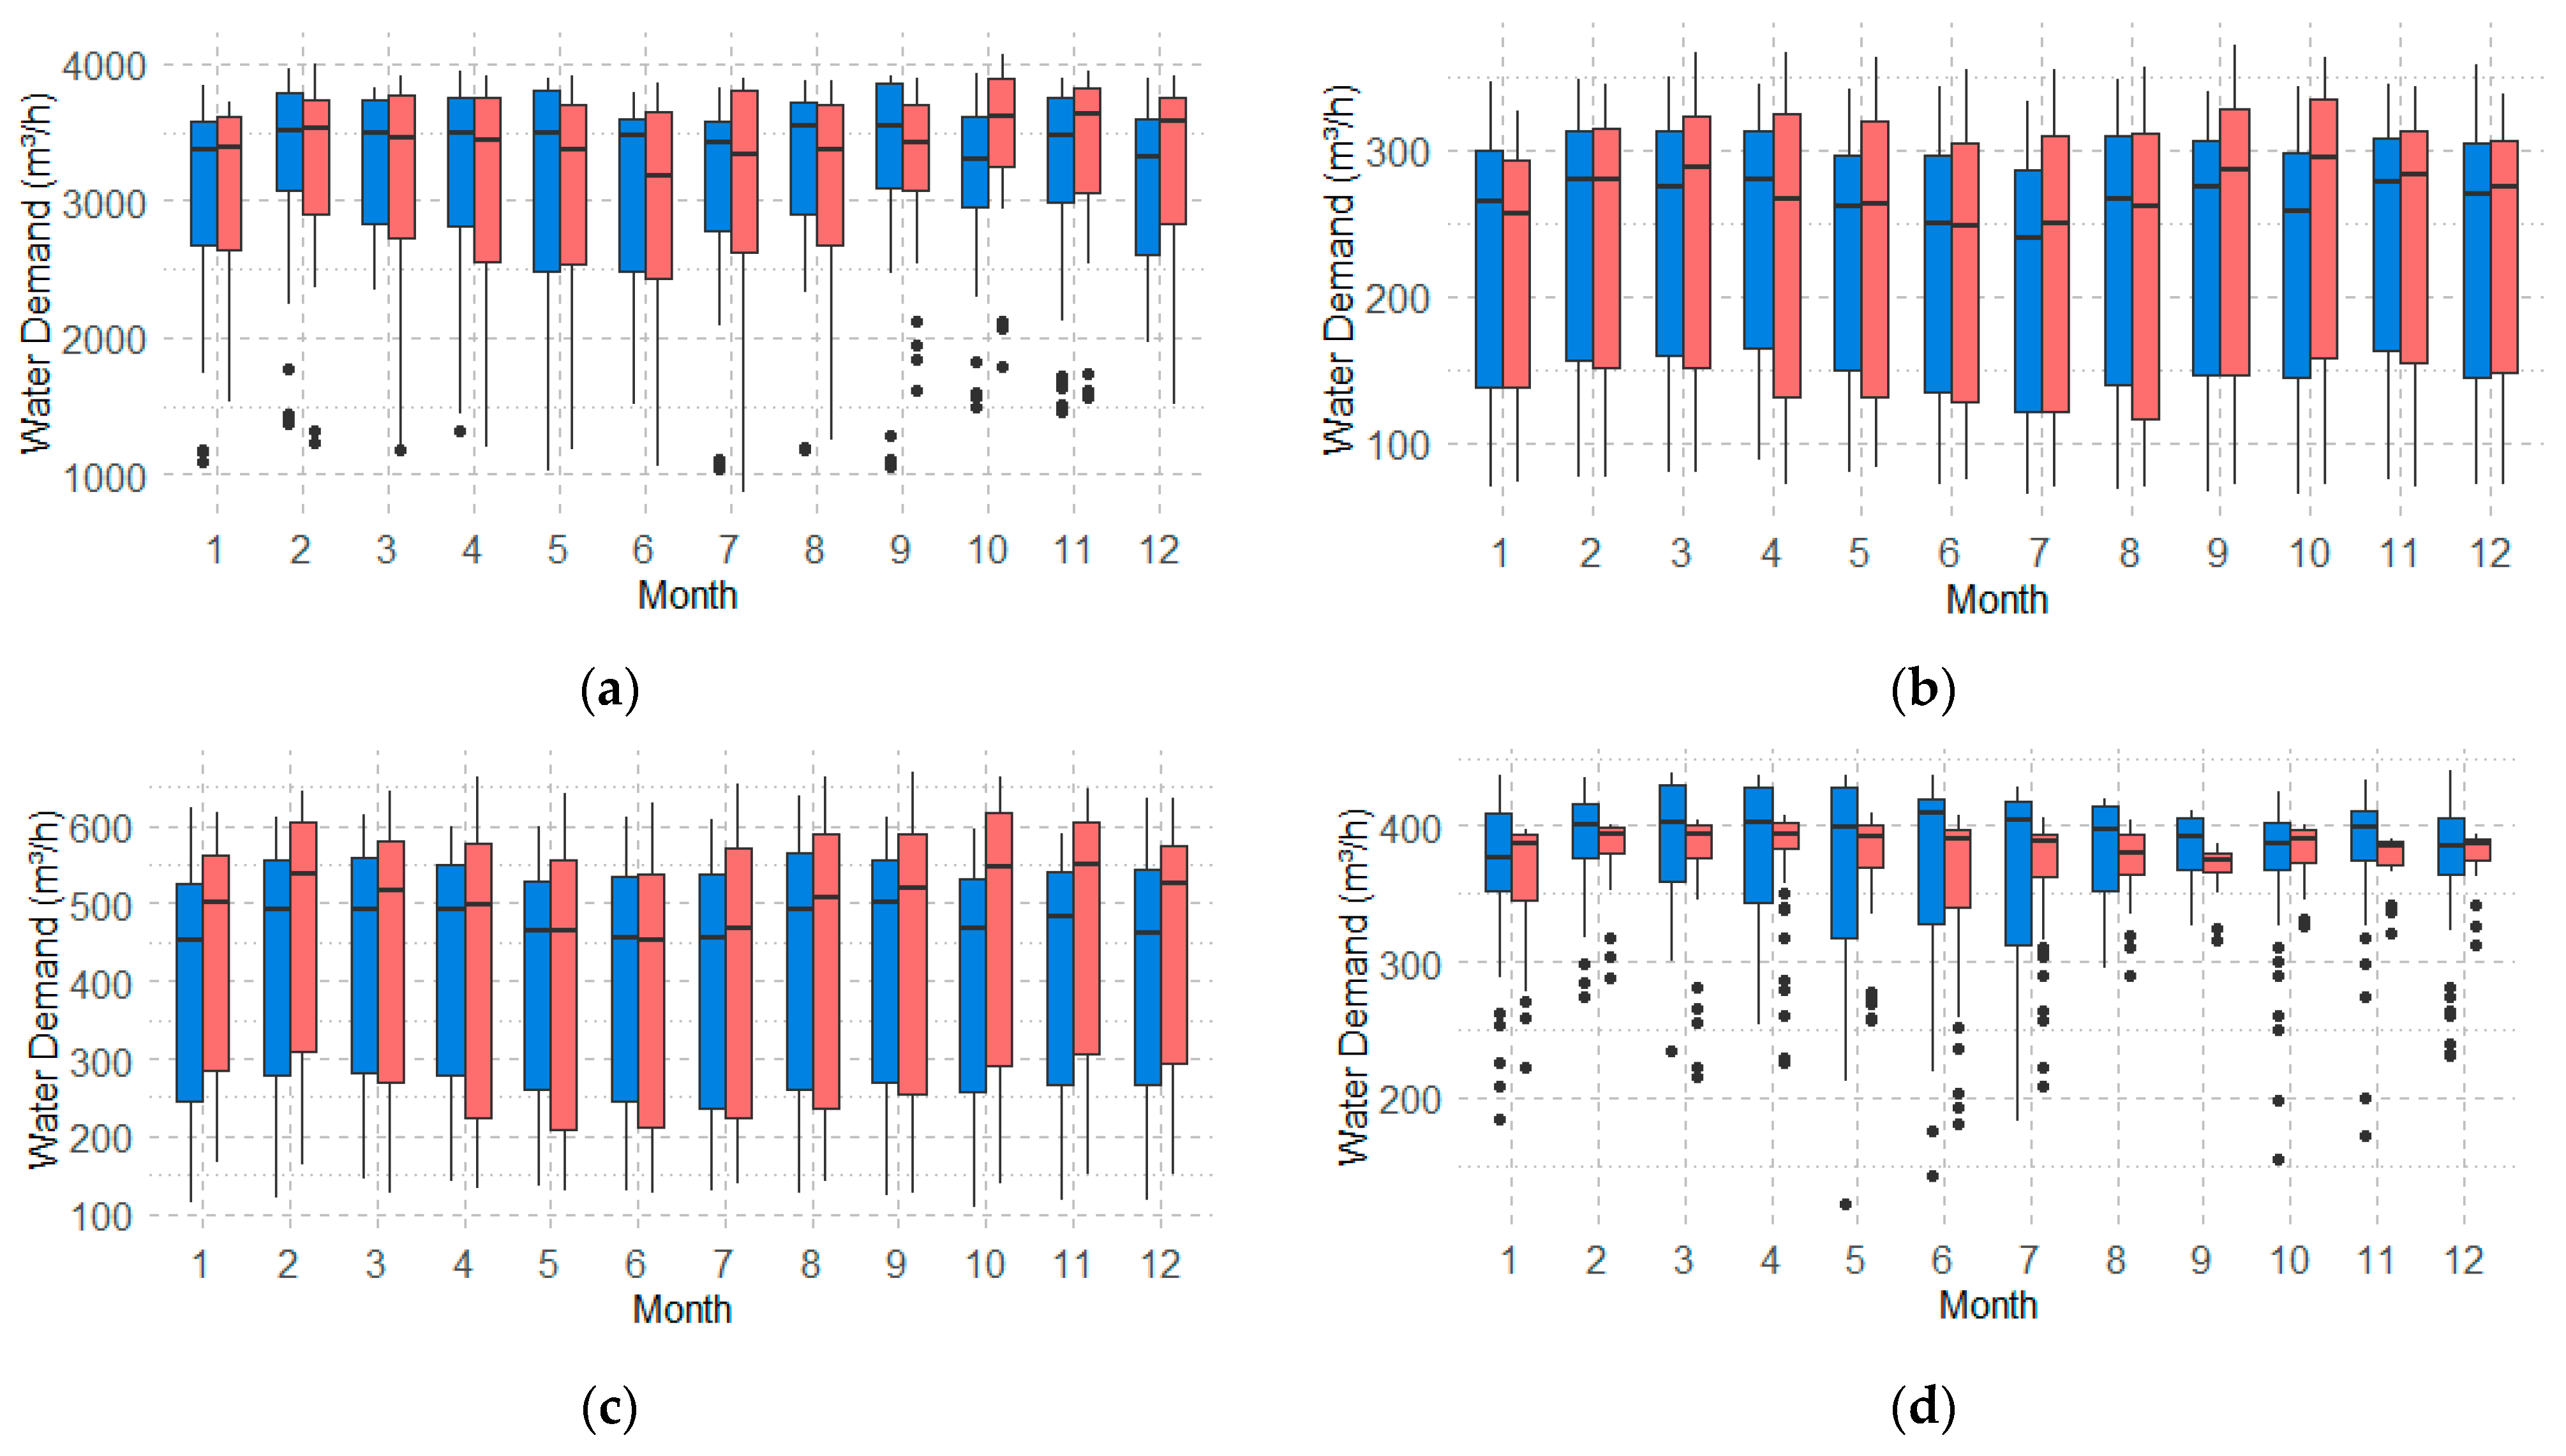
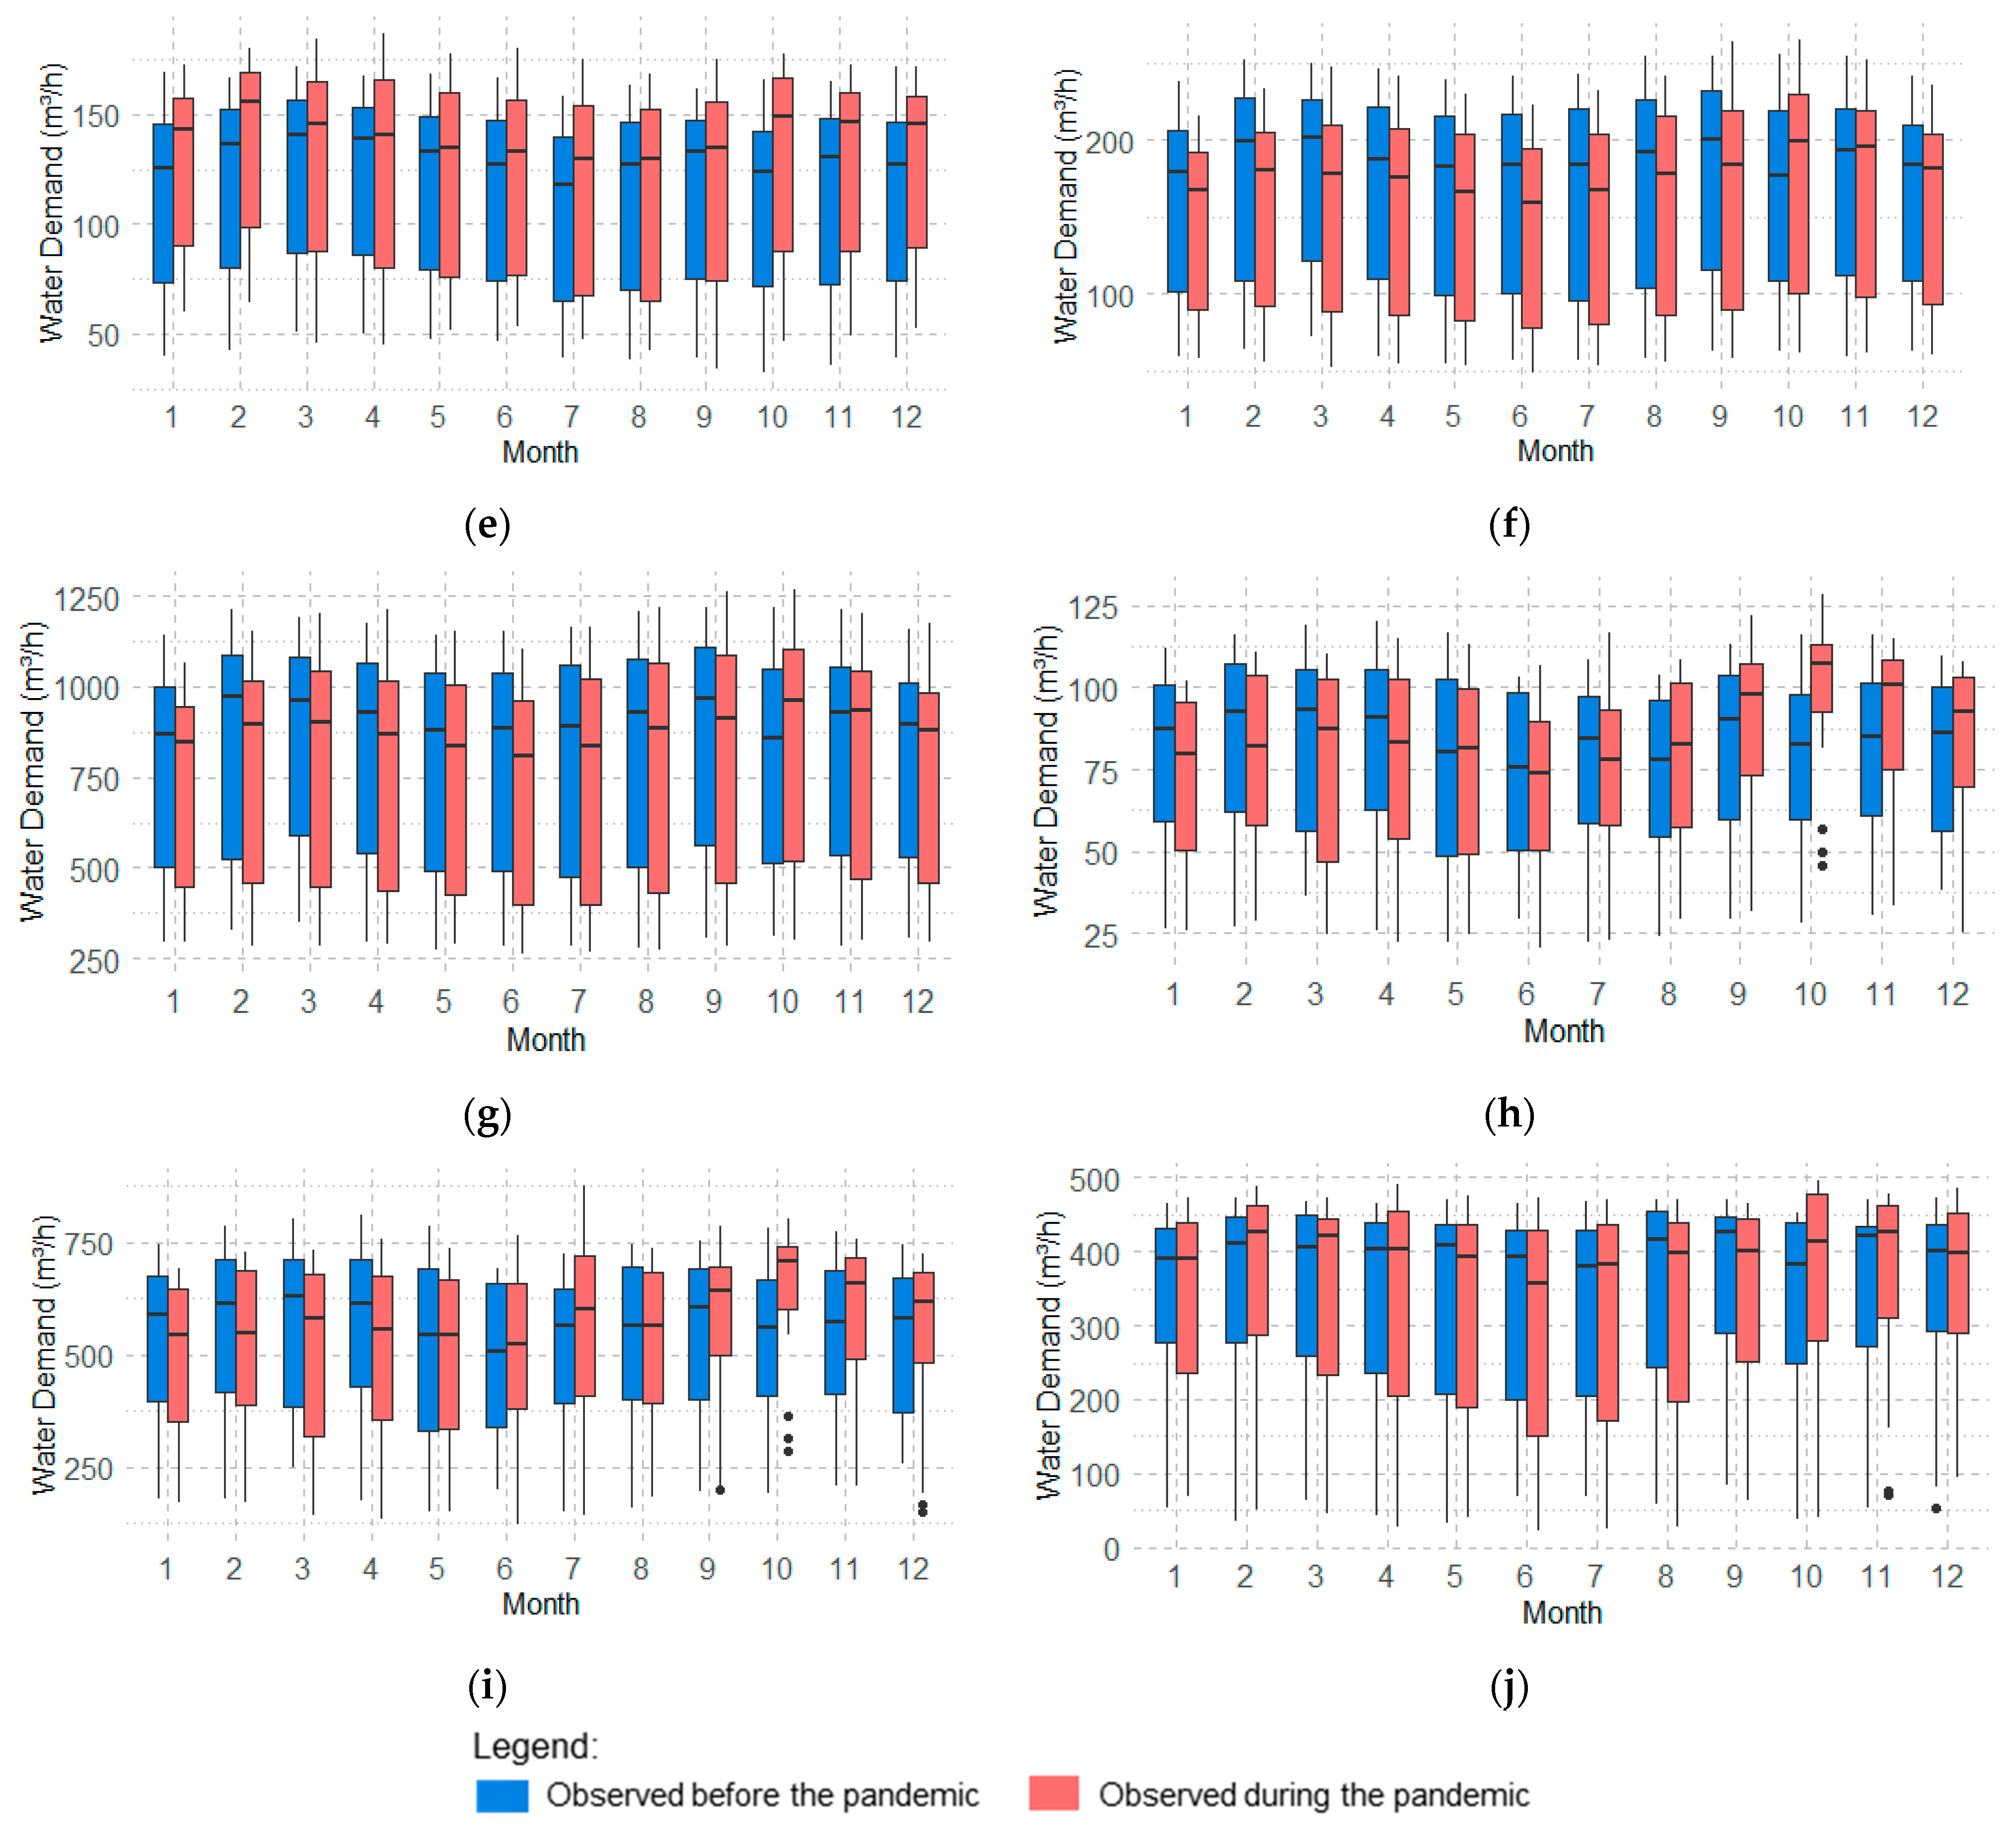
3.1. Effect on Monthly Water Demands
3.2. Stationarity of the Series
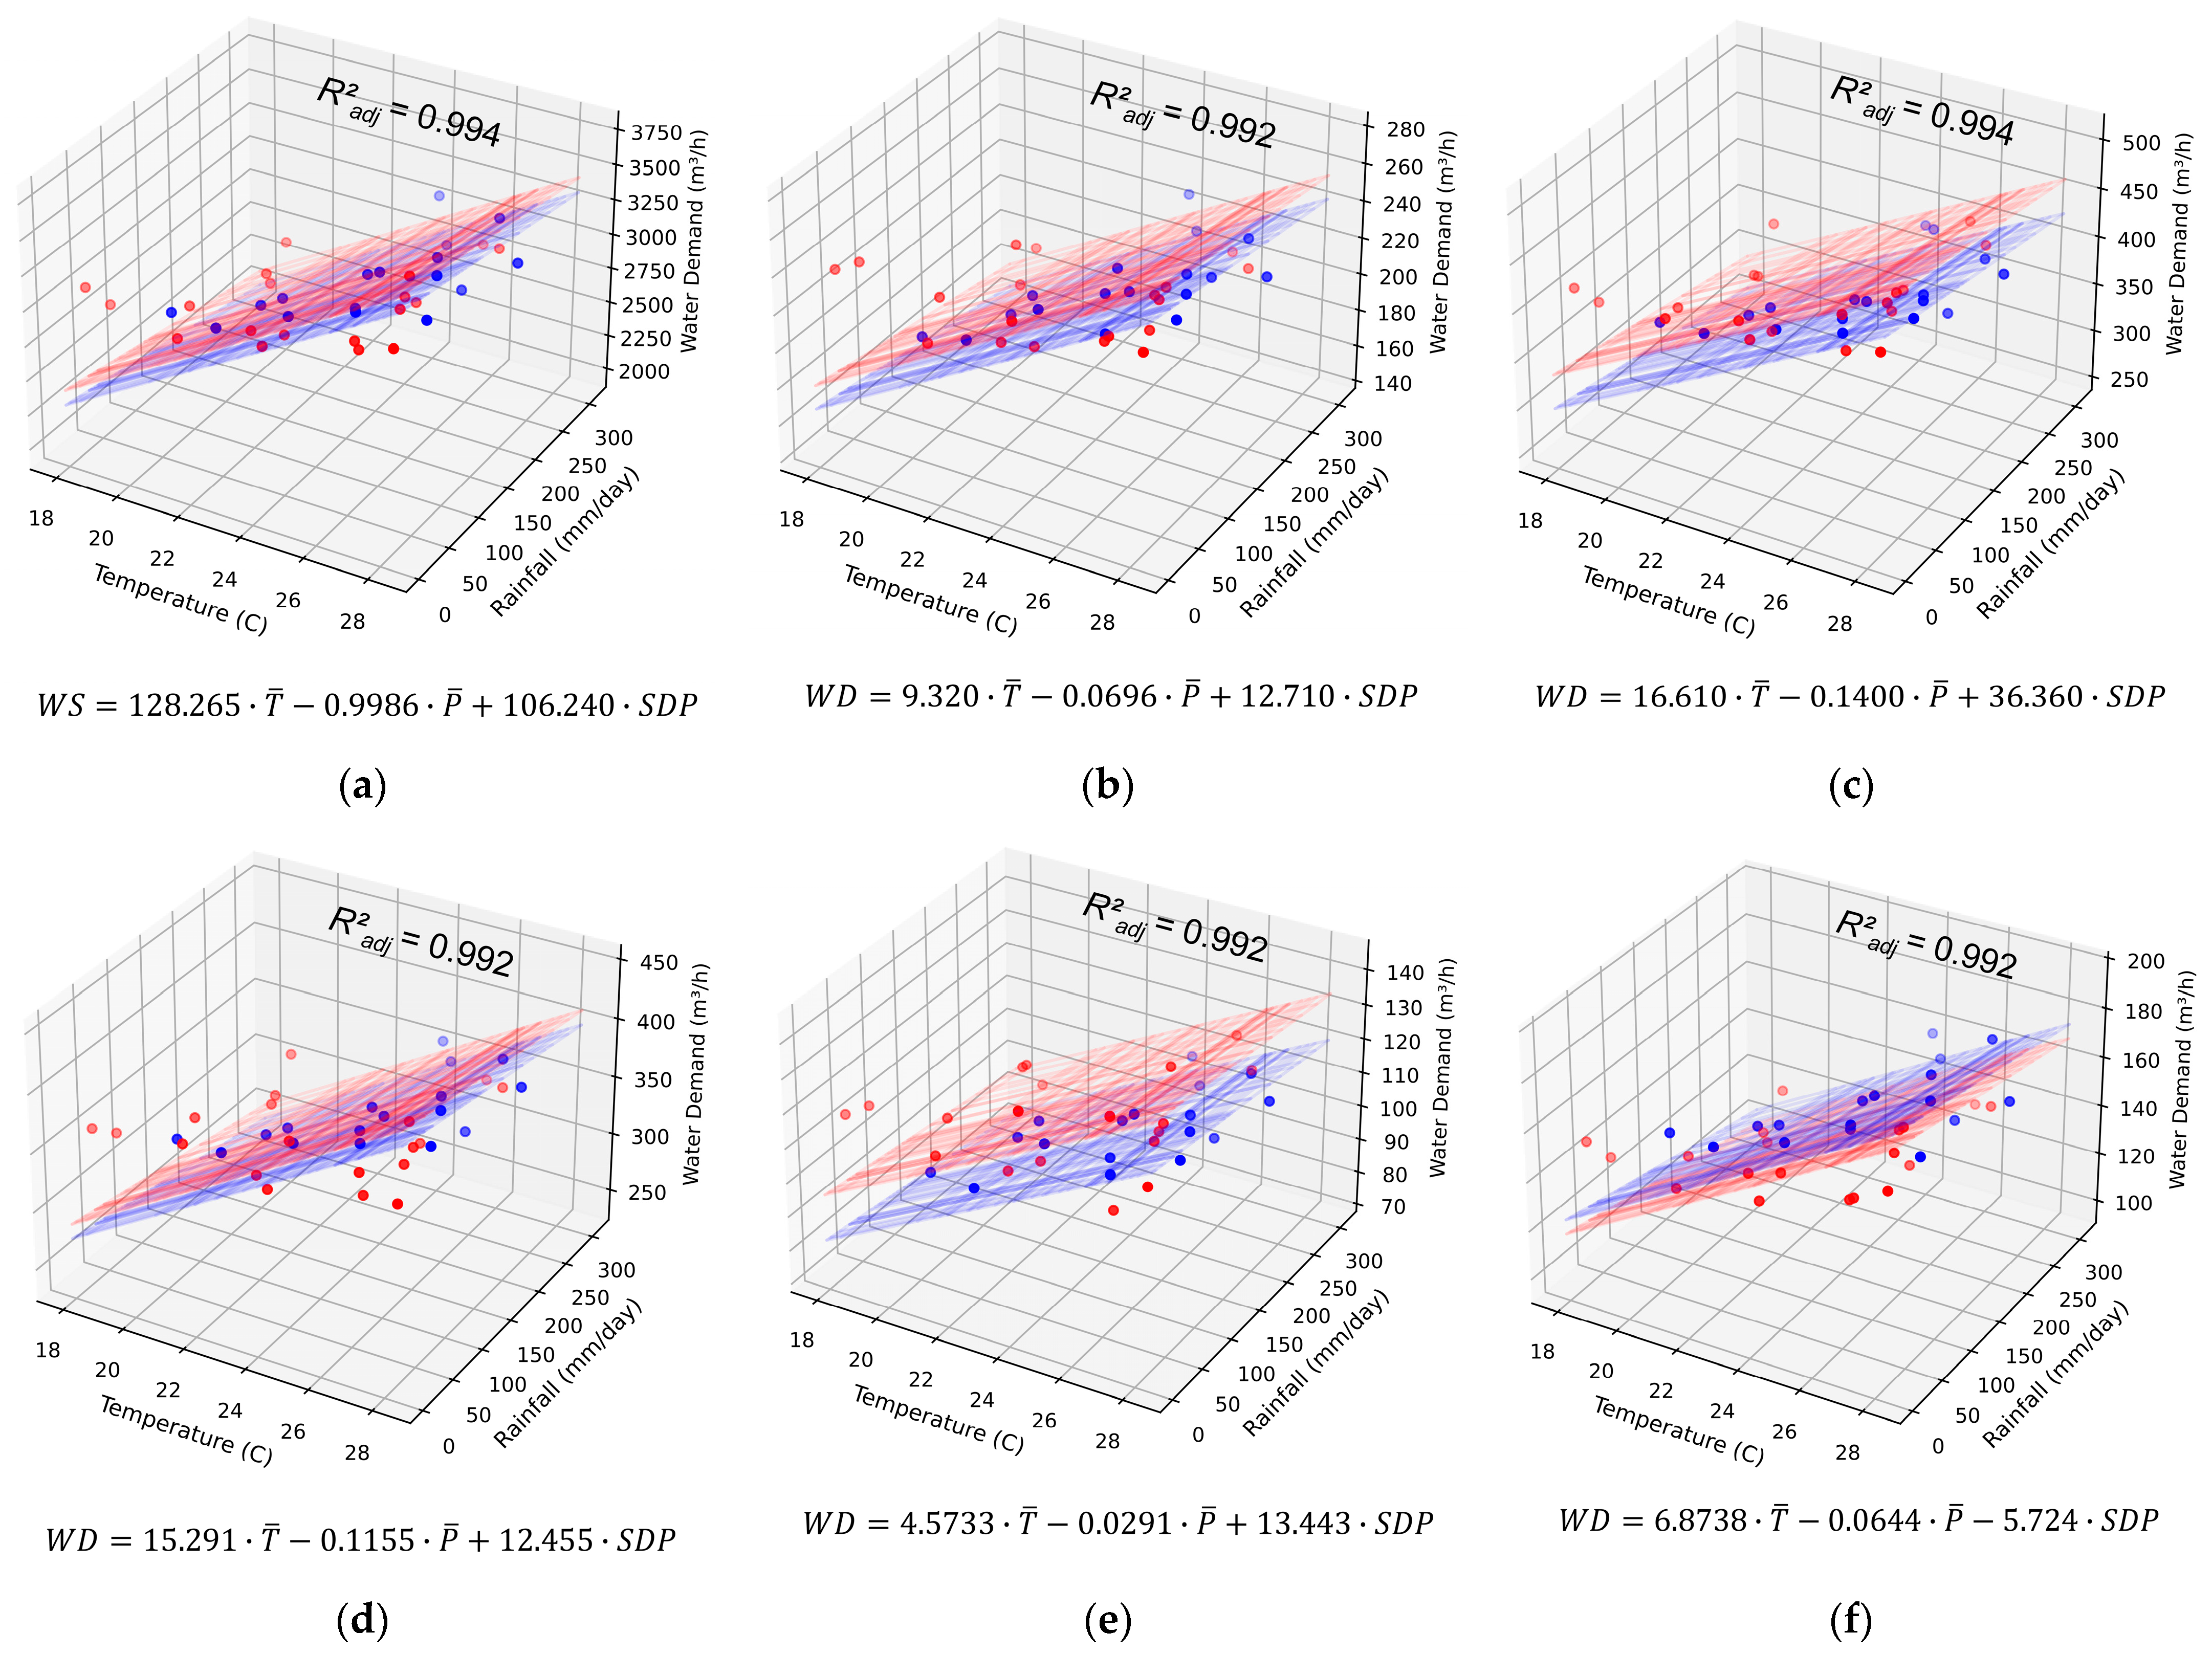
3.3. Multiple Regression Modeling
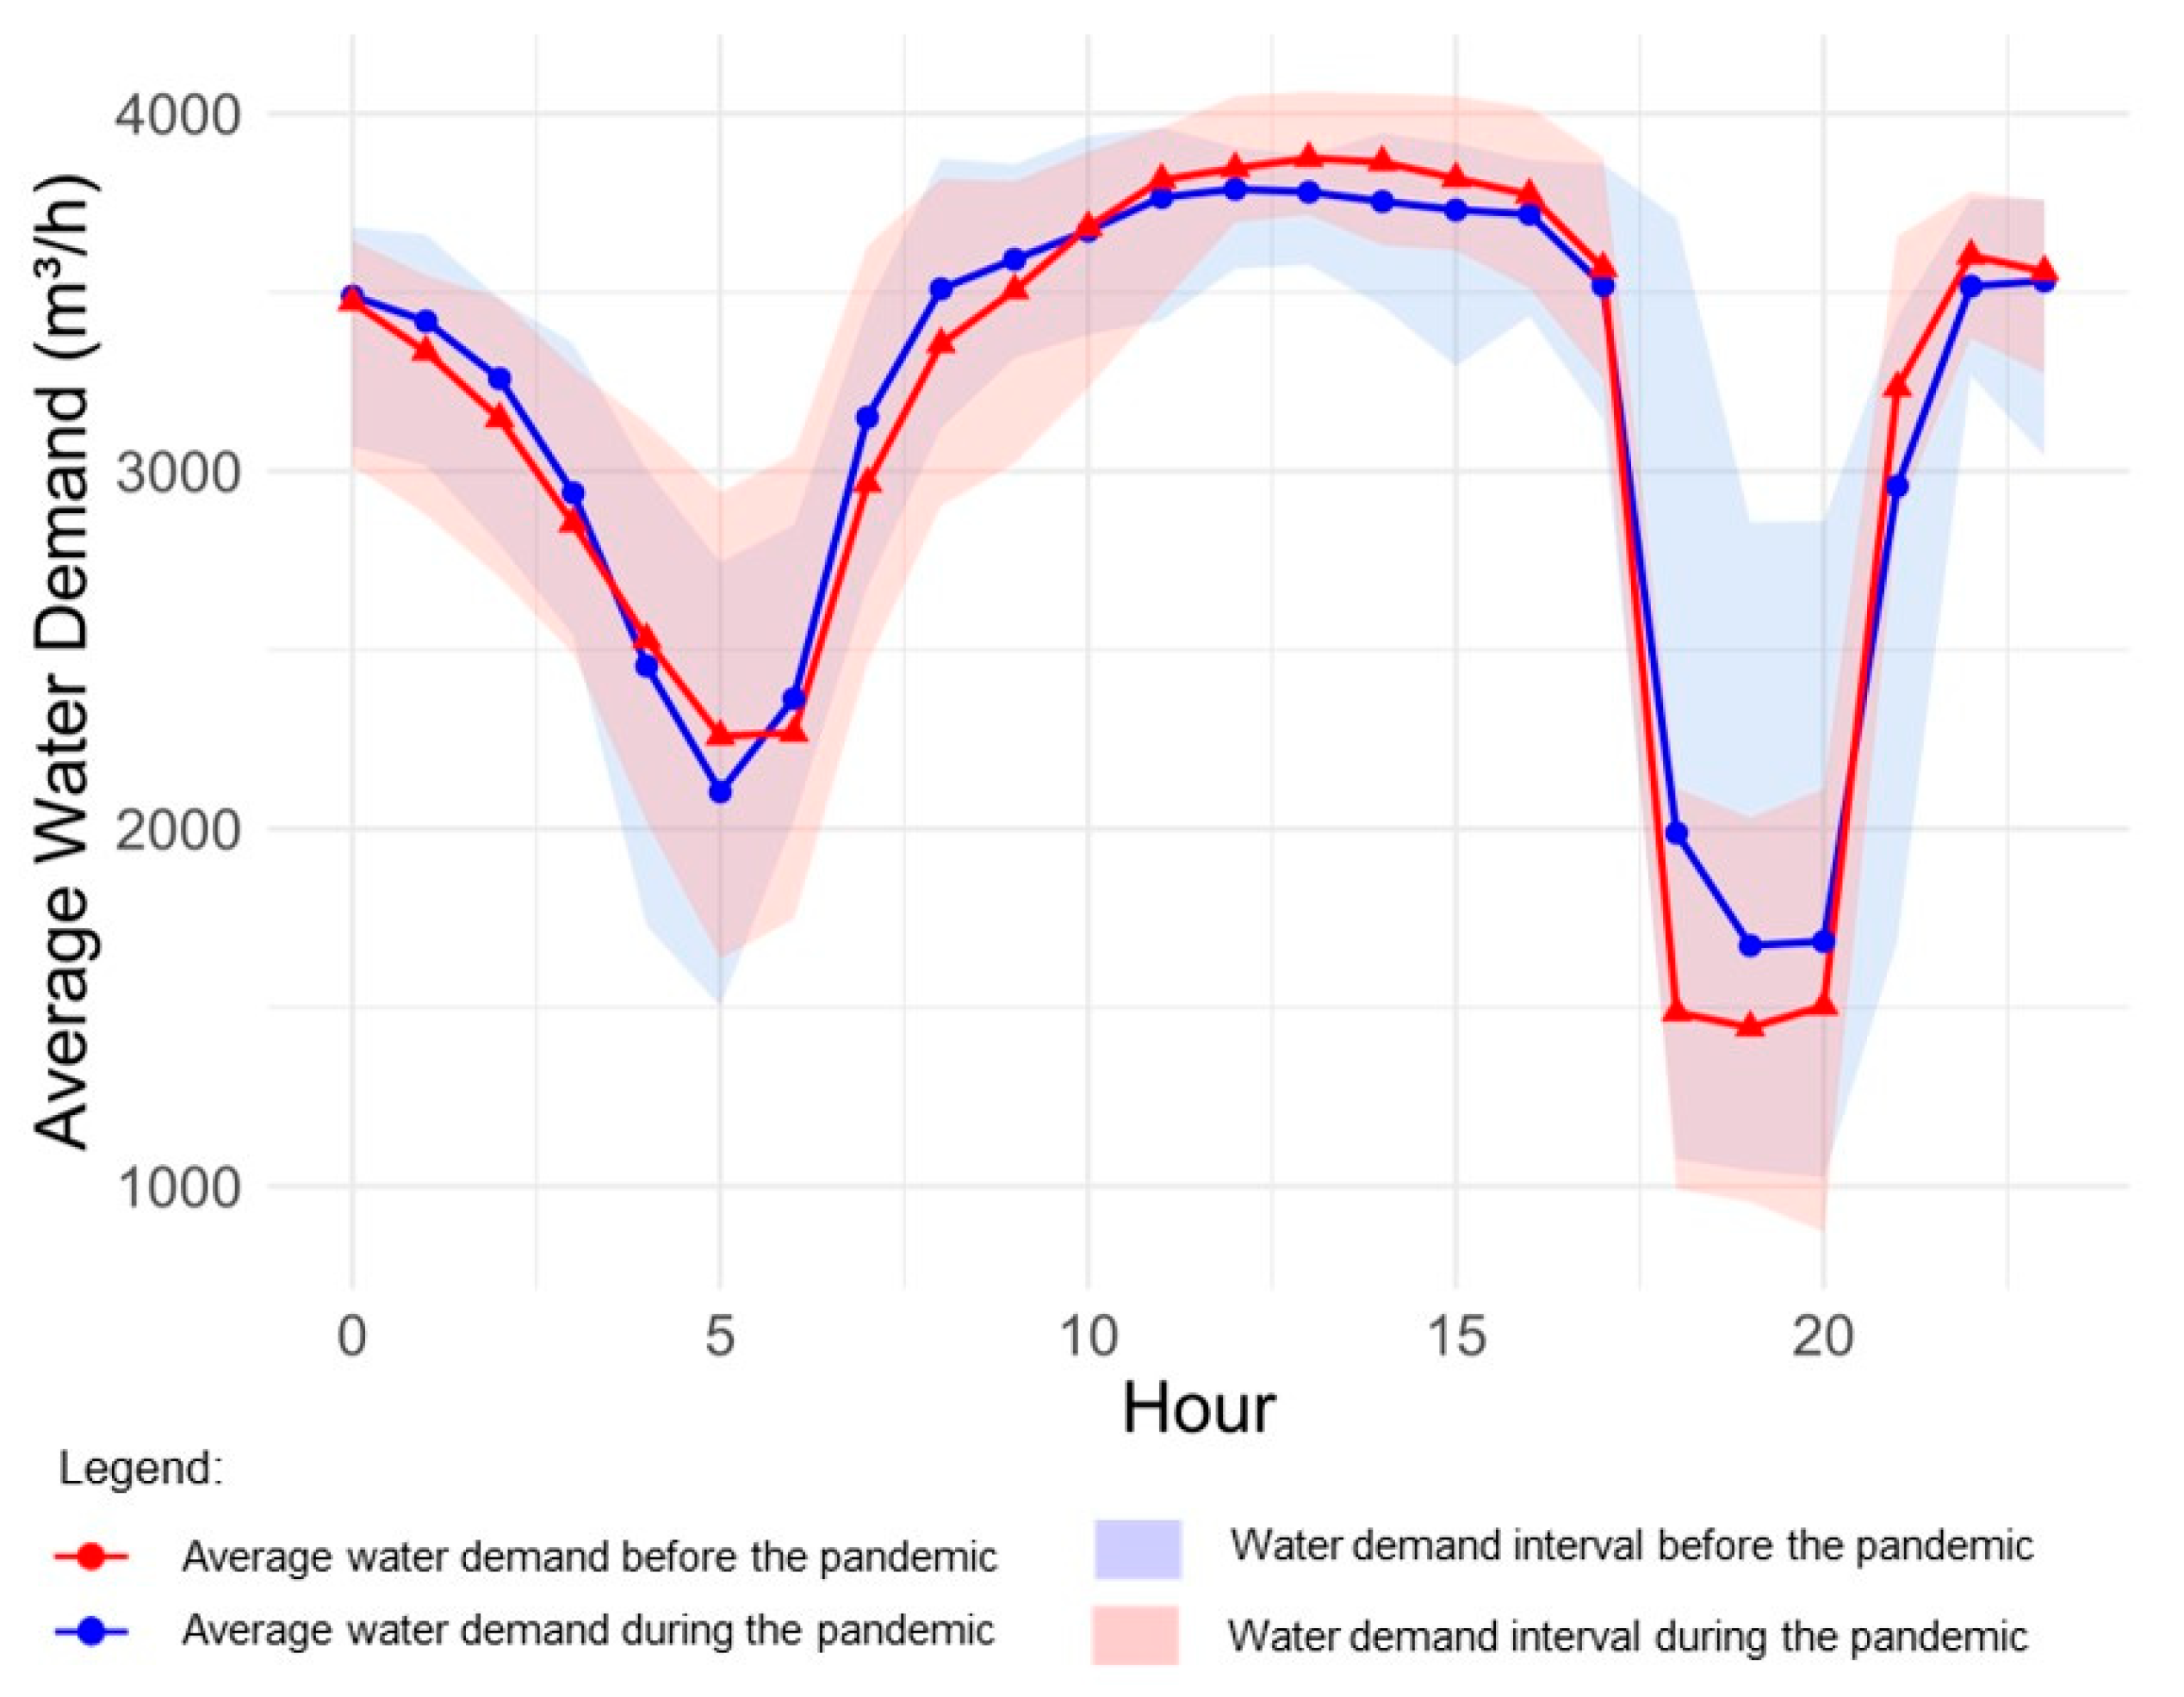
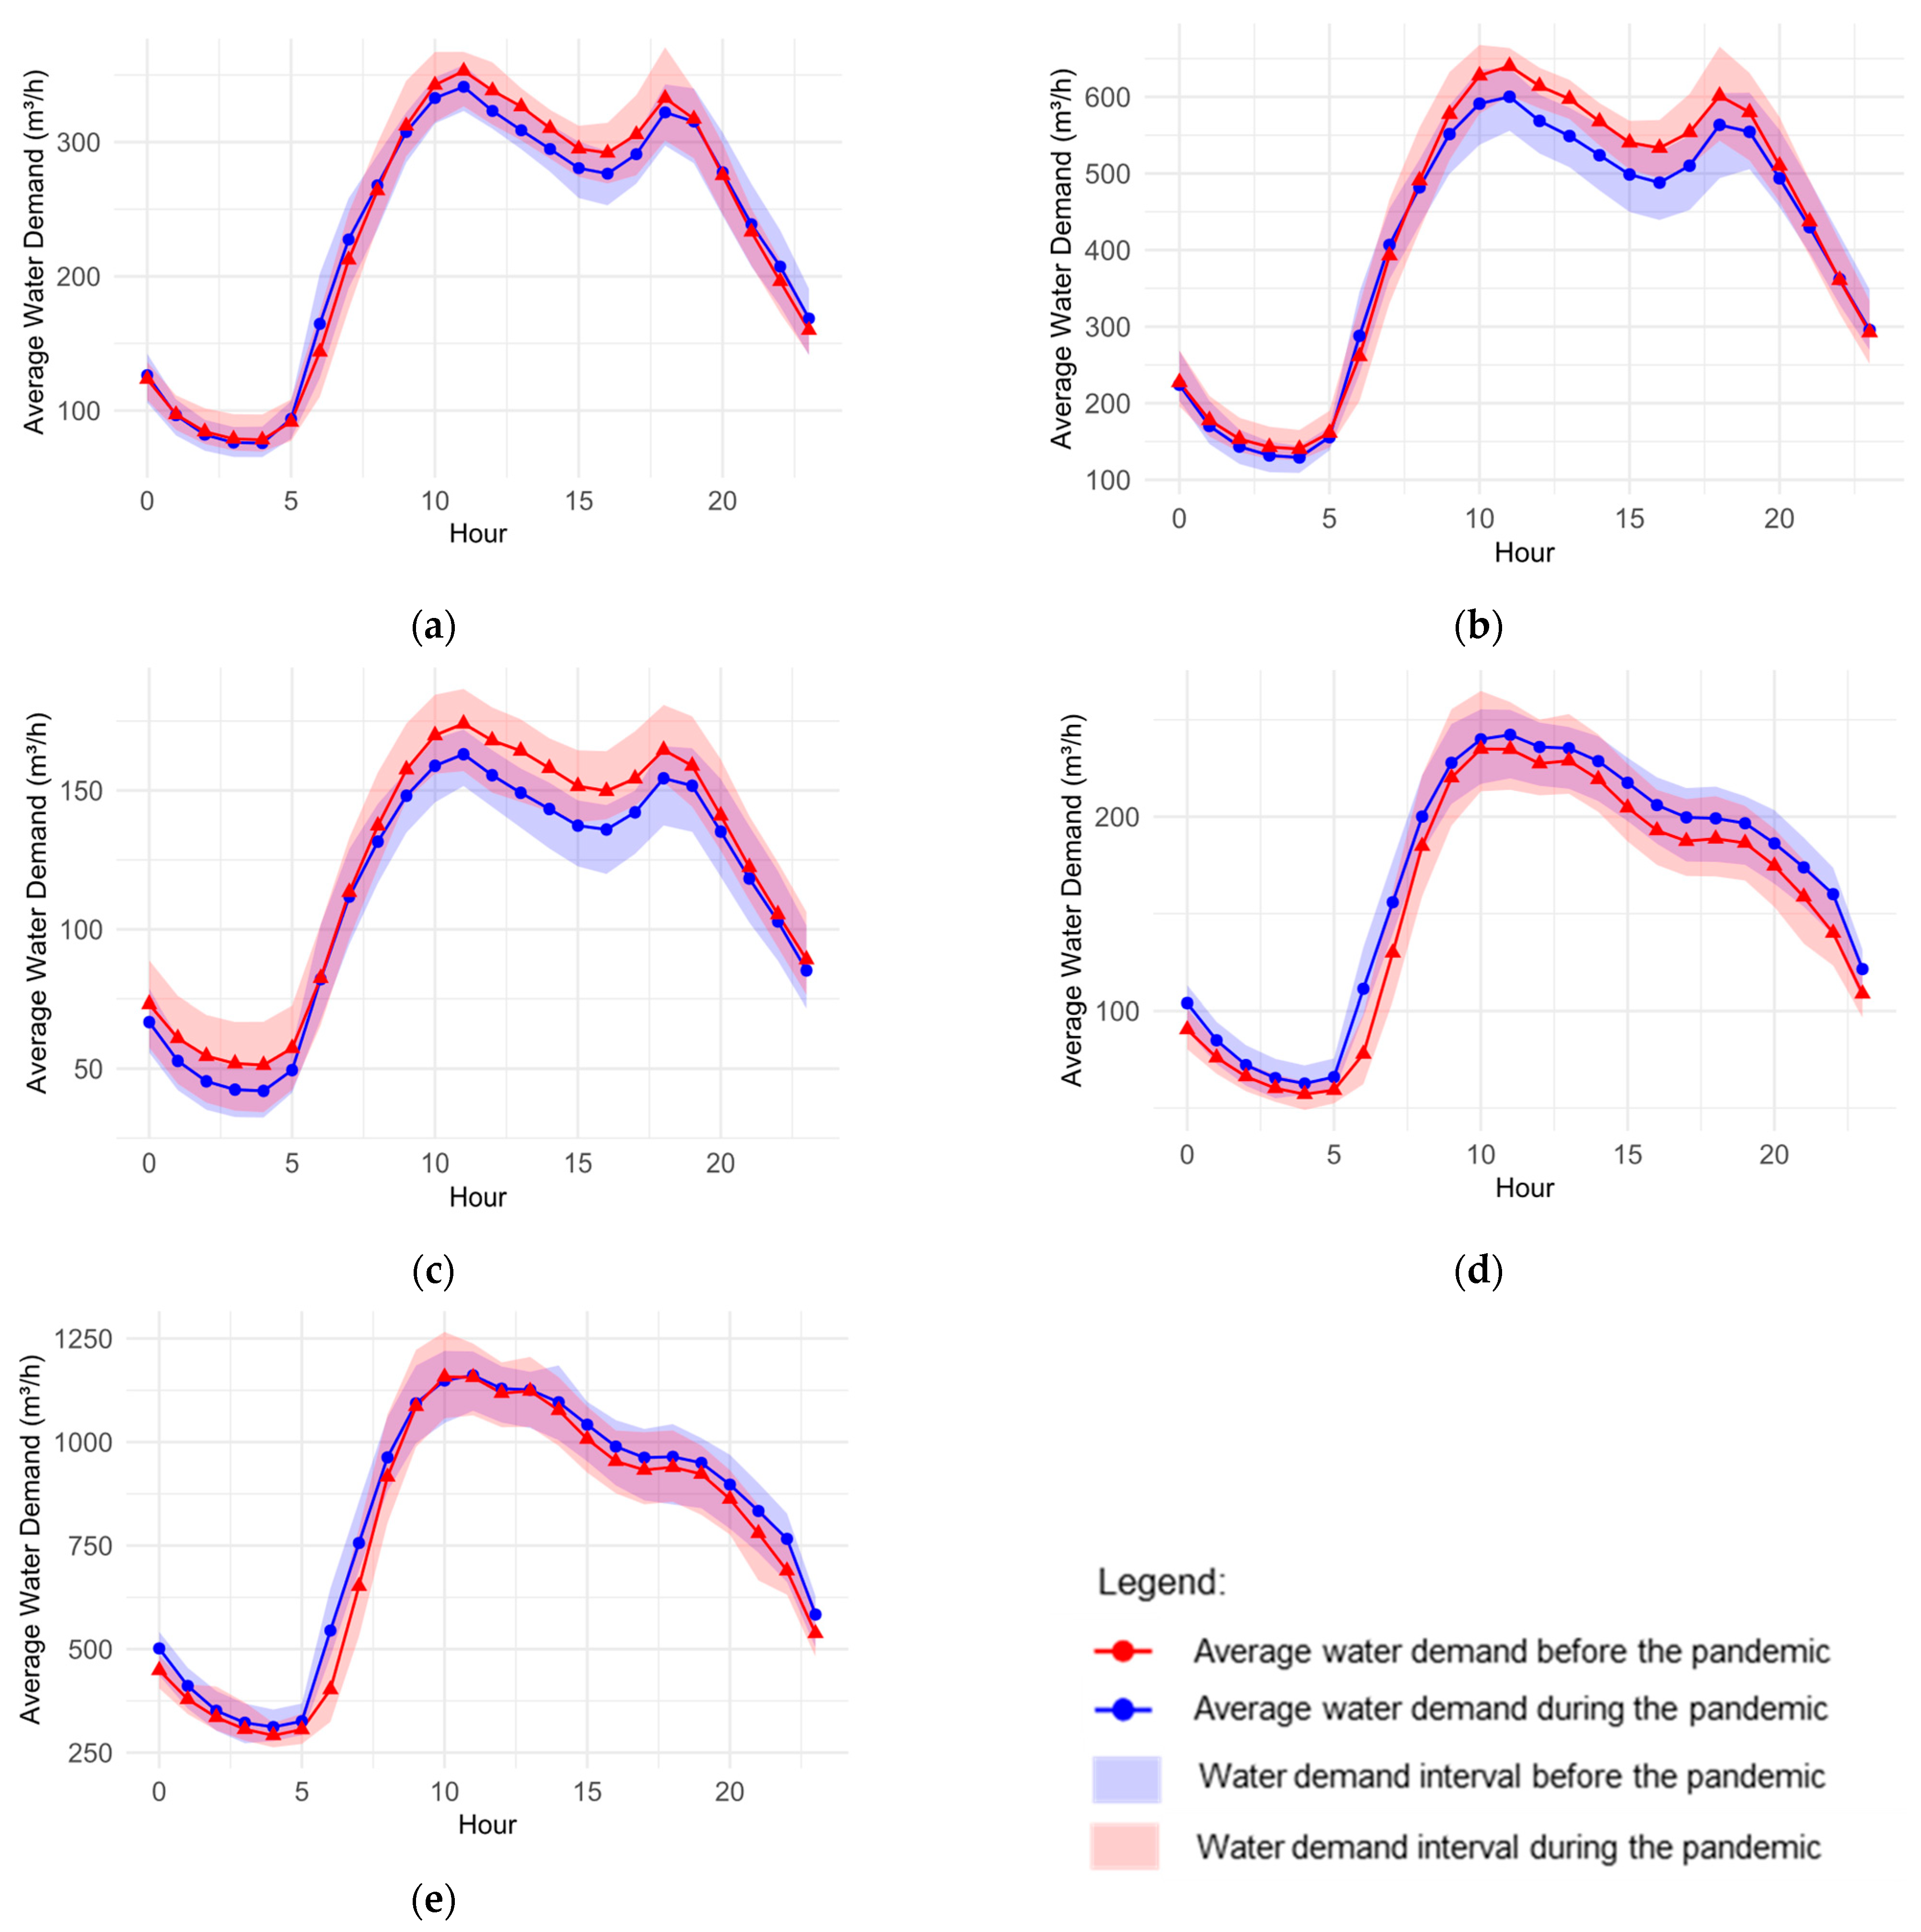
3.4. Effect on the Hourly Demand Patterns
4. Conclusions
Author Contributions
Funding
Data Availability Statement
Conflicts of Interest
References
- Sitzenfrei, R.; Diao, K.; Butler, D. Resilience of Interdependent Urban Water Systems. Water 2022, 14, 440. [Google Scholar] [CrossRef]
- Thelemaque, N.; Spearing, L.A.; Faust, K.M.; Kaminsky, J.A. Small Drinking Water Utilities’ Resilience: The Case of the COVID-19 Pandemic. ACS EST Water 2023, 3, 1172–1181. [Google Scholar] [CrossRef]
- Pamidimukkala, A.; Kermanshachi, S.; Adepu, N.; Safapour, E. Resilience in Water Infrastructures: A Review of Challenges and Adoption Strategies. Sustainability 2021, 13, 12986. [Google Scholar] [CrossRef]
- UN-Water Water Security and the Global Water Agenda: A UN-Water Analytical Brief. United Nations. 2013. Available online: https://www.unwater.org/publications/water-security-and-global-water-agenda (accessed on 6 January 2025).
- Almouiri, F.; Wegian, F. A Comparative Study for the Variables Affecting Municipal Water Demand. MEJ Mansoura Eng. J. 2021, 31, 10–14. [Google Scholar] [CrossRef]
- Shuang, Q.; Zhao, R.T. Water Demand Prediction Using Machine Learning Methods: A Case Study of the Beijing–Tianjin–Hebei Region in China. Water 2021, 13, 310. [Google Scholar] [CrossRef]
- Cahill, J.; Hoolohan, C.; Lawson, R.; Browne, A.L. COVID-19 and Water Demand: A Review of Literature and Research Evidence. Wiley Interdiscip. Rev. Water 2022, 9, e1570. [Google Scholar] [CrossRef]
- Thelemaque, N.; Spearing, L.A.; Faust, K.M.; Kaminsky, J. Water Utilities and the COVID-19 Pandemic: A Review of Pandemic-Related Research. In Proceedings of the Construction Research Congress, Arlington, Virginia, 9–12 March 2022; American Society of Civil Engineers: Arlington, Virginia, 2022; pp. 501–511. [Google Scholar]
- Campos, M.A.S.; Carvalho, S.L.; Melo, S.K.; Gonçalves, G.B.F.R.; Dos Santos, J.R.; Barros, R.L.; Morgado, U.T.M.A.; Da Silva Lopes, E.; Abreu Reis, R.P. Impact of the COVID-19 Pandemic on Water Consumption Behaviour. Water Supply 2021, 21, 4058–4067. [Google Scholar] [CrossRef]
- Abu-Bakar, H.; Williams, L.; Hallett, S.H. Quantifying the Impact of the COVID-19 Lockdown on Household Water Consumption Patterns in England. NPJ Clean Water 2021, 4, 13. [Google Scholar] [CrossRef]
- Kalbusch, A.; Henning, E.; Brikalski, M.P.; Luca, F.V.D.; Konrath, A.C. Impact of Coronavirus (COVID-19) Spread-Prevention Actions on Urban Water Consumption. Resour. Conserv. Recycl. 2020, 163, 105098. [Google Scholar] [CrossRef] [PubMed]
- Rahaman, M.M.; Hossain, A.Z.N.; Zisan, Z.; Rahman, M.M. Changes in Global Domestic Water Use Due to Handwashing for Preventing COVID-19: An Assessment. Water 2023, 15, 1219. [Google Scholar] [CrossRef]
- Buurman, J.; Freiburghaus, M.; Castellet-Viciano, L. The Impact of COVID-19 on Urban Water Use: A Review. Water Supply 2022, 22, 7590–7602. [Google Scholar] [CrossRef]
- Cominato, C.; Sborz, J.; Kalbusch, A.; Henning, E. Water Demand Profile before and during COVID-19 Pandemic in a Brazilian Social Housing Complex. Heliyon 2022, 8, e10307. [Google Scholar] [CrossRef] [PubMed]
- Alvisi, S.; Franchini, M.; Luciani, C.; Marzola, I.; Mazzoni, F. Effects of the COVID-19 Lockdown on Water Consumptions: Northern Italy Case Study. J. Water Resour. Plann. Manage. 2021, 147, 05021021. [Google Scholar] [CrossRef]
- Lüdtke, D.U.; Luetkemeier, R.; Schneemann, M.; Liehr, S. Increase in Daily Household Water Demand during the First Wave of the Covid-19 Pandemic in Germany. Water 2021, 13, 260. [Google Scholar] [CrossRef]
- Kazak, J.K.; Szewrański, S.; Pilawka, T.; Tokarczyk-Dorociak, K.; Janiak, K.; Świąder, M. Changes in Water Demand Patterns in a European City Due to Restrictions Caused by the COVID-19 Pandemic. Desalination Water Treat. 2021, 222, 1–15. [Google Scholar] [CrossRef]
- Berglund, E.Z.; Buchberger, S.; Cunha, M.; Faust, K.M.; Giacomoni, M.; Goharian, E.; Kleiner, Y.; Lee, J.; Ostfeld, A.; Pasha, F.; et al. Effects of the COVID-19 Pandemic on Water Utility Operations and Vulnerability. J. Water Resour. Plann. Manage. 2022, 148, 04022027. [Google Scholar] [CrossRef]
- Walker, N.L.; Styles, D.; Williams, A.P. Water Sector Resilience in the United Kingdom and Ireland: The COVID-19 Challenge. Util. Policy 2023, 82, 101550. [Google Scholar] [CrossRef]
- IBGE Demographic Census. Brazilian Institute of Geography and Statistics. 2024. Available online: https://cidades.ibge.gov.br/brasil/pr/maringa/panorama (accessed on 6 January 2025).
- IBGE Brazilian Territorial Area. Brazilian Institute of Geography and Statistics. 2022. Available online: https://www.ibge.gov.br/geociencias/organizacao-do-territorio/estrutura-territorial/15761-areas-dos-municipios.html?t=acesso-ao-produto&c=4115200 (accessed on 6 January 2025).
- Brasil National Sanitation Information System (SNIS): 2022 Diagnosis; Ministry of Regional Development; National Secretariat of Sanitation: Josefov, Czech Republic, 2022.
- AMPLA Water Supply and Sanitation—Part 1. Municipal Basic Sanitation Plan of Maringá (PMSB). 2011. Available online: https://www.maringa.pr.gov.br/saneamento/pmsb1.pdf (accessed on 6 January 2025).
- Maringá. Complementary Law No. 888. Replaces Complementary Law No. 331/99, Which Regulates Land Use and Occupation in the Municipality of Maringá and Other Provisions. Available online: https://leismunicipais.com.br/a/pr/m/maringa/lei-complementar/2011/89/888/lei-complementar-n-888-2011-substitui-a-lei-complementar-n-331-99-que-dispoe-sobre-o-uso-e-ocupacao-do-solo-no-municipio-de-maringa-e-da-outras-providencias (accessed on 25 January 2025).
- Complex-Lab Observatório COVID-19 Maringá. Available online: http://complex.pfi.uem.br/covid/ (accessed on 13 December 2024).
- Gharabaghi, S.; Stahl, E.; Bonakdari, H. Integrated Nonlinear Daily Water Demand Forecast Model (Case Study: City of Guelph, Canada). J. Hydrol. 2019, 579, 124182. [Google Scholar] [CrossRef]
- Said, S.E.; Dickey, D.A. Testing for Unit Roots in Autoregressive-Moving Average Models of Unknown Order. Biometrika 1984, 71, 599–607. [Google Scholar] [CrossRef]
- Bakchan, A.; Roy, A.; Faust, K.M. Impacts of COVID-19 Social Distancing Policies on Water Demand: A Population Dynamics Perspective. J. Environ. Manag. 2022, 302, 113949. [Google Scholar] [CrossRef]
- Mohamed, M.M.; Al-Mualla, A.A. Water Demand Forecasting in Umm Al-Quwain Using the Constant Rate Model. Desalination 2010, 259, 161–168. [Google Scholar] [CrossRef]
- Donkor, E.A.; Mazzuchi, T.A.; Soyer, R.; Alan Roberson, J. Urban Water Demand Forecasting: Review of Methods and Models. J. Water Resour. Plann. Manage. 2014, 140, 146–159. [Google Scholar] [CrossRef]
- Pesantez, J.E.; Berglund, E.Z.; Kaza, N. Smart Meters Data for Modeling and Forecasting Water Demand at the User-Level. Environ. Model. Softw. 2020, 125, 104633. [Google Scholar] [CrossRef]
- Alnsour, M.A.; Ijam, A.Z. Specifying a Cascade Water Demand Forecasting Model Using Time-Series Analysis: A Case of Jordan. Sustain. Water Resour. Manag. 2023, 9, 37. [Google Scholar] [CrossRef]
- Maringá Monthly Precipitation Heights Report. Hydrological Information System (SIH). Available online: http://www.sih-web.aguasparana.pr.gov.br/sih-web/gerarRelatorioAlturasMensaisPrecipitacao.do?action=carregarInterfaceInicial (accessed on 25 January 2025).
- Wooldridge, J.M. Specification Testing and Quasi-Maximum- Likelihood Estimation. J. Econom. 1991, 48, 29–55. [Google Scholar] [CrossRef]
- Chicco, D.; Warrens, M.J.; Jurman, G. The Coefficient of Determination R-Squared Is More Informative than SMAPE, MAE, MAPE, MSE and RMSE in Regression Analysis Evaluation. PeerJ Comput. Sci. 2021, 7, e623. [Google Scholar] [CrossRef]
- Menneer, T.; Qi, Z.; Taylor, T.; Paterson, C.; Tu, G.; Elliott, L.R.; Morrissey, K.; Mueller, M. Changes in Domestic Energy and Water Usage during the UK COVID-19 Lockdown Using High-Resolution Temporal Data. Int. J. Environ. Res. Public Health 2021, 18, 6818. [Google Scholar] [CrossRef]
- Makpiboon, C.; Pornprommin, A.; Lipiwattanakarn, S. Impacts of weather variables on urban water demand at multiple temporal scales. Int. J. GEOMATE 2020, 18, 71–77. [Google Scholar] [CrossRef]
- Daw, M.M.; Ali, E.R.; Toriman, M.E. Determinants of Urban Residential Water Demand in Libya. Int. J. Innov. Sustain. Dev. 2019, 8, 847–856. [Google Scholar] [CrossRef]
- De Bodas Terassi, P.M.; Baratto, J.; Oscar-Júnior, A.C.D.S.; Galvani, E.; Sobral, B.S.; Gois, G.D.; Oliveira, T.A.D.; Biffi, V.H.R. Trends and Shifts of Climate Extremes in Eastern Paraná State, Brazil. Theor. Appl. Climatol. 2024, 155, 6863–6886. [Google Scholar] [CrossRef]
- Penereiro, J.C. Climatic Trends of Temperatures and Precipitation in Brazilian Localities. Acta Sci. Technol. 2020, 42, e44359. [Google Scholar] [CrossRef]


| Secondary Feeder | Characteristics of the Sub Feeder | Type of Land Use of Zone Supplied |
|---|---|---|
| PF-02 | Gravity supply system for the Parque Tuiuti region and surroundings | Residential zone with the presence of trade and service axes |
| PF-03 | Gravity supply system for the north region, Cidade Nova, Miosótis, and surroundings | Residential zone with the presence of urban voids and predominance of single-story houses |
| PF-04 | Gravity supply system for the University reserve center and Jardim Canadá | Residential zone with the presence of trade and service axes |
| PF-05 | Pressured supply system for the low-elevation zones Pedro Tanques and Jardim Alvorada | Residential zone with the presence of trade and service axes |
| PF-06 | Pressured supply system to Downtown 1 and neighborhoods | Trade zone with a predominance of commercial axes, in addition to residential areas featuring residential buildings |
| PF-07 | Pressured supply system to Downtown 2 | Trade zone with a predominance of commercial axes |
| PF-08 | Pressured supply system to tanks in Maringá Velho 1 | Residential zone |
| PF-09 | Pressured supply system to tanks in Maringá Velho 2 | Residential zone |
| PF-10 | Pressured supply system to tanks in Jardim América | Residential zone with predominance of single-story houses |
| Sub-Feeder | Test Statistic | Critical Value | p-Value | Stationarity (95%) |
|---|---|---|---|---|
| PF-01 | −4.324 | −2.951 | 0.0004 | Stationary |
| PF-02 | −4.047 | −2.948 | 0.0012 | Stationary |
| PF-03 | −2.743 | −2.948 | 0.0669 | Non-Stationary |
| PF-04 | −3.653 | −2.948 | 0.0048 | Stationary |
| PF-05 | −2.663 | −2.948 | 0.0806 | Non-Stationary |
| PF-06 | −3.124 | −2.951 | 0.0248 | Stationary |
| PF-07 | −9.939 | −2.951 | 0.0018 | Stationary |
| PF-08 | −1.739 | −2.986 | 0.411 | Non-Stationary |
| PF-09 | −3.194 | −2.948 | 0.0204 | Stationary |
| PF-10 | −3.654 | −2.951 | 0.0048 | Stationary |
| Sub-Feeder | Correlation | SDP | R2adjusted | ||||||
|---|---|---|---|---|---|---|---|---|---|
| p | p | p | |||||||
| PF-01 | 0.657 | −0.086 | 128.265 | 0 | −0.9986 | 0.092 | 106.2 | 0.23 | 0.994 |
| PF-02 | 0.372 | −0.211 | 9.328 | 0 | −0.069 | 0.167 | 12.71 | 0.097 | 0.992 |
| PF-03 | 0.451 | −0.294 | 16.610 | 0 | −0.140 | 0.071 | 35.36 | 0.004 | 0.994 |
| PF-04 | 0.422 | −0.134 | 15.291 | 0 | −0.115 | 0.163 | 12.45 | 0.316 | 0.992 |
| PF-05 | 0.266 | −0.184 | 4.573 | 0 | −0.029 | 0.243 | 13.44 | 0.001 | 0.992 |
| PF-06 | 0.579 | 0.033 | 6.873 | 0 | −0.064 | 0.047 | −5.724 | 0.233 | 0.993 |
| PF-07 | 0.547 | −0.070 | 33.074 | 0 | −0.312 | 0.055 | −5.21 | 0.828 | 0.993 |
| PF-08 | 0.575 | −0.049 | 3.229 | 0 | −0.027 | 0.083 | 3.323 | 0.158 | 0.993 |
| PF-09 | 0.457 | −0.103 | 21.835 | 0 | −0.194 | 0.096 | 23.12 | 0.187 | 0.992 |
| PF-10 | 0.795 | 0.107 | 13.896 | 0 | −0.079 | 0.171 | 8.995 | 0.301 | 0.995 |
Disclaimer/Publisher’s Note: The statements, opinions and data contained in all publications are solely those of the individual author(s) and contributor(s) and not of MDPI and/or the editor(s). MDPI and/or the editor(s) disclaim responsibility for any injury to people or property resulting from any ideas, methods, instructions or products referred to in the content. |
© 2025 by the authors. Licensee MDPI, Basel, Switzerland. This article is an open access article distributed under the terms and conditions of the Creative Commons Attribution (CC BY) license (https://creativecommons.org/licenses/by/4.0/).
Share and Cite
Bolonhez, B.F.; Silva, A.R.d.; Paulo, J.G.C.; Flores, C.F.; Pinheiro, H.D. The Impact of Social Distancing Policies on Water Distribution Systems During COVID-19: The Case of Maringá, Brazil. Urban Sci. 2025, 9, 39. https://doi.org/10.3390/urbansci9020039
Bolonhez BF, Silva ARd, Paulo JGC, Flores CF, Pinheiro HD. The Impact of Social Distancing Policies on Water Distribution Systems During COVID-19: The Case of Maringá, Brazil. Urban Science. 2025; 9(2):39. https://doi.org/10.3390/urbansci9020039
Chicago/Turabian StyleBolonhez, Bruna Forestieri, André Rodrigues da Silva, Juliana Gomes Costa Paulo, Carolina Fiamonzini Flores, and Hemerson Donizete Pinheiro. 2025. "The Impact of Social Distancing Policies on Water Distribution Systems During COVID-19: The Case of Maringá, Brazil" Urban Science 9, no. 2: 39. https://doi.org/10.3390/urbansci9020039
APA StyleBolonhez, B. F., Silva, A. R. d., Paulo, J. G. C., Flores, C. F., & Pinheiro, H. D. (2025). The Impact of Social Distancing Policies on Water Distribution Systems During COVID-19: The Case of Maringá, Brazil. Urban Science, 9(2), 39. https://doi.org/10.3390/urbansci9020039