Article

Dynamics of Changes in Spatial Patterns of Built-Up Areas in Two Metropolitan Areas of Grand Lomé and Greater Accra (West Africa)

by
Adjowa Yéwa Tossoukpe
1,2,*,
Jaiye Dukiya
3,
Fousseni Folega
2,
Michael Thiel
4 and
Appollonia Aimiosino Okhimamhe
1,5
1
Climate Change and Human Habitat Centre, West African Science Service Centre on Climate Change and Adapted Land Use, Federal University of Technology, Minna 920101, Niger State, Nigeria
2
Laboratory of Botany and Plant Ecology, Department of Botany, Faculty of Sciences, University of Lomé, Lomé BP 1515, Togo
3
Department of Urban and Regional Planning, Federal University of Technology, Minna 920101, Niger State, Nigeria
4
Earth Observation Research, Institute for Geography and Geology, University of Würzburg, John-Skilton-Str. 4A, 97074 Würzburg, Germany
5
Department of Geography, Federal University of Technology, Minna 920101, Niger State, Nigeria
*
Author to whom correspondence should be addressed.
Urban Sci. 2025, 9(3), 84; https://doi.org/10.3390/urbansci9030084
Submission received: 18 January 2025 / Revised: 9 March 2025 / Accepted: 9 March 2025 / Published: 16 March 2025

Abstract

:
Urbanization and population growth in West Africa have significantly altered land use and land cover (LULC), raising environmental concerns. This study examines urban land use patterns in the District Autonome du Grand Lomé (DAGL) and Greater Accra Metropolitan Area (GAMA) from 1986 to 2023 and from 1991 to 2023, respectively, using geospatial techniques and the Google Earth Engine (GEE). Previous research has overlooked the complexity of land use patterns and the directional analysis of urban expansion, which are vital for understanding urbanization drivers. This study addresses these gaps by comparing the two metropolitan areas, revealing a dramatic decline in verdant landscapes, with forested areas in DAGL decreasing from 24% in 1986 to 3% by 2023, and from 34% in 1991 to 2% in GAMA. Grasslands also diminished significantly, while built-up areas expanded from 18% to 62% in DAGL and from 10% to 70% in GAMA. The Urban Expansion Intensity Index (UEII) indicates rapid urban growth, with DAGL at 1.19% and GAMA at 1.88%. Directional analyses reveal that urban expansion predominantly occurs toward the northwest in DAGL and both northeast and northwest in GAMA, highlighting the need for effective urban planning and land management to preserve natural landscapes amidst ongoing urbanization challenges.

1. Introduction

The rapid urbanization and development in recent decades, particularly in developing countries, have significantly altered land use and land cover (LULC), raising global concerns [1]. According to recent United Nations estimates, over 55% of the world’s population currently resides in urban areas, a figure projected to rise to 68% by 2050, which would be approximately 6.3 billion urban inhabitants [2]. More than half of the global increase is expected to take place in sub-Saharan Africa, resulting in high urbanization rates across the region. The combined effects of migration and urbanization have driven cities in this area to grow and develop [3].
Urbanization in West Africa is one of the fastest growing in the world with the District Autonome du Grand Lomé (DAGL) in Togo and the Greater Accra Metropolitan Area (GAMA) in Ghana being typical examples of cities experiencing rapid population growth. Urban migration and natural population growth are the main causes of the rapid expansion and physical development, making DAGL and GAMA the largest and most populated cities in Togo and Ghana, respectively [4,5]. Both cities face a number of issues, including unregulated land markets, unstable land tenure, segregated neighborhoods, and poor infrastructure and housing. Additionally, uncontrolled urban expansion has resulted in urban sprawl, characterized by low-density development [6,7]. Furthermore, the demand for housing has increased due to both countries’ growing urban populations, which has led to a significant shortfall of 1.8 million units in Ghana and 500,000 units in Togo [7]. Moreover, while Togo and Ghana have established laws and policies to regulate urban expansion and protect natural resources, such as Togo’s Decree No 67_228 on town planning, Togo’s National Housing Strategy, Ghana’s Land Use and Spatial Planning Act of 2016, and Ghana’s National Housing Policy, their effectiveness is limited. Both countries struggle to adequately manage informal settlements prevalent in urban areas like DAGL and GAMA. Weak enforcement of these policies has resulted in unregulated development, and constructions in waterways result in yearly floods and structural imbalances within these rapidly urbanizing cities.
From the perspective of LULC, the expansion of cities transforms natural habitats into populated, industrial areas causing habitat destruction and fragmentation that negatively impacts forests, croplands, wetlands, and grasslands by splitting these ecosystems into small and isolated patches [8,9]. For efficient land management, monitoring and assessing the spatial and temporal dynamics of urban land use are essential to comprehending the impacts of urban growth, developing effective plans for sustainable urban development, and achieving UN Sustainable Development Goal 11, which calls for the establishment of inclusive and resilient societies by 2030. This involves diverse approaches, such as advanced remote sensing, geographic information systems (GIS), complex computer models, and community-driven data collection. Remote sensing utilizes satellite imagery to provide high-resolution spatial and temporal data for accurately tracking land use and urban growth over large areas [10]. Traditional methods relying on visual and computer-aided interpretation often yield coarse results in heterogeneous landscapes [11]. Recent advancements in geospatial technology, particularly cloud-based platforms like Google Earth Engine (GEE), enable extensive analysis of urban growth patterns and large-scale LULC mapping across the continent.
Few studies have been conducted in DAGL and GAMA to examine urban land use patterns and environmental challenges. Using surveys, time series analysis of land use using Landsat images, and documentary research, Somadjago et al. [12] examined the socio-economic and demographic changes brought about by DAGL’s quick expansion into its periphery, highlighting the growth of urban areas and changes in land use. Similar findings have been reported by Blakime et al. [13], who examined Landsat data from 2007 to 2020 and showed that residential areas had grown dramatically at the expense of green and agricultural regions. In terms of biodiversity and environmental effects, Takili et al. [14] and Amouzoukpo [15] found that the municipalities of Adetikope and Agoènyivé had a considerable decline in plant diversity, with the bulk of the buildings in Adetikope having modern textures. Despite their emphasis on urban growth, most studies lacked a more comprehensive analysis of the land use pattern and the landscape’s heterogeneity.
A number of investigations have been carried out in GAMA to examine the effects of fast urban expansion employing remote-sensing techniques and landscape metrics. Asabere et al. [16] explored the effects of fast urbanization on the spatial–environmental evolution of major metropolitan regions in Ghana, including GAMA, based on Landsat satellite data and landscape metrics, revealing significant fragmentation due to built-up land at the expense of natural land cover classes. Similarly, Toure et al. [17] examined the land use composition and expansion of GAMA and Kumasi from 2000 to 2010, with a combination of remote-sensing methods and spatial metrics, showing fragmentation along the urban–rural interface with settlement as the predominant land use. Many researchers have drawn attention to the detrimental effects of urban expansion on ecosystem services and green spaces, as well as on biodiversity [18,19,20].
Although previous research on DAGL and GAMA has provided insights into urban expansion and socio-economic and demographic changes, there remains a significant gap in the comprehensive analysis of land use patterns as a complex system. Notably, these studies often lack a focus on directional analysis of urban growth, which is essential for understanding spatial patterns and the forces driving urbanization. Addressing these gaps required advanced methodologies, such as cloud-based remote-sensing systems like GEE. GEE enhances analytical capabilities by providing extensive datasets, improved temporal data quality, and robust computational tools, making it valuable for geographic analysis and secure data management [21]. By combining GEE with GIS and machine-learning algorithms, this study aims to characterize the dynamics of changes in the spatial patterns of urban land use in DAGL and GAMA. Specifically, it focuses on (i) mapping LULC changes and (ii) analyzing directionally the spatial urban expansion. The comprehensive analysis integrates the Urban Expansion Intensity Index (UEII) with the LULC change pattern, providing a nuanced understanding of complex urban dynamics in these regions. The findings will support the development of more effective urban planning and environmental management strategies, informing evidence-based policies for sustainable ecosystem management and urban development in West African metropolitan areas. By comparing DAGL and GAMA, this study offers valuable insights into how urbanization processes manifest differently across distinct metropolitan environments, addressing gaps in the literature regarding the evolution direction of urban expansion in these specific contexts.

2. Materials and Methods
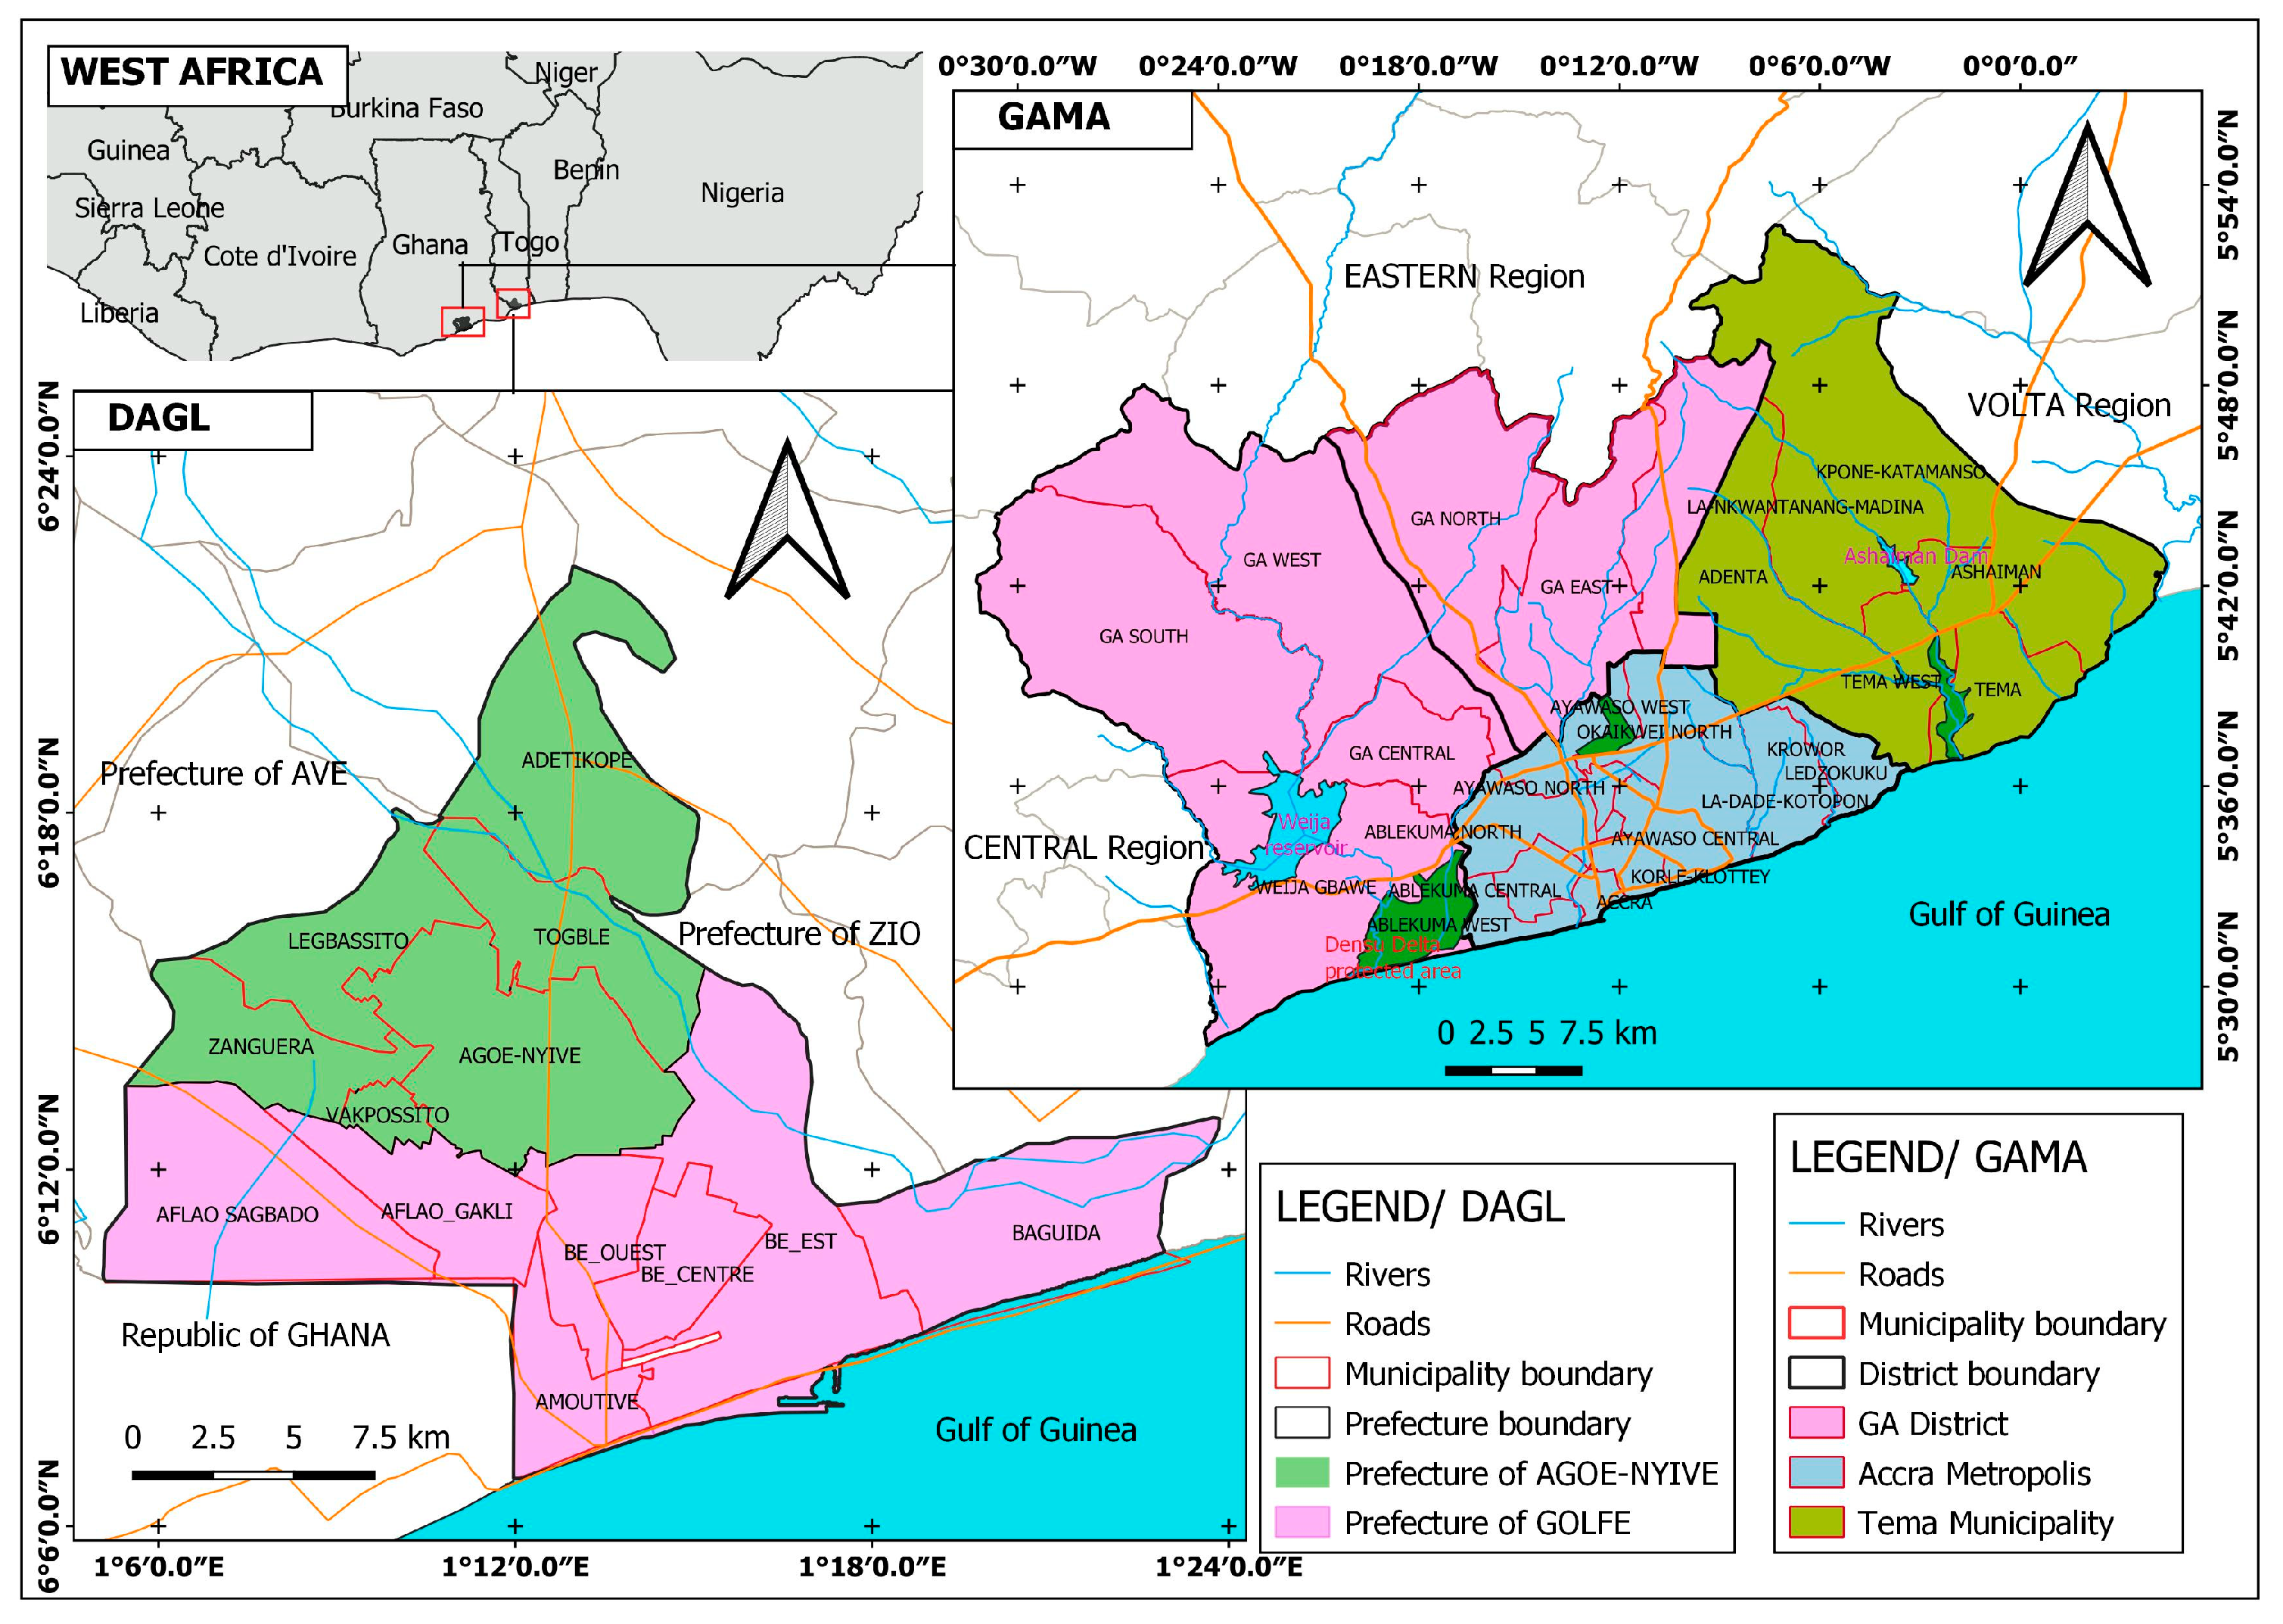
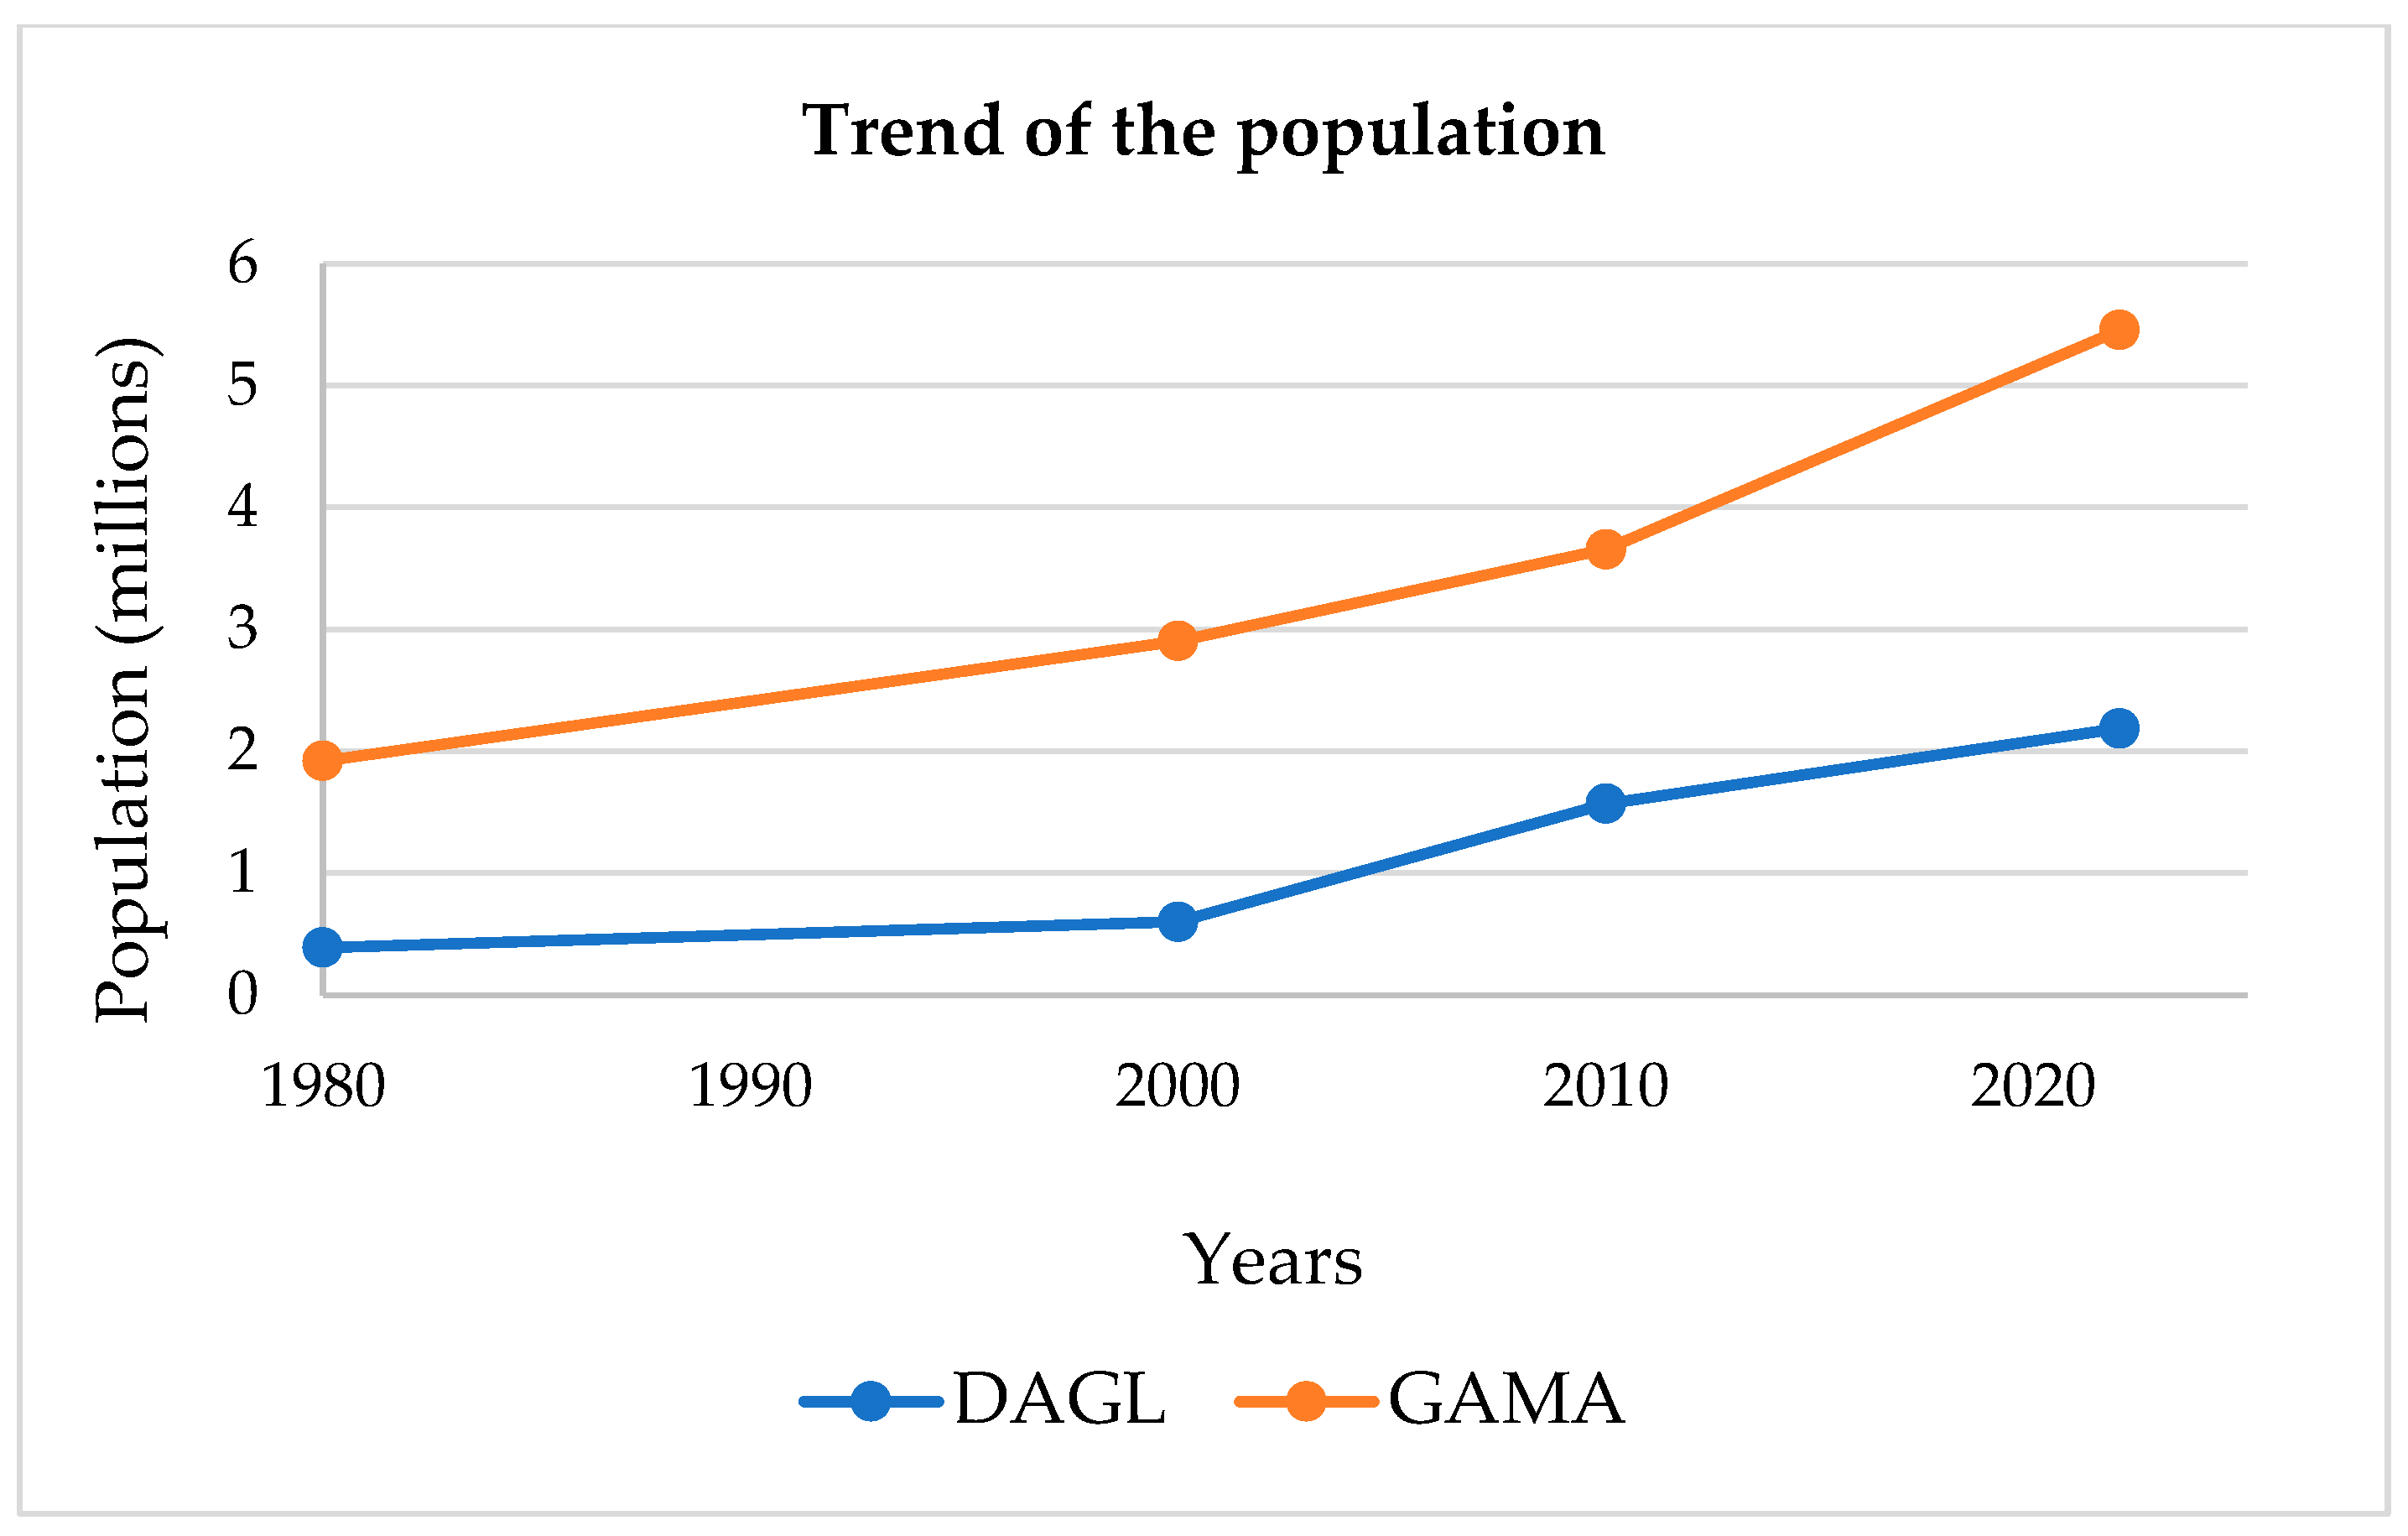
2.1. Study Area

The areas of interest in this study are DAGL in Togo and GAMA in Ghana, which cover 382 km2 and 1585 km2, respectively. Both capital cities are located on the Atlantic coast of the Gulf of Guinea (Figure 1).
From 1980 to 2022, there have been significant increases in the populations of DAGL and GAMA (Figure 2). As of the latest estimates from the General Census on Population and Habitat [4], DAGL has a population of over 2 million people (2,188,376 inhabitants), with an annual growth rate of 2.6%. In contrast, GAMA has a population exceeding 5 million residents (5,455,692 inhabitants), with an estimated growth rate of 2.9% based on the Ghana Statistical Service [5]. DAGL lies on a geographic coordinate of 6°08′14′′ N latitude and 1°12′45′′ E longitude. Despite significant urbanization altering the landscape, DAGL’s environment still features savannah vegetation, herbaceous communities, mangroves, and a few forest islands [22,23,24,25]. DAGL is an economic hub with many sectors of activity, playing a crucial role in the country’s economy. Because of its strategic location on the Gulf of Guinea, DAGL serves as the chief port that facilitates trade with neighboring countries and concentrates over 60% of the national firms. Additionally, the informal sector is developed especially in DAGL due to the high rate of unemployment, with a dominance of women at 54% [26].
In contrast, GAMA is located at geographic coordinates of 5°5′27′′ N latitude and 0°4′58′′ E longitude. The majority of vegetation in GAMA consists of shrublands, grasslands, and some wetlands [27]. However, it is believed that a large portion of the region was once covered in dense forest that has since been lost due to human activity and climate change [18]. The economy of GAMA is a vital component of Ghana’s overall economic landscape and is home to over 70% of the country’s manufacturing industries. The sales sector is the dominant source of employment in GAMA, engaging a significant portion of the region’s economically active population, particularly in the informal sector (Ghana Statistical Service).

2.2. Data Types and Sources

In this study, satellite data were primarily used for analyzing the urban dynamics in the two metropolitan areas. Provided by the United States Geology Survey (USGS), the multi-sensor remote-sensing images were purposefully accessed via GEE. These datasets cover the periods from 1986 to 2023 and from 1991 to 2023 for DAGL and GAMA, respectively. The selection criteria included cloud coverage of less than 10%. The decision to begin the analysis in 1991 for GAMA was based on the availability and quality of the satellite imagery before that time. Additionally, the discrepancy in the image intervals is attributed to the lack of data with less than 10% cloud cover in earlier years, which could affect the result and the accuracy of our classification. The images were from several Landsat sensors, Thematic Mapper (TM), Enhanced Thematic Mapper Plus (ETM+), Operational Land Imager (OLI), and Thermal Infrared Sensor (TIRS). The acquired images have a similar spectral and spatial resolution of 30 m. To gain a better understanding of how land cover has changed over the years, the study employed four satellite images for each city. Table 1 provides a summary of information on the datasets used in this study.

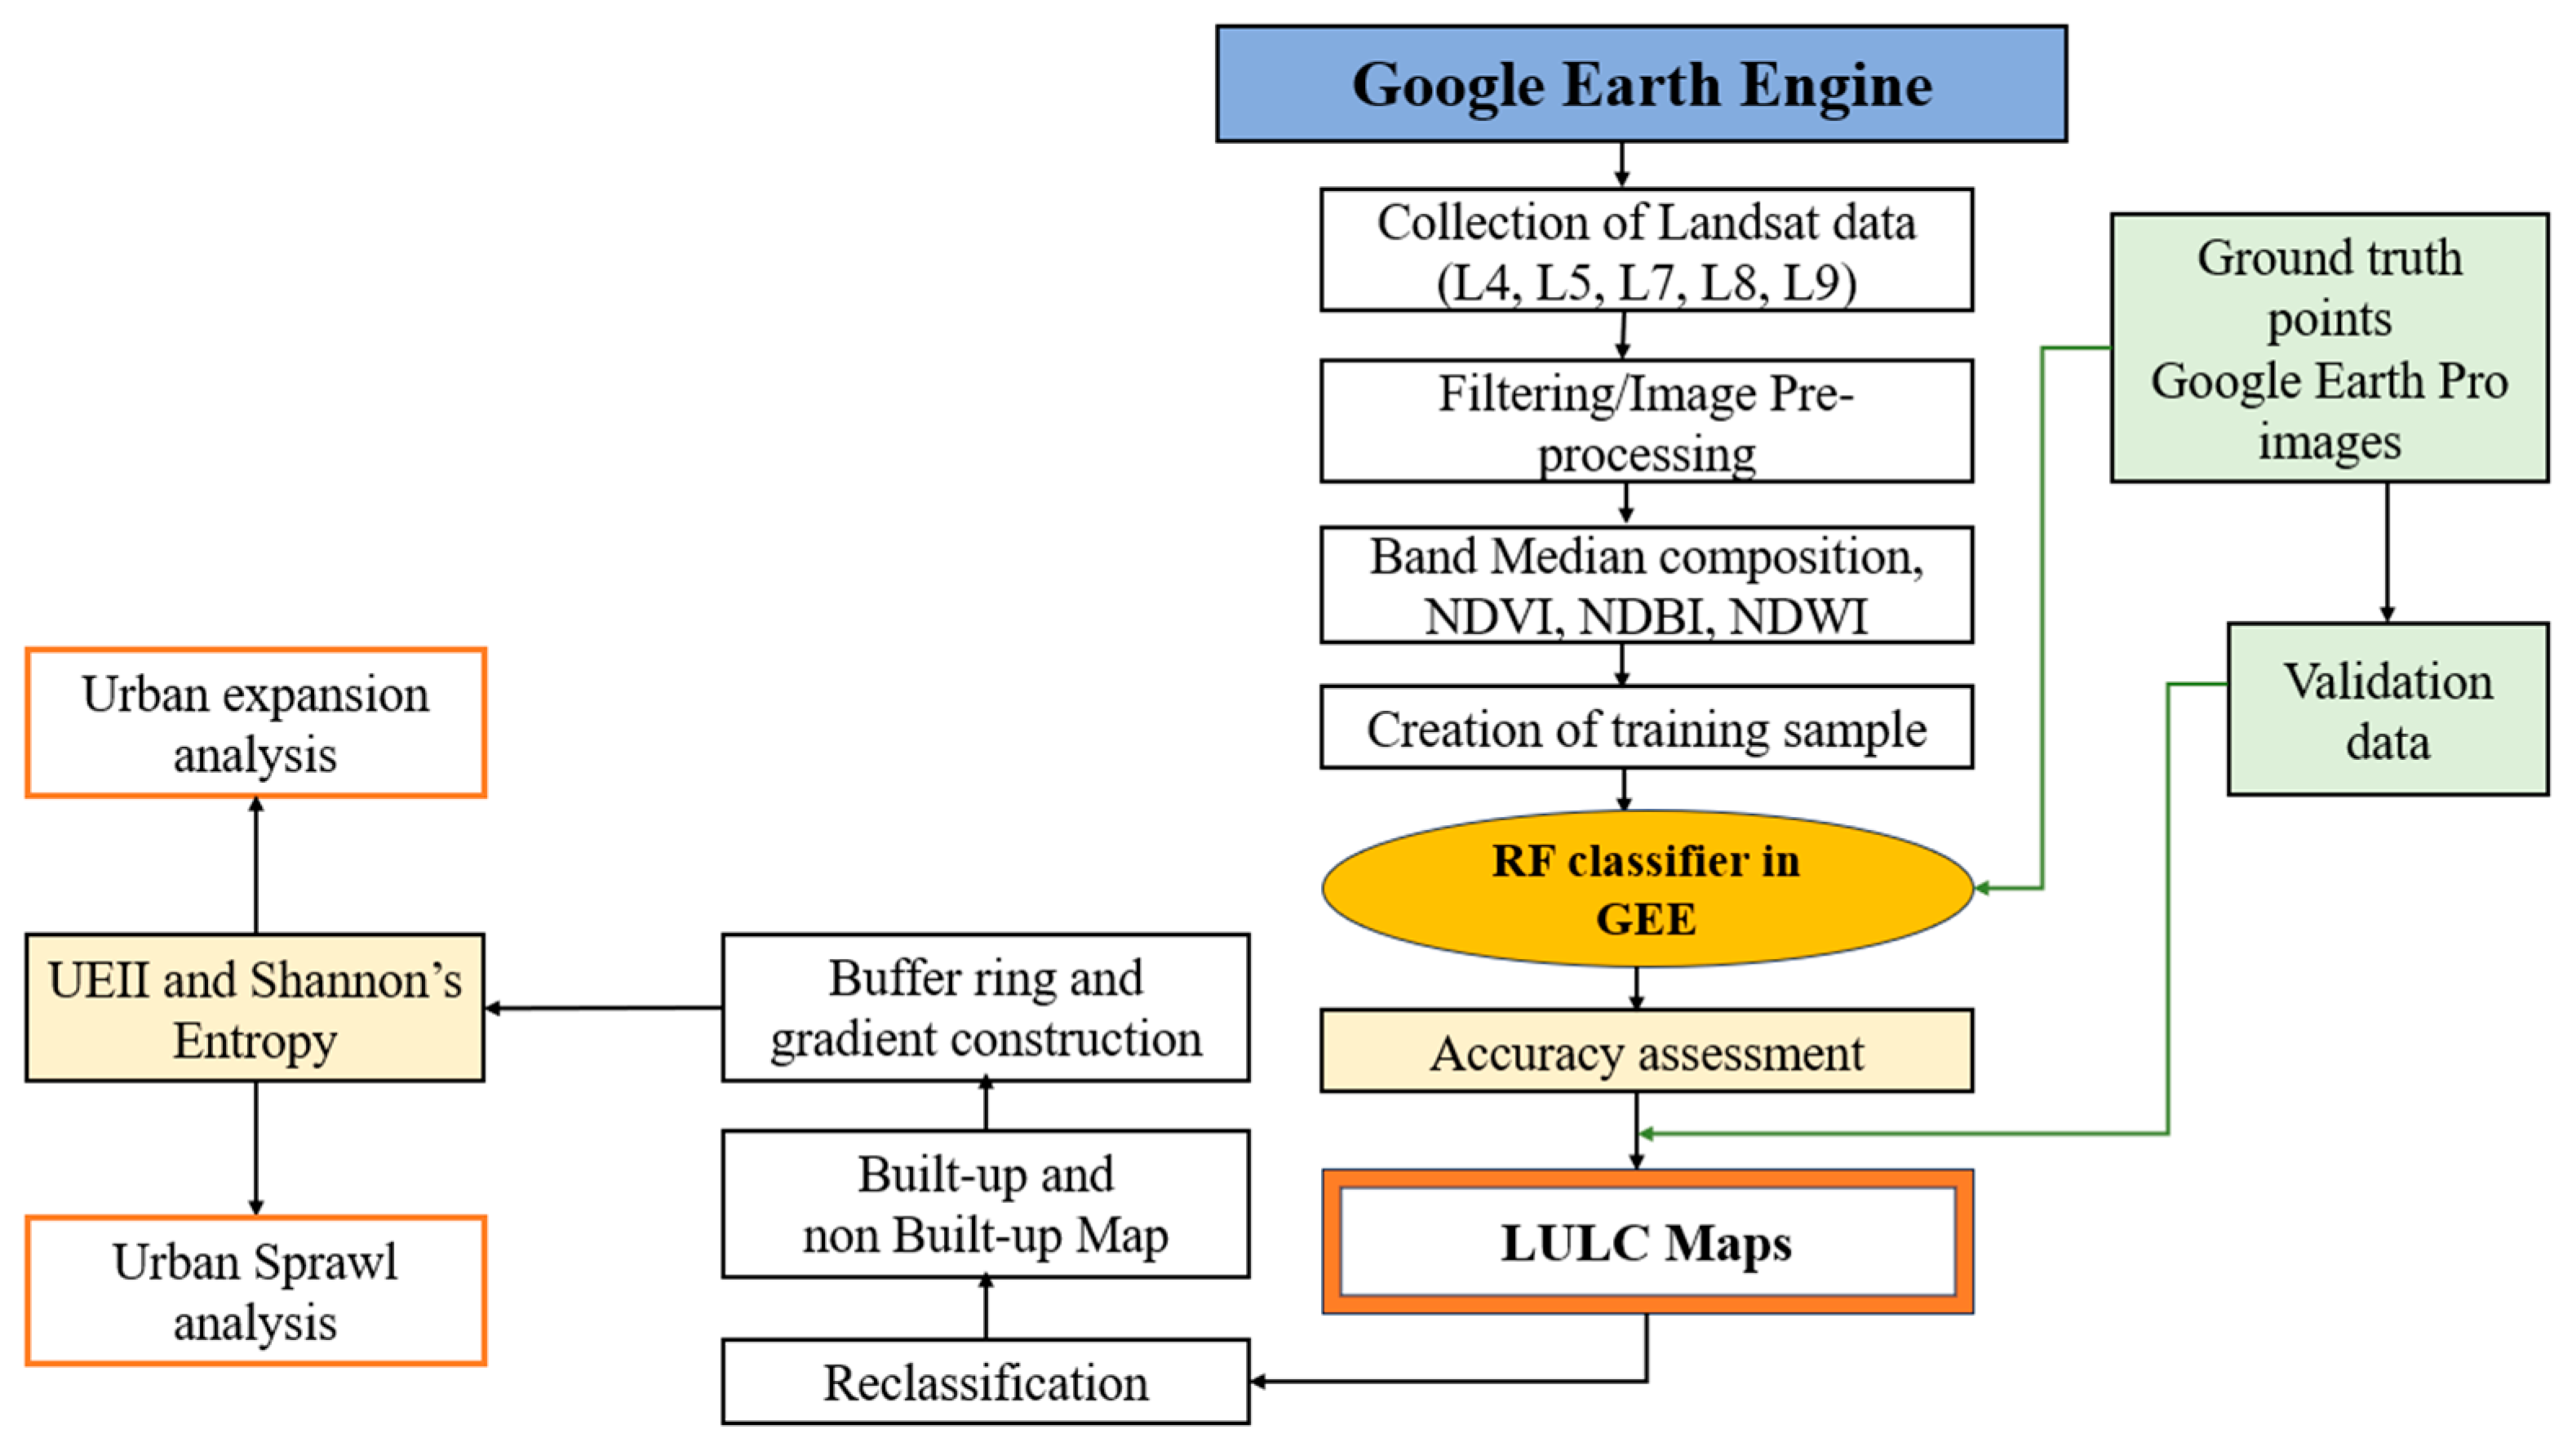
2.3. Data Processing Methods

2.3.1. Image Processing and Classification

The Landsat images were imported into the GEE platform from the USGS as the primary input. A median filter was used to integrate the Landsat data from each year into a composite image. For additional processing and analysis, the areas of interest were extracted from the feature collection for data normalization.
For the classification, the stratified random sampling technique was used to create training polygons for each land cover type identified in the study areas. The training samples were collected from various sources, including Google Earth Pro, World Settlement Footprint, Global Settlement characteristics, field visits, and GEE base maps [28]. Ground-truth samples were collected during the field visits in DAGL and GAMA for the year 2023. The QGIS interface facilitated the collection of points from the reference data, specifically the World Settlement Footprint 2015 and the Global Settlement Characteristics 2018 obtained from GEE. The ‘historical imagery’ tool in Google Earth Pro allowed visualization of Google Maps from previous years 2001, 2002, 2015, and 2017. The training data was then entered as a feature collection table into the GEE. The training data were created by examining the LULC types through spectral indices and visual interpretation of the land features. To enhance the classification accuracy, specific indices were computed for each composite image and added to the band set, including the Normalized Difference Vegetation Index (NDVI), the Normalized Difference Built-up Index (NDBI), and the Normalized Difference Water Index (NDWI) [29]. The geometry tool was used to design training sites for the defined classes.
Thirty percent (30%) of the training datasets were utilized as validation sets, while seventy percent (70%) were used for training. Based on the spectral characteristics of the image and the literature knowledge, five LULC classes were defined for the purposes of the study (Table 2). The random forest (RF) algorithm, a classifier under the supervised classification in the GEE, was used to classify the images into five classes for each city using the “ee. Classifier.smileRandomForest” function. Supervised classification is preferred in this study for its capability to identify a certain type of land cover based on provided training data. One significant advantage of the RF classifier is its capacity to manage high-dimensional data with complex interactions between variables, although it is somewhat sensitive to input data errors [30]. Moreover, DAGL and GAMA present a complex landscape, making GEE an efficient tool for mapping LULC due to its faster visualization and analytical capabilities. RF combines multiple classification and regression trees (CART) to create an ensemble classifier. It generates several decision trees through the random selection of variables and training datasets and evaluates its performance using non-training examples to provide an objective assessment of the generalization error [31]. The two key user-defined input factors are the number of parameters and the number of trees, with the literature suggesting that the ideal number of variables is the square root of the total variables, and the ideal number of trees ranges from 100 to 500 [32]. Additionally, one-third of the training data are used to determine the prediction error, while two-thirds are used to construct the random forest model. This facilitates the assessment of the accuracy of each analysis.

2.3.2. Accuracy Assessment

After the completion of the classification process using a machine-learning algorithm (RF), an accuracy assessment was carried out using an error matrix to ascertain the accuracy of the classified images. Since the accuracy measures the degree of agreement between the classified image and the baseline data, the quality of the result after classification is critical for change detection analysis [33]. The accuracy of the different classified images was assessed in this study in order to measure the quality of the classification results. An algorithm included in GEE, called a confusion matrix, verifies and then assesses the image’s classification accuracy. The accuracy evaluation of LULC maps was conducted using the validation error matrix that was generated in GEE. The correlation between known ground or reference data and the corresponding results of automated classification is compared in the error matrix. The overall accuracy (OA), user’s accuracy (UA), and the producer’s accuracy (PA) were calculated.

2.3.3. Change Detection Analysis

To determine the differences between the identified time series images, a change detection analysis was carried out [34]. The LULC post-classification within the Semi-Automatic Classification plugin (SCP) in the QGIS interface was used to analyze change for DAGL (1986–2001, 2001–2015, and 2015–2023) and GAMA (1991–2002, 2002–2015, and 2015–2023) over a tree-period interval. A pixel-by-pixel cross-tabulation analysis was used to analyze cross-classes conversions. The magnitude of change between years (absolute change), and average annual rate of change (%) were then computed from the change matrix using the equations below [35,36].
A b s o l u t e   c h a n g e ,   A C = A t 2 A t 1   ( k m 2 )
Positive percentage values suggest an increase, whereas negative values imply a decrease in area coverage.
C = ( B 2 B 1 ) B 1 × 100 T 2 T 1
where c is the average annual rate of change, B1 is the area of land cover type in time 1 (T1), and B2 is the amount of land cover type in time 2 (T2).

2.3.4. Analysis of Urban Expansion and Sprawl

An urban built-up map was generated by extracting the built-up images from the classified images. Following the extraction, built-up maps were overlaid, and the resulting images were recorded. For each image in the two cities, the UEII, a crucial metric that shows the rate or speed of urban expansion at various times, was determined (Equation (3)). Around a selected center point, fourteen concentric multiple-ring buffer zones were constructed with 2 km intervals for DAGL, while twenty were constructed for GAMA. Independence Square, representing the city center, was chosen for DAGL, while the central business district, Makola Market Circle, was chosen as the center point for GAMA for generating the buffer zones. These points were generated from the Google Earth Pro interface. The 2 km interval is found to be an appropriate scale that captures the key spatial details of urban features, and the number of rings generated depends on the size and spatial extent of each city. Additionally, to identify the trend of urban spatial patterns in various directions, the direction-wise method has been used [37,38]. An equal interval of 22.5 degrees for each direction was used, which is very effective [39], and the study areas and the concentric ring were divided into sixteen directions. In order to quantify the expansion in different directions, a number of quadrants (Q) were generated and captured. There were some quadrants eliminated since they did not cover the study area’s boundaries. Finally, seven (7) and eight (8) quadrants were considered for DAGL and GAMA, respectively. The directional analysis reveals the area of the city that is expanding the fastest and identifies key factors or divers. This is crucial to know where natural habitats are most at risk to develop conservative strategies and guide planning for future expansion.
U E I I i = U L A i t 2 U L A i t 1 T L A i × t × 100
where UEIIi is the Urban Expansion Intensity Index of unit i; U L A i t 2 and U L A i t 1 are the areas of urban built-up land at times t1 and t2; T L A i is the total land area within the study area i; and t is the study time period (i.e., t2_t1) [19]. The UEII standard is scaled as follows: <0.28 is “very slow expansion”; 0.28 to 0.59 is “slow expansion”; 0.59 to 1.05 is “medium-speed expansion”; 1.05 to 1.92 indicate “high-speed expansion”; and >1.92 is “very high-speed expansion” [19].
In addition, Shannon’s entropy using GIS tools was computed for each city. Shannon’s entropy is a commonly employed technique to measure and evaluate the compactness and/or dispersion of built-up area among n zones [40]. Equations (4) and (5) are used to determine Shannon’s entropy (En).
E n = i n p i l o g ( 1 p i )
where Pi is the probability or proportion of built-up in the zone. Then, the relative entropy (Hn) is used to scale the entropy value from 0 to 1; n is the number of zones from the city center.
H n = i n p i l o g ( 1 p i ) / L o g ( n )
The value closer to zero means compact urban growth (higher density), while values closer to one indicate dispersed distribution (low-density urban development) [41]. The methodology of the study is summarized in Figure 3.

3. Results

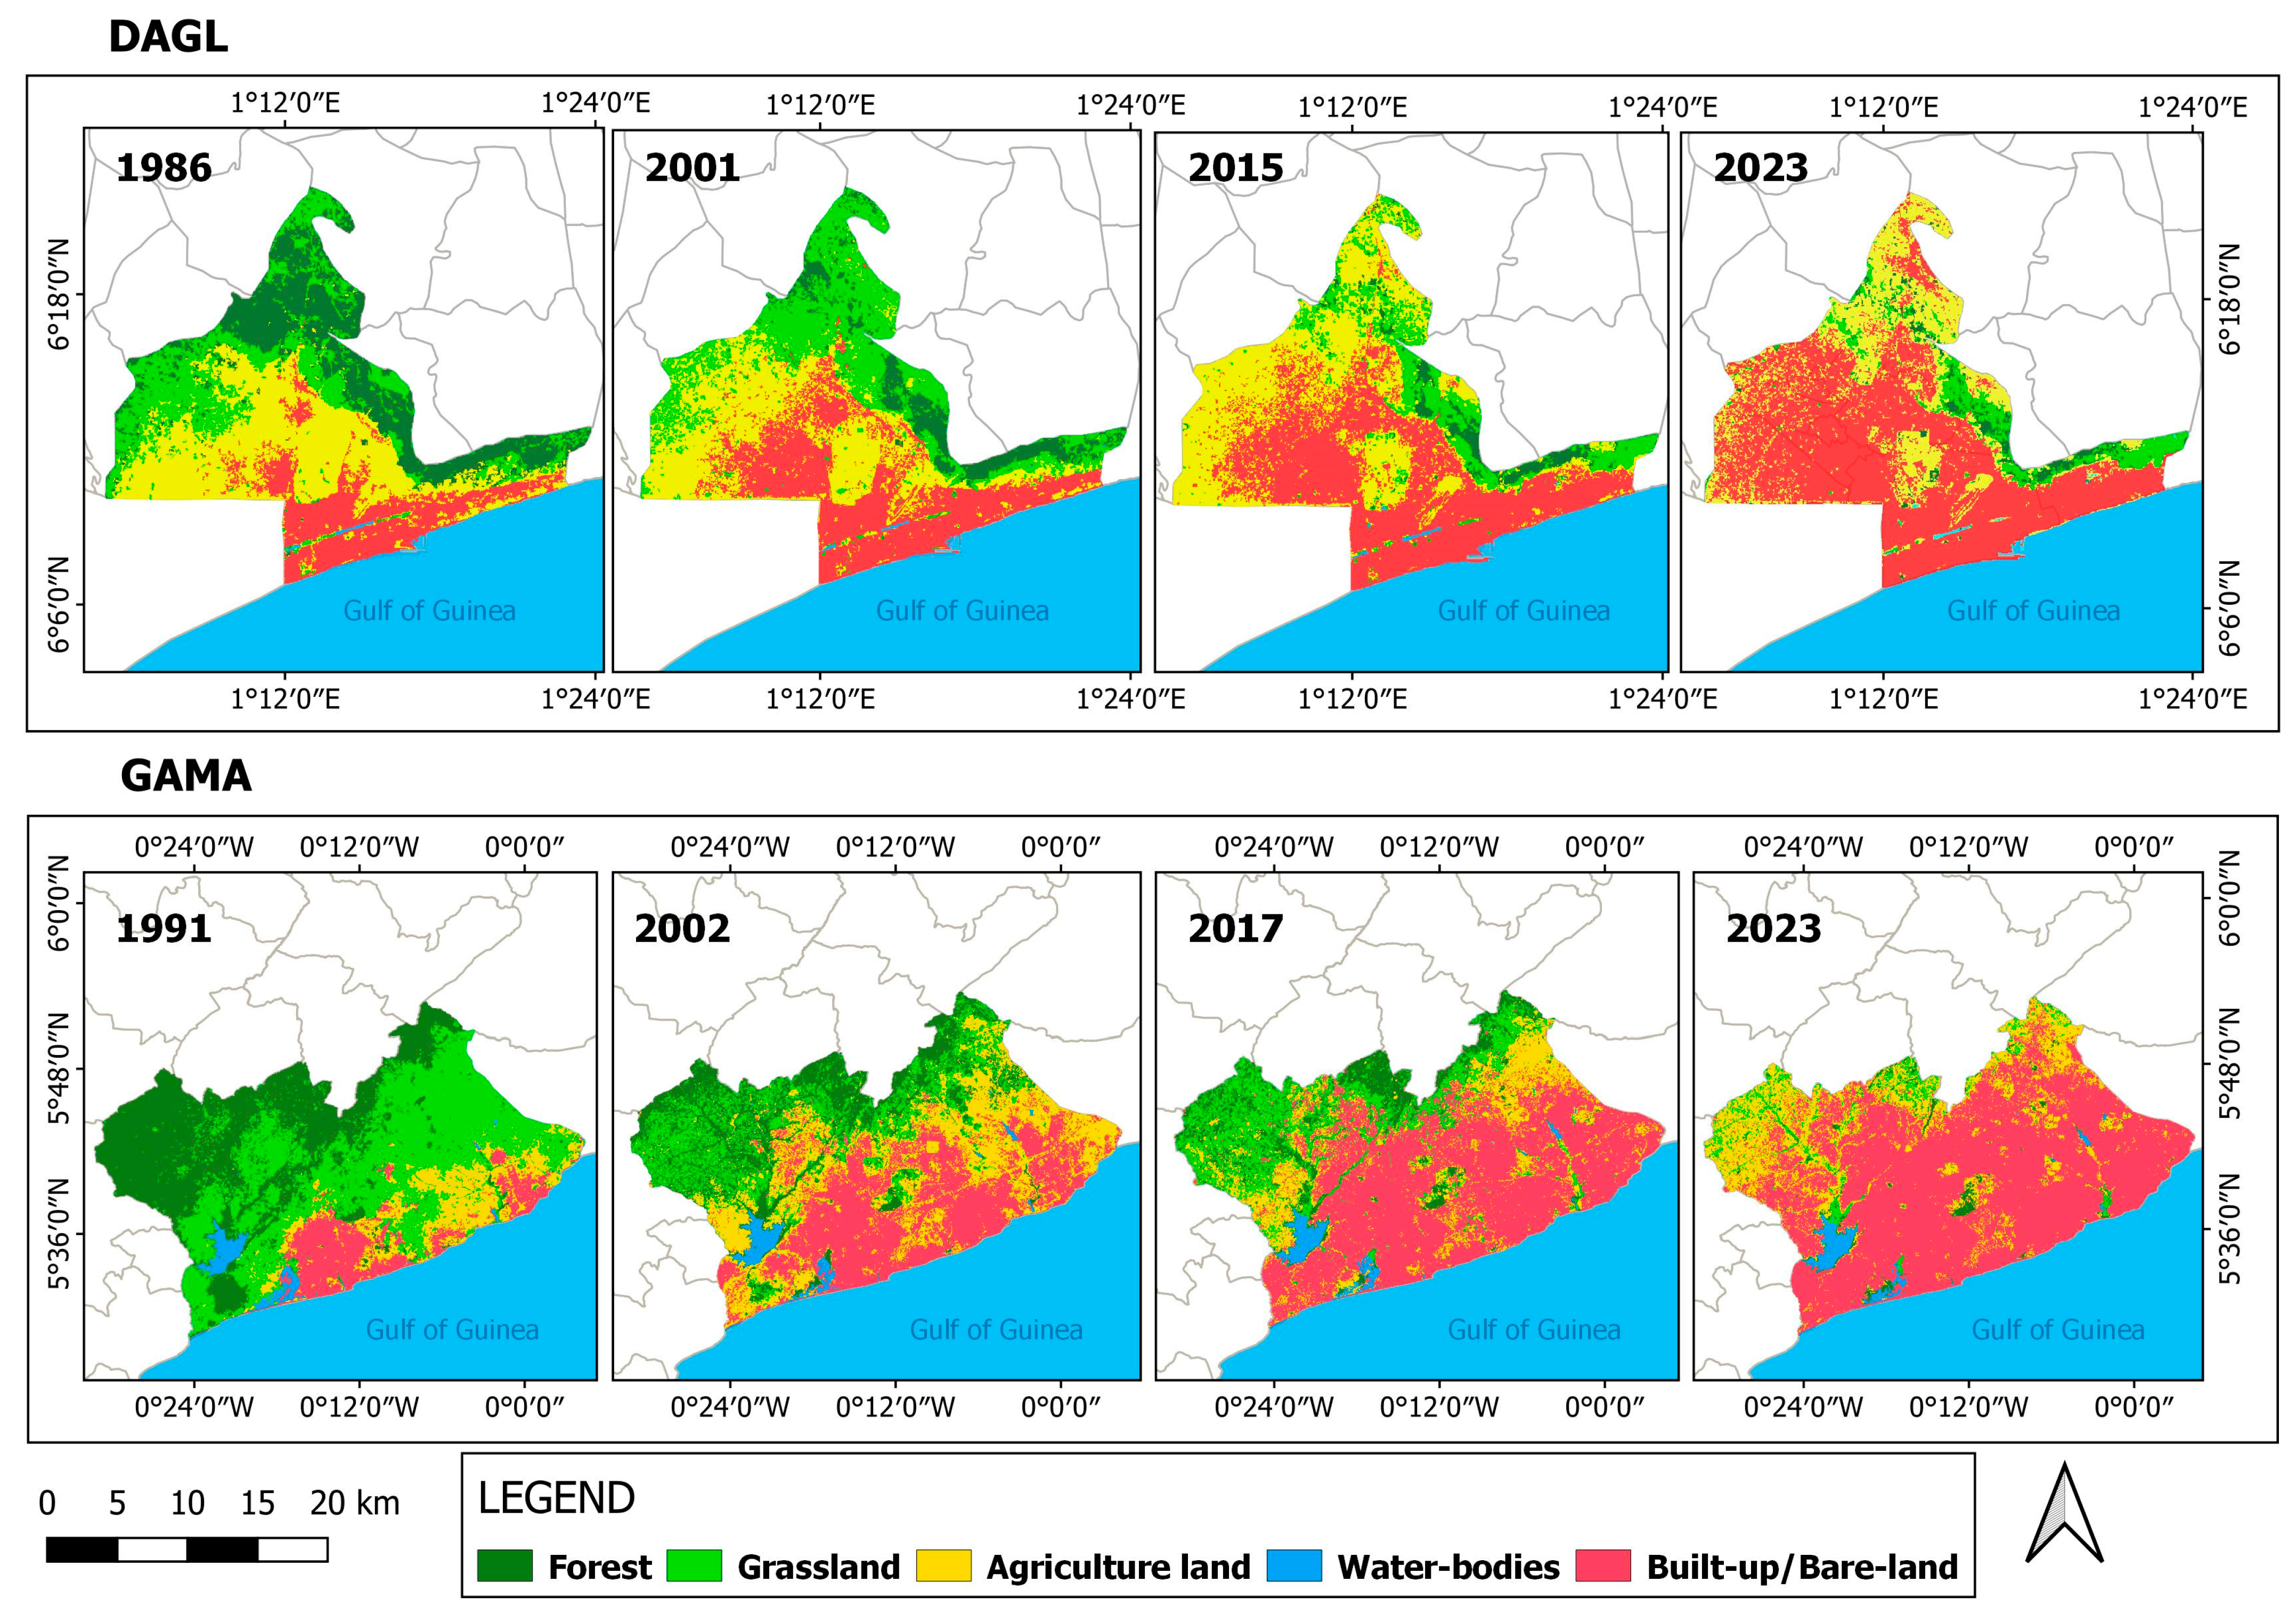
3.1. Land Use and Land Cover Change in DAGL and GAMA

The results of the LULC change assessment of the classified maps in the DAGL and GAMA (Figure 4) reveal a significant transformation in land uses over the years.
In DAGL, the land use has shifted from primarily vegetated land in 1986, where agricultural land occupied 35.36%, forest 24.04%, and grassland 22.09% to a major built-up area of 76% by 2023. The agricultural land has decreased to 27.12%, while forest and grassland have seen significant reductions, now covering 3.43% and 3.88%, respectively. Between 1986 and 2001, grassland increased at the expense of the degraded forest areas, but from 2015 to 2023, DAGL experienced the highest rate of losses in grassland (−5.03%). Specifically, from 2015 to 2023, DAGL experienced the highest rate of losses in all the classes compared to the periods 1986–2001 and 2001–2015. Between 1986 and 2001, forests, agricultural, and water bodies exhibited a reduction in the average annual rate, of −4.33%, −0.51%, and −1.94%, respectively, while there was an increase in grassland at a rate of 1.71% (Table 3).
Similarly, GAMA’s land cover has undergone considerable changes. Initially dominated by grassland (42.58%), followed by forest (34.18%) and agricultural land (11.81%), in 1991, GAMA’s built-up area increased significantly to 70% by 2023. Meanwhile, grassland has declined to 3.88%, and forest cover has dropped to 2.43%. Agriculture has slightly increased to 21.48% compared to the year 1991. Between 2000 and 2017, GAMA experienced a gradual rise in the built environments, alongside declines in grassland and forest cover. The period from 2017 to 2023 marked the most significant reductions in forest and grassland, at an average rate of −12.63% and −12.76%, respectively, while there was an increase in the rate, with 2.09% for agricultural land and 5.79% for the built-up area (Table 4).
In both regions, DAGL and GAMA, there has been a dramatic increase in built-up areas at the expense of natural habitats like forests, grasslands, agricultural lands, and water bodies over the past three decades. The development pattern differs between DAGL and GAMA. GAMA displays a higher coverage of built area than DAGL due to its larger size, high population density, and more economic activities compared to DAGL, even though the two regions are the economic centers in their respective countries. In the two metropolitan areas, the agricultural lands are not stable. In DAGL, agricultural lands increased at an average rate of 1.42% between 2001 and 2015 but decreased at rates of −0.51% during the period 1986–2001 and −3.84% between 2015 and 2023. In contrast, GAMA’s agricultural lands faced a decrease between 2002 and 2017, at an average rate of −2.33%, but increased during the periods of 1991–2002 and 2017–2023.

3.2. Accuracy Assessment

Error matrices were used to assess the classification accuracies for DAGL in Table 5 and GAMA in Table 6. The percentage of pixels that are correctly classified is shown by the overall accuracy. The classification’s overall accuracy for the years 1986, 2001, 2015, and 2023 varied from 90.12% to 95.59% for DAGL. However, in GAMA, the classification’s overall accuracy for the years 1991, 2002, 2017, and 2023 varied from 91% to 97%. The result of the accuracy evaluation is reliable for further analysis in the two metropolitan areas.

3.3. Urban Expansion Dynamics

It has been proven that there is an intimate relationship between urbanization and land use dynamism, with increased urbanization leading to significant changes in land use types and a more diversified land use distribution over time. Over the past three decades, built-up development in terms of residential and commercial purposes has significantly impacted urbanization in DAGL and GAMA. The share of built-up areas varies from the city center to the periphery, as depicted in Figure 5. The periphery has gradually transformed into sporadic residential buildings, demonstrating how cities typically develop around a central core characterized by dense concentrations of residential areas, historical and cultural sites, administrative buildings, hospitals, and commercial establishments. New developments generally expand outward from the city center, resulting in declining urban density. High density is concentrated at the core, while lower densities are found at the periphery. Contributing factors to this trend include high land prices and scarcity in the city core.
Over the years, as shown in Table 7 and Table 8, the built-up area has expanded gradually across all quadrants: seven quadrants (Q1, Q2, Q3, Q4, Q14, Q15, and Q16) in DAGL and eight quadrants (Q1, Q2, Q3, Q12, Q13, Q14, Q15, and Q16) in GAMA. The overall UEII ranges from 1.05% to 1.92%, indicating rapid urban expansion for both DAGL and GAMA.
Quadrants Q16 and Q14 in DAGL both exhibited rapid growth between 1986 and 2001 and from 2015 to 2023, respectively. As illustrated in Figure 6, urban expansion is particularly evident in the northwest part of the city, where the Agoe–Nyive municipality and its districts Aflao Gakli, Aflao Sagbado, Vakpssito, Zanguera, and Agoe-Nyive, located in the peri-urban areas, are experiencing significant growth. Table 7 presents the UEII for DAGL across various years. The UEII values for quadrants Q14 and Q15 from 1986 to 2001 ranged from 1.05 and 1.92, indicating high-speed expansion in these areas, whereas medium-speed expansion was observed in quadrants Q1, Q2, and Q3. From 2001 to 2015, similar high-speed expansions were noted in quadrants Q14 and Q15, while low expansion rates were recorded in Q16. Between 2015 and 2023, very high-speed expansion occurred in quadrants Q1, Q14, Q15, and 16, with moderate expansion noted in Q2, Q3, and Q4. The relative Shannon’s entropy for DAGL over the period from 1986 to 2023 is recorded at values of 0.76, 0.88, 0.92, and 0.95.
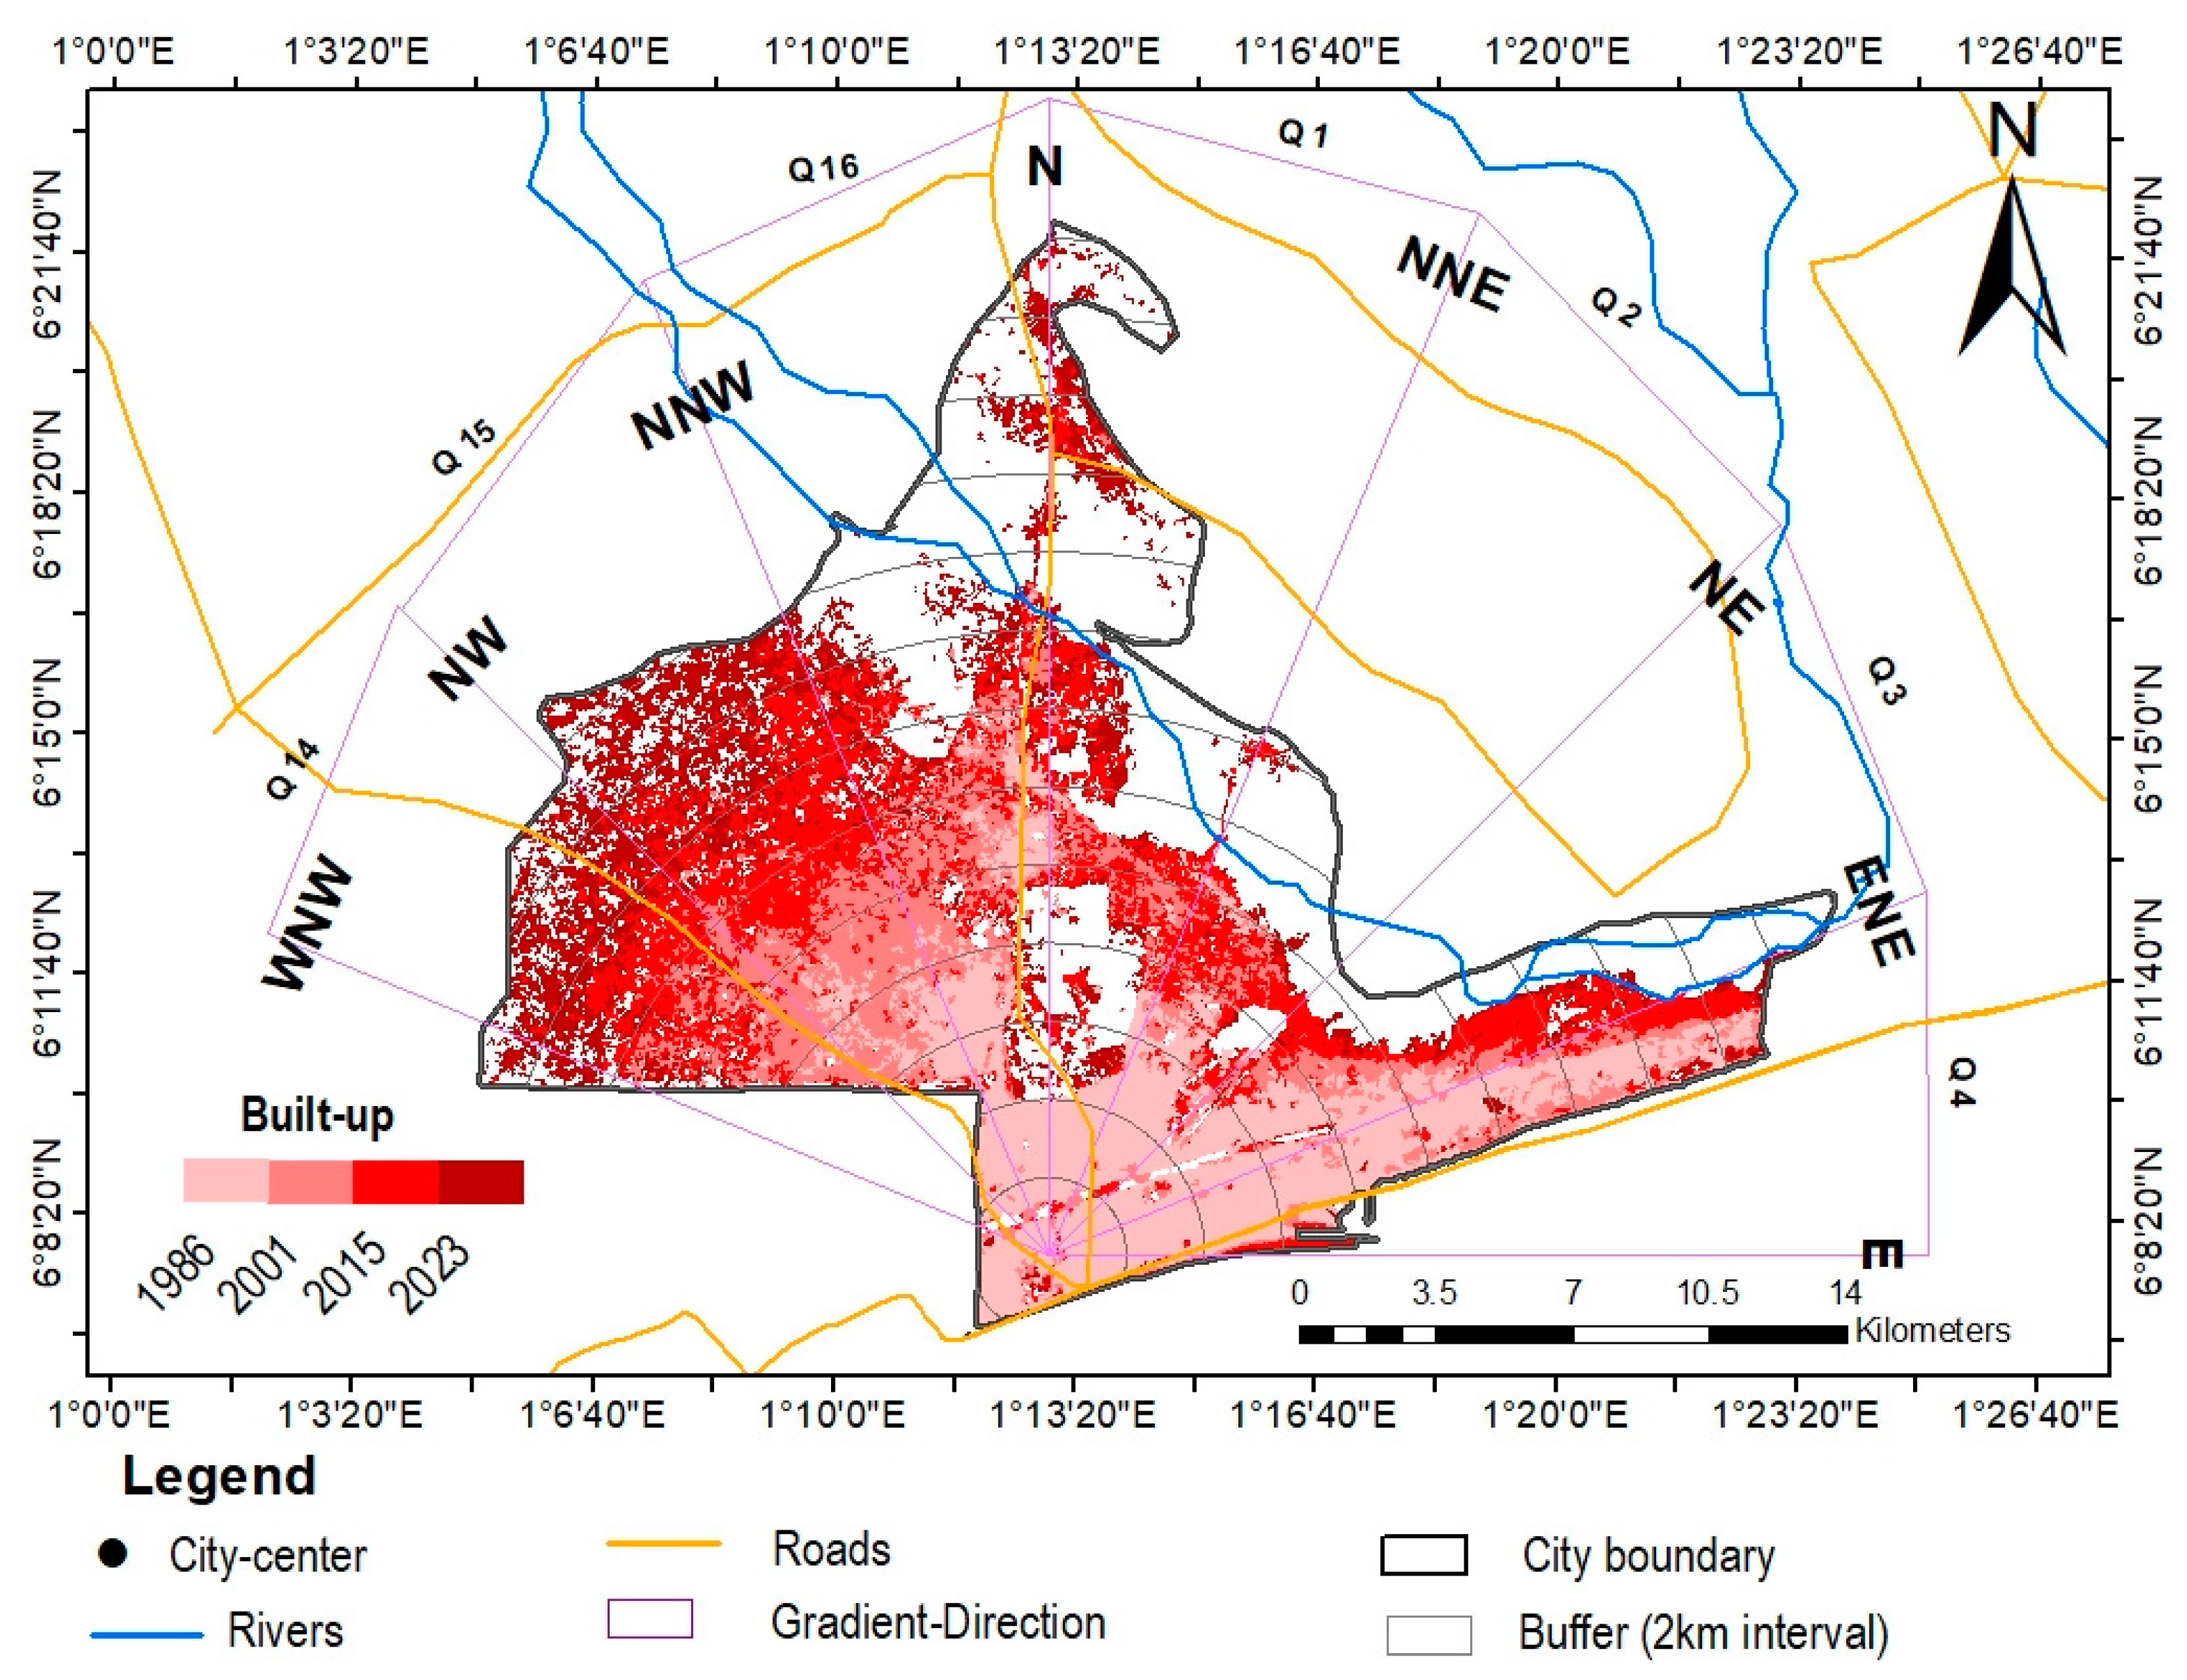
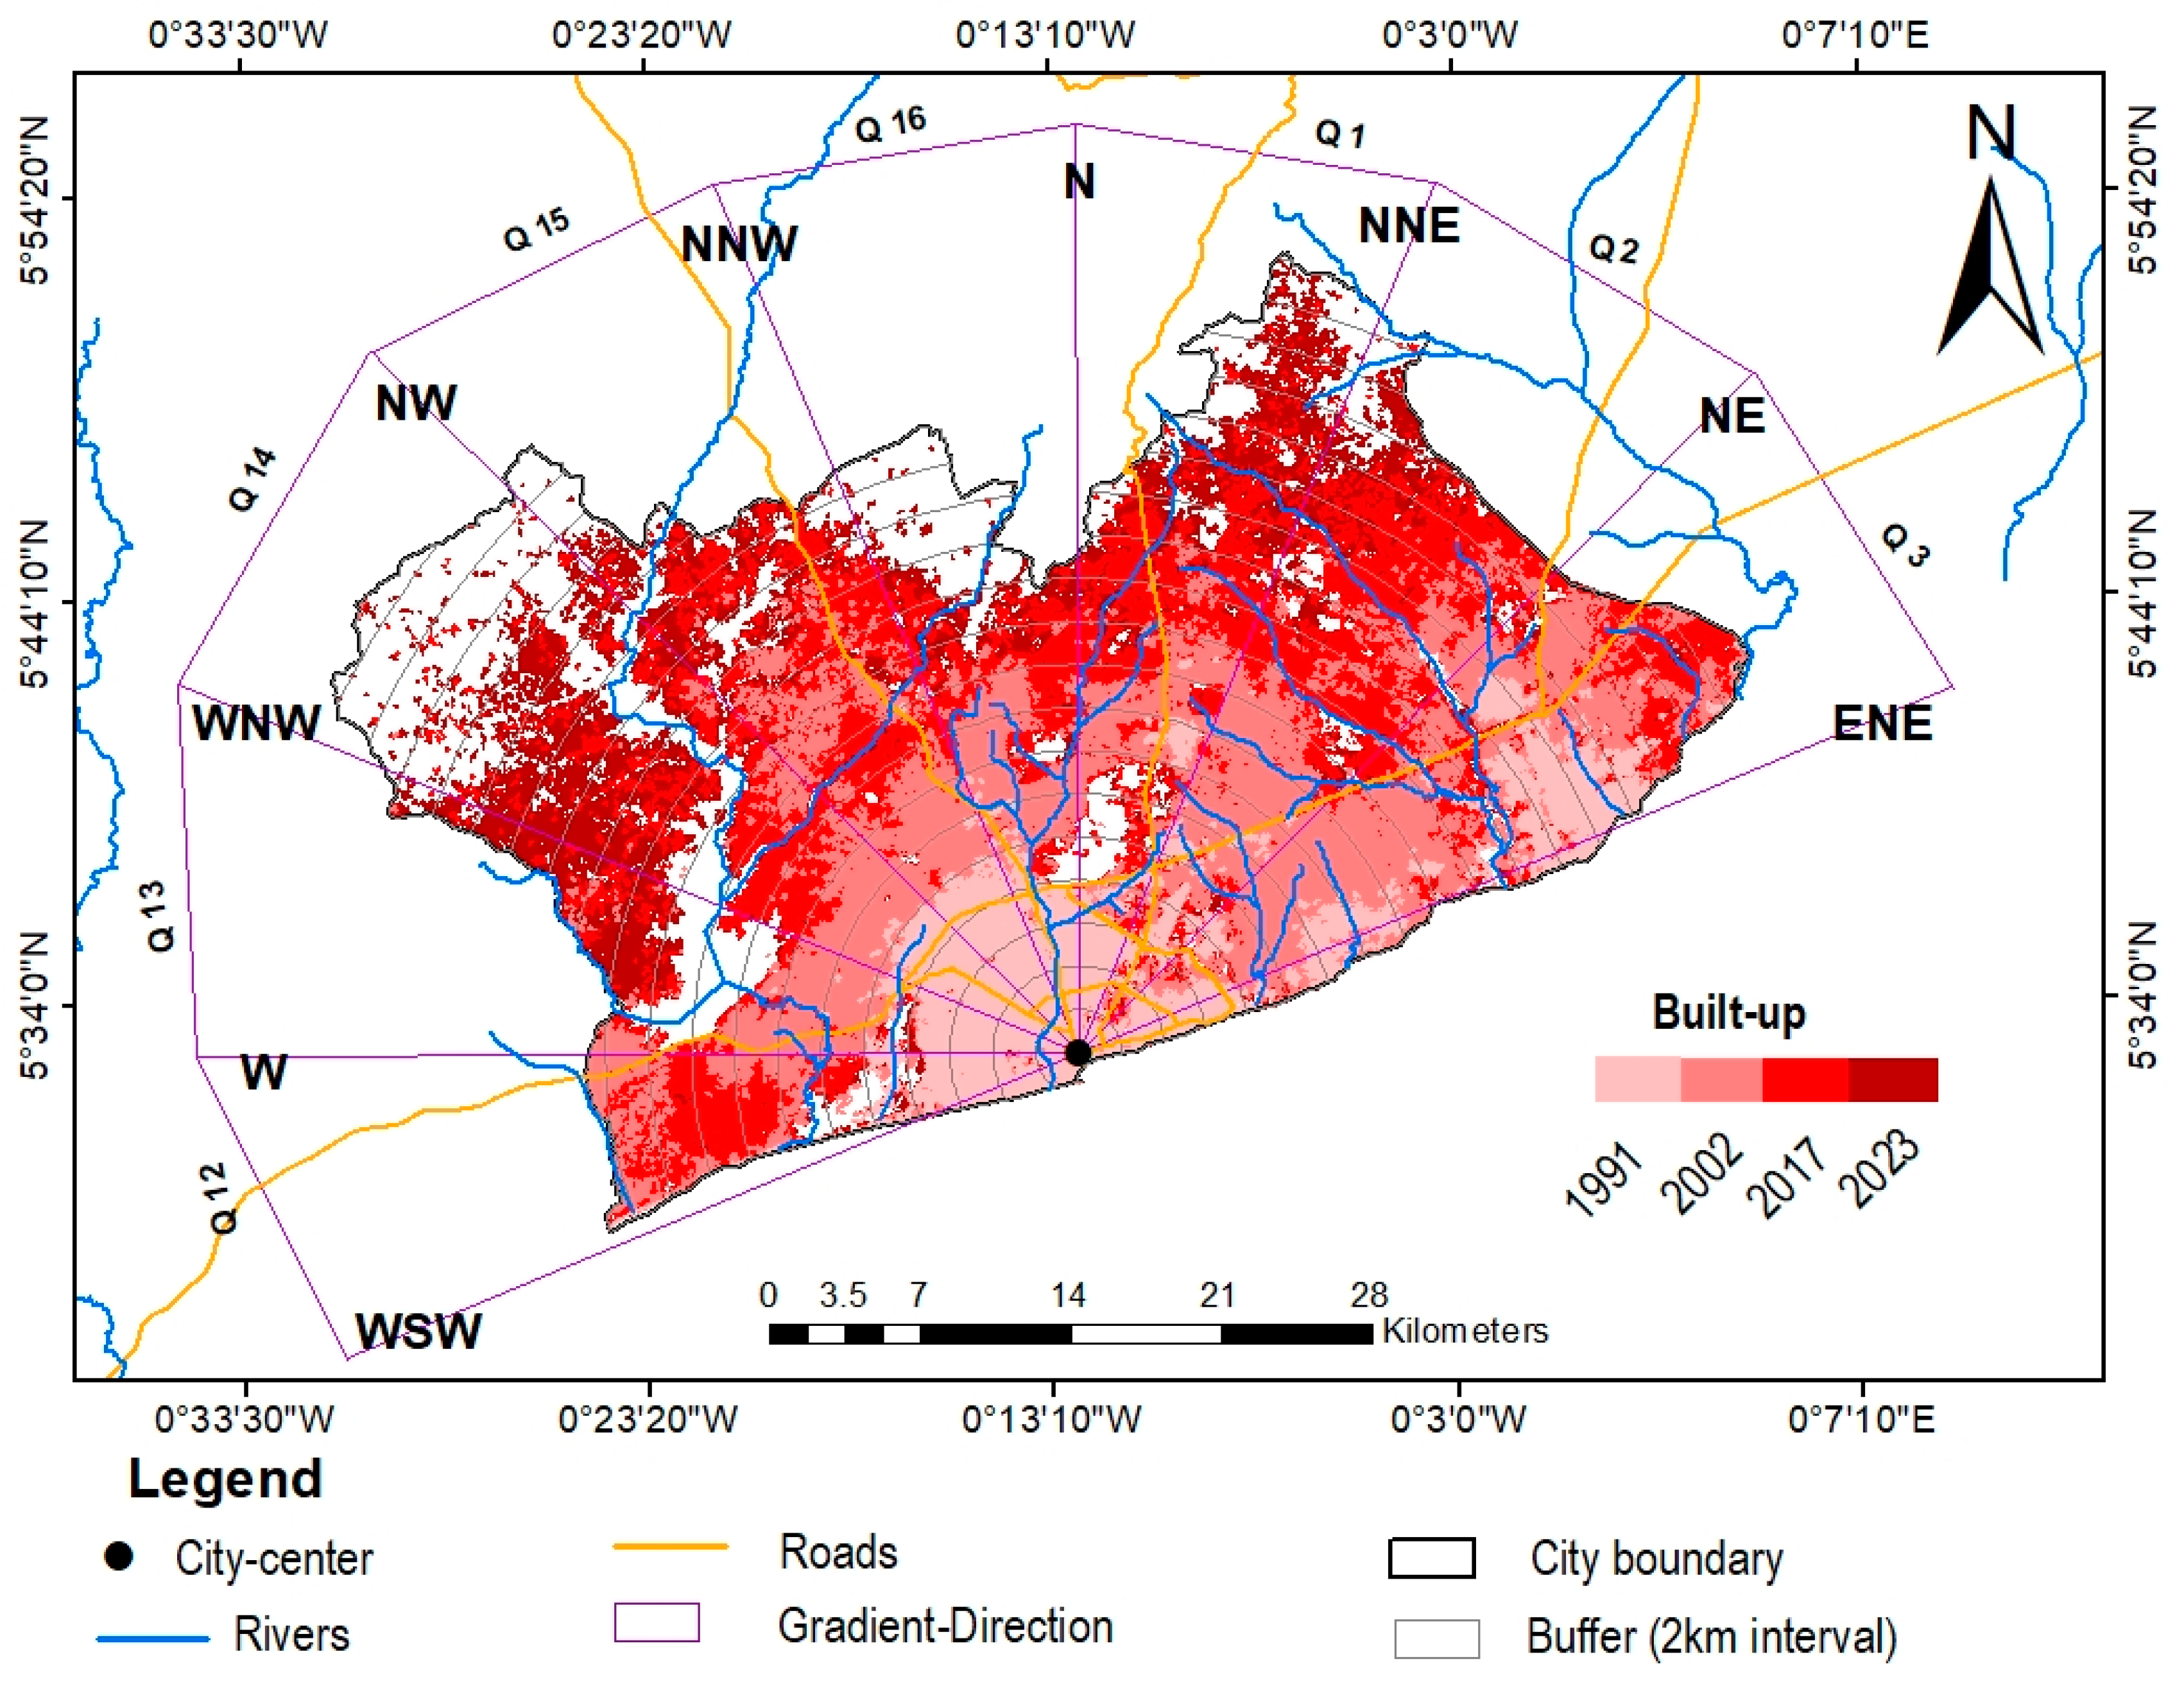
  • In GAMA, the result shows a high rate of built-up area expansion in the peri-urban areas, particularly towards the Nord-Est region where Kpone Katamanso, Adenta Municipal, and Tema Metropolis are located. This expansion is more pronounced in quadrant Q3 between 1991 and 2002 and in quadrant Q2 between 2002 and 2017 (Figure 7). Quadrants Q1 and Q14 recorded the highest growth rates between 2017 and 2023. The rapid urban expansion observed in quadrants Q15 and Q16 between 1986 and 2015 indicates significant peri-urbanization activity. According to Table 8 detailing the UEII for GAMA, values exceeding 1.92 were recorded in quadrants Q2, Q3, Q12, and Q13 from 1991 to 2002, indicating a very high-speed urban expansion during this period. High-speed expansions were also observed in quadrants Q15 and Q16, while medium-speed expansion occurred in quadrants Q1 and Q14. From 2002 to 2017, very high-speed expansion was noted in quadrants Q2 and Q12. High-speed expansion occurred in quadrants Q1, Q3, Q15, and Q16. Medium-speed expansion was recorded in quadrant Q14. Slow expansion was observed in quadrant Q13. From 2017 to 2023, all quadrants experienced very high-speed expansion, only quadrant Q3 demonstrated high speeds of expansion. The relative Shannon’s entropy values for GAMA range from 0.82 to 0.96 between 1991 and 2023, revealing a scattered urban region;
  • Both metropolitan areas exhibited rapid urban expansion, particularly in peri-urban areas, with distinct spatial and temporal patterns. DAGL’s growth was concentrated in the northwest, while GAMA’s expansion was prominent in both the Nord-Est region and Nord-Western region. Notably, GAMA experienced widespread very high-speed expansion across nearly all quadrants from 2017 to 2023, while DAGL’s expansion was more spatially varied in the same period. The trend of rising relative Shannon’s entropy values in both DAGL and GAMA confirms increased urban fragmentation and, consequently, the evidence of urban sprawl.

4. Discussion

4.1. LULC Change Patterns in DAGL and GAMA

The findings indicate that urbanization, coupled with population growth and migration, have significantly reshaped the landscapes of DAGL and GAMA, leading to altered land use patterns and increased land consumption due to rapid development.
In DAGL, the previously verdant landscape composed of forest and grassland, particularly in the northern peripheral areas, has experienced progressive deterioration since 1986, with significant conversion to construction sites driven by urbanization and population growth. This observation aligns with Somadjago et al. [12], who noted the absorption of hamlet and village, farming, and woodland into the expanding urban area. These findings are also supported by Blakime et al. [13], who revealed the increase in built-up areas due to the construction in the floodplain of the Zio River to the detriment of vegetation and cultivated areas. Notably, in the urban growth in DAGL, agricultural land saw an increase between 2001 and 2015 at the expense of grassland and forest, a trend corroborated by Amouzoukpo [15], who reported increased arable land in Agoènyivé, DAGL’s second prefecture, between 2001 and 2019, reflecting urban agriculture practices and growing food demand.
In contrast, GAMA has experienced a deterioration of grassland and forest environments since 1991, driven by urbanization and economic growth, with rural–urban migration increasing the demand for housing and industrial space and transforming previous lush green belts into built-up areas. This aligns with research by Addae and Oppelt [18], Asabere et al. [16], and Devendran and Banon [42], who highlighted landscape fragmentation and the conversion of vegetated land into urban environments, as well as Puplampu and Boafo [20], who pointed out a significant decrease in green spaces within the city. Similar to DAGL, GAMA also witnessed an expansion of agricultural land from 1991 to 2002, aligning with a report from the Ghana Ministry of Food and Agriculture that attributed this to government policies promoting urban and peri-urban agricultural development [43].
The overall pattern of built-up development and vegetation loss in DAGL and GAMA is consistent with the findings from Barman et al. [44] in the Jalpaiguri urban agglomeration, West Bengal, India, and Tessema and Abebe [45] in Hawassa (Ethiopia), suggesting common trends in urbanization across diverse developing regions.

4.2. Spatial Patterns of Urban Expansion

Regarding urban expansion analysis, development was seen in the cities’ peri-urban zones, particularly in the northeastern and northwestern regions of GAMA and the northwestern part of DAGL. This growth can be explained by a number of factors, such as the high cost of renting in the city center and the affordability of land for home construction on the outskirts. This is supported by the work of Yang et al. [46], who demonstrated directional expansion, particularly northeastward in Beijing (China). The overall UEII ranges from 1.05% to 1.92%, indicating rapid urban expansion for both DAGL and GAMA. This is corroborated by the findings of Al-Sharif et al. [47], who reported an expansion intensity index increasing from 0.35 to 1.28 over their study period in Tripoli, the capital of the Libyan state, highlighting an alarming rate of urban expansion.
Over the study period, DAGL has experienced high-speed to very high-speed urban expansion, particularly in quadrants Q14 and Q15. This expansion is primarily driven by the national road RN5, which connects the northwest suburbs to the city of Kpalimé. Affordable land and housing in areas like Aflao Gakli, Vakpossito, Zanguera, and some parts of Legbassito have attracted populations from the city center. This supports Somadjago et al.’s [12] hypothesis that housing accessibility is a major factor in DAGL’s expansion. Additionally, Q14 includes Sagbado, a border area between Togo and Ghana, where migration is prevalent, contributing to its significant population size in DAGL [4]. Between 2015 and 2023, quadrants Q1 and Q16 have also experienced very high-speed expansion, with areas like Agoe-Nyive, Togblekope, and Adeticope emerging as new urban hubs due to their proximity to the national road RN1 and the establishment of commercial and industrial facilities [48]. For instance, Adeticope is viewed as a stable location for property investment and industrial development, with nearly 90% of its buildings being modern. The Industrial Platform of Adétikopé (PIA) exemplifies this trend as a major multi-sector economic development project aligned with the National Development Plan (PND, 2018–2022). This area has also become the main focus for the implementation of major public–private urban and property development projects, such as the Well-City project, which aims at improving the city’s infrastructure, services, and liveability. In contrast, quadrants Q2 and Q3 show moderate urban expansion due to the challenges posed by Zio Valley in the eastern part of the city, with water stagnation and seasonal flooding, making this area unsuitable for residential construction [13,15]. Meanwhile, the coastal area of Grand Lome in Q4 exhibits moderate urban expansion but maintains a significant concentration of built-up areas (Figure 6) due to Togo’s major port and its location along the Abidjan–Lagos corridor, a critical transport road for trade and economic development in West Africa.
Similarly, GAMA experienced very high-speed urban expansion between 1991 and 2002 in quadrants Q2, Q3, Q5, Q12, and Q13, indicating peri-urbanization in its peripheral areas. Major transportation roads linking the city center to the northeastern and western parts of GAMA have facilitated routine commuting while contributing to massive regional expansion [49]. In quadrant Q12, the very high expansion from 1991 to 2017 is attributed to the population increases in the Weija–Gbawe Municipality, driven by built-up facilities and an industrialized economy [50]. Expansion in quadrant Q2 is largely due to the spillover effect from Tema and Ashaiman. Meanwhile, quadrant Q3’s growth is driven by a high concentration of migrants seeking employment in industrial sectors and administrative institutions [19]. The findings align with Acheampong et al. [51], who noted significant built-up expansion toward Kpone–Katamanso to the east and Weija–Gbawe to the west. The low-speed urban expansion observed in quadrant Q13 from 2002 to 2017 resulted from flooding caused by overspills of the Weija Dam [52]. Quadrant Q14’s very high urban development between 2017 and 2013 further emphasizes Ga South as an emerging urbanization hotspot within GAMA [53]. The above findings in DAGL and GAMA are consistent with other studies, suggesting that peri-urban development in Africa tends to follow major highways, which is usually an opportunity for residents to set up home-based and roadside businesses [54]. This is also confirmed by the research of Haldar et al. [55] in Durgapur Municipal Corporation in West Bengal in India.

4.3. Urban Sprawl

The spatial patterns of urban expansion in DAGL and GAMA reveal a growing trend towards urban sprawl, characterized by low-density development extending into peri-urban areas. This is further evidenced by the rise in the relative Shannon’s entropy values in both regions, which indicate increasing urban fragmentation and a more scattered distribution of built-up areas. This often results in inefficient land utilization, with a significant conversion of natural land cover. Such sprawl patterns are not unique to DAGL and GAMA but are a common trend observed in various cities. For instance, similar patterns are experienced in the city of Kanpur in India [56] and Riyadh, the capital of Saudi Arabia [40]. Additionally, the Sekondi–Takoradi metropolitan assembly in Ghana has also experienced urban sprawl, with significant impacts on land use and land cover dynamics, as noted by Biney and Boakye [7]. Several factors may account for this sprawling growth, but major contributory factors are the improved transportation networks in the two cities that link them to other regions and informal growth and development, which is commonly observed in developing countries [57]. Furthermore, the spread of such action threatens natural habitats and can threaten urban food security due to reduced agricultural land. This trend is exacerbated by the fact that the effectiveness of established laws and policies to regulate urban expansion and protect natural resources remains limited.

4.4. Mitigation Strategies and Policy Implications

Significant trends that can guide future planning and policy decisions are indicated by the land use patterns and directions of urban expansion revealed by this study. Without intervention, DAGL and GAMA will keep expanding uncontrollably. In order to reduce the growth strain on the existing urban periphery and limit urban expansion, a regional development strategy is therefore required and appropriate. Therefore, to address these challenges and promote more sustainable urban development, policymakers should prioritize implementing urban land use mix policies to promote the integration of diverse land uses within the same area. This study further demonstrates that, although DAGL and GAMA are undergoing rapid urban expansion, the evidence of urban sprawl implies the fragmentation of the areas. It also highlights an ongoing process of rapid peri-urbanization across the study areas and suggests that Togo and Ghana must enhance their planning frameworks to effectively manage rapid urban expansion. For both regions, putting effective urban development policies into practice is essential. Promoting green infrastructure, such as parks, is one way to enhance biodiversity and improve the quality of urban life. Additionally, integrating smart city technology can promote compact expansion to reduce land consumption, optimize resource usage, and enhance public services. Furthermore, encouraging community participation in urban planning processes is crucial to ensure that developments meet their local needs to minimize resource depletion.

4.5. Limitations and Future Scope

This study has limitations. Some of these include issues related to data resolution and quality, as well as temporal gaps and data availability. The temporal discrepancies between DAGL and GAMA may affect the continuity and comprehensiveness of the analysis. Additionally, the qualitative analysis of the drivers of LULC change, which could provide a deeper understanding of the dynamics behind these changes, was not fully explored. Furthermore, the analysis using Shannon’s entropy method to capture the overall extent of urban sprawl within the two metropolitan areas may not fully capture the low-density encroachment of built-up areas into the surrounding peripheral areas. Future research should adopt a mixed-methods approach to identify and quantify the key drivers of urban land use change and assess the impacts of urban expansion on ecosystem services. This would help in understanding the trade-offs between urban development and environmental sustainability. Additionally, future studies should incorporate both urban population and land area aspects into an urban index to provide a more comprehensive understanding of urban sprawl, particularly in capturing the nuances of low-density development in the surrounding rural areas. Expanding the comparative analysis to include additional cities in West Africa would also provide broader regional insights. Furthermore, future investigations should focus on the specific impacts of urban expansion on vulnerable communities living in informal settlements, job opportunities for rural residents or agricultural landowners, and environmental pollution. These areas of research would contribute to a more holistic understanding of urbanization’s socio-economic and environmental implications.

5. Conclusions

Assessing changes in urban land use patterns is crucial for understanding the dynamics of urban expansion. This study analyses the urban land use patterns in DAGL and GAMA from 1986 to 2023 and from 1991 to 2023, respectively, by combining geospatial techniques, the GEE platform, and the UEII. The findings demonstrate the effectiveness of this methodology in quantifying land use change and urban expansion over time and space. From 1986 to 2023 and 1991 to 2023, respectively, DAGL and GAMA experienced a dramatic transformation in land use, with a decrease in forest, grassland, and agricultural land, while built-up areas became the dominant land use, highlighting the rapid urbanization and significant change over the past three decades. The built-up share decreased from the city centers to peripheral areas. The results show DAGL and GAMA undergoing high-speed urban expansion, giving evidence of urban sprawl and indicating a fragmented urban landscape. Urban expansion in DAGL predominantly occurred in the northwest quadrant, while GAMA exhibited more angular growth towards both the northeast and northwest quadrants. These findings have significant implications for land management and urban development strategies. They provide critical insights for policymakers aimed at guiding ecosystem management and urban planning in West African cities. By emphasizing the integration of natural areas into urban environments, these insights can enhance residents’ quality of life. This research underscores the necessity for effective urban development policies that promote sustainable practices amidst rapid urbanization.

Author Contributions

Conceptualization, A.Y.T. and M.T.; methodology, A.Y.T. and M.T.; software, A.Y.T.; validation, A.Y.T.; formal analysis, A.Y.T.; investigation, A.Y.T.; data curation, A.Y.T.; writing—original draft preparation, A.Y.T.; writing—review and editing, A.Y.T., J.D., M.T., F.F. and A.A.O.; supervision J.D., M.T. and F.F.; funding acquisition, A.Y.T. and A.A.O. All authors have read and agreed to the published version of the manuscript.

Funding

This research was funded by the West Africa Science Service Centre on Climate Change and Adapted Land Use (WASCAL) at the Federal University of Technology of Minna, Nigeria (under grant number 01LG1808A), supported by the German Federal Ministry of Education and Research (BMBF) and through the project NetCDA (FKZ: 01LG2301A).

Data Availability Statement

“The original data presented in the study are openly available through the Google Earth Engine platform (https://developers.google.com/earth-engine/datasets, accessed on 5 January 2024). Specific datasets include [LANDSAT/LC09/C02/T1_L2; LANDSAT/LC08/C02/T1_L2; LANDSAT/LE07/C02/T1_L2; LANDSAT/LT05/C02/T1_L2; LANDSAT_LT04_C02_T1_L2]” (accessed on 8 January 2024).

Conflicts of Interest

The authors declare no conflicts of interest.

References

  1. Pande, C.B.; Moharir, K.N.; Varade, A.M.; Abdo, H.G.; Mulla, S.; Yaseen, Z.M. Intertwined impacts of urbanization and land cover change on urban climate and agriculture in Aurangabad city (MS), India using google earth engine platform. J. Clean. Prod. 2023, 422, 138541. [Google Scholar] [CrossRef]
  2. UN-Habitat, World Urbanization Prospects. 2018. Available online: https://population.un.org/wup/assets/WUP2018-Report.pdf (accessed on 5 November 2023).
  3. Ingwani, E.; Thynell, M.; Gurure, L.R.; Ekelund, N.G.A.; Gumbo, T.; Schubert, P.; Nel, V. The Impacts of Peri-Urban Expansion on Municipal and Ecosystem Services: Experiences from Makhado Biaba Town, South Africa. Urban Forum 2024, 35, 297–327. [Google Scholar] [CrossRef]
  4. INSEED, Résultats Définitifs du RGPH-5 (Novembre 2022). Available online: https://inseed.tg/resultats-definitifs-du-rgph-5-novembre-2022/ (accessed on 7 July 2023).
  5. GSS. Ghana 2021 Population and Housing Census. General Report. 2021. Available online: https://www.bing.com/search?q=Ghana+2021+Population+and+Housing+Census+General+Report+pdf (accessed on 10 January 2023).
  6. Cobbinah, P.B.; Asibey, M.O.; Gyedu-Pensang, Y.A. Urban land use planning in Ghana: Navigating complex coalescence of land ownership and administration. Land Use Policy 2019, 99, 105054. [Google Scholar] [CrossRef]
  7. Biney, E.; Boakye, E. Urban sprawl and its impact on land use land cover dynamics of Sekondi-Takoradi metropolitan assembly, Ghana. Envir. Chall. 2021, 4, 100168. [Google Scholar] [CrossRef]
  8. Sahalu, A.G. Analysis of Urban Land Use and Land Cover Changes: A Case Study in Bahier Dar, Ethiopia. Master’s Thesis, University of Lisbon, Lisbon, Portugal, 2014. [Google Scholar]
  9. Tsurusaki, N.; Salem, M. Impacts of Rapid Urban Expansion on Peri-Urban Landscapes in the Global South: Insights from Landscape Metrics in Greater Cairo. Sustainability 2024, 16, 2316. [Google Scholar] [CrossRef]
  10. Ahlstom, A.; Xia, J.; Arneth, A.; Luo, Y.; Smith, B. Corrigendum: Importance of vegetation dynamics for furture terrestrial carbon cycling. Environ. Res. Lett. 2015, 10, 13. [Google Scholar]
  11. Pan, X.; Zhenyi, W.; Gao, Y.; Dang, X.; Han, Y. Detailed and automated classification of land use/land cover using machine learning algorithms in Google earth Engine. Geacarto Int. 2021, 37. [Google Scholar] [CrossRef]
  12. Somadjago, M.; Cissokho, D.; Suka, D.K. Mutations socio-économiques et demographiques des espaces ruraux phagocytés par la ville de LOMÉ. Rev. Espac. Geogr. Soc. Marocaine 2020, 36, 27–43. [Google Scholar]
  13. Blakime, T.H.; Komi, K.; Adjonou, K.; Hlovor, A.K.D.; Gbafa, K.S.; Oyedele, P.B.; Polorigni, B.; Kokou, K. Dynamics of Built-Up Areas and Challenges of Planning and Development of Urban Zone of Greater Lomé in Togo, West Africa. Land 2024, 13, 84. [Google Scholar] [CrossRef]
  14. Takili, M.; Danvide, T.B.; Banon, F. Adétikopé, un pôle urbain émergent à Lomé: Entre dynamisme de la migration résidentielle et de la masse urbaine. Regardsuds. 2020. Available online: https://regardsuds.org/adetikope-un-pole-urbain-emergent-a-lome-entre-dynamisme-de-la-migration-residentielle-et-de-la-masse-urbaine/ (accessed on 1 November 2023).
  15. Amouzoukpo, K. Dynamique Residentielle, Mutations Sociospatiales et Environnementales a Agoenyive (Peripherie Nord De lome au Togo). Ph.D. Thesis, Université de Lomé, Lomé, Togo, 2021. [Google Scholar]
  16. Asabere, B.; Acheampong, R.A.; Ashiagbor, G.; Beckers, S.C.; KecAk, M.; Erasmi, S.; Schanze, J. Sauer, Urbanization, land use transformation and spatio-environmental impacts: Analyses of trends and implications in major metropolitan regions of Ghana. Land Use Policy 2020, 96, 104707. [Google Scholar] [CrossRef]
  17. Toure, S.I.; Stow, D.A.; Clarke, K.; Weeks, J. Patterns of land cover and land use change within the two major metropolitan areas of Ghana. Geocarto Int. 2020, 35, 209–223. [Google Scholar] [CrossRef]
  18. Addae, B.; Oppelt, N. Land-Use/Land-Cover Change Analysis and Urban Growth Modelling in the Greater Accra Metropolitan Area (GAMA), Ghana. Urban. Sci. 2019, 3, 26. [Google Scholar] [CrossRef]
  19. Akubia, J.E.K.; Bruns, A. Unravelling the frontiers of urban growth: Spatio-Temporal dynamics of land-use change and urban expansion in greater Accra metropolitan area, Ghana. Land 2019, 8, 131. [Google Scholar] [CrossRef]
  20. Puplampu, D.A.; Boafo, Y.A. Exploring the impacts of urban expansion on green spaces availability and delivery of ecosystem services in the Accra Metropolis. J. Environ. Chall. 2021, 5, 100283. [Google Scholar] [CrossRef]
  21. Annan, E.; Amponsah, W.; Adjei, K.A.; Disse, M.; Hounkpè, J.; Biney, E.; Agbenorhevi, A.E.; Agyare, W.A. Spatio-temporal land use and land cover change assessment: Insights from the Ouémé River Basin. Sci. Afr. 2023, 25, e02262. [Google Scholar] [CrossRef]
  22. Akpagana, K.; Bouehet, P. Etat actuel des connaissances sur la flore et la végétation du Togo. Acta Bot. Gall. 1994, 141, 367–372. [Google Scholar] [CrossRef]
  23. Kokou, K. Les Mosaïques Forestières au sud du Togo: Biodiversité, Dynamique et Activités Humaines. Ph.D. Thesis, University of Montpellier II, Montpellier, France, 1998. [Google Scholar]
  24. Afidégnon, D. Les Mangroves et les Formations Associées du Sud-Est du Togo: Analyse Ecofloristique et Cartographique par Télédétection Spatiale. Ph.D. Thesis, Université de Lomé, Lomé, Togo, 1999. [Google Scholar]
  25. de Foucault, B.; Akpagana, K.; Batawila, K.; Bouchet, P. Contribution à une étude phytosociologique du littoral sableux du Togo. Acta Bot. Gall. 2000, 147, 333–344. [Google Scholar] [CrossRef]
  26. Bawa, A.; Djalna, K.; Kamou, H.; Batawila, K.; Imbernon, J.; Akpagana, K. Role of Women in Maintaining Suburban Agricultural Land in Togo (West Africa). Sci. Res. 2021, 8, e8182. [Google Scholar] [CrossRef]
  27. Gyimah, R.R.; Antwi, R.A.; Attua, E.M.; Owusu, A.B.; Doe, E.K. Trading greens for heated surfaces: Land surface temperature and perceived health risk in Greater Accra Metropolitan Area, Ghana. Egypt. J. Remote Sens. Sp. Sci. 2023, 26, 861–880. [Google Scholar] [CrossRef]
  28. Olofsson, P.; Foody, G.M.; Herold, M.; Stehman, S.V.; Woodcock, C.E.; Wulder, M.A. Good practices for estimating area and assessing accuracy of land change. Remote Sens. Environ. 2014, 148, 42–57. [Google Scholar] [CrossRef]
  29. Loukika, K.N.; Keesara, V.R.; Sridhar, V. Analysis of land use and land cover using machine learning algorithms on google earth engine for Munneru river basin, India. Sustainability 2021, 13, 24. [Google Scholar] [CrossRef]
  30. Hengl, T.; Heuvelink, G.B.; Kempen, B.; Leenaars, J.G.; Walsh, M.G.; Shepherd, K.D.; Sila, A.; MacMillan, R.A.; Mendes de Jesus, J.; Tamene, L.; et al. Mapping soil properties of Africa at 250 m resolution: Random forests significantly improve current predictions. PLoS ONE 2015, 10, e0125814. [Google Scholar] [CrossRef]
  31. Breiman, L. Random Forests. Mach. Learn. 2001, 45, 5–32. [Google Scholar] [CrossRef]
  32. Belgiu, M.; Dragut, L. Random Forest in remote sensing: A review of applications and future directions. Photogramm. Remote Sens. 2016, 114, 24–31. [Google Scholar] [CrossRef]
  33. Mosammam, M.H.; Nia, J.T.; Khani, H.; Teymouri, A.; Kazemi, M. Monitoring land use change and measuring urban sprawl based on its spatials forms. The case of Qom city. Egypt. J. Remote Sens. Sp. Sci. 2016, 20, 103–116. [Google Scholar]
  34. Wiafe, E.D.; Asamoah, G. Land-cover change assessment in Ejisu-Juabeng district in Ghana. Euraian J. For. Sci. 2018, 6, 1–8. [Google Scholar] [CrossRef]
  35. Long, H.; Tang, G.; Li, X.; Heilig, G.K. Socio-economic driving forces of land-use change in Kunshan, the Yangtze River Delta economic area of China. Environ. Manag. 2007, 83, 351–364. [Google Scholar] [CrossRef]
  36. García-Álvarez, D.; Olmedo, M.T.C.; Mas, J.-F.; Paegelow, M. Land Use Cover Datasets and Validation Tools; Springer International Publishing: Berlin/Heidelberg, Germany, 2022. [Google Scholar]
  37. Cao, H.; Liu, J.; Chen, J.; Gao, J.; Wang, G.; Zhang, W. Spatiotemporal patterns of urban land use change in typical cities in the Greater Mekong Subregion (GMS). Remote Sens. 2019, 11, 7. [Google Scholar] [CrossRef]
  38. Al-Kafy; Hasan, M.M.; Islam, A.-A.-F.M.; Rahman, M.S. Modelling future land use land cover changes and their impacts on land surface temperatures in Rajshahi, Bangladesh. Remote Sens. Appl. Soc. Env. 2020, 18, 100314. [Google Scholar]
  39. Qian, Y.; Wu, Z. Study on urban expansion using the spatial and temporal dynamic changes in the impervious surface in Nanjing. Sustainability 2019, 11, 933. [Google Scholar] [CrossRef]
  40. Rahman, M.T. Land use and land cover changes and urban sprawl in riyadh, saudi arabia: An analysis using multi-temporal landsat data and shannon’ s entropy index. Int. Arch. Photogramm. Remote Sens. 2016, XLI-B8, 1017–1021. [Google Scholar] [CrossRef]
  41. Malligai, M.A.; Jegankumar, R. Mapping Urban Sprawl and Measuring Urban Density using Shannon Entropy: A Case Study of Salem City and its Environ. Int. J. Sci. Res. 2018, 7, 4. [Google Scholar]
  42. Devendran, A.A.; Banon, F. Spatio-Temporal Land Cover Analysis and the Impact of Land Cover Variability Indices on Land Surface Temperature in Greater Accra, Ghana Using Multi-Temporal Landsat Data. J. Geogr. Inf. Syst. 2022, 14, 240–258. [Google Scholar] [CrossRef]
  43. MoFA (Ministry of Food and Agriculture). Agriculture in Ghana 2018. Available online: https://mofa.gov.gh/site/images/pdf/AGRIC%20IN%20GHANA%20F&F_2018.pdf (accessed on 21 February 2024).
  44. Barman, S.; Roy, D.; Sarkar, B.C.; Almohamad, H.; Abdo, H.G. Assessment of urban growth in relation to urban sprawl using landscape metrics and Shannon’s entropy model in Jalpaiguri urban agglomeration, West Bengal, India. Geocarto Int. 2024, 39, 1. [Google Scholar] [CrossRef]
  45. Tessema, W.M.; Abebe, G.B. Quantification of land use/land cover dynamics and urban growth in rapidly urbanized countries: The case Hawassa city, Ethiopia. Urban. Plan. Transp. Res. 2023, 11, 1. [Google Scholar]
  46. Yang, Y.; Liu, Y.; Li, Y.; Du, G. Quantifying spatio-temporal patterns of urban expansion in Beijing during 1985–2013 with rural-urban development transformation. Land Use Policy. 2018, 74, 220–230. [Google Scholar] [CrossRef]
  47. Al-Sharif, A.A.A.; Pradhan, B.; Shafri, H.Z.M.; Mansor, S. Quantitative analysis of urban sprawl in Tripoli using Pearson’s Chi-Square statistics and urban expansion intensity index. IOP Conf. Ser. Earth Environ. Sci. 2014, 20, 1–8. [Google Scholar] [CrossRef]
  48. Hetcheli, F.; Dandonougbo, I.; Biakouye, A.K. Du village à l’espace périurbain: Mutations socio-économiques du canton d’adetikope, un territoire sous influence de lome (Togo). Homme Soc. 2017, 2409–9791. [Google Scholar]
  49. Owusu, G. Coping with Urban Sprawl: A Critical Discussion of the Urban Containment Strategy in a Developing Country City, Accra. J. Urban. 2013, 2, 17. [Google Scholar]
  50. Adu-Boahen, K.; Addai, M.O.; Hayford, S.C.; Adjovu, E.T.; Yeboah, D.O.; Mensah, P. Human-environment nexus: Evaluating the anthropo-geomorphology and urban expansion of the Weija Gbawe Municipality, Ghana. Discov. Environ. 2023, 1, 21. [Google Scholar] [CrossRef]
  51. Acheampong, R.A.; Agyemang, F.S.K.; Abdul-Fatawu, M. Quantifying the spatio-temporal patterns of settlement growth in a metropolitan region of Ghana. Geo J. 2017, 82, 823–840. [Google Scholar] [CrossRef]
  52. Owusu-Ansah, J.K.; Dery, J.M.; Amoako, C. Flood vulnerability and coping mechanisms around the Weija Dam near Accra, Ghana. Geo J. 2019, 84, 1597–1615. [Google Scholar] [CrossRef]
  53. Agyemang, F.S.K.; Amedzro, K.K.; Silva, E. The emergence of city-regions and their implications for contemporary spatial governance: Evidence from Ghana. Cities 2017, 71, 70–79. [Google Scholar] [CrossRef]
  54. Duan, Q.; Tan, M.; Guo, Y.; Wang, X.; Xin, L. Understanding the spatial distribution of urban forests in China using Sentinel-2 images with Google Earth Engine. Forests 2019, 10, 729. [Google Scholar] [CrossRef]
  55. Haldar, S.; Chatterjee, U.; Bhattacharya, S.; Paul, S.; Bindajam, A.A.; Mallick, J.; Abdo, H.G. Peri-urban dynamics: Assessing expansion patterns and influencing factors. Ecol. Process. 2024, 13, 1. [Google Scholar] [CrossRef]
  56. Aswal, P.; Saini, R.; Ansari, T.M. Spatio-Temporal Monitoring of Urban Sprawl using GIS and Remote Sensing Technique. Int. J. Comput. Appl. 2018, 182, 11–24. [Google Scholar] [CrossRef]
  57. Xu, G.; Dong, T.; Cobbinah, P.B.; Jiao, L.; Sumari, N.S.; Chai, B.; Liu, Y. Urban Expansion and Form Changes across African Cities with a Global 2 Outlook: Spatiotemporal Analysis of Urban Land Densities. J. Clean. Prod. 2019, 224, 802–810. [Google Scholar] [CrossRef]
Figure 1. Map of the study area, showing the District Autonome du Grand Lomé (DAGL) in Togo and the Greater Accra Metropolitan Area (GAMA) in Ghana.
Urbansci 09 00084 g001
Figure 2. Trend of population in DAGL and GAMA from 1980 to 2022.
Urbansci 09 00084 g002
Figure 3. Flow chart of the research methodology.
Urbansci 09 00084 g003
Figure 4. Land use/land cover distribution over DAGL and GAMA.
Urbansci 09 00084 g004
Figure 5. Share of built-up area in DAGL and GAMA.
Urbansci 09 00084 g005
Figure 6. Spatial orientation of urban expansion with gradient-direction in DAGL.
Urbansci 09 00084 g006
Figure 7. Spatial orientation of urban expansion with gradient-direction in GAMA.
Urbansci 09 00084 g007
Table 1. Summary of the datasets used in the study.
AreaSatelliteSensorSpatial ResolutionDate
District Autonome du Grand Lomé (DAGL)Landsat 5TM30 m1986
Landsat 7ETM+30 m2001
Landsat 8OLI/TIRS30 m2015
Landsat 8OLI/TIRS30 m2023
Greater Accra Metropolitan Area (GAMA)Landsat 4TM30 m1991
Landsat 7ETM+30 m2002
Landsat 7ETM+30 m2017
Landsat 9OLI/TIRS30 m2023
Table 2. Description of land use land cover classes.
LULC TypesDescription
ForestForest reserves, Land dominated by trees
GrasslandMixed grassland with scatter trees, herbaceous vegetation, shrubs, gardens, parks
Agricultural landIrrigated and rainfed croplands, plantations, pastures
Built-up/Bare landResidential, industrial, and commercial units, highways and transportation, power and communications facilities, lands with exposed soil surface, exposed rock, quarries and gravel pits
Water bodiesLakes, rivers, streams, canals, reservoirs, lagoons
Table 3. Area coverage, absolute change, and average annual rate of change for DAGL.
Land Cover TypeArea (km2)Absolute Change (km2)Average Annual Rate of Change (%)
19862001201520231986–20012001–20152015–20231986–
2023
1986–20012001–20152015–20231986–2023
Forest92.31
(24.04%)
32.34
(8.42%)
15.42
(4.01%)
13.17
(3.43%)
−59.96−16.93−2.25−79.14−4.33−3.74−1.82−2.32
Grassland84.81
(22.09%)
106.52
(27.74%)
47.40
(12.34%)
28.32
(7.38%)
21.70−59.12−19.07−56.491.71−3.96−5.03−1.80
Agriculture land135.78
(35.36%)
125.44
(32.66%)
150.36
(39.15)
104.15
(27.12%)
−10.3324.9246.22−31.63−0.511.42−3.84−0.63
Water bodies2.56
(0.67%)
1.81
(0.47%)
2.12
(0.55%)
1.21
(0.32%)
0.740.31−0.91−1.34−1.941.21−5.35−1.42
Built-up/Bare land68.58
(17.86%)
117.93
(30.71%)
168.76
(43.94%)
237.16
(61.67%)
49.3550.8368.40168.584.803.085.076.64
Table 4. Area coverage, absolute change, and average annual rate of change for GAMA.
Land Cover TypeArea (km2)Absolute Change (km2)Average Annual Rate of Change (%)
19912002201720231991–20022002–20172017–20231991–20231991–20022002–20172017–20231991–2023
Forest511.78
(34%)
304.15
(20%)
150.50
(10%)
36.45
(2%)
−207.62−153.65−114.05−475.33−3.69−3.37−12.63−2.90
Grassland622.57
(42%)
259.54
(17%)
247.80
(16%)
58.13
(4%)
−363.03−11.74−189.66−564.44−5.30−0.30−12.76−2.83
Agriculture land176.84
(12%)
439.38
(29%)
285.91
(19%)
321.69
(21%)
262.54−153.4835.78144.8513.50−2.332.092.56
Water bodies33.86
(2%)
32.92
(2%)
33.73
(2%)
30.92
(2%)
−0.930.81−2.81−2.94−0.250.16−1.39−0.27
Built-up/Bare land152.23
(10%)
461.28
(31%)
779.34
(52%)
1050.09
(70%)
309.05318.06270.75897.8618.464.605.7918.43
Table 5. Accuracy assessment of different years for DAGL.
YearsUser Accuracy (%)Producer Accuracy (%) Overall
Accuracy (%)
WaterBlt/BrlFrsGrasAgricWaterBlt/BrlFrsGrasAgric
1986100908989911008594878890.12
200196968892891009786889291.36
201597989191901009986869693.94
2023989792929510010093869395.59
Blt/Brl—built-up/bare land, Frs—forest, Gras—grassland, Agric—agriculture land.
Table 6. Accuracy assessment of different years for GAMA.
YearsUser Accuracy (%)Producer Accuracy (%)Overall
Accuracy (%)
WaterBlt/BrlFrsGrasAgricWaterBlt/BrlFrsGrasAgric
199199949190911009591909091.36
200298979396941009993919695.13
20171009996959410010091889996.47
2023999994949610099100959297.34
Blt/Brl—built-up/bare land, Frs—forest, Gras—grassland, Agric—agriculture land.
Table 7. The built-up area in different quadrant-wise directions and UEII values from 1986 to 2023 in DAGL.
QuadrantsBuilt-Up Area (km2)Difference in Area (km2)Urban Expansion Intensity Index UEII (%)
19862001201520231986–20012001–20152015–20231986–20012001–20152015–2023
Q14.788.3015.4126.293.527.1010.890.340.721.94
Q27.9710.6515.9417.822.685.281.880.541.140.71
Q310.9314.8922.4625.113.967.572.650.571.180.72
Q421.3426.5129.8131.545.163.301.731.040.710.66
Q141.068.8916.8732.527.837.9815.651.241.364.66
Q156.5119.8733.4852.8213.3613.6119.341.441.573.90
Q1610.9022.7728.6642.8711.875.9014.200.920.492.06
Table 8. The built-up area in different quadrant-wise directions and UEII values from 1991 to 2023 in GAMA.
QuadrantsBuilt-Up Area (km2)Difference in Area (km2)UEII (%)
19912002201720231991–20022002–20172017–20231991–20022002–20172017–2023
Q111.1635.3080.57136.8424.1545.2656.281.041.434.45
Q27.4859.49131.40168.2952.0171.9136.892.212.242.88
Q339.32134.69188.20202.2995.3753.5114.094.001.641.08
Q1212.7532.2362.9573.8119.4730.7310.862.042.362.09
Q1312.8739.8550.0383.3426.9910.1833.312.010.564.55
Q1417.9641.4875.67132.5523.5134.1956.880.750.803.34
Q1518.3353.97101.31141.3535.6447.3340.041.691.643.48
Q1613.1438.1764.4584.9625.0326.2820.511.611.242.41
Disclaimer/Publisher’s Note: The statements, opinions and data contained in all publications are solely those of the individual author(s) and contributor(s) and not of MDPI and/or the editor(s). MDPI and/or the editor(s) disclaim responsibility for any injury to people or property resulting from any ideas, methods, instructions or products referred to in the content.

