
Urban Networks and Tourism Development: Analyzing the Relationship Between Globalization and World Cities (GaWC) Rankings and Travel and Tourism Development Index (TTDI)


Abstract
1. Introduction
2. Literature Review
3. Materials and Methods
3.1. Data
3.2. Linear Regression Model
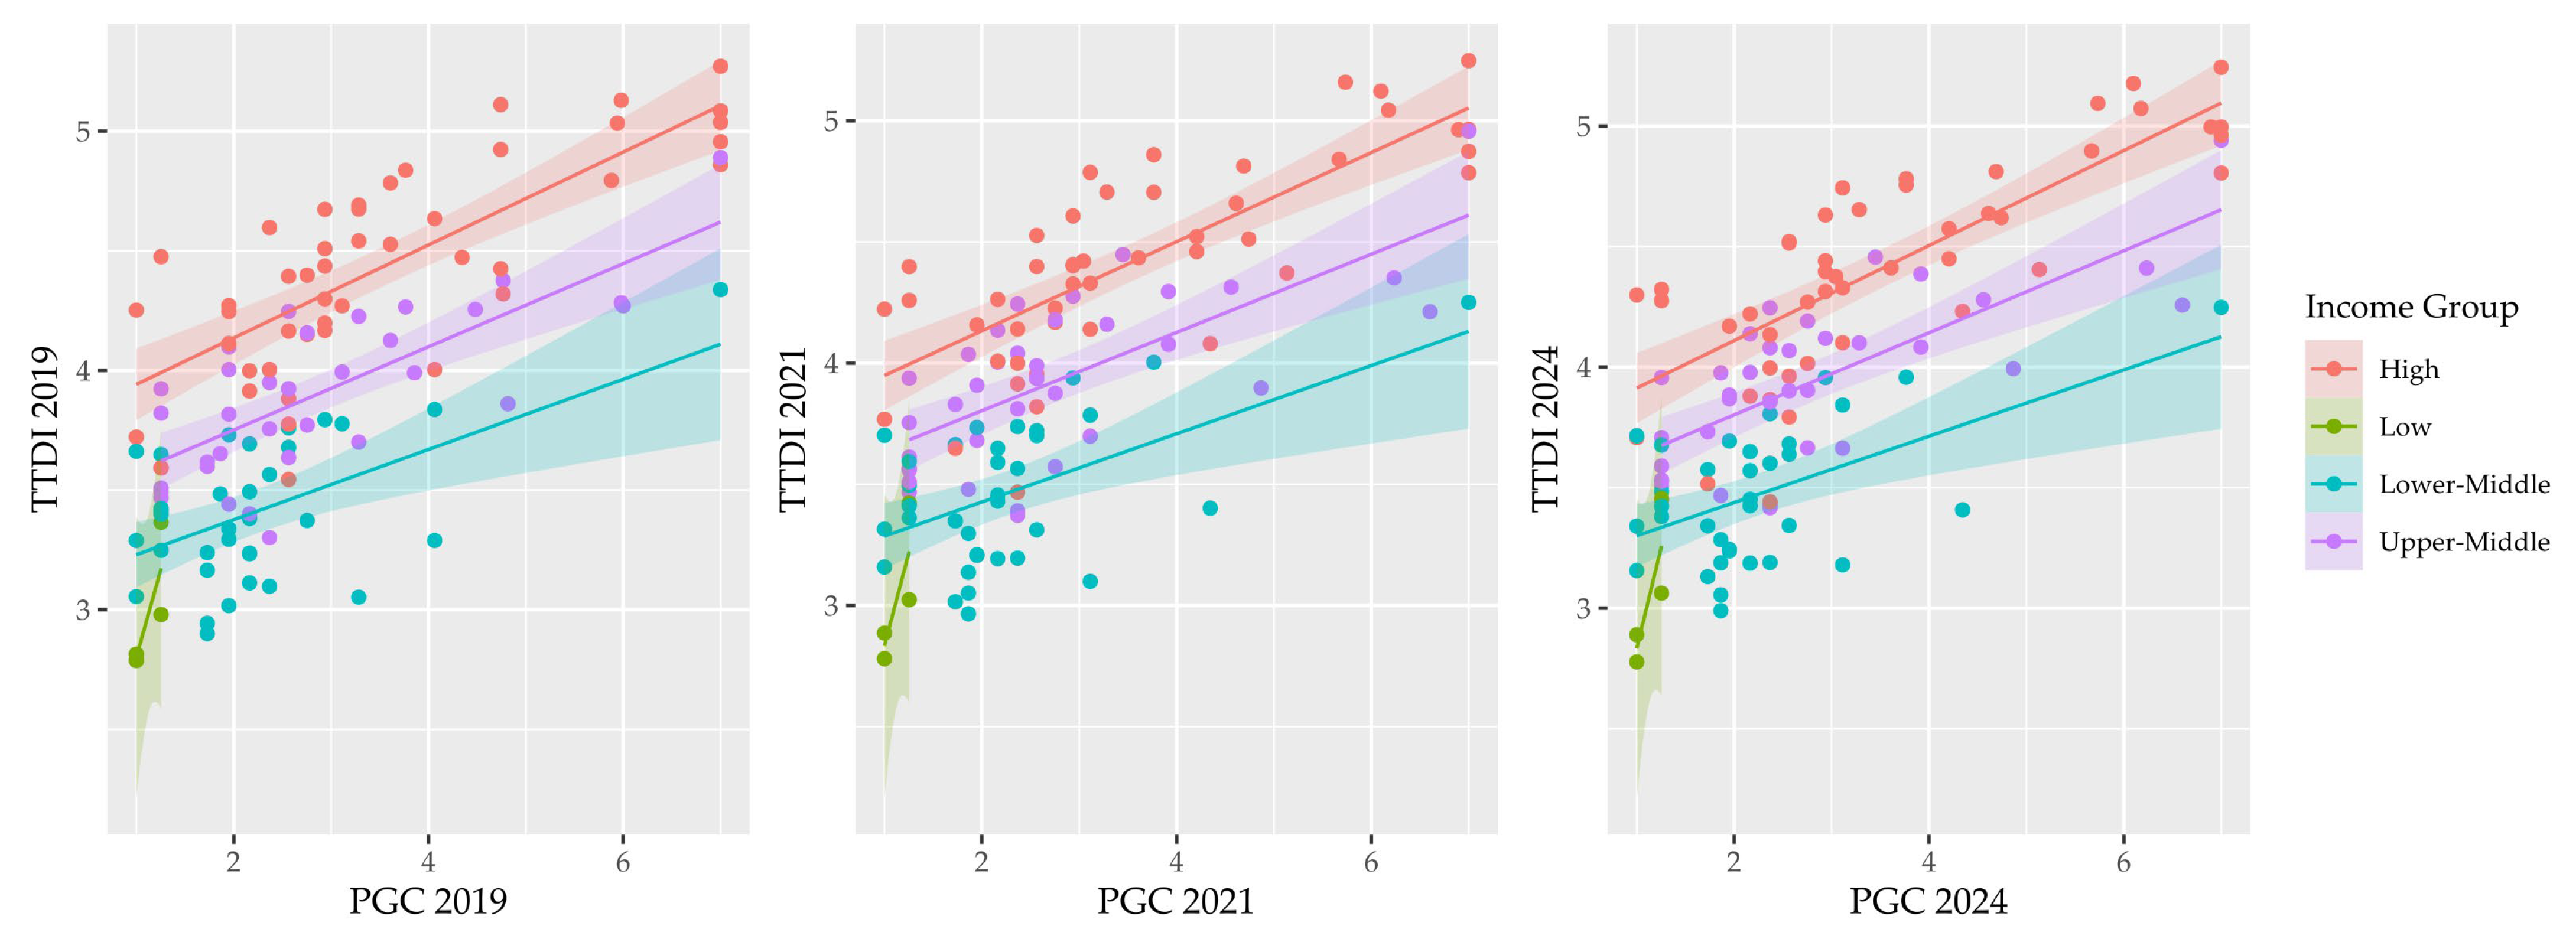
4. Results
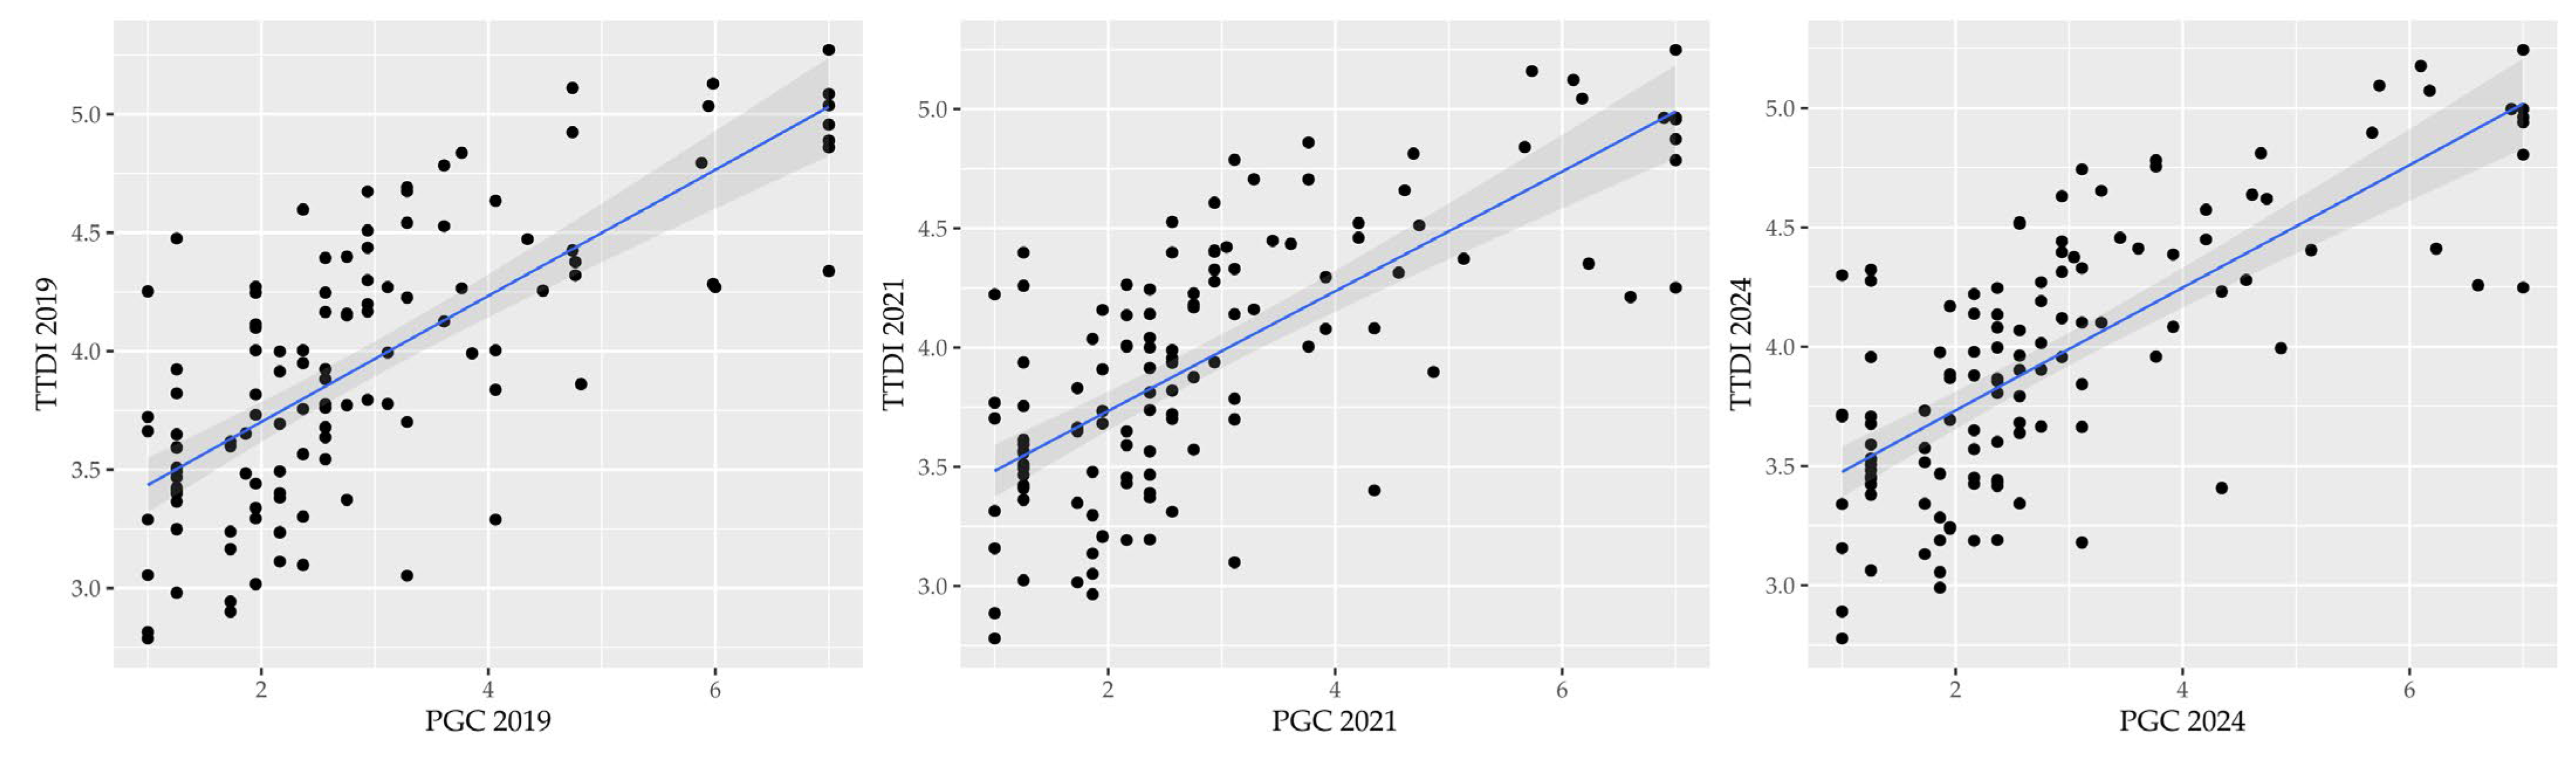
- The relationship between the PGC and the TTDI was consistently positive across all three years (2019, 2021, and 2024), suggesting a robust trend that holds over time.
- All regression coefficients (β0 and β1) were statistically significant, reinforcing the reliability of the model.
- The R2 value of around 0.5 indicates that the model explains about 50% of the variance in TTDI, which is a solid moderate fit for the data.
- While the R2 value is moderate, it also means that there is still 50% of the variance in the TTDI unexplained by the PGC, suggesting that other factors might be influencing the TTDI scores.
- The analysis is based on only three years of data (2019, 2021, and 2024), which limits the ability to draw broader conclusions over time or to account for possible long-term changes in the relationship.
- Exploring other variables that might explain the remaining 50% of the variance could improve the model and provide a more comprehensive understanding of the TTDI.
- Countries with higher levels of PGC could be targeted for policies aimed at improving TTDI scores, as the consistent relationship suggests potential for interventions in PGC-related areas.
- Extending the analysis to additional years could strengthen the findings and allow for a deeper understanding of temporal trends.
- The model assumes no heteroscedasticity and that the regression coefficients are stable across the three years. If the assumptions do not hold in the future, it could undermine the reliability of the results.
- Other external, unaccounted-for factors might be affecting the TTDI scores, making it difficult to predict future trends accurately using only the PGC as a predictor.
5. Discussion
6. Conclusions
Funding
Data Availability Statement
Conflicts of Interest
Abbreviations
| BP | Breusch–Pagan test |
| GaWC | Globalization and World Cities |
| PGC | Presence of Global Cities |
| Q1 | First quartile |
| Q3 | Third quartile |
| R2 | Coefficient of determination |
| S.D. | Standard Deviation |
| TTDI | Travel and Tourism Development Index |
Appendix A

| Asia–Pacific | Europe and Eurasia | Middle East and North Africa | Sub-Saharan Africa | The Americas | |||||||
|---|---|---|---|---|---|---|---|---|---|---|---|
| AUS | MNG | ALB | EST | KGZ | ROU | DZA | LBN | AGO | NAM | ARG | CHL |
| BGD | NPL | ARM | FIN | LVA | SRB | BHR | MAR | BEN | NGA | BRB | JAM |
| KHM | NZL | AUT | FRA | LTU | SVK | EGY | OMN | BWA | RWA | BOL | MEX |
| CHN | PAK | AZE | GEO | LUX | SVN | IRN | QAT | CMR | SEN | BRA | NIC |
| IND | PHL | BEL | DEU | MLT | ESP | ISR | SAU | CIV | SLE | CAN | PAN |
| IDN | SGP | BIH | GRC | MDA | SWE | JOR | TUN | GHA | ZAF | COL | PRY |
| JPN | LKA | BGR | HUN | MNE | CHE | KWT | ARE | KEN | TZA | CRI | PER |
| KOR | THA | HRV | ISL | NLD | TJK | MWI | ZMB | DOM | TTO | ||
| LAO | VNM | CYP | IRL | MKD | TUR | MLI | ZWE | ECU | USA | ||
| MYS | CZE | ITA | POL | GBR | MUS | SLV | URY | ||||
| DNK | KAZ | PRT | UZB | GTM | VEN | ||||||
| HND | |||||||||||
| High | Upper-Middle | Lower-Middle | Low | |||||||
|---|---|---|---|---|---|---|---|---|---|---|
| AUS | FRA | LVA | SVK | ALB | SLV | MNE | DZA | IRN | SEN | MWI |
| AUT | DEU | LTU | SVN | ARG | GEO | NAM | AGO | JOR | LKA | MLI |
| BHR | GRC | LUX | ESP | ARM | GTM | MKD | BGD | KEN | TJK | RWA |
| BRB | HUN | MLT | SWE | AZE | CHN | PAN | BEN | KGZ | TZA | SLE |
| BEL | CHL | NLD | CHE | BIH | IDN | PRY | BOL | LAO | TUN | |
| CAN | ISL | NZL | TTO | BWA | JAM | PER | KHM | MNG | UZB | |
| HRV | IRL | OMN | ARE | BRA | KAZ | ROU | CMR | MAR | VEN | |
| CYP | ISR | POL | GBR | BGR | LBN | SRB | CIV | NPL | VNM | |
| CZE | ITA | PRT | USA | COL | MYS | ZAF | EGY | NIC | ZMB | |
| DNK | JPN | QAT | URY | CRI | MUS | THA | GHA | NGA | ZWE | |
| EST | KOR | SAU | DOM | MEX | TUR | HND | PAK | |||
| FIN | KWT | SGP | ECU | MDA | IND | PHL | ||||
References
- Abdrabo, K.I.; Mabrouk, M.; Marzouk, A. Urban Competitiveness Assessment Using the Integration of the Global Power City Index and Multicriteria Decision-Making Methods. J. Urban Plan. Dev. 2024, 150, 04024025. [Google Scholar] [CrossRef]
- Maxim, C. Trends and issues in world tourism cities. In Routledge Handbook of Trends and Issues in Global Tourism Supply and Demand; Morrison, A.M., Buhalis, D., Eds.; Routledge: New York, NY, USA, 2023. [Google Scholar]
- Taylor, P.J. World City Network: A Global Urban Analysis; Routledge: New York, NY, USA, 2004. [Google Scholar]
- Beaverstock, J.V.; Smith, R.G.; Taylor, P.J.; Walker, D.R.; Lorimer, H. Globalization and world cities: Some measurement methodologies. Appl. Geogr. 2000, 20, 43–63. [Google Scholar] [CrossRef]
- Moore, A.; Phillips, C. Travel & Tourism Development Index 2024; World Economic Forum: Geneva, Switzerland, 2024. [Google Scholar]
- Qazi, A. Exploring the interdependent drivers of tourism competitiveness: Insights from the Travel and Tourism Development Index. Compet. Rev. Int. Bus. J. 2024. ahead of print. [Google Scholar] [CrossRef]
- Maitland, R.; Newman, P. Developing world tourism cities. In World Tourism Cities: Developing Tourism off the Beaten Track; Maitland, T., Newman, P., Eds.; Routledge: New York, NY, USA, 2009; pp. 1–21. [Google Scholar]
- Berdenov, Z.; Kakimzhanov, Y.; Arykbayeva, K.; Assylbekov, K.; Wendt, J.A.; Kaimuldinova, K.D.; Beketova, A.; Ataeva, G.; Kara, T. Sustainable Development of the Infrastructure of the City of Astana Since the Establishment of the Capital as a Factor of Tourism Development. Sustainability 2024, 16, 10931. [Google Scholar] [CrossRef]
- Cantwell, J.; Zaman, S. International knowledge connectivity and the increasing concentration of innovation in major global cities. J. Econ. Geogr. 2024, 24, 415–440. [Google Scholar] [CrossRef]
- Goerzen, A.; Asmussen, C.G.; Nielsen, B.B. Global cities, the liability of foreignness, and theory on place and space in international business. J. Int. Bus. Stud. 2024, 55, 10–27. [Google Scholar] [CrossRef]
- Henderson, J. Global cities, Tokyo, urban tourism. Int. J. Tour. Cities 2017, 3, 143–157. [Google Scholar] [CrossRef]
- Taylor, P.; Derudder, B. World City Network: A Global Urban Analysis; Routledge: New York, NY, USA, 2015. [Google Scholar]
- Kutty, A.A.; Abdella, G.M.; Kucukvar, M.; Onat, N.C.; Bulu, M. A system thinking approach for harmonizing smart and sustainable city initiatives with United Nations sustainable development goals. Sustain. Dev. 2020, 28, 1347–1365. [Google Scholar] [CrossRef]
- Rodrigues, M.; Franco, M. Measuring the urban sustainable development in cities through a Composite Index: The case of Portugal. Sustain. Dev. 2020, 28, 507–520. [Google Scholar] [CrossRef]
- Ahvenniemi, H.; Huovila, A. How do cities promote urban sustainability and smartness? An evaluation of the city strategies of six largest Finnish cities. Environ. Dev. Sustain. 2021, 23, 4174–4200. [Google Scholar] [CrossRef]
- Spirou, C. Urban Tourism and Urban Change: Cities in A Global Economy; Routledge: New York, NY, USA, 2011; pp. 73–104. [Google Scholar]
- Zhao, W.; Li, X. Globalization of tourism and third world tourism development: A political economy perspective. Chin. Geogr. Sci. 2006, 16, 203–210. [Google Scholar] [CrossRef]
- Alvarez, M.D.; Yarcan, Ş. Istanbul as a world city: A cultural perspective. Int. J. Cult. Tour. Hosp. Res. 2010, 4, 266–276. [Google Scholar] [CrossRef]
- Vind, I.; Fold, N. City networks and commodity chains: Identifying global flows and local connections in Ho Chi Minh City. Glob. Netw. 2010, 10, 54–74. [Google Scholar] [CrossRef]
- Page, S.J.; Duignan, M. Progress in Tourism Management: Is urban tourism a paradoxical research domain? Progress since 2011 and prospects for the future. Tour. Manag. 2023, 98, 104737. [Google Scholar] [CrossRef]
- Panasiuk, A. Policy of sustainable development of urban tourism. Pol. J. Sport Tour. 2020, 27, 33–37. [Google Scholar] [CrossRef]
- Edwards, D.; Griffin, T.; Hayllar, B. Urban tourism research: Developing an agenda. Ann. Tour. Res. 2008, 35, 1032–1052. [Google Scholar] [CrossRef]
- Grah, B.; Dimovski, V.; Peterlin, J. Managing sustainable urban tourism development: The case of Ljubljana. Sustainability 2020, 12, 792. [Google Scholar] [CrossRef]
- Romero-García, L.E.; Aguilar-Gallegos, N.; Morales-Matamoros, O.; Badillo-Piña, I.; Tejeida-Padilla, R. Urban tourism: A systems approach–state of the art. Tour. Rev. 2019, 74, 679–693. [Google Scholar] [CrossRef]
- Gladstone, D.L.; Fainstein, S.S. Tourism in US global cities: A comparison of New York and Los Angeles. J. Urban Aff. 2001, 23, 23–40. [Google Scholar] [CrossRef]
- Maxim, C. Challenges faced by world tourism cities–London’s perspective. Curr. Issues Tour. 2019, 22, 1006–1024. [Google Scholar] [CrossRef]
- Liu, C.; Sun, S.; Piao, J.; Mao, W. Unveiling the dynamics and determinants of world city network: Insights from global airline data. Cities 2025, 157, 105613. [Google Scholar] [CrossRef]
- Morrison, A.M.; Maxim, C. World Tourism Cities: A Systematic Approach to Urban Tourism; Routledge: New York, NY, USA, 2021. [Google Scholar]
- Tai, A.C.; Wong, D.W.; Lee, H.F.; Qiang, W. Tourism’s long-and short-term influence on global cities’ economic growth: The case of Hong Kong. PLoS ONE 2022, 17, e0275152. [Google Scholar] [CrossRef] [PubMed]
- Zhang, J. A Study on the Tourism Construction in Beijing from the Perspective of Global City. Tour. Trib./Lvyou Xuekan 2013, 28, 42–49. [Google Scholar]
- Zaidan, E.A. Tourism shopping and new urban entertainment: A case study of Dubai. J. Vacat. Mark. 2016, 22, 29–41. [Google Scholar] [CrossRef]
- Rogerson, C.M.; Rogerson, J.M. Africa’s capital cities: Tourism research in search of capitalness. Afr. J. Hosp. Tour. Leis. 2021, 10, 654–669. [Google Scholar] [CrossRef]
- Zamfir, A.; Corbos, R.A. Towards sustainable tourism development in urban areas: Case study on Bucharest as tourist destination. Sustainability 2015, 7, 12709–12722. [Google Scholar] [CrossRef]
- Jones, C.; Newsome, D. Perth (Australia) as one of the world’s most liveable cities: A perspective on society, sustainability and environment. Int. J. Tour. Cities 2015, 1, 18–35. [Google Scholar] [CrossRef]
- Kourtit, K.; Nijkamp, P.; Östh, J.; Turk, U. Airbnb and COVID-19: SPACE-TIME vulnerability effects in six world-cities. Tour. Manag. 2022, 93, 104569. [Google Scholar] [CrossRef]
- Niemets, K.; Kravchenko, K.; Kandyba, Y.; Kobylin, P.; Morar, C. World cities in terms of the sustainable development concept. Geogr. Sustain. 2021, 2, 304–311. [Google Scholar] [CrossRef]
- Rodríguez, Á.M. Social inequality and residential segregation trends in Spanish global cities. A comparative analysis of Madrid, Barcelona, and Valencia (2001–2021). Cities 2024, 149, 104935. [Google Scholar] [CrossRef]
- Marti, L.; Puertas, R. Relationship between tourism development and the socioeconomic progress of tourist destinations. Compet. Rev. Int. Bus. J. 2025, 35, 175–189. [Google Scholar] [CrossRef]
- Štilić, A.; Puška, A.; Božanić, D.; Đurić, A. Ranking European Countries Using Hybrid MEREC-MARCOS MCDA Based on Travel and Tourism Development Index. Tour. Int. Interdiscip. J. 2024, 72, 592–608. [Google Scholar] [CrossRef]
- Pantović, D.; Kostić, M.; Veljović, S.; Luković, M. Evaluation Model of Environmental Sustainable Competitive Tourism Based on Entropy. Probl. Ekorozwoju 2023, 18, 193–203. [Google Scholar] [CrossRef]
- Thao, H.T.P. Tourism policy in Vietnam: An evaluation using the difference-in-differences model. J. Policy Res. Tour. Leis. Events 2023, 1–24, ahead of print. [Google Scholar] [CrossRef]
- Vašaničová, P.; Bartók, K. Exploring the Nexus between Employment and Economic Contribution: A Study of the Travel and Tourism Industry in the Context of COVID-19. Economies 2024, 12, 136. [Google Scholar] [CrossRef]
- Vašaničová, P.; Jenčová, S.; Kiseľáková, D.; Nebeský, Ľ. Do travel and tourism competitiveness determine international tourism inbound receipts? A quantile regression model for 125 countries. J. Tour. Serv. 2023, 14, 137–152. [Google Scholar] [CrossRef]
- Agostinho, M.N.; Dias, A.; Pereira, L.F. Tourism direct GDP: Configuration of antecedents and tourism future performance in high-income countries’. J. Tour. Futures 2024. ahead of print. [Google Scholar] [CrossRef]
- Purwono, R.; Esquivias, M.A.; Sugiharti, L.; Rojas, O. Tourism Destination Performance and Competitiveness: The Impact on Revenues, Jobs, the Economy, and Growth. J. Tour. Serv. 2024, 15, 161–187. [Google Scholar] [CrossRef]
- Dzurov Vargová, T.; Matušíková, D.; Šaffová, I. Aspects of Tourism Performance in V4 Countries under the Influence of the Covid 19 Pandemic for Future Management and Quality. GeoJournal Tour. Geosites 2024, 52, 231–238. [Google Scholar] [CrossRef]
- Weng, J.; Xiao, J.; Yu, L. Local demand, quality of place, and urban tourism competitiveness. Front. Psychol. 2022, 12, 817805. [Google Scholar] [CrossRef]
- Feng, X.; Derudder, B.; Wang, F.; Shao, R. Geography and location selection of multinational tourism firms: Strategies for globalization. Tour. Rev. 2022, 77, 190–208. [Google Scholar] [CrossRef]
- Faure, A.; Lauermann, J. Are Mega-Events Only for Global Cities? Analyzing Host Cities through the Global and World Cities Framework, 1990–2020. J. Olymp. Stud. 2023, 4, 31–55. [Google Scholar] [CrossRef]
- Chen, J.; Ma, C.; Chen, S. Determinant of the tourism economy in Chinese cities: From an urban centrality perspective. Tour. Econ. 2024, 30, 44–66. [Google Scholar] [CrossRef]
- Safaei, M.; Elhadary, T.; Ziaei, M. Investigating, measuring and comparing the characteristics of recreational and religious tourism in Iran and Turkey (Case Study: “Istanbul and Isfahan” metropolises). Talent Dev. Excell. 2020, 12, 4148–4173. [Google Scholar]
- Tang, H. Regional patterns and hierarchical tendencies: Analysis of the network connectivity of 63 service-oriented tourist cities in China. Sustainability 2020, 12, 6532. [Google Scholar] [CrossRef]
- Insch, A.; Bowden, B. Possibilities and limits of brand repositioning for a second-ranked city: The case of Brisbane, Australia’s “New World City”, 1979–2013. Cities 2016, 56, 47–54. [Google Scholar] [CrossRef]
- Zheng, C.; Liao, S. Evolutionary dynamics of the city brand influence of top ten global cities: Characteristics analysis driven by global news big data and intelligent semantic mining. Cities 2023, 141, 104481. [Google Scholar] [CrossRef]
- da Silva Corrêa, L.; Perl, A. Global cities, hypermobility, and COVID-19. Cities 2022, 122, 103537. [Google Scholar] [CrossRef]
- Senkova, A.; Kolesarova, S.; Kosikova, M. Innovative Activity of SPA Companies in the Slovak and Czech Republic in the Context of the COVID-19 Pandemic. Mark. Manag. Innov. 2024, 15, 80–89. [Google Scholar] [CrossRef]
- Arya, V.; Auruskeviciene, V.; Agarwal, S.; Kokatnur, P.; Kumar, H.; Verma, R. Let us take a walk to the sustainable tourism practices: A qualitative study through the lens of tourism experts. Environ. Sci. Pollut. Res. 2024, 31, 12892–12915. [Google Scholar] [CrossRef]
- Yang, Y.; Wani, G.A.; Nagaraj, V.; Haseeb, M.; Sultan, S.; Hossain, M.E.; Kamal, M.; Shah, S.M.R. Progress in sustainable tourism research: An analysis of the comprehensive literature and future research directions. Sustainability 2023, 15, 2755. [Google Scholar] [CrossRef]
- MacKenzie, N.; Gannon, M.J. Exploring the antecedents of sustainable tourism development. Int. J. Contemp. Hosp. Manag. 2019, 31, 2411–2427. [Google Scholar] [CrossRef]
- Mamula Nikolić, T.; Pantić, S.P.; Paunović, I.; Filipović, S. Sustainable travel decision-making of Europeans: Insights from a household survey. Sustainability 2021, 13, 1960. [Google Scholar] [CrossRef]
- Guo, Y.; Jiang, J.; Li, S. A sustainable tourism policy research review. Sustainability 2019, 11, 3187. [Google Scholar] [CrossRef]
- Baloch, Q.B.; Shah, S.N.; Iqbal, N.; Sheeraz, M.; Asadullah, M.; Mahar, S.; Khan, A.U. Impact of tourism development upon environmental sustainability: A suggested framework for sustainable ecotourism. Environ. Sci. Pollut. Res. 2023, 30, 5917–5930. [Google Scholar] [CrossRef]
- Su, L.; Huang, S.; Huang, J. Effects of destination social responsibility and tourism impacts on residents’ support for tourism and perceived quality of life. J. Hosp. Tour. Res. 2018, 42, 1039–1057. [Google Scholar] [CrossRef]
- Bodolica, V.; Spraggon, M.; Saleh, N. Innovative leadership in leisure and entertainment industry: The case of the UAE as a global tourism hub. Int. J. Islam. Middle East. Financ. Manag. 2020, 13, 323–337. [Google Scholar] [CrossRef]
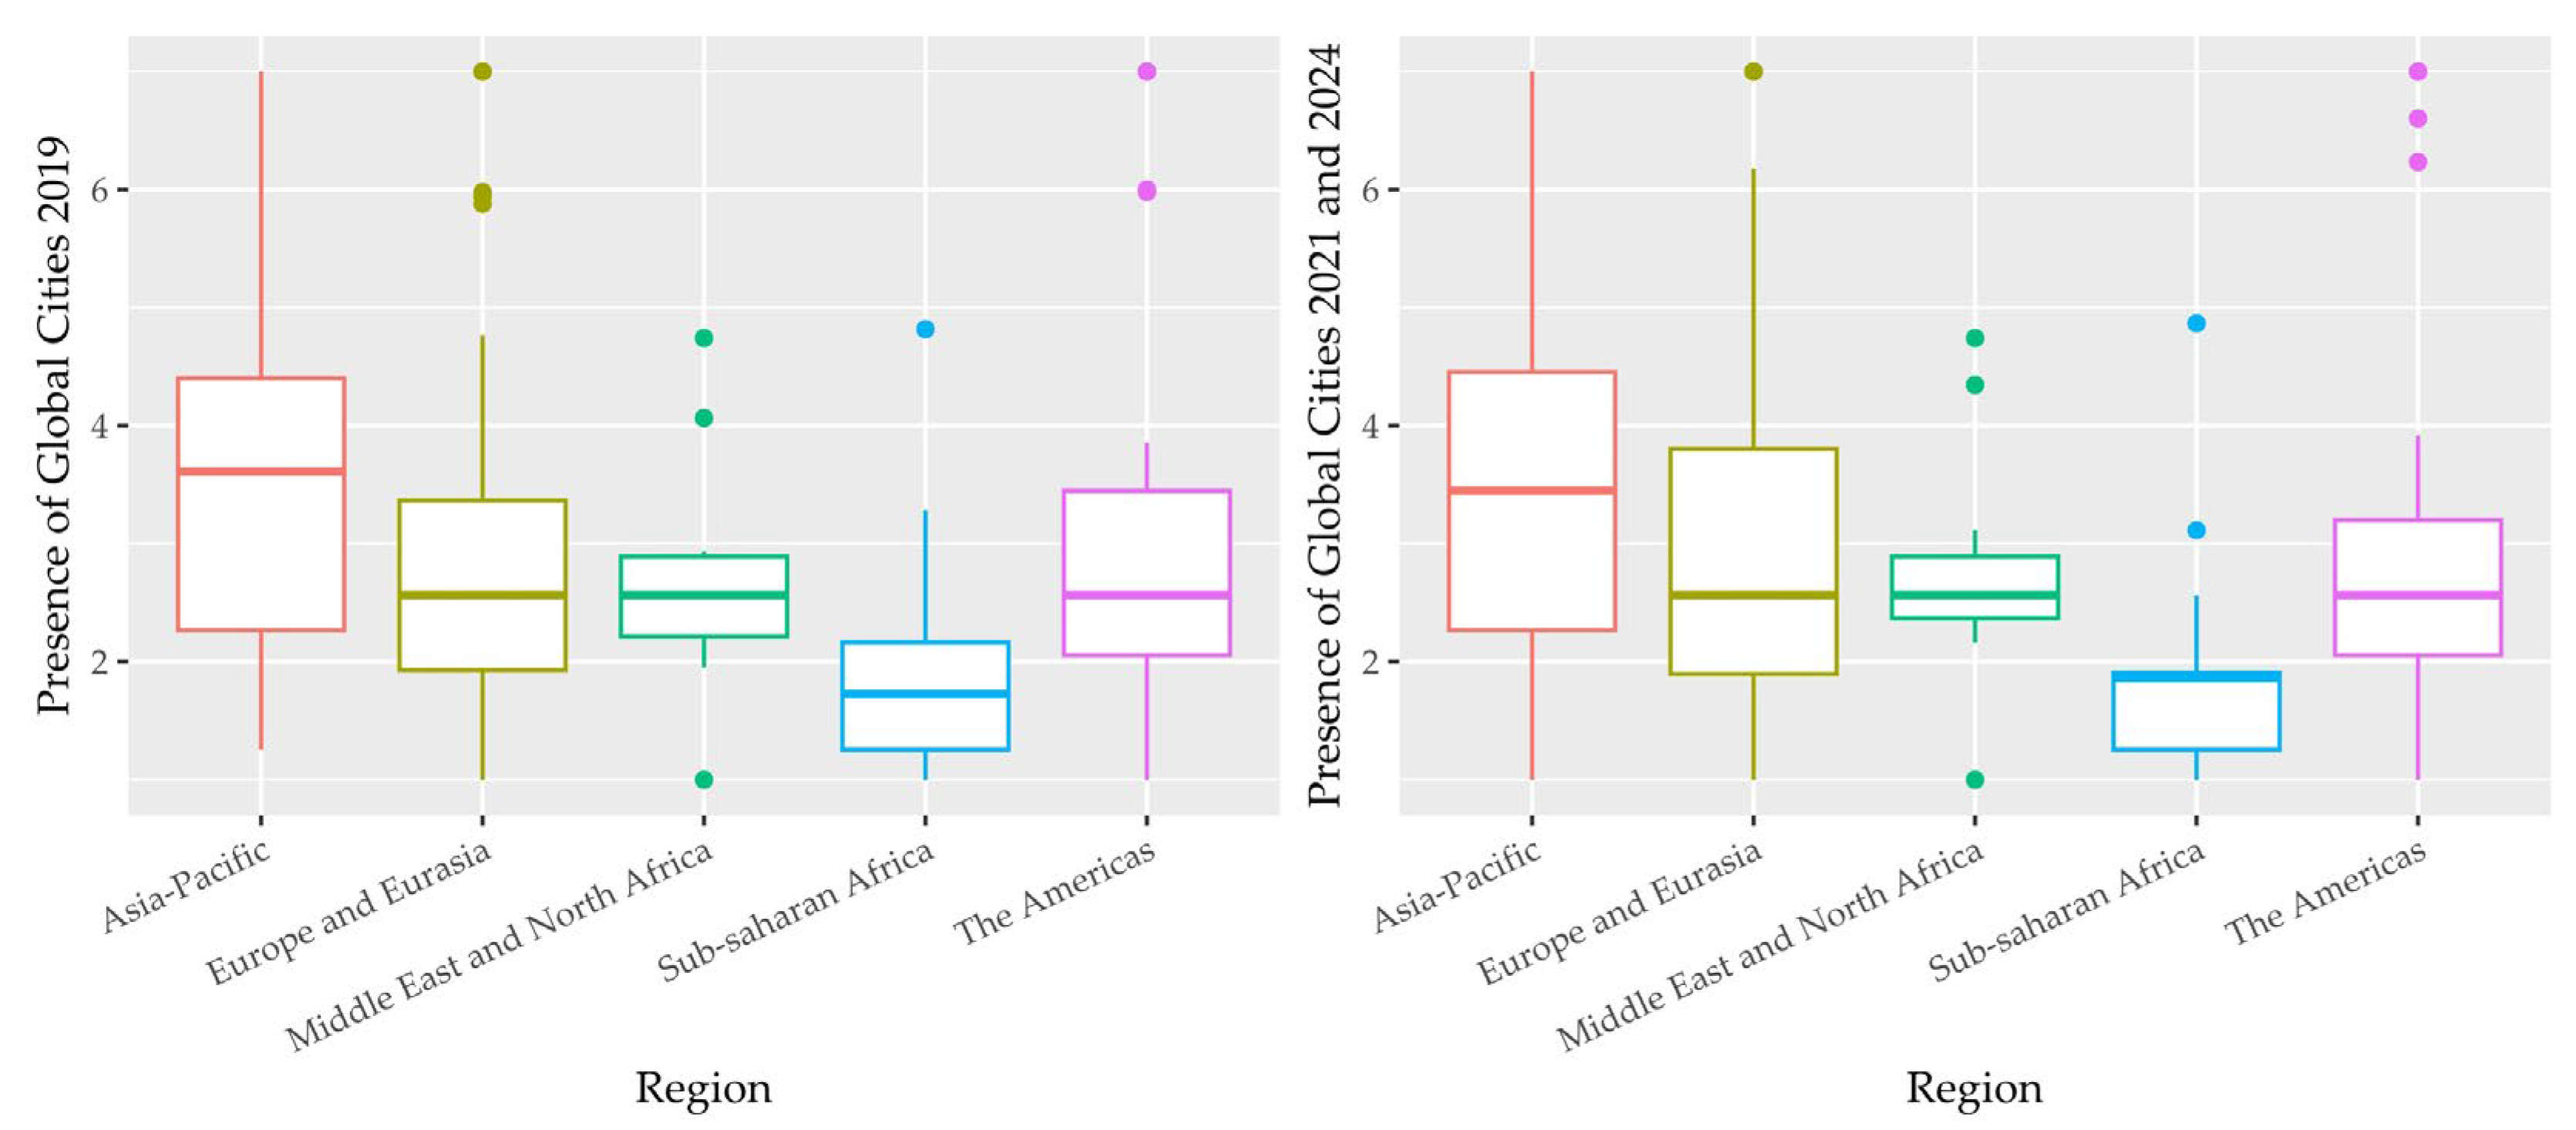


| Asia–Pacific (19) | Europe and Eurasia (44) | Middle East and North Africa (14) | Sub-Saharan Africa (19) | The Americas (23) | |||||||||||
|---|---|---|---|---|---|---|---|---|---|---|---|---|---|---|---|
| 2019 | 2021 | 2024 | 2019 | 2021 | 2024 | 2019 | 2021 | 2024 | 2019 | 2021 | 2024 | 2019 | 2021 | 2024 | |
| Mean | 3.66 | 3.67 | 3.67 | 2.91 | 2.95 | 2.95 | 2.65 | 2.74 | 2.74 | 1.95 | 1.87 | 1.87 | 3.10 | 3.13 | 3.13 |
| S.D. | 1.85 | 1.87 | 1.87 | 1.60 | 1.62 | 1.62 | 0.90 | 0.91 | 0.91 | 0.91 | 0.91 | 0.91 | 1.76 | 1.80 | 1.80 |
| Min | 1.25 | 1.00 | 1.00 | 1.00 | 1.00 | 1.00 | 1.00 | 1.00 | 1.00 | 1.00 | 1.00 | 1.00 | 1.00 | 1.00 | 1.00 |
| Q1 | 2.27 | 2.27 | 2.27 | 1.93 | 1.89 | 1.89 | 2.21 | 2.37 | 2.37 | 1.25 | 1.25 | 1.25 | 2.06 | 2.06 | 2.06 |
| Median | 3.61 | 3.45 | 3.45 | 2.56 | 2.56 | 2.56 | 2.56 | 2.56 | 2.56 | 1.73 | 1.86 | 1.86 | 2.56 | 2.56 | 2.56 |
| Q3 | 4.40 | 4.45 | 4.45 | 3.37 | 3.80 | 3.80 | 2.89 | 2.89 | 2.89 | 2.16 | 1.91 | 1.91 | 3.45 | 3.20 | 3.20 |
| Max | 7.00 | 7.00 | 7.00 | 7.00 | 7.00 | 7.00 | 4.74 | 4.74 | 4.74 | 4.82 | 4.87 | 4.87 | 7.00 | 7.00 | 7.00 |
| High (46) | Low (4) | Lower-Middle (34) | Upper-Middle (35) | |||||||||
|---|---|---|---|---|---|---|---|---|---|---|---|---|
| 2019 | 2021 | 2024 | 2019 | 2021 | 2024 | 2019 | 2021 | 2024 | 2019 | 2021 | 2024 | |
| Mean | 3.56 | 3.63 | 3.63 | 1.13 | 1.13 | 1.13 | 2.23 | 2.25 | 2.25 | 2.84 | 2.79 | 2.79 |
| S.D. | 1.70 | 1.74 | 1.74 | 0.15 | 0.15 | 0.15 | 1.14 | 1.13 | 1.13 | 1.47 | 1.51 | 1.51 |
| Min | 1.00 | 1.00 | 1.00 | 1.00 | 1.00 | 1.00 | 1.00 | 1.00 | 1.00 | 1.25 | 1.25 | 1.25 |
| Q1 | 2.56 | 2.42 | 2.42 | 1.00 | 1.00 | 1.00 | 1.73 | 1.73 | 1.73 | 1.91 | 1.86 | 1.86 |
| Median | 2.94 | 3.08 | 3.08 | 1.13 | 1.13 | 1.13 | 2.06 | 2.06 | 2.06 | 2.37 | 2.37 | 2.37 |
| Q3 | 4.64 | 4.67 | 4.67 | 1.25 | 1.25 | 1.25 | 2.51 | 2.51 | 2.51 | 3.45 | 3.20 | 3.20 |
| Max | 7.00 | 7.00 | 7.00 | 1.25 | 1.25 | 1.25 | 7.00 | 7.00 | 7.00 | 7.00 | 7.00 | 7.00 |
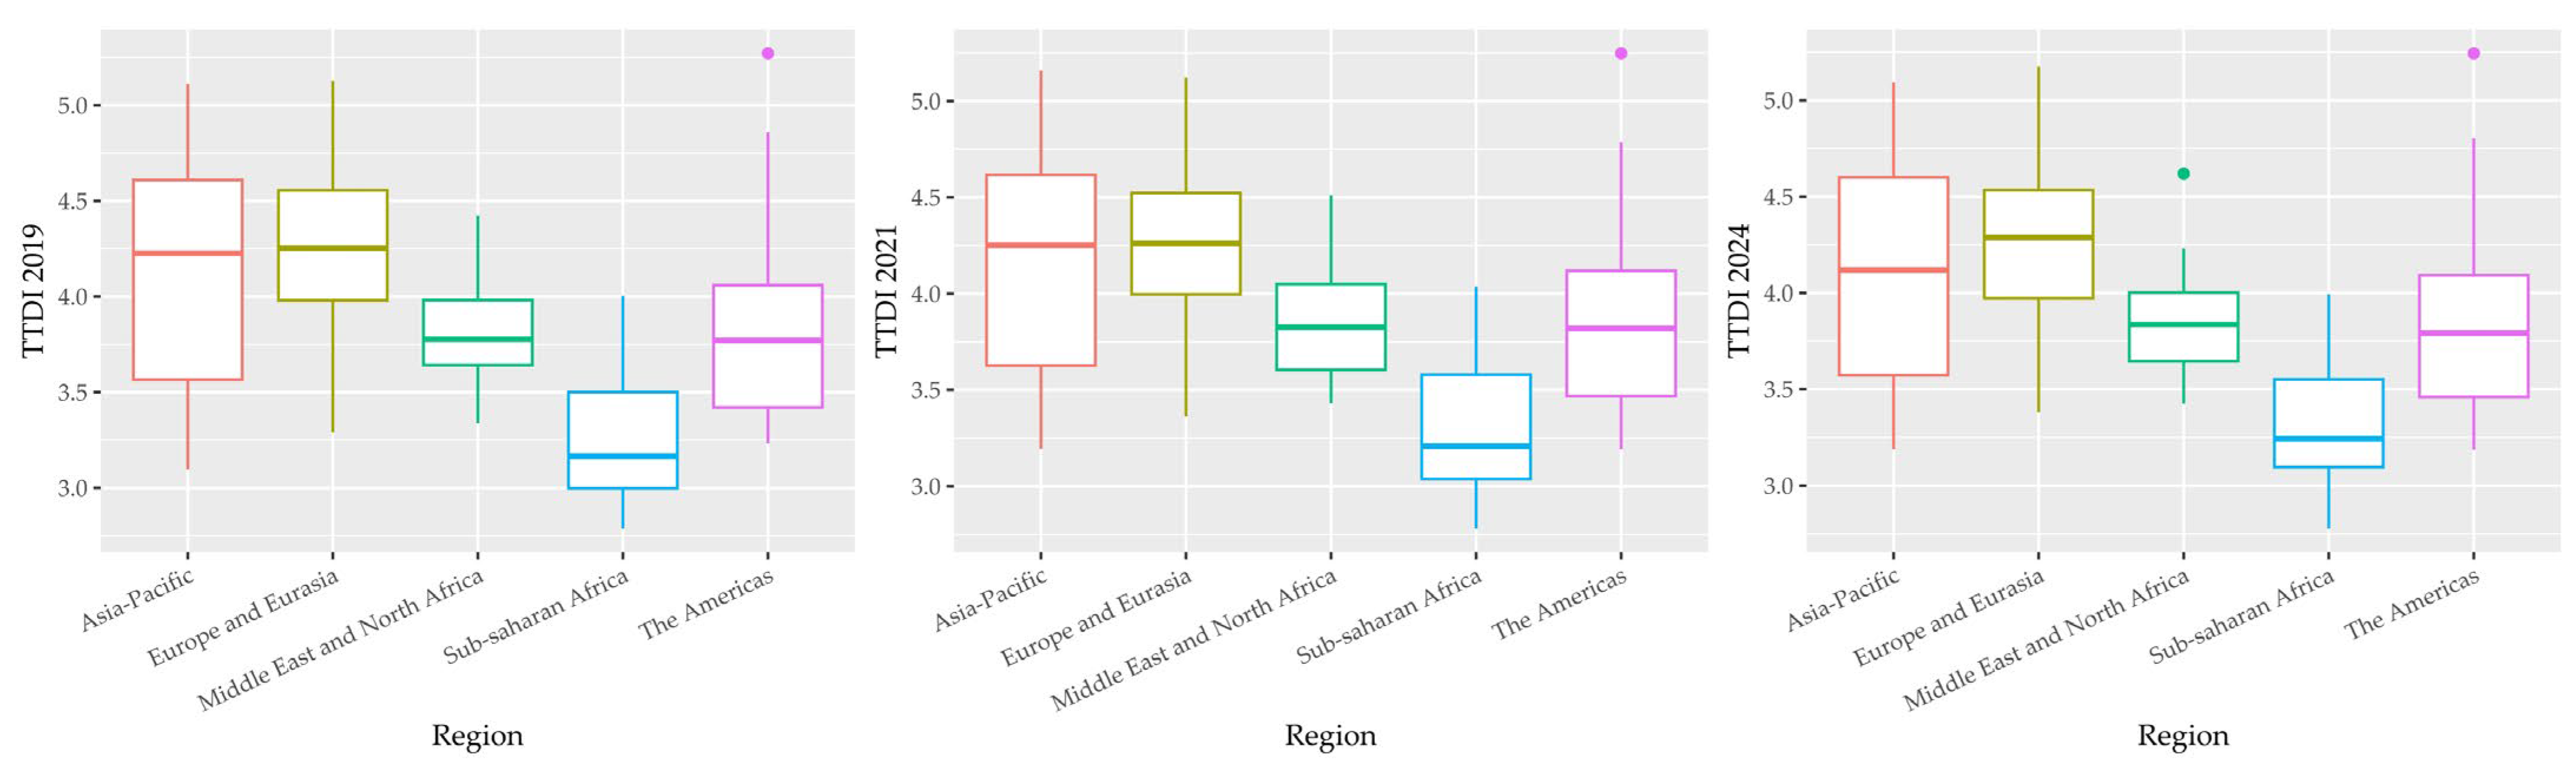
| Asia–Pacific (19) | Europe and Eurasia (44) | Middle East and North Africa (14) | Sub-Saharan Africa (19) | The Americas (23) | |||||||||||
|---|---|---|---|---|---|---|---|---|---|---|---|---|---|---|---|
| 2019 | 2021 | 2024 | 2019 | 2021 | 2024 | 2019 | 2021 | 2024 | 2019 | 2021 | 2024 | 2019 | 2021 | 2024 | |
| Mean | 4.09 | 4.14 | 4.11 | 4.25 | 4.25 | 4.26 | 3.83 | 3.85 | 3.86 | 3.26 | 3.31 | 3.33 | 3.84 | 3.86 | 3.86 |
| S.D. | 0.64 | 0.62 | 0.61 | 0.48 | 0.45 | 0.45 | 0.29 | 0.31 | 0.32 | 0.35 | 0.36 | 0.34 | 0.51 | 0.51 | 0.51 |
| Min | 3.10 | 3.20 | 3.19 | 3.29 | 3.36 | 3.38 | 3.34 | 3.43 | 3.42 | 2.79 | 2.78 | 2.78 | 3.23 | 3.19 | 3.19 |
| Q1 | 3.57 | 3.63 | 3.57 | 3.98 | 4.00 | 3.97 | 3.64 | 3.60 | 3.64 | 3.00 | 3.04 | 3.10 | 3.42 | 3.47 | 3.46 |
| Median | 4.23 | 4.25 | 4.12 | 4.25 | 4.26 | 4.29 | 3.78 | 3.83 | 3.84 | 3.16 | 3.21 | 3.24 | 3.77 | 3.82 | 3.79 |
| Q3 | 4.61 | 4.62 | 4.60 | 4.56 | 4.52 | 4.53 | 3.98 | 4.05 | 4.00 | 3.50 | 3.58 | 3.55 | 4.06 | 4.12 | 4.09 |
| Max | 5.11 | 5.16 | 5.09 | 5.13 | 5.12 | 5.18 | 4.42 | 4.51 | 4.62 | 4.00 | 4.04 | 3.99 | 5.27 | 5.25 | 5.24 |
| High (46) | Low (4) | Lower-Middle (34) | Upper-Middle (35) | |||||||||
|---|---|---|---|---|---|---|---|---|---|---|---|---|
| 2019 | 2021 | 2024 | 2019 | 2021 | 2024 | 2019 | 2021 | 2024 | 2019 | 2021 | 2024 | |
| Mean | 4.44 | 4.43 | 4.43 | 2.99 | 3.03 | 3.05 | 3.41 | 3.46 | 3.47 | 3.90 | 3.93 | 3.94 |
| S.D. | 0.43 | 0.41 | 0.43 | 0.27 | 0.28 | 0.30 | 0.31 | 0.30 | 0.29 | 0.34 | 0.35 | 0.35 |
| Min | 3.54 | 3.47 | 3.44 | 2.79 | 2.78 | 2.78 | 2.90 | 2.97 | 2.99 | 3.30 | 3.37 | 3.42 |
| Q1 | 4.17 | 4.16 | 4.18 | 2.81 | 2.86 | 2.86 | 3.23 | 3.21 | 3.24 | 3.63 | 3.65 | 3.66 |
| Median | 4.43 | 4.40 | 4.41 | 2.90 | 2.95 | 2.98 | 3.38 | 3.42 | 3.42 | 3.92 | 3.94 | 3.96 |
| Q3 | 4.76 | 4.77 | 4.75 | 3.08 | 3.12 | 3.16 | 3.66 | 3.69 | 3.67 | 4.14 | 4.17 | 4.13 |
| Max | 5.27 | 5.25 | 5.24 | 3.37 | 3.42 | 3.45 | 4.34 | 4.25 | 4.25 | 4.89 | 4.96 | 4.94 |
| Year | Coefficient | Std. Error | t-Ratio | p-Value | R2 | BP (Test Statistics) | BP (p-Value) | |
|---|---|---|---|---|---|---|---|---|
| 2019 | Constant | 3.1690 | 0.0780 | 40.6100 | 0.0000 | 0.5177 | 0.1394 | 0.7089 |
| PGC | 0.2661 | 0.0237 | 11.2100 | 0.0000 | ||||
| 2021 | Constant | 3.2318 | 0.0741 | 43.6100 | 0.0000 | 0.5189 | 0.0294 | 0.8639 |
| PGC | 0.2510 | 0.0223 | 11.2300 | 0.0000 | ||||
| 2024 | Constant | 3.2184 | 0.0721 | 44.6700 | 0.0000 | 0.5449 | 0.0379 | 0.8456 |
| PGC | 0.2572 | 0.0217 | 11.8400 | 0.0000 |
| Year | Coefficient | Std. Error | t-Ratio | p-Value | R2 | BP (Test Statistics) | BP (p-Value) | |
|---|---|---|---|---|---|---|---|---|
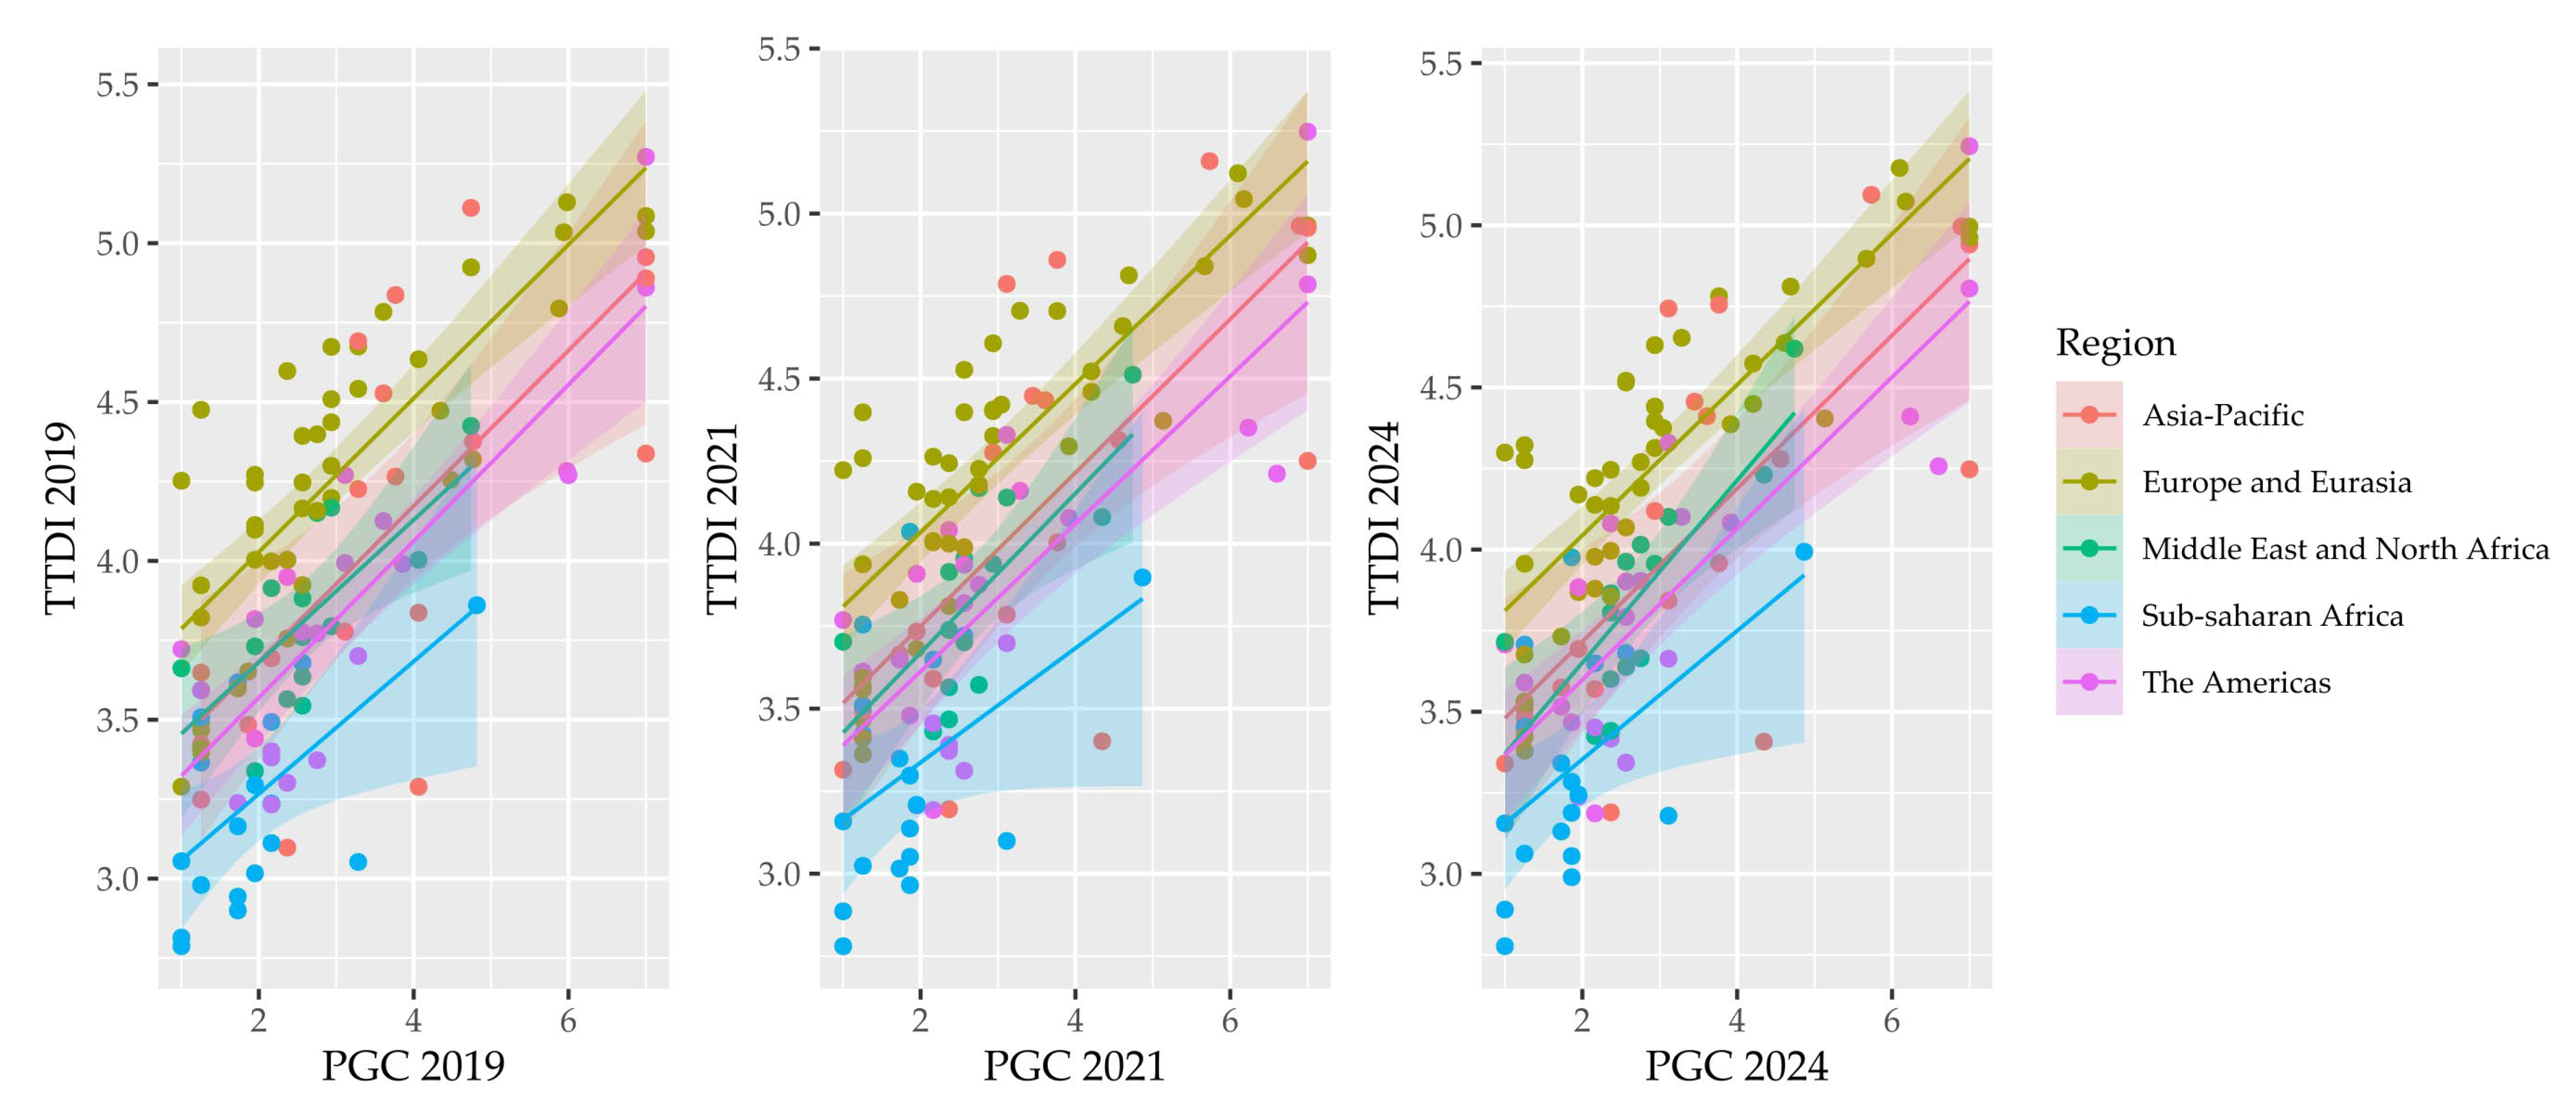
| Asia–Pacific | ||||||||
| 2019 | Constant | 3.1931 | 0.2437 | 13.1000 | 0.0000 | 0.4971 | 0.2317 | 0.6302 |
| PGC | 0.2449 | 0.0597 | 4.0990 | 0.0007 | ||||
| 2021 | Constant | 3.2844 | 0.2351 | 13.9700 | 0.0000 | 0.4916 | 0.5084 | 0.4758 |
| PGC | 0.2327 | 0.0574 | 4.0540 | 0.0008 | ||||
| 2024 | Constant | 3.2439 | 0.2233 | 14.5200 | 0.0000 | 0.5247 | 0.6312 | 0.4269 |
| PGC | 0.2361 | 0.0545 | 4.3320 | 0.0005 | ||||
| Europe and Eurasia | ||||||||
| 2019 | Constant | 3.5445 | 0.0912 | 38.8800 | 0.0000 | 0.6479 | 3.3000 | 0.0693 |
| PGC | 0.2418 | 0.0275 | 8.7910 | 0.0000 | ||||
| 2021 | Constant | 3.5846 | 0.0818 | 43.8100 | 0.0000 | 0.6698 | 3.6659 | 0.0555 |
| PGC | 0.2248 | 0.0244 | 9.2300 | 0.0000 | ||||
| 2024 | Constant | 3.5790 | 0.0801 | 44.6600 | 0.0000 * | 0.6931 | 4.0230 | 0.0449 |
| PGC | 0.2324 | 0.0239 | 9.7380 | 0.0000 * | ||||
| Middle East and North Africa | ||||||||
| 2019 | Constant | 3.2320 | 0.1840 | 17.5600 | 0.0000 | 0.4908 | 0.2579 | 0.6115 |
| PGC | 0.2243 | 0.0659 | 3.4010 | 0.0053 | ||||
| 2021 | Constant | 3.1864 | 0.1981 | 16.0800 | 0.0000 | 0.5066 | 0.3333 | 0.5637 |
| PGC | 0.2415 | 0.0688 | 3.5100 | 0.0043 | ||||
| 2024 | Constant | 3.0892 | 0.1814 | 17.0300 | 0.0000 | 0.6240 | 1.6232 | 0.2026 |
| PGC | 0.2811 | 0.0630 | 4.4630 | 0.0008 | ||||
| Sub-Saharan Africa | ||||||||
| 2019 | Constant | 2.8502 | 0.1696 | 16.8100 | 0.0000 | 0.2901 | 0.1705 | 0.6797 |
| PGC | 0.2083 | 0.0790 | 2.6360 | 0.0173 | ||||
| 2021 | Constant | 2.9909 | 0.1779 | 16.8100 | 0.0000 | 0.1919 | 0.0968 | 0.7558 |
| PGC | 0.1731 | 0.0861 | 2.0090 | 0.0607 | ||||
| 2024 | Constant | 2.9570 | 0.1616 | 18.3000 | 0.0000 | 0.2740 | 0.1392 | 0.7091 |
| PGC | 0.1982 | 0.0782 | 2.5330 | 0.0214 | ||||
| The Americas | ||||||||
| 2019 | Constant | 3.0772 | 0.1202 | 25.6000 | 0.0000 | 0.7156 | 0.0712 | 0.7895 |
| PGC | 0.2463 | 0.0339 | 7.2690 | 0.0000 | ||||
| 2021 | Constant | 3.1652 | 0.1328 | 23.8400 | 0.0000 | 0.6351 | 0.2634 | 0.6078 |
| PGC | 0.2237 | 0.0370 | 6.0460 | 0.0000 | ||||
| 2024 | Constant | 3.1320 | 0.1253 | 25.0000 | 0.0000 | 0.6800 | 0.2527 | 0.6152 |
| PGC | 0.2333 | 0.0349 | 6.6810 | 0.0000 | ||||
| Year | Coefficient | Std. Error | t-Ratio | p-Value | R2 | BP (Test Statistics) | BP (p-Value) | |
|---|---|---|---|---|---|---|---|---|
| High | ||||||||
| 2019 | Constant | 3.7476 | 0.0956 | 39.2200 | 0.0000 | 0.5924 | 1.5370 | 0.2151 |
| PGC | 0.1943 | 0.0243 | 7.9970 | 0.0000 | ||||
| 2021 | Constant | 3.7650 | 0.0907 | 41.4900 | 0.0000 | 0.6006 | 1.4869 | 0.2227 |
| PGC | 0.1840 | 0.0226 | 8.1340 | 0.0000 | ||||
| 2024 | Constant | 3.7159 | 0.0924 | 40.2000 | 0.0000 | 0.6244 | 3.7563 | 0.0526 |
| PGC | 0.1971 | 0.0230 | 8.5530 | 0.0000 | ||||
| Upper-Middle | ||||||||
| 2019 | Constant | 3.4039 | 0.0859 | 39.6400 | 0.0000 | 0.5582 | 0.0034 | 0.9532 |
| PGC | 0.1738 | 0.0269 | 6.4570 | 0.0000 | ||||
| 2021 | Constant | 3.4807 | 0.0915 | 38.0500 | 0.0000 | 0.4851 | 0.8232 | 0.3642 |
| PGC | 0.1614 | 0.0290 | 5.5760 | 0.0000 | ||||
| 2024 | Constant | 3.4617 | 0.0859 | 40.2900 | 0.0000 | 0.5426 | 0.4088 | 0.5226 |
| PGC | 0.1701 | 0.0272 | 6.2560 | 0.0000 | ||||
| Lower-Middle | ||||||||
| 2019 | Constant | 3.0831 | 0.1005 | 30.6800 | 0.0000 | 0.2940 | 0.1777 | 0.6734 |
| PGC | 0.1467 | 0.0402 | 3.6500 | 0.0009 | ||||
| 2021 | Constant | 3.1452 | 0.1012 | 31.0800 | 0.0000 | 0.2753 | 0.1236 | 0.7252 |
| PGC | 0.1408 | 0.0404 | 3.4870 | 0.0014 | ||||
| 2024 | Constant | 3.1628 | 0.0962 | 32.8700 | 0.0000 | 0.2863 | 0.0859 | 0.7694 |
| PGC | 0.1376 | 0.0384 | 3.5830 | 0.0011 | ||||
| Low | ||||||||
| 2019 | Constant | 1.3392 | 0.8615 | 1.5540 | 0.2603 | 0.6494 | 1.9609 | 0.1614 |
| PGC | 1.4618 | 0.7595 | 1.9250 | 0.1942 | ||||
| 2021 | Constant | 1.2996 | 0.9198 | 1.4130 | 0.2932 | 0.6414 | 1.5093 | 0.2193 |
| PGC | 1.5336 | 0.8109 | 1.8910 | 0.1991 | ||||
| 2024 | Constant | 1.1622 | 0.9098 | 1.2770 | 0.3297 | 0.6846 | 1.4358 | 0.2308 |
| PGC | 1.6713 | 0.8021 | 2.0840 | 0.1726 | ||||
| 2019 | 2021 | 2024 | |
|---|---|---|---|
| All countries | 0.7195 | 0.7203 | 0.7382 |
| Region | |||
| Asia–Pacific | 0.7051 | 0.7011 | 0.7243 |
| Europe and Eurasia | 0.8049 | 0.8184 | 0.8325 |
| Middle East and North Africa | 0.7006 | 0.7118 | 0.7899 |
| Sub-Saharan Africa | 0.5386 | 0.4381 | 0.5235 |
| The Americas | 0.8459 | 0.7969 | 0.8246 |
| Income group | |||
| High | 0.7697 | 0.7750 | 0.7902 |
| Upper-Middle | 0.7471 | 0.6965 | 0.7366 |
| Lower-Middle | 0.5422 | 0.5247 | 0.5351 |
| Low | 0.8058 | 0.8009 | 0.8274 |
Disclaimer/Publisher’s Note: The statements, opinions and data contained in all publications are solely those of the individual author(s) and contributor(s) and not of MDPI and/or the editor(s). MDPI and/or the editor(s) disclaim responsibility for any injury to people or property resulting from any ideas, methods, instructions or products referred to in the content. |
© 2025 by the author. Licensee MDPI, Basel, Switzerland. This article is an open access article distributed under the terms and conditions of the Creative Commons Attribution (CC BY) license (https://creativecommons.org/licenses/by/4.0/).
Share and Cite
Vašaničová, P. Urban Networks and Tourism Development: Analyzing the Relationship Between Globalization and World Cities (GaWC) Rankings and Travel and Tourism Development Index (TTDI). Urban Sci. 2025, 9, 83. https://doi.org/10.3390/urbansci9030083
Vašaničová P. Urban Networks and Tourism Development: Analyzing the Relationship Between Globalization and World Cities (GaWC) Rankings and Travel and Tourism Development Index (TTDI). Urban Science. 2025; 9(3):83. https://doi.org/10.3390/urbansci9030083
Chicago/Turabian StyleVašaničová, Petra. 2025. "Urban Networks and Tourism Development: Analyzing the Relationship Between Globalization and World Cities (GaWC) Rankings and Travel and Tourism Development Index (TTDI)" Urban Science 9, no. 3: 83. https://doi.org/10.3390/urbansci9030083
APA StyleVašaničová, P. (2025). Urban Networks and Tourism Development: Analyzing the Relationship Between Globalization and World Cities (GaWC) Rankings and Travel and Tourism Development Index (TTDI). Urban Science, 9(3), 83. https://doi.org/10.3390/urbansci9030083