Article

Development Projects’ Assessment in the Danube–Tisza Interfluve—A Climate Change Perspective

by
György Orosz
,
Botond Kőhalmi
,
Csaba Centeri
*,
Viktor Péter Grónás
* and
Eszter Tormáné Kovács
Institute for Wildlife Management and Nature Conservation, Hungarian University of Agriculture and Life Sciences, Páter K. u. 1., 2100 Gödöllő, Hungary
*
Authors to whom correspondence should be addressed.
Urban Sci. 2025, 9(4), 92; https://doi.org/10.3390/urbansci9040092
Submission received: 18 December 2024 / Revised: 12 March 2025 / Accepted: 17 March 2025 / Published: 24 March 2025
(This article belongs to the Special Issue Assessing Urban Ecological Environment Protection)

Abstract

:
The area of the Danube–Tisza Interfluve is of particular concern in terms of climate change, not only today, but it has also been in the past. In our research, we investigated the development projects of the Danube–Tisza Interfluve implemented in the last two financial cycles (2007–2013 and 2014–2020) of the European Union, regarding their climate-related impacts. Data about the development projects were retrieved from the official national project database. Development areas with positive and negative impacts regarding climate change were identified, and projects were assigned to these categories or a neutral category based on the content analysis of project titles and descriptions as well as the eligible activities included in the calls for proposals. Positive projects were also scored based on the approach they contribute to tackling climate change (mitigation: 3 points, adaptation: 2 points and indirect impact: 1 point). The number of these projects and the financial support they received were calculated for every development area category and also weighted by the impact scores. Our results show that from the 39,232 development projects completed over two EU financial cycles (2007–2020), only 11% were considered positive, less than 3% were considered negative and the rest were neutral regarding their climate-change-related impacts. Projects with negative impacts received more funding than projects with positive funding. Nevertheless, a positive trend can be seen, while more projects with positive impacts were implemented in the second cycle (2014–2020), receiving larger financial support. Our analysis also shows that development projects based on nature restoration and coupled with awareness raising can have the best impact score while they serve both mitigation and adaptation purposes and also have indirect impacts by fostering attitude change. We can conclude that much more emphasis should be laid on supporting projects for climate change mitigation and adaptations to reach our goal of climate neutrality.

1. Introduction

Climate change is a permanent and significant change in climate at the local or global level, regardless of the causes [1]. It changes the average temperature, precipitation, wind patterns, or climate variability. Several Intergovernmental Panel on Climate Change (IPPC) reports [2,3] emphasise that human activity is partly responsible for global warming, and global surface temperatures rose by 1.1 °C above the average temperature of 1850–1900 between 2011–2020. Such rapid and large-scale climate change has a wide range of impacts on man-made and natural systems [4]. The aim is to keep global warming below 1.5 degrees Celsius compared to pre-industrial levels [5]. Notably, 1.5 compared to 2 degrees Celsius will result in lower risks in many areas (e.g., biodiversity, health, food and water security and economic growth) and require less adaptation [6,7,8,9,10].
Global climatic processes also have an impact on Hungary. In the 21st century, Hungary is expected to experience an increase in average temperatures of up to 1 °C in almost all seasons between 2021 and 2050 and up to 4 °C in summer months by the end of the century. No major changes in annual precipitation are expected, but the seasonal distribution is likely to change [11]. The climate, fertile soils and available water resources currently provide favourable conditions for agriculture. As a consequence, 56% of Hungary is under arable cultivation. However, drought is already one of the most significant environmental threats, occurring on average every 3–5 years.
To combat climate change, mitigation and adaptation are named as the two main approaches in the related scientific literature and policy documents [12]. Mitigation seeks to lower the concentration of greenhouse gases in the atmosphere by either reducing their emission or increasing absorption [13]. It has been the preferred option because it offers a long-term solution to the problem. But looking at the trends, it seems that climate change is difficult to reverse [14,15]. Therefore, an adaptation that focuses on reducing the negative impacts of climate change or increasing adaptive capacities has been recently gaining momentum [13,15,16]. The two approaches complement each other and can be combined [15]. Mitigation can include energy efficiency programs and the use of renewable energy as well as afforestation or reducing the greenhouse gas emission of agriculture (e.g., through the sustainable use of agricultural inputs) [17,18,19]. Adaptation can include the use of climate-resilient species in agriculture or forestry, improved water management in agriculture, shelter against heat waves and technical or natural solutions in case of extreme flood events [17,18,19].
Mitigating or adapting to the effects of climate change is necessary in different sectors (e.g., agriculture, forestry, energy and transportation) and settlements as well. The EU Green Deal [20] adopted by the EU Commission in 2019 sets targets at the policy level but also encourages initiatives at the local level through the Green Deal Going Local Programme.
European Union funds have been allocated to Member States that have the potential to implement climate change measures in each of the 7-year planning and budget cycles. In Hungary, the European Regional Development Fund, the European Social Fund, the Cohesion Fund and the European Agricultural Fund for Rural Development have provided the most significant resources.
Many studies examine the impacts of climate change at a country or continent-scale with extensive projections of negative impacts [21,22,23]. Some other studies look at responses to climate change through the EU’s territorial development programmes at EU-wide or Member State level. These publications make proposals for plans along the lines of the policies and the objectives and priorities that will be implemented [24,25,26]. There are also papers dealing with the impacts of climate change on cities, analysing them along social, economic and environmental dimensions and subordinating them to resilience [27,28,29].
Buzási et al. [30] assessed some selected development actions planned in the pilot site located in Budapest (the capital of Hungary) from a climate change perspective. They developed a scoring system that showed if the intervention contributed in a positive, negative or neutral way to the objectives of the Budapest Climate Change Strategy. They emphasised the importance of a climate-change-related impact assessment of planned interventions.
Štreimikienė [31] examined how the financial support from the EU Structural Funds in the EU 2007–2013 and 2014–2020 financial periods contributed to reaching the energy efficiency and renewable energy targets in the Baltic states. Although the analysis did not explicitly address climate change, the topic is directly connected to mitigation. She found that the Structural Funds had a positive impact on sustainable energy development in the examined states.
Lung et al. [32] compared EU biodiversity funding (from LIFE financial instrument 1992–2013 and Structural and Cohesion Funds 2007–2013) to biodiversity funding needs at the level of EU NUTS-2 regions for the whole territory of the EU in the light of climate change. They found some regional differences in matching demand and supply, but, overall, the current conservation efforts concentrating on the EU’s Natura 2000 protected area network seemed to be in line with the funding opportunities. However, they highlighted that the future needs under climate change require modification in the funding policy and go beyond the Natura 2000 network.
The analyses of the literature show that none of the mentioned papers analysed EU-cofinanced development projects covering multiple development areas at a regional scale over an EU-specific period (7-year financial cycles) regarding their climate-change-related impacts.
Our research aimed to assess the development projects carried out in the settlements of the Danube–Tisza Interfluve of Hungary over the past two EU budget cycles (2007–2013 and 2014–2020) using EU funds from a climate change perspective. Our main research question was “How and with what intensity did development projects in the research area between 2007 and 2020 combatted climate change (mitigation, adaptation and indirect positive impact)?”

2. Materials and Methods
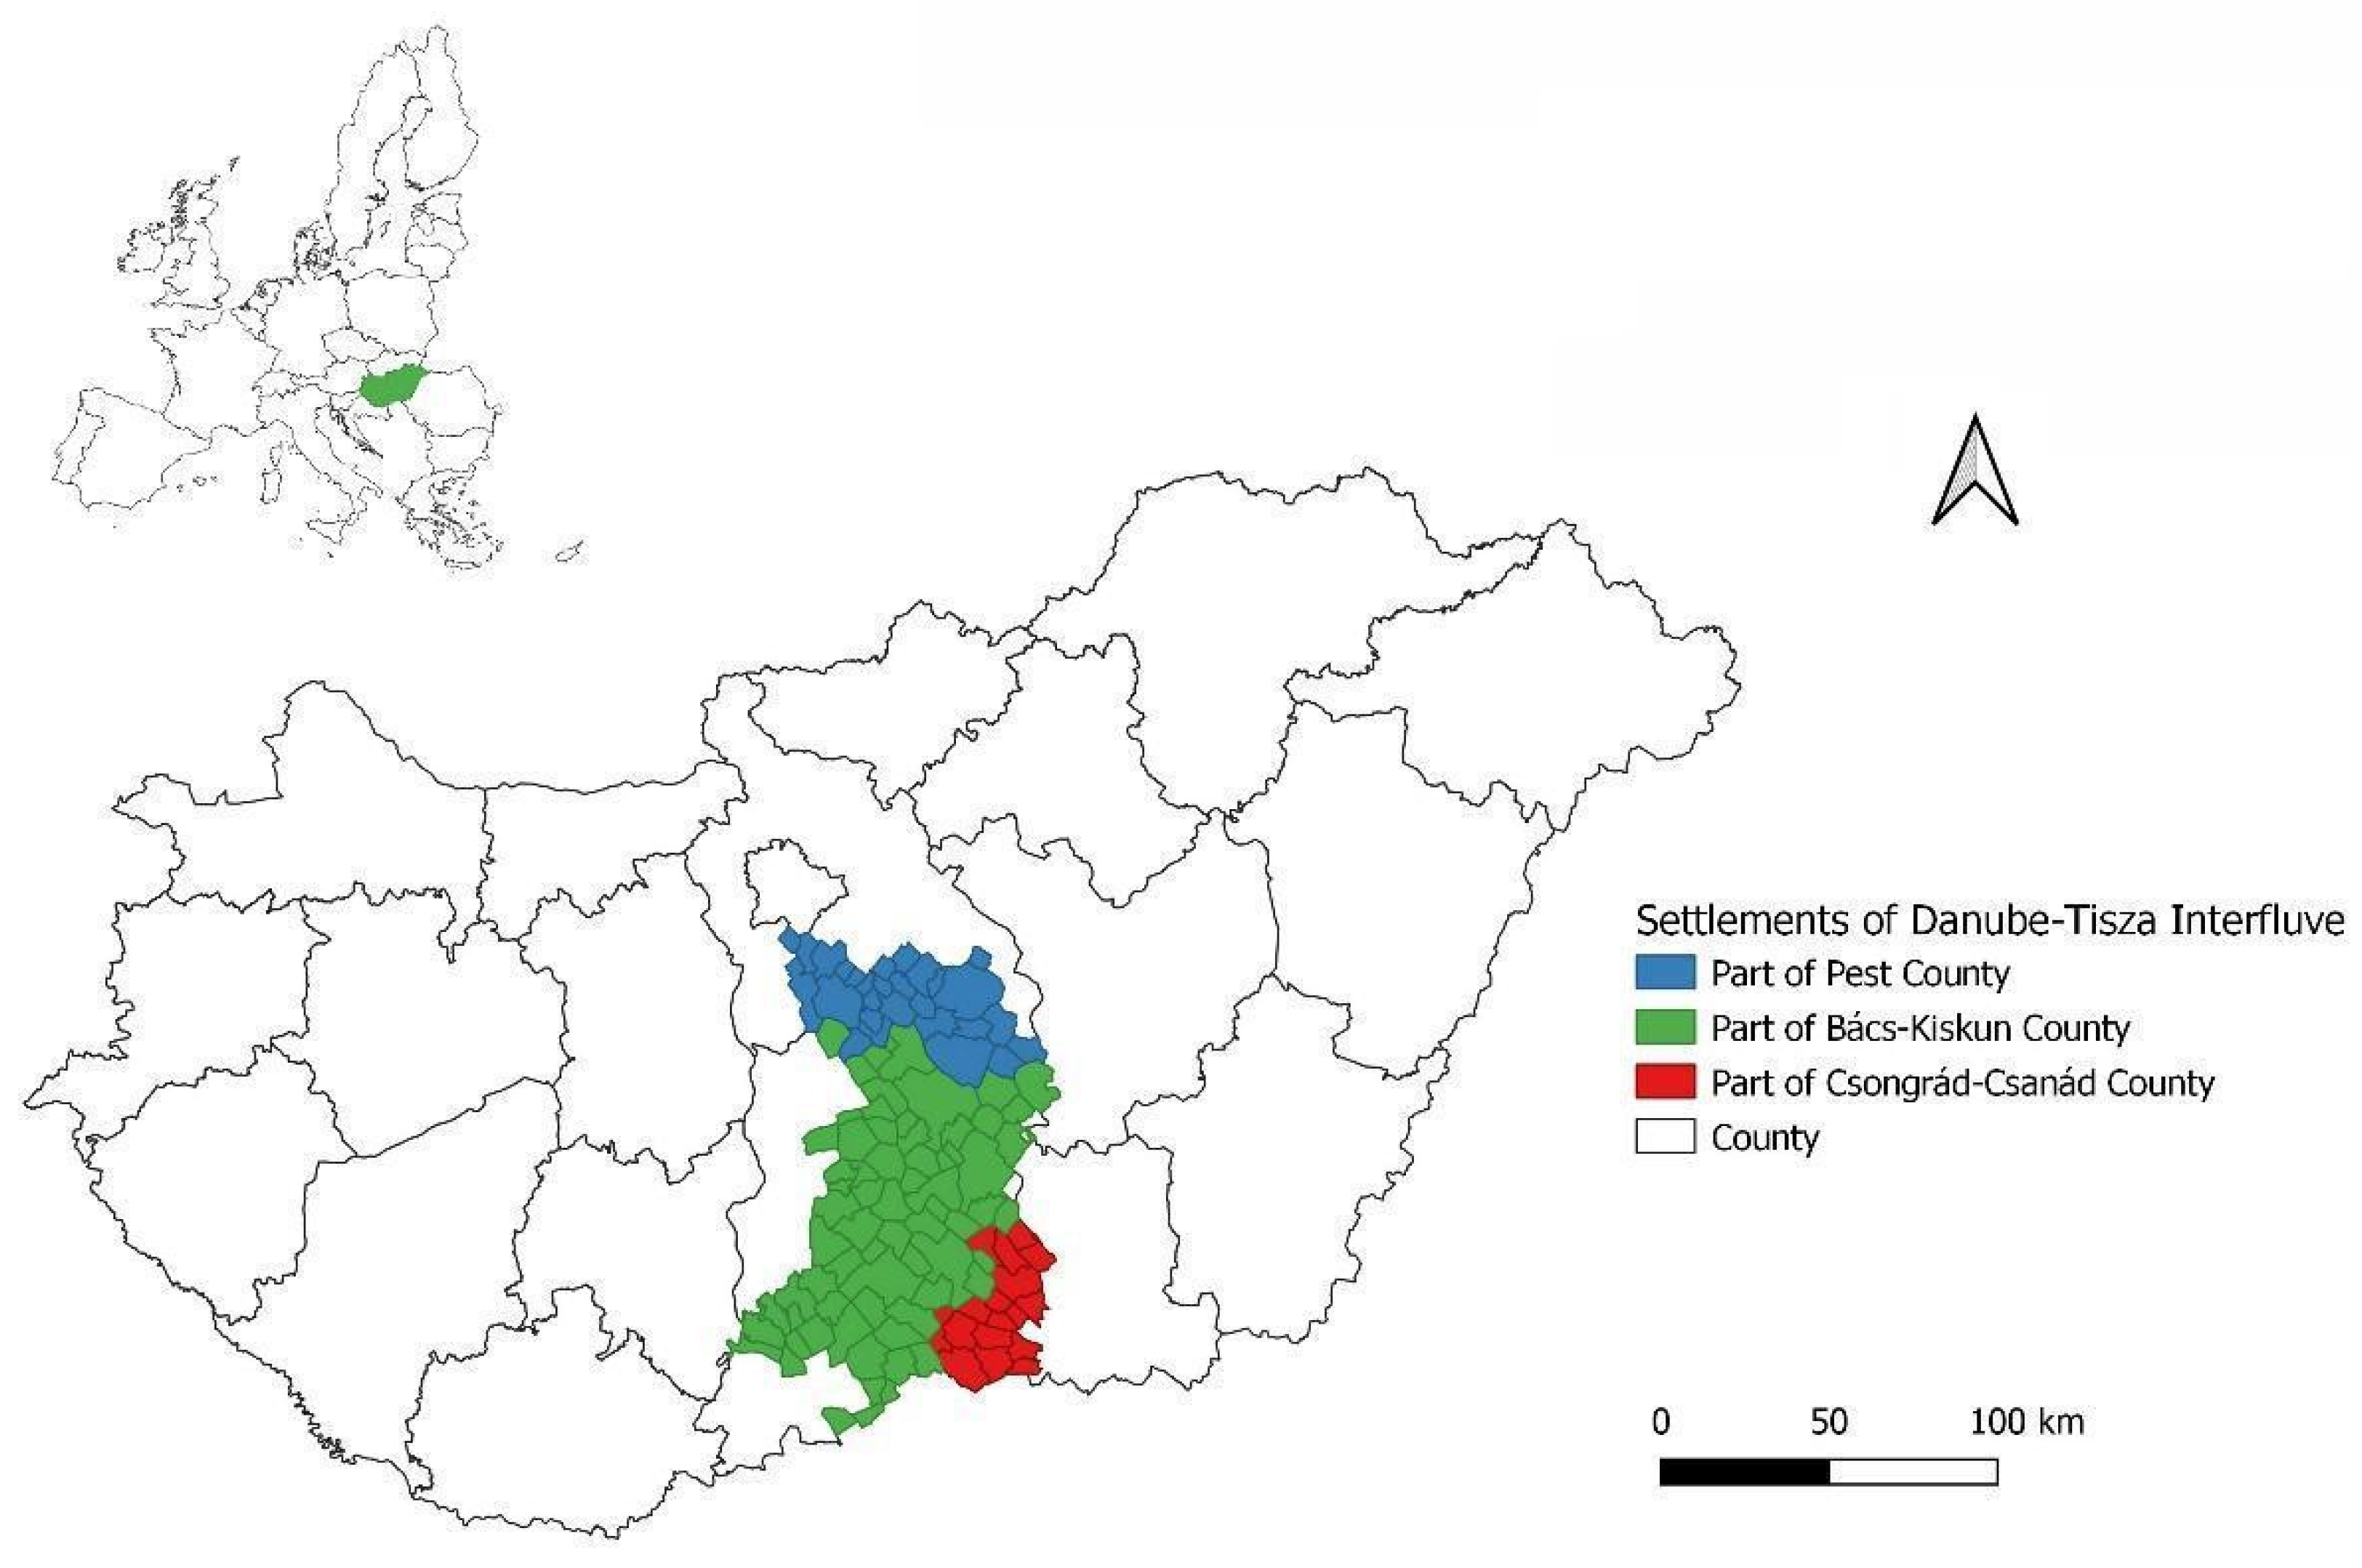
2.1. Study Area

The Duna–Tisza Interfluve region, part of the Great Plain in Hungary, covers almost 10,000 square kilometres. It is one of the most vulnerable areas of Hungary, where annual mean temperature can increase by 0.5–1.9 degrees Celsius while precipitation can decrease by up to a tenth [33,34]. This particularly severely affects the area as the only source of groundwater supplies is precipitation. Groundwater level declines are largely caused by a lack of precipitation [35]. Since the 1970s, groundwater levels have declined by 2–5 m, but, in some areas, a decline of up to 10 metres has been recorded. In addition to climate change, the water balance of the area is also significantly affected by the canal system built in the 1950s, which rapidly drains winter precipitation from the area. The UN Food and Agriculture Organization (FAO) has already classified the Danube–Tisza Interfluve as a semiarid zone in a long-term forecast map [24].
The area is covered by 117 settlements, belonging to three counties Pest, Bács-Kiskun and Csongrád-Csanád (Figure 1).

2.2. The Source of the Data

All development projects in the study region that received funding from the Structural and Cohesion Funds of the European Union in the 2007–2013 and 2014–2020 financial cycles were selected for the analysis. Structural and Cohesion Funds are allocated through the operational programmes of the National Development Plans compiled by the member state and approved by the EU in each financial period. Data was obtained from the official national database of development projects, the so-called “TÉRKÉPTÉR” [25], which enables search by financial periods, operational programmes and settlements. For each project, the project title, a short description (only available for the 2014–2020 period) and the amount of funding received were derived.

2.3. Methods of Data Analysis

The assessment of the projects was carried out in 4 main steps.
Step 1. Development areas were identified with positive and negative impacts regarding climate change (Table 1) based on the content analysis of the titles and the descriptions of the development projects as well as the eligible activities included in the calls for proposals using an inductive approach [26,36]. These categories are in line with the strategies usually named as positive or negative in terms of climate change in the scientific literature [17,18,19]. (See the description of the different development areas in Appendix A).
Step 2. Based on the main activities, each project was linked to either one of the development areas (with positive or negative impacts regarding climate change) or labelled neutral regarding its climate-change-related impact. The number of and the financial support received by the projects were summed for each development area with the positive and negative impacts and also for the three main impact categories (positive, negative and neutral).
Step 3. The development areas with positive impacts regarding climate change were scored according to their impacts along three criteria: (1) if they reduce greenhouse gas emission or increase absorption of CO2 from the atmosphere (mitigation) [13], 3 points were given; (2) if they reduce the impact of climate change or increase the adaptive capacity of natural systems (adaptation) [15], 2 points were given; and (3) if they have indirect positive impacts through knowledge generation, information flow, education or awareness raising, 1 point was assigned. Scores reflect the hierarchy of measures, where mitigation is the most valuable option because it tackles the causes of the problem, adaptation is the second-best option because it deals with the effects of climate change and indirect measures are in the third place contributing to the solution through increasing knowledge of stakeholders. The total impact score was calculated for each development area (Table 2). Then, the development areas were ranked based on their total impact scores and compared to the average financial support in each development area.
Step 4. Using the total impact scores of each development area the weighted number of projects and financial support for each development area was calculated for 2007–2020 using the following formulas:
x = i = 1 3 s i × n
y = i = 1 3 s i × j = 1 n f j
where
  • x: weighted number of projects of a given development area;
  • y: weighted financial support of a given development area;
  • i: index of the criterion;
  • j: index of a project in a given development area;
  • si: score of the development area in the given (i) criterion;
  • fj: financial support for a given (j) project in a given development area;
  • n: number of projects in a given development area.
To allow comparison, the weighted sum of projects and the financial support were normalised to a 0–100 scale using the following equation:
z = a k min a k max a k min a k × 100
where
  • z: normalised weighted result;
  • k: index of the development area;
  • ak: the value of the certain (k) development area to be normalised.
The detailed calculation is provided in Appendix B.

3. Results

3.1. Distribution of the Projects by the Main Impact Categories

Table 3 summarises the number of projects and the financial support they received in the total examined period (2007–2023) and also in the two financial cycles separated into the main impact categories related to climate change.
Table 3 shows that the neutral projects accounted for the largest percentage of all projects in both periods and overall, both in terms of the number of projects (2007–2020: over 86%) and the amount of funding awarded (2007–2020: 71%). It might indicate a low priority of combating climate change through development projects in the region. Projects with positive impacts represented close to 11% of the total number of projects and 13% of all financial support in the whole examined period (2007–2020), while projects with negative impacts accounted for less than 3% of all projects and 16% of the total funding. Although the number of development projects with positive impacts related to climate change was four times higher than projects with negative impacts regarding the whole period (2007–2020), they received less funding.
If we compare the two financial cycles (2007–2013 and 2014–2020), the number of projects with positive impacts increased by more than ten times, while their funding increased by only 2.3 times. The number of projects with negative impacts increased by less than 30%, and the financial support they received even decreased. In sum, by the 2014–2020 period, the trends were reversed, while many more projects with positive impacts were awarded more funding than projects with negative impacts.

3.2. Distribution of Climate-Change-Relevant Projects by Development Areas

Among the 17 development areas with positive impacts regarding climate change, small farm development had the largest number of projects (1764 in the whole period of 2007–2020, 41% of all positive projects), followed by the use of renewable energy sources, sustainable agriculture and afforestation (over 500 each). The use of renewable energy sources groups also received a large amount of funding (HUF 25 billion in the whole period of 2007–2020, 19% of the funding was related to positive projects), while the financial support of the other three development areas was quite low (below HUF 10 billion each). Regarding funding, the energy modernisation of buildings had the highest financial support (HUF 26 billion), and we can see the two energy-related development areas received the highest amount of funding (Table 4).
Among the three development areas with negative impacts on climate change, greenfield investments had the highest number of projects (902, 87% of negative projects) and the highest financial support (HUF 139 billion, 90% of funding for negative projects).
If we compare the two financial cycles (2007–2013 and 2014–2020), we can see that two new development categories with positive impacts regarding climate change emerged in the 2014–2020 period, the climate protection strategy and the afforestation. The main aim of these two development areas was climate change related; therefore, it shows the increasing priority of tackling climate change in the study region. Those development areas showed the highest increase between the two cycles and had the highest number in the whole period (2007–2020): small farm development, sustainable agriculture, afforestation and the use of renewable energy sources. The energy modernisation of buildings, precision farming and drought-tolerant crop and livestock variety development also showed a large increase in their number (3–10 times) by the second cycle (2014–2020). On the contrary, sustainable transport development, waste management and wetland restoration projects were concentrated more in the first financial cycle (2007–2013). In terms of financing, it is interesting that the drought-tolerant crop and livestock variety development projects received less funding in the second cycle, while their number increased by more than eight times.
In the development areas with negative impacts regarding climate change, irrigation farming emerged in the second cycle. The two other development areas (greenfield investment and drainage) had similar numbers in the two periods, but their funding slightly decreased in the second cycle.

3.3. Climate-Change-Related Impact Scores of Development Areas (2007–2020)

The development areas with positive impacts regarding climate change were ranked based on their total impact scores and compared with the average financial support of the projects in the development areas (Table 5).
The maximum impact score was 6 points (3 points for mitigation plus 2 points for adaptation plus 1 point for indirect impact). Our results show that nature restoration and urban green development projects ranked the highest (6 points) as they could assist in both mitigation and adaptation and were coupled with awareness raising. The second-best projects (with 5 points) are also connected to nature conservation, which shows the double positive effects (mitigation in the long term and adaptation in the short term) of conservation measures. The average financial support of the projects with large impact scores (5–6 points) was quite high (above HUF 250 million) except for afforestation. Nevertheless, they provide a good value for money.
Only the number of afforestation projects was quite high among the development areas with the high impact score (5–6 points), and none were among the projects with particularly high funding. Development areas with a high number of projects had medium scores (3–4 points) (e.g., small farm development). The pattern was similar regarding funding as well (e.g., energy modernisation of buildings and the use of renewable energy sources).

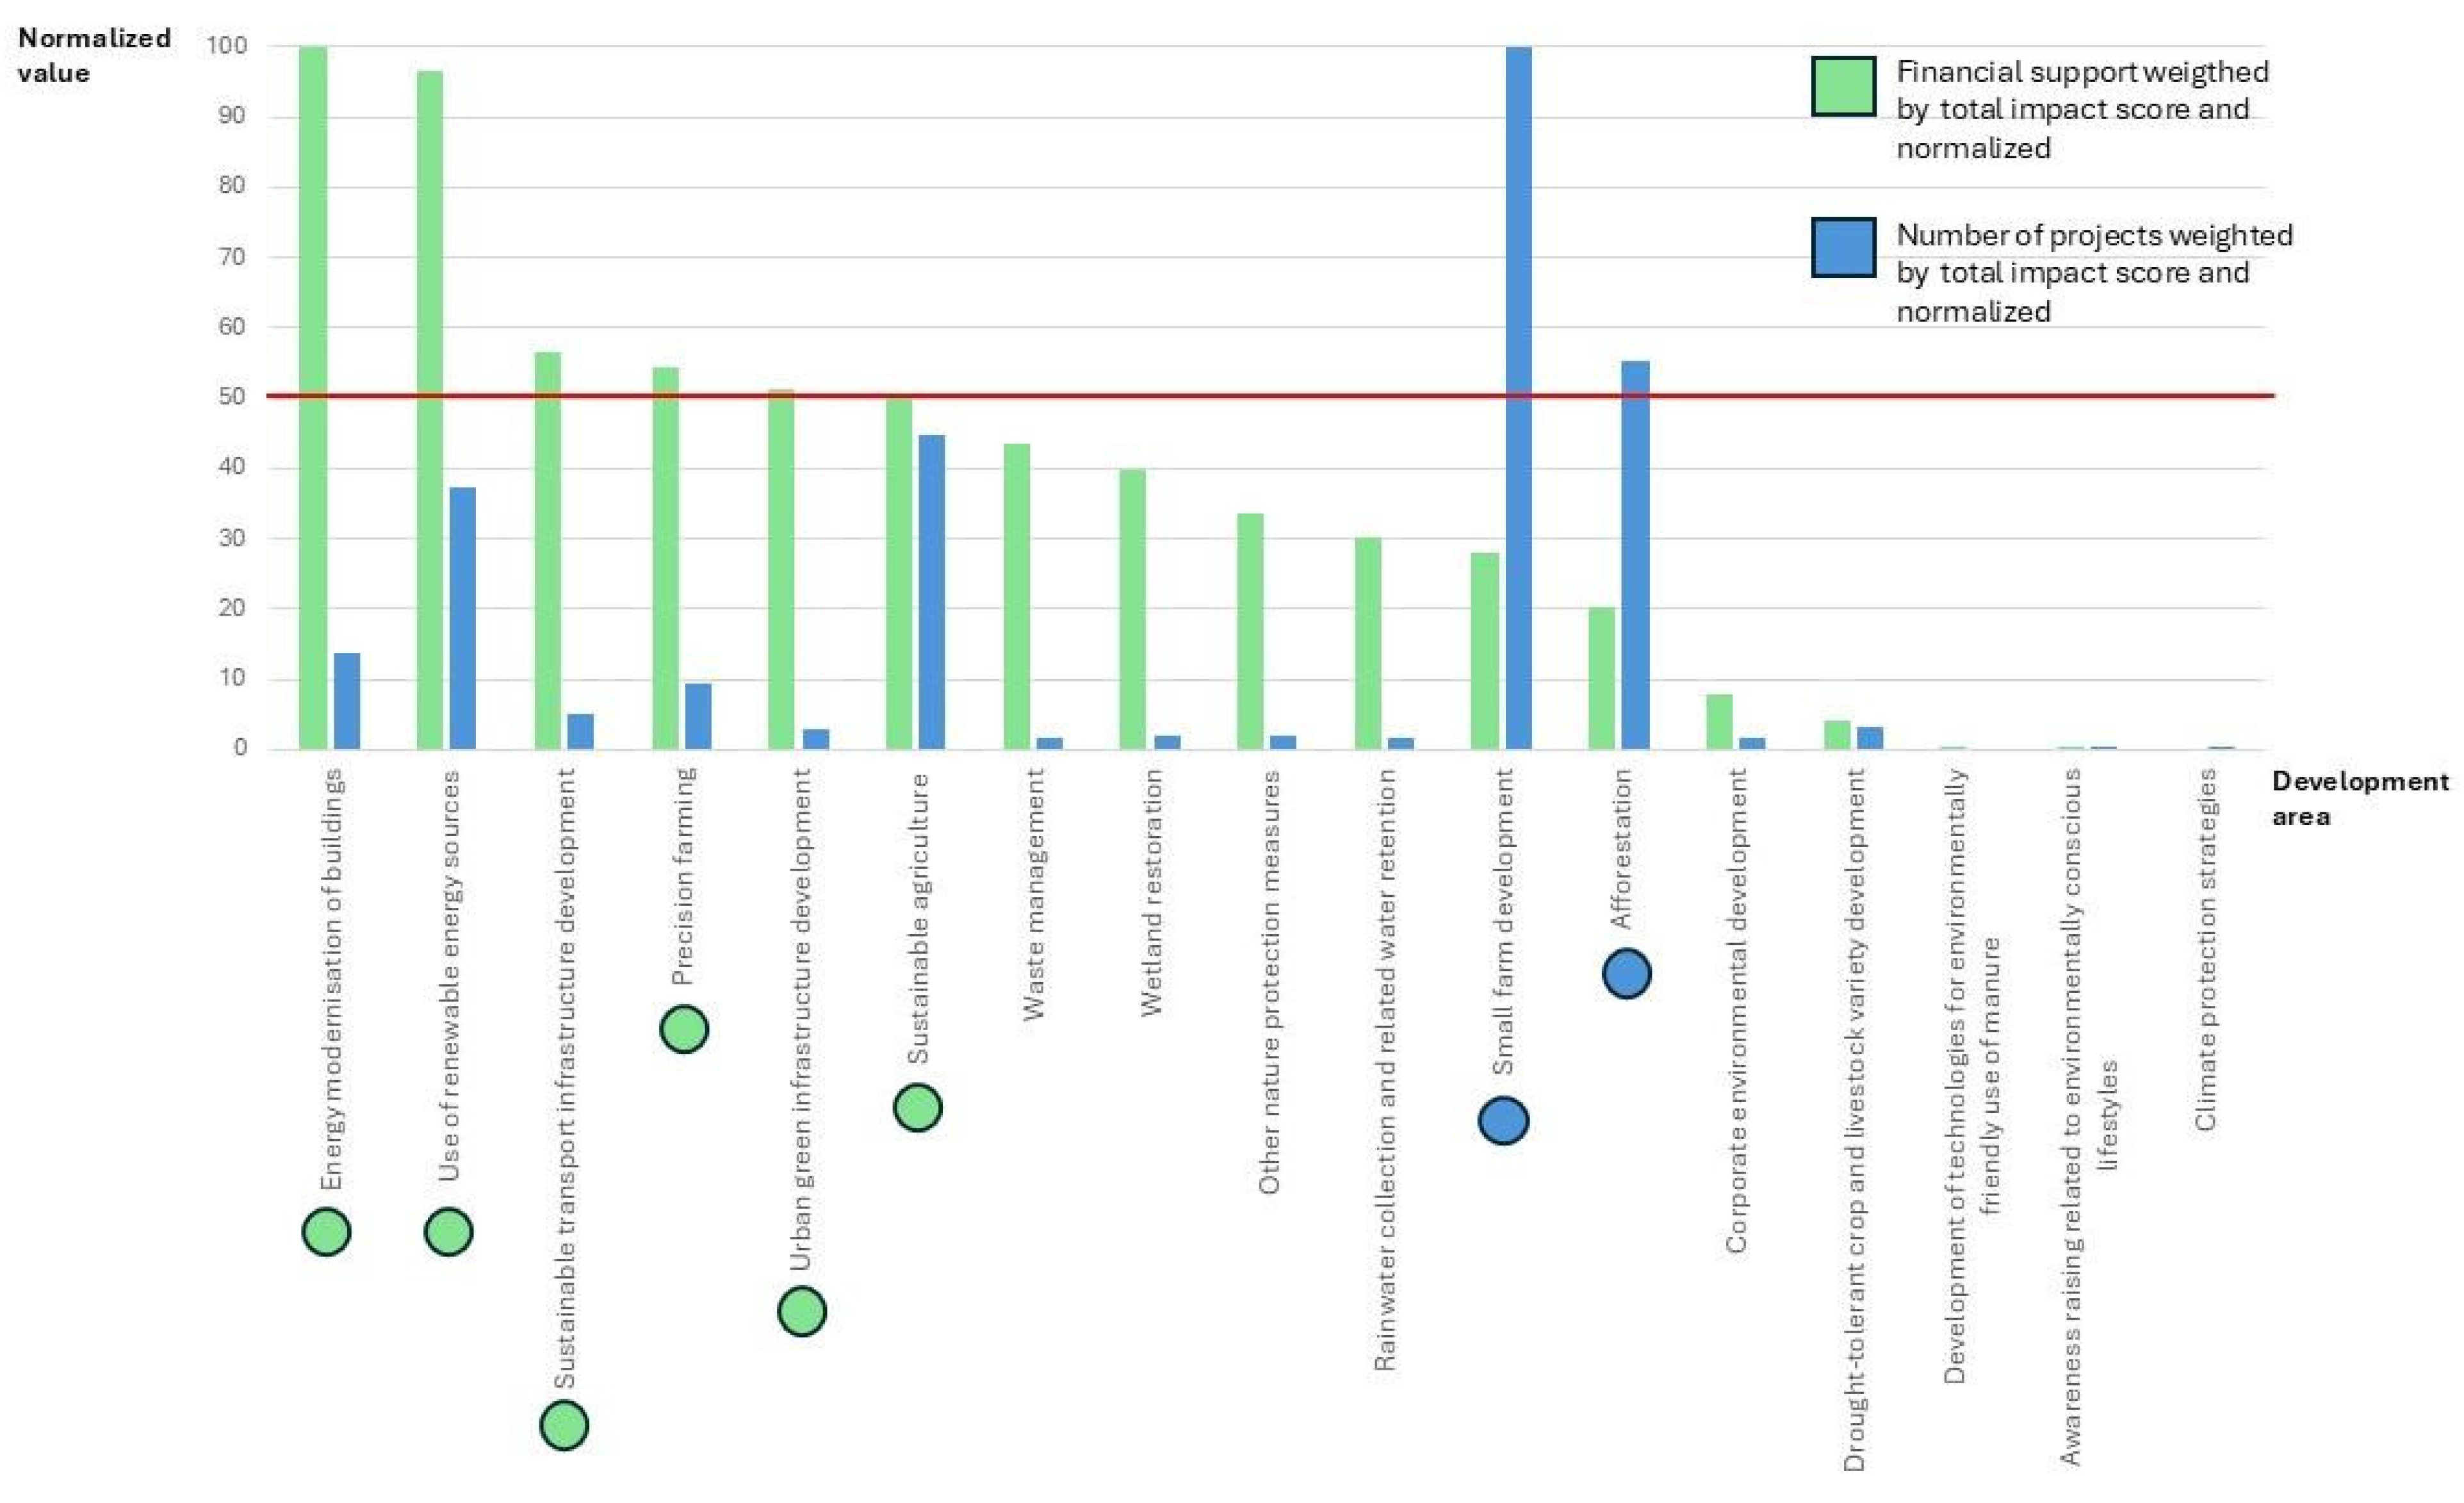
3.4. Climate-Change-Related Impact Value of Development Areas (Weighted by the Total Impact Scores and Normalised)

Development areas could also be ranked based on the impact values of the projects calculated in two categories (number and financial support weighted by the total impact score and normalised) (Figure 2, calculation in Appendix B).
Figure 2 shows that eight development areas reached 50% of the maximum impact value (50) in either the number or the financial support categories. They are the following:
  • The energy modernisation of buildings
  • The use of renewable energy sources
  • Sustainable transport infrastructure development
  • Precision farming
  • Urban green infrastructure development
  • Sustainable agriculture
  • Small farm development
  • Afforestation
The first six scored at or above 50 in the “financial support” category, while the last two ranked high in the “number of projects” category. If we compare the results with the previous analyses, we can see that the weighting with the impact score and normalisation made only slight changes in the ranking. The energy modernisation of buildings and the use of renewable energy sources had the highest funding (HUF 26 and 25 billion, respectively), and they had the highest impact value in the financial support category as well. The sustainable transport infrastructure development, precision farming and sustainable agriculture development areas also received quite high financial support, and they also ranked high regarding the impact value. Urban green infrastructure development was the only one that got a higher ranking in the financial support category compared to the previous analysis. In the “number of projects” category, small farm development had the highest impact score, and it had the highest number of projects as well. Afforestation was also among the development areas with the highest number of projects, so the impact value did not change that ranking considerably. The use of renewable energy and sustainable agriculture got a lower ranking in the calculation of impact value compared to the previous calculation in the “number of projects” category.

4. Discussion

The Danube–Tisza Interfluve is Hungary’s driest and most vulnerable to the negative impacts of climate change, and actions should be taken before meeting more extreme problems of those countries where the phenomena have been present for a much longer time [37]. Therefore, development projects related to climate change mitigation and adaptation could greatly improve people’s lives in the settlements and their financial viability as the jobs of many local people are related to agricultural production [38,39]. Our research found similar positive impacts in terms of the use of national and international funds as some other countries with similar problems in rainfed agricultural environments [37]. Our approach is novel as regional analysis is not used by other authors in this field. There are many similar analyses [22,24,25,26,27,28,29,31,37,38,39] but not at the regional scale. Analyses of EU-funded development projects for two EU financial cycles (2007–2013 and 2014–2020) in a region smaller than the national scale and larger than the settlement scale are usually out of the scope of research, based on our literature review.
The assessment of 39,232 climate-change-impact-related development projects of the 2007–2013 and 2014–2020 EU financial cycles shows that only a fraction of development projects had a positive impact on climate change: 4254 development projects worth HUF 129 billion. This represents only around 11% of all projects examined and 13% of total funds. Energy-related development areas received the most financial support (the energy modernisation of buildings and the use of renewable energy sources). The Baltic states also used EU Structural funds for energy efficiency and renewable energy projects in the same period [28]. In our assessment of the Hungarian case, there were 1028 projects, worth HUF 153 billion, identified as projects with negative impacts regarding climate change, representing less than 3% of all projects and 16% of the total funds allocated. Although the amount of funding was less for projects with positive climate-related impacts in the whole period (2007–2020), our results also show that in the 2014–2020 EU financial cycle, there was a much higher number of projects with positive impacts than in the previous cycle, their funding also increased and it was higher than for projects with negative impacts. So, a positive trend can be seen.
According to COM (2009) [40], climate priorities for the post-2013 period were still not finalised, and binding measures and programmes impacting financial policy were still under preparation between 2007 and 2013. The low share of climate change funding in the 2007–2013 cycle can also be explained by the fact that the European Commission only created more opportunities for climate change mitigation investments in 2012 [41,42]. While in the 2007–2013 period, an estimated 5% of the budget was allocated to climate action, in the post-2014 cycle, 20% of the budget was supposed to be devoted to climate priorities [41,43]. In the latter period, funding directly related to climate change or promoting adaptation and mitigation (energy, sustainable mobility, afforestation, etc.) was introduced, which was not the case in the 2007–2013 cycle [44,45,46]. Our research also shows that the 2014–2020 EU financial cycle has seen a much higher number of projects that reduce the effect of climate change than the previous cycle.
We also scored the development areas with positive impacts regarding climate change based on their contribution to mitigation, adaptation and indirectly through knowledge generation and information flow. Buzási et al. [27] used similar categories for grouping the objectives of the Budapest Climate Change Strategy for their assessment of certain planned development actions. In the scoring, we gave preference for tackling the causes (mitigation) over reducing the negative impacts and increasing the adapting capacity (adaptation). Buzási et al. [27] also used a scoring system, but they did not make a difference among the three main categories; rather, they scored if the action contributed to the objectives in a positive, negative or neutral way. They used the categories only to group the objectives. Our analysis shows that development projects based on nature restoration and coupled with awareness raising can have the best impact score, while they serve both mitigation and adaptation purposes and also have indirect impacts by fostering attitude change. The possible synergies of climate change mitigation and adaptation measures are also emphasised in the literature on climate change [14,15]. Buzási et al. [27] also stress that the development of green spaces in an urban setting can be beneficial both from the mitigation and adaptation points of view. Besides the Structural and Cohesion Funds, LIFE has also provided funding for habitat restoration projects in Hungary [47]. Lung et al. [29] emphasise the importance of increasing funds for conservation in times of climate change.
This study has certain limitations as it focuses on a regional scale, not a national scale. However, these regional examinations targeting the hotspots where climate change mitigation and adaptation are needed in a country the most might help formulate the calls for EU-funded development projects. This kind of analysis can also show how the funds were used and what changes are needed for the distribution of development funds to help mitigate and adapt to climate change.

5. Conclusions

Based on the applied methodology, we can conclude that the identification and evaluation of the positive and negative impacts of development areas related to climate change is possible and provides important data for the future planning of calls for funds. The developed scoring system for assessing development areas with positive impacts regarding their contribution to mitigation or adaptation or having indirect positive impacts is a useful tool for the evaluation of funds. This methodology might be applied to the assessment of projects in other regions as well. It might be refined or developed further but can be a good basis for a climate-change-related assessment of projects.
Our results show that in the examined periods, neutral projects accounted for the majority of the projects (both in terms of number and funding received), and even projects with negative impacts were financed. It indicates that tackling climate change was not a high priority in the region, although some slightly positive trends can be observed in the increasing number of and financial support for projects with positive impacts in the second financial cycle (2014–2020). But even if this trend continues, we recommend the compilation of a complex climate strategy for the Danube–Tisza Interfluve that would define the directions and a set of measures for all territorial development sectors. It might also change funding priorities and increase the number of projects with positive impacts even further as well as eliminate projects with negative impacts.
The analysis is based on the number of projects and the amount of funds. This can be the basis for further policy improvements. Although these numbers do not necessarily reflect all aspects of climate change mitigation and adaptation, these results can be a basis for further, deeper analyses complemented by other tools and approaches.
Our findings indicate that there were three development areas with negative impacts in terms of climate change (greenfield investment, drainage and irrigation farming). Irrigation farming projects appeared in the second period (2014–2020), and the number of greenfield investments increased in the second period. Greenfield investments reduce areas available for farming and biodiversity conservation, having additional detrimental impacts as well. Therefore, it would be important to stop these projects and look for brownfield alternatives. Drainage and irrigation farming reduce the water level and water availability in the landscape; therefore, they have long-term negative impacts for agriculture and conservation as well. It means that these projects should not be financed in the future but replaced by projects with sustainable water management practices.
Based on our results, we can also conclude that nature restoration and conservation projects scored high as nature-based solutions for climate change problems as they contribute both to mitigation and adaptation in rural and urban settings. Their recognition in combating climate change is highly recommended.
We could see from our analysis that not every climate-positive development area had an indirect positive impact through information flow or awareness raising. Although it might have a transformative effect on society only in the long term, integrating it into every project can be a cost-effective solution. Therefore, we recommend the inclusion of awareness raising into every development category.

Author Contributions

Conceptualisation, G.O., E.T.K. and B.K.; methodology, G.O., E.T.K. and V.P.G.; validation, G.O., V.P.G. and E.T.K.; formal analysis, G.O., B.K., E.T.K., C.C. and V.P.G.; investigation, G.O. and B.K.; data curation, G.O., B.K. and V.P.G.; writing—original draft preparation, all authors; writing—review and editing, E.T.K., G.O. and C.C.; supervision, G.O. and E.T.K. All authors have read and agreed to the published version of the manuscript.

Funding

This research received no external funding.

Data Availability Statement

TÉRKÉPTÉR. Available online: https://archive.palyazat.gov.hu/terkepter (accessed on 31 October 2024).

Conflicts of Interest

The authors declare no conflicts of interest.

Appendix A. Description of the Identified Development Areas

Development AreasDescription
With positive impact in terms of climate change
Development of technologies for environmentally friendly use of manureDeveloping innovative organic fertilisation technologies that integrate environmental management considerations.
Precision farmingPrecision farming and all activities contributing to the research, development and application of innovative agricultural technologies.
Small farm developmentThis includes investments in energy efficiency upgrading of small farms and renewable energy production on the farm. l.
Sustainable agriculture Support for the transition to organic farming, solidarity farming and the operation of community-supported farms. It also includes actions to raise awareness of sustainable agriculture, permaculture and organic farming and to promote composting.
Drought-tolerant crop and livestock variety developmentResearch and development support for the production and use of more drought-tolerant crop varieties and biotechnology training for farmers. This also includes financial support for the conservation of genetic resources of endangered agricultural animal and plant species.
AfforestationFinancial support for afforestation of agricultural land, for afforestation procedures and to compensate for the loss of income.
Rainwater collection and related water retentionReconstruction of stormwater retention and catchment area water recharge and development of irrigation systems for water retention and water conservation solutions for the management of emergency and drought situations; construction of stormwater storage and reservoir.
Climate protection strategiesCreating local strategies and programmes on climate change and related awareness-raising action programmes.
Awareness raising related to environmentally conscious lifestylesCommunity action programmes on energy use, sustainability and environmentally conscious lifestyles and awareness-raising to raise public awareness.
Wetland restorationSupport for nature conservation measures aimed specifically at the reconstruction, restoration and enhancement of wetlands and wetland habitats, the improvement of their condition and the conservation of wetland and wetland-related species and their populations and awareness-raising and knowledge transfer related to wetlands through, e.g., educational paths.
Other nature protection measuresProjects supporting habitat restoration, invasive species control and environmental assessment and conservation management, as well as conservation education related to all habitat types except wetlands.
Waste managementComplex development of waste management systems including transport, pre-treatment, treatment and landfilling. Developing the separate treatment of municipal and hazardous waste and the recultivation of municipal solid waste landfills and related awareness-raising activities.
Urban green infrastructure developmentImprovement of the quantity and quality of municipal green infrastructure, green space improvements linked to rehabilitation of degraded urban areas, development of “Green Cities”, the expansion of parks and public spaces and recreational services provided by green spaces and related awareness-raising.
Sustainable transport infrastructure developmentInfrastructure investments to improve local and inter-urban non-motorised transport (walking and cycling) and public transport modes and related accessibility.
Energy modernisation of buildingsEnergy efficiency improvements in buildings of public institutions, companies, churches and NGOs; renovation of heating systems and building insulation programmes.
Use of renewable energy sourcesProjects to promote the use of photothermal, photovoltaic, geothermal and bioenergy and renewable energy use alongside complex energy modernisation. Development of solar collectors, solar panels, geothermal and bioenergy systems for public institutions, companies, churches and NGOs.
Corporate environmental developmentEconomic development measures that integrate sustainability and environmental management principles, including environmental protection measures into corporate management. Infrastructural development of brownfield sites, innovative management of industrial waste and financing of remediation measures related to industrial activities
With negative impact in term of climate change
Irrigation farmingFinancial support for the construction and development of irrigation systems and related infrastructure, including management facilities for irrigated farms; construction and operation of wells and canals.
DrainageInvestments related to stormwater and inland water drainage, construction and renovation of canals for channelling stormwater to sewage systems.
Greenfield investmentsInvestment into a new industrial venture on land previously under agricultural cultivation. The site is entirely new, without any architectural or operational history.

Appendix B. Calculation of the Impact Score as Well as the Normalised Weighted Number and Financial Support of Projects in Each Development Area

Development AreaTotal Impact Score (a)Number of Projects (b)Weighted Number of Projects (c = a × b)Normalised Weighted Number of Projects (d)Total Financial Support (HUF) (e)Weighted Financial Support (HUF) (f = a × e)Normalised Weighted Financial Support (g)
Development of technologies for environmentally friendly use of manure3130112,465,586337,396,7580
Precision farming41275081010,582,137,61542,328,550,46054
Small farm development3176452921007,273,087,39021,819,262,17028
Sustainable agriculture 45932372459,720,960,81038,883,843,24050
Drought-tolerant crop and livestock variety development35516531,086,847,2723,260,541,8164
Afforestation55862930553,162,709,62415,813,548,12020
Rainwater collection and related water retention5178524,683,953,18623,419,765,93030
Climate protection strategies155077,003,06577,003,0650
Awareness raising related to environmentally conscious lifestyles1770322,045,183322,045,1830
Wetland restoration61911425,162,387,96930,974,327,81440
Other nature conservation measures61710224,373,192,96026,239,157,76034
Waste management4218428,491,931,51333,967,726,05244
Urban green infrastructure development62615636,663,897,49739,983,384,98251
Sustainable transport infrastructure development389267514,625,998,75743,877,996,27156
Energy modernisation of buildings32467381425,908,827,79477,726,483,382100
Use of renewable energy sources365919773725,001,317,48975,003,952,46796
Corporate environmental development4228821,552,156,3876,208,625,5488

References

  1. UNEP Annual Report 2023, Keeping the Promise. Available online: https://capacity4dev.europa.eu/library/uneps-annual-report-2023-keeping-promise_en (accessed on 31 October 2024).
  2. Core Writing Team; Pachauri, R.K.; Meyer, L.A. (Eds.) IPCC: Climate Change 2014: Synthesis Report. In Contribution of Working Groups I, II and III to the Fifth Assessment Report of the Intergovernmental Panel on Climate Change; IPCC: Geneva, Switzerland, 2014; pp. 1–31. [Google Scholar]
  3. Core Writing Team; Lee, H.; Romero, J. (Eds.) IPCC: Climate Change 2023: Synthesis Report. In Contribution of Working Groups I, II and III to the Sixth Assessment Report of the Intergovernmental Panel on Climate Change; IPCC: Geneva, Switzerland, 2023; pp. 1–34. [Google Scholar] [CrossRef]
  4. Király, G. (Ed.) Éghajlatváltozási alkalmazkodás-kutatás a hazai mezőgazdaságban. Készítette az Agrárgazdasági Kutató Intézet a Magyar Bányászati és Földtani Szolgálat Megbízásából a KEHOP-1.1.0-15-2016-00007 Azonosítószámú “NATÉR Továbbfejlesztése” Projekt Keretében. 2018. Available online: https://nater.mbfsz.gov.hu/sites/nater.mfgi.hu/files/files/Mezogazdasag_NateR2.pdf (accessed on 31 October 2024).
  5. UNFCCC. Adoption of the Paris Agreement. Proposal by the President. United Nations, Geneva. 2015. Available online: https://unfccc.int/documents/9064 (accessed on 31 October 2024).
  6. Schleussner, C.-F.; Lissner, T.K.; Fischer, E.M.; Wohland, J.; Perrette, M.; Golly, A.; Rogelj, J.; Childers, K.; Schewe, J.; Frieler, K.; et al. Differential climate impacts for policy-relevant limits to global warming: The case of 1.5 °C and 2 °C. Earth Syst. Dynam. 2016, 7, 327–351. [Google Scholar] [CrossRef]
  7. Donnelly, C.; Greuell, W.; Andersson, J.; Gerten, D.; Pisacane, G.; Roudier, P.; Ludwig, F. Impacts of climate change on European hydrology at 1.5, 2 and 3 degrees mean global warming above preindustrial level. Clim. Chang. 2017, 143, 13–26. [Google Scholar] [CrossRef]
  8. Dosio, A.; Fischer, E.M. Will half a degree make a difference? Robust projections of indices of mean and extreme climate in Europe under 1.5 °C, 2 °C, and 3 °C global warming. Geophys. Res. Lett. 2018, 45, 935–944. [Google Scholar]
  9. Nunez, S.; Arets, E.; Alkemade, R.; Verwer, C.; Leemans, R. Assessing the impacts of climate change on biodiversity: Is below 2 °C enough? Clim. Chang. 2019, 154, 351–365. [Google Scholar] [CrossRef]
  10. Rhodes, C.J. Only 12 years left to readjust for the 1.5-degree climate change option—Says International Panel on Climate Change report: Current commentary. Sci. Prog. 2019, 102, 73–87. [Google Scholar] [CrossRef] [PubMed]
  11. Innovációs és Technológiai Minisztérium. Nemzeti Éghajlatváltozási Stratégia 2. In A 2018–2030 Közötti időszakra vonatkozó, 2050-ig tartó Időszakra Is Kitekintést Nyújtó második; Innovációs és Technológiai Minisztérium: Budapest, Hungary, 2018. [Google Scholar]
  12. Dewulf, A. Contrasting frames in policy debates on climate change adaptation. Wiley Interdiscip. Rev. Clim. Change 2013, 4, 321–330. [Google Scholar] [CrossRef]
  13. Watkiss, P.; Benzie, M.; Klein, R.J. The complementarity and comparability of climate change adaptation and mitigation. Wiley Interdiscip. Rev. Clim. Chang. 2015, 6, 541–557. [Google Scholar] [CrossRef]
  14. Raman, S.V.V.; Iniyan, S.; Goic, R. A review of climate change, mitigation and adaptation. Renew. Sustain. Energ. Rev. 2012, 16, 878–897. [Google Scholar] [CrossRef]
  15. Zhao, C.; Yan, Y.; Wang, C.; Tang, M.; Wu, G.; Ding, D.; Song, Y. Adaptation and mitigation for combating climate change–from single to joint. Ecosyst. Health Sustain. 2018, 4, 85–94. [Google Scholar] [CrossRef]
  16. Pietrapertosa, F.; Khokhlov, V.; Salvia, M.; Cosmi, C. Climate change adaptation policies and plans: A survey in 11 South East European countries. Renew. Sustain. Energy Rev. 2018, 81, 3041–3050. [Google Scholar] [CrossRef]
  17. Wang, F.; Harindintwali, J.-D.; Wei, K.; Shan, Y.; Mi, Z.; Costello, M.J.; Grunwald, S.; Feng, Z.; Wang, F.; Guo, Y.; et al. Climate change: Strategies for mitigation and adaptation. Innov. Geosci. 2023, 1, 100015. [Google Scholar] [CrossRef]
  18. Duan, Z.; de Wilde, P.; Attia, S.; Zuo, J. Prospect of energy conservation measures (ECMs) in buildings subject to climate change: A systematic review. Energy Build. 2024, 322, 114739. [Google Scholar] [CrossRef]
  19. Parra-López, C.; Abdallah, S.B.; Garcia-Garcia, G.; Hassoun, A.; Sánchez-Zamora, P.; Trollman, H.; Carmona-Torres, C. Integrating digital technologies in agriculture for climate change adaptation and mitigation: State of the art and future perspectives. Comput. Electron. Agric. 2024, 226, 109412. [Google Scholar] [CrossRef]
  20. European Environment Agency. Communication from the Commission to the European Parliament, the European Council, The Council, The European Economic and Social Committee and the Committee of the Regions. The European Green Deal COM/2019/640 Final Brussels, 11.12.2019 COM(2019) 640 Final; European Environment Agency: Copenhagen, Denmark, 2019. [Google Scholar]
  21. Ferragina, E.; Quagliarotti, D. Climatic change in the Mediterranean Basin: Territorial Impact and Search for a Common Strategy. New Medit. 2008, 7, 4–12. [Google Scholar]
  22. Carvalho, A.; Schmidt, L.; Santos, F.D.; Delicado, A. Climate change research and policy in Portugal. Wiley Interd. Rev. Clim. Chang. 2014, 5, 199–217. [Google Scholar] [CrossRef]
  23. do Prado Tanure, T.M.; Miyajima, D.N.; Magalhães, A.S.; Domingues, E.P.; Carvalho, T.S. The impacts of climate change on agricultural production, land use and economy of the Legal Amazon region between 2030 and 2049. EconomiA 2020, 21, 73–90. [Google Scholar] [CrossRef]
  24. Ministry of Environment and Water of the Republic of Hungary. Second National Report of the Republic of Hungary on the implementation of the United Nations Convention to Combat Desertification; Ministry of Environment and Water of the Republic of Hungary: Budapest, Hungary, 2006; 24p.
  25. TÉRKÉPTÉR. Available online: https://archive.palyazat.gov.hu/terkepter (accessed on 31 October 2024).
  26. Elo, S.; Kyngäs, H. The qualitative content analysis process. J. Adv. Nurs. 2008, 62, 107–115. [Google Scholar] [CrossRef]
  27. Childress, M.D.; Siegel, P.; Törhönen, M. Linking Land Policy with Climate Change: A Multi-dimensional Landscape Approach to Territorial Development with a Focus on the Europe and Central Asia (ECA) Region. In Proceedings of the Second Central Asia Climate Knowledge Forum: Moving Towards Regional Climate Resilience, Almaty, Kazakhstan, 13–15 May 2014. [Google Scholar]
  28. Greiving, S.; Fleischhauer, M. National climate change adaptation strategies of European states from a spatial planning and development perspective. In Climate Change and Sustainable Cities; Routledge: Oxfordshire, UK, 2016; pp. 27–48. [Google Scholar]
  29. Mongo, M.; Tanguy, A.; Laforest, V.; Piatyszek, E. Territorial Development in the Face of Climate Change; Post-Print emse-04100219; HAL: Bengaluru, India, 2020. [Google Scholar]
  30. Buzási, A.; Pálvölgyi, T.; Csete, M.S. Assessment of climate change performance of urban development projects–Case of Budapest, Hungary. Cities 2021, 114, 103215. [Google Scholar] [CrossRef]
  31. Štreimikienė, D. Review of financial support from EU Structural Funds to sustainable energy in Baltic States. Renew. Sustain. Energy Rev. 2016, 58, 1027–1038. [Google Scholar] [CrossRef]
  32. Lung, T.; Meller, L.; van Teeffelen, A.J.; Thuiller, W.; Cabeza, M. Biodiversity funds and conservation needs in the EU under climate change. Conserv. Lett. 2014, 7, 390–400. [Google Scholar] [CrossRef]
  33. OGY határozat. Nemzeti Éghajlatváltozási Stratégia 1. In 2008–2025, 29/2008. (III. 20.) OGY határozat a Nemzeti Éghajlatváltozási Stratégiáról; OGY határozat: Budapest, Hungary, 2008. [Google Scholar]
  34. Hoyk, E.; Kanalas, I. Kecskemét klímaváltozási kihívásai és alkalmazkodási lehetőségei. Forrás 2020, 52, 148–166. [Google Scholar]
  35. Gulácsi, A. Az antropogén klímaváltozás és a természetes klímaoszcillációk szerepe a szárazodásban és a szélsőséges időjárásban Magyarországon. Légkör 2017, 61, 72–81. [Google Scholar]
  36. Mayring, P.H. Qualitative Content Analysis: Theoretical Foundation, Basic Procedures and Software Solution. Klagenfurt. 2014. Available online: http://nbn-resolving.de/urn:nbn:de:0168-ssoar-395173 (accessed on 31 October 2024).
  37. Guimbeau, A.; Ji, X.; Menon, N. Climate Shocks, Intimate Partner Violence, and the Protective Role of Climate-Resilience Projects; IZA-Institute of Labor Economics: Bonn, Germany, 2024; Available online: https://www.aeaweb.org/conference/2025/program/paper/Kkb4AnK2 (accessed on 3 March 2025).
  38. Banerjee, A.; Ariz, D.; Turyasingura, B.; Pathak, S.; Sajjad, W.; Yadav, N.; Kirsten, K.L. Long-term climate change and anthropogenic activities together with regional water resources and agricultural productivity in Uganda using Google Earth Engine. Phys. Chem. Earth Parts A B C 2024, 134, 103545. [Google Scholar] [CrossRef]
  39. van Leeuwen, C.; Sgubin, G.; Bois, B.; Ollat, N.; Swingedouw, D.; Zito, S.; Gambetta, G.A. Climate change impacts and adaptations of wine production. Nat. Rev. Earth Environ. 2024, 5, 258–275. [Google Scholar] [CrossRef]
  40. Commission of the European Communities (COM). Adapting to Climate Change: Towards a European Framework for Action. White Paper, COM/2009/0147 Final; COM: Brussels, Belgium, 2009. [Google Scholar]
  41. Nemzeti Éghajlatváltozási Stratégia 2. Második Nemzeti Éghajlatváltozási Stratégia 2014-2025 kitekintéssel 2050-re, Hazai Dekarbonizációs Útiterv, Nemzeti Alkalmazkodási Stratégia, Partnerség az éghajlatért” Szemléletformálási Terv. Szakpolitikai Vitaanyag . 2013. Available online: https://2010-2014.kormany.hu/download/7/ac/01000/M%C3%A1sodik%20Nemzeti%20%C3%89ghajlatv%C3%A1ltoz%C3%A1si%20Strat%C3%A9gia%202014-2025%20kitekint%C3%A9ssel%202050-re%20-%20szakpolitikai%20vitaanyag.pdf (accessed on 3 March 2025).
  42. European Commission. Communication from the Commission to the European Parliament, the Council, the European Economic and Social Committee and the Committee of the Regions—A Budget for Europe 2020; COM/2011/0500 final; European Commission: Brussels, Belgium, 2020. [Google Scholar]
  43. Tišma, S.; Boromisa, A.M.; Kaselj, A.P. Environmental Finance and Development, 1st ed.; Routledge: London, UK, 2016; p. 216. ISBN 9781138215085. [Google Scholar]
  44. ÚMFT (2007): Új Magyarország Fejlesztési Terv, Magyarország Nemzeti Stratégiai Referenciakerete 2007–2013 Foglalkoztatás és növekedés. Nemzeti Erőforrás Minisztérium. 2007. Available online: http://www.nefmi.gov.hu/letolt/felsoo/fejlesztes/2_3_1_umft_080326.pdf (accessed on 31 October 2024).
  45. ÚSZT (2011): Új Széchenyi Terv Akciótervei 2011–2013. Available online: https://archive.palyazat.gov.hu/doc/2670 (accessed on 31 October 2024).
  46. SZT (2014): A Széchenyi 2020 Fejlesztési Program Európai Bizottság által Elfogadott Operatív Programjai. Available online: https://archive.palyazat.gov.hu/az-eurpai-bizottsg-ltal-elfogadott-operatv-programok-archv (accessed on 31 October 2024).
  47. Mihók, B.; Biró, M.; Molnár, Z.; Kovács, E.; Bölöni, J.; Erős, T.; Standovár, T.; Török, P.; Csorba, G.; Margóczi, K.; et al. Biodiversity on the waves of history: Conservation in a changing social and institutional environment in Hungary, a post-soviet EU member state. Biol. Conserv. 2017, 211, 67–75. [Google Scholar] [CrossRef]
Figure 1. The study area in the Danube–Tisza Interfluve with three counties and 117 settlements in central Hungary.
Urbansci 09 00092 g001
Figure 2. The total and normalised (the red line shows 50% of the maximum normalised value, and the purple circles indicate those development areas, which reached 50% of the maximum value at least in one of the criteria) impact scores weight, the number of projects and financial support of the development areas.
Urbansci 09 00092 g002
Table 1. Identified development areas with positive and negative impacts regarding climate change.
Development Areas
with Positive Impacts Regarding
Climate Change
with Negative Impacts Regarding Climate Change
Development of technologies for environmentally friendly use of manureIrrigation farming
Precision farmingDrainage
Small-farm developmentGreenfield investments
Sustainable agriculture
Drought-tolerant crop and livestock variety development
Afforestation
Rainwater collection and related water retention
Climate protection strategies
Awareness raising related to environmentally conscious lifestyles
Wetland restoration
Other nature conservation measures
Waste management
Urban green infrastructure development
Sustainable transport infrastructure development
Energy modernisation of buildings
Use of renewable energy sources
Corporate environmental development
Table 2. Assessment of the development areas with positive impacts regarding climate change.
Development AreasCriteria for the Assessment of the Impacts Related to Climate Change (Scores)
Reduces Greenhouse Gas Emission/Assists Absorption
(Mitigation)
(3 Points)
Reduces the Negative Impacts and Helps Adaptation
(Adaptation)
(2 Points)
Indirect Positive Impact Through Information Generation and Flow
(1 Point)
Development of technologies for environmentally friendly use of manurereduction in GHG emissions by replacing inorganic fertiliser and increasing soil carbon
Precision farmingreduction in GHG emissions by using fewer inorganic fertilisers research and development related to the development area
Small farm developmentreducing GHG emissions through renewable energy use and increasing energy efficiency
Sustainable agricultureincreasing CO2 absorption by soil and reducing GHG emissions by using fewer inorganic fertilisers promotion of composting
Drought-tolerant crop and livestock variety development less need for water (irrigation and drinking)research and development related to the development area
AfforestationCO2 absorption by treescooling the air
Rainwater collection and related water retentionCO2 absorption by watercooling the air and increasing soil water level
Climate protection strategies knowledge generation assists in the development of resilient settlements
Awareness raising related to environmentally conscious lifestyles raising public awareness
Wetland restorationCO2 absorption by wetlandscooling the airraising public awareness
Other nature conservation measuresCO2 absorption by other natural habitatscooling the airraising public awareness
Waste managementreducing GHG emissions by recycling and reuse; therefore, less waste is incinerated raising public awareness
Urban green infrastructure developmentCO2 absorption by green areas cooling the airraising public awareness
Sustainable transport infrastructure developmentreducing GHG emissions by developing cycling and walking paths and public transportation, which reduces the use of cars
Energy modernisation of buildingsreducing GHG emissions by increasing energy efficiency (e.g., through insulation reducing the use of non-renewable energy sources)
Use of renewable energy sourcesreducing GHG emissions by replacing non-renewable energy sources
Corporate environmental developmentreducing GHG emissions by environmental measures in companies (e.g., energy efficiency and use of renewable energy) supporting environmental awareness in companies
Table 3. Distribution of the projects by the main impact categories related to climate change in two financial periods.
Main Impact Categories Related to Climate Change2007–20132014–2020Total: 2007–2020
No. of
Projects
Financial
Support
(HUF Billion)
No. of
Projects
Financial
Support
(HUF Billion)
No of
Projects
Financial
Support
(HUF Billion)
positive impact363393891904254129
negative impact44877580761028153
neutral363021930,32048433,950702
Total444133434,79165039,232984
Table 4. The number of projects and the financial support related to the development areas in the two EU financial cycles.
Development AreasNumber of ProjectsFinancial Support (HUF Billion)
(2007–2013)(2014–2020)(2007–2020)(2007–2013)(2014–2020)(2007–2020)
Development areas with positive impacts regarding climate change3633891425438.7390.04128.77
Development of technologies for environmentally friendly use of manure1010.11-0.11
Precision farming121151271.589.0010.58
Small farm development1176317640.0027.277.27
Sustainable agriculture125815930.369.369.72
Drought-tolerant crop and livestock variety
development
649550.920.161.09
Afforestation0586586-3.163.16
Rainwater collection and related water retention98173.571.114.68
Climate protection
strategies
055-0.080.08
Awareness raising related to environmentally
conscious lifestyle
3470.020.300.32
Wetland restoration154193.012.155.16
Other nature conservation measures89173.510.864.37
Waste management201214.643.858.49
Urban green infrastructure development1016260.416.266.66
Sustainable transport infrastructure development6128898.326.3114.63
Energy modernisation of buildings571892465.2920.6225.91
Use of renewable energy sources1365236596.2018.7825.00
Corporate environmental development1210220.780.741.52
Development areas with negative impacts regarding climate change448580102877.1776.17153.33
Greenfield investments41049290271.3668.00139.37
Drainage3838765.805.1210.92
Irrigation farming05050-3.043.04
Developments neutral to climate change363030,32033,950218.59483.66702.25
Total:444134,79139,232334.49649.86984.35
Table 5. Total impact scores of the development areas and the average financial support of projects in the development areas.
Development AreasTotal Impact ScoreAverage Financial Support
(HUF Million/Project)
Wetland restoration6272
Other nature protection measures6257
Urban green infrastructure development6256
Afforestation55
Rainwater collection and related water retention5276
Sustainable agriculture416
Waste management4404
Corporate environmental development470
Precision farming483
Development of technologies for environmentally friendly use of manure3112
Small farm development34
Drought-tolerant crop and livestock variety development320
Sustainable transport infrastructure development3164
Energy modernisation of buildings3105
Use of renewable energy sources338
Climate protection strategies115
Awareness raising related to environmentally conscious lifestyles146
Disclaimer/Publisher’s Note: The statements, opinions and data contained in all publications are solely those of the individual author(s) and contributor(s) and not of MDPI and/or the editor(s). MDPI and/or the editor(s) disclaim responsibility for any injury to people or property resulting from any ideas, methods, instructions or products referred to in the content.

