Article

Social Network Analysis Reveals Spatiotemporal Patterns of Green Space Recreational Walking Between Workdays and Rest Days

1
School of Artificial Intelligence, Dongguan City University, Dongguan 523419, China
2
College of Architecture and Urban Planning, Tongji University, Shanghai 200092, China
*
Author to whom correspondence should be addressed.
Urban Sci. 2025, 9(4), 111; https://doi.org/10.3390/urbansci9040111
Submission received: 6 March 2025 / Revised: 26 March 2025 / Accepted: 28 March 2025 / Published: 4 April 2025
(This article belongs to the Special Issue Assessing Urban Ecological Environment Protection)

Abstract

:
Growing concerns about the negative impacts of high-density built environments on residents’ physical and mental health have made optimizing recreational walking networks in green spaces a crucial issue for improving urban public health service efficiency. While previous studies have largely focused on static accessibility measures, these methods cannot capture actual human recreational behaviors and temporal variations in green space usage. Our research introduces a novel social network analysis methodology using GPS trajectory data from Shanghai’s Inner Ring Area to construct and compare recreational walking networks during workdays and rest days, revealing dynamic spatiotemporal patterns that traditional methods miss. Key findings include: (1) At the node level, green spaces of different sizes play differentiated roles in the network, with large-scale spaces serving as destination hubs while pocket green spaces function as critical connecting points; (2) At the regional level, workday networks show more dispersed spatial distribution patterns with higher modularity, while rest day networks form high-density clusters in the central urban area; (3) At the overall network level, rest day networks demonstrate higher density and diversity, reflecting residents’ expanded spatial activity range and diverse recreational preferences. Green space management should focus on the social value of urban green networks. These findings provide theoretical and methodological support for transitioning from “static equity” to “dynamic justice” in green space system planning, contributing to the development of more inclusive and resilient urban green space networks.

1. Introduction

With global urbanization rates surpassing 56% and projected to reach 68% by 2050, there is growing concern about the negative impacts of high-density built environments on residents’ physical and mental health [1]. These impacts include increased risks of chronic diseases, mental health issues [2,3]. Urban green spaces help mitigate these negative effects by improving air quality [4], promoting physical activity, and reducing the risk of chronic diseases [5,6] but also improves mental well-being through interaction with natural environments [7,8]. In the post-pandemic era, recreational walking in green spaces has gradually been embraced by the public as an important means of daily self-therapy. As an important venue for recreational walking, urban green spaces (UGS) have become primary destinations or waypoints for such activities. The growing significance of recreational walking has fueled increasing interest in understanding and optimizing its spatial patterns, prompting many cities to reconsider the planning and design of UGS [9,10].
The equitable distribution of UGS is fundamental to promoting health benefits for all residents, with researchers employing various metrics to assess distribution patterns. Traditional evaluation methods have relied heavily on static indicators such as per capita green space provision [11], the Gini coefficient to measure distributional equity [12], and distance-based accessibility metrics [13,14,15]. While these approaches provide valuable insights into spatial distribution, they often fail to capture the spatial variations in how residents actually use green spaces. Rigolon et al. [16] integrated the three dimensions of environmental justice (distributive, procedural, and interactional) with environmental influences on recreational behavior, emphasizing that interactional justice—whether individuals experience perceptual or behavioral inequities when using green spaces—represents a critical yet often overlooked dimension.
Recreational walking constitutes a significant behavior in human-environment interactions, with walkability theories emerging as important frameworks for understanding human-centered urban design [17], guiding both two-dimensional urban form and three-dimensional perceptual design [18]. However, most scholars have focused on how built environment characteristics influence walking behavior [19,20], overlooking the dynamic nature of recreational activities themselves. For example, Schipperijn et al. [21] examined how internal green space features (such as vegetation coverage) affect walking patterns within parks. Such studies treat green spaces as isolated entities rather than as components of an interconnected system. While these studies provide valuable insights into specific aspects of recreational walking, they fail to capture the complex patterns of how people actually move between and utilize multiple green spaces in their daily activities. The spatiotemporal patterns of recreational walking between green spaces are considered more reflective of the flow value of ecosystem services [22], yet this remains a critical gap in our knowledge. Social Network Analysis (SNA), a methodological framework that examines the structure of relationships between discrete entities [23,24], offers a powerful approach for addressing these limitations. By treating spatial entities as nodes and their relationships as edges, SNA provides tools to quantify and visualize complex interconnections in urban systems. SNA has been more widely used in tourism research, with studies [25] employing it to explore tourist flows between attractions in Thailand. Song and Liu [26] analyzed changes in the network structure of leisure flows in urban green and blue spaces before and after the pandemic, based on over 3000 travel blogs collected from tourism websites. These applications demonstrate SNA’s potential for understanding complex spatial-behavioral patterns in urban settings. Crucially, SNA can reveal both direct and indirect relationships between green spaces, identifying patterns that conventional spatial analysis methods might miss [27]. This approach addresses limitations in both environmental justice research and walkability studies by bridging the gap between static distribution analyses and dynamic behavioral patterns. It allows researchers to understand dynamically how urban spaces function as interconnected networks rather than as isolated elements.
To address the aforementioned research gaps, this study constructs recreational walking networks (RWN) based on actual trajectory data to reflect the dynamic usage patterns of urban green space systems. We selected Shanghai’s Outer Ring Area as our study region, as Shanghai represents a rapidly developing high-density city, with the area within the Outer Ring constituting its main built-up area. This area represents an ideal case study due to its high population density, limited per capita green space, and uneven distribution of recreational resources, providing an ideal context for examining the complex spatiotemporal interactions between residents and green spaces. Many studies [28,29,30] have used this area as their research region to explore urban green space-related issues. The research objectives are threefold: (a) to construct and analyze RWN of green spaces within Shanghai’s Outer Ring Area, developing a comprehensive methodology for network analysis of urban green spaces; (b) to compare network characteristics between workdays and rest days, providing insights into temporal variations in green space usage patterns; and (c) to examine connectivity characteristics of RWN at three spatial scales: individual nodes, community subgroups, and overall network level, offering a multi-scalar understanding of green space interactions. While the findings of this study have a specific context, the proposed analytical framework can be generalized as a guiding methodology for optimizing green space systems in different urban contexts, emphasizing human-centered, dynamic, and justice-oriented approaches to urban green space planning.

2. Materials and Methods

2.1. Study Area

The Shanghai Outer Ring area is defined as Shanghai’s central urban district, enclosed by the Outer Ring Elevated Highway. It covers approximately 664 km2 and comprises Huangpu, Xuhui, Changning, Jing’an, Putuo, Hongkou, Yangpu, as well as portions of Pudong Area, Minhang, Baoshan, and Jiading (Figure 1). This area exhibits a highly active economy and is characterized by a pressing demand for green space services that support physical activities. Given the critical need for evenly distributed and broadly accessible green spaces attractive to urban residents, the Shanghai Outer Ring Area represents a significant context for green space network analysis.

2.2. Research Data

2.2.1. Green Space Data

Green space data were obtained from OpenStreetMap [31]. Guided by the “Park Green Space” category in the Urban Green Space Classification Standard (CJJ/T 85-2017) [32] the OpenStreetMap dataset was filtered to exclude non-free-admission green spaces such as Yuyuan Garden, zoos, and botanical gardens. Additionally, to ensure that the selected spaces could adequately support recreational walking, any green spaces smaller than 2000 m2 were removed [33]. As a result, 291 green spaces remained in the study area: 64 large green spaces (>5 ha), 186 community green spaces (1–5 ha), and 41 pocket green spaces (<1 ha).

2.2.2. Trajectory Data

The recreational walking trajectory data was sourced from “2bulu”, one of China’s most popular outdoor activity applications, with over 10 million registered users and 6 million shared trajectories. The application requires users to actively select their activity type (e.g., walking, running, cycling, hiking) before starting outdoor activities, enhancing data reliability through this user-initiated activity labeling approach. Notably, these trajectory data contain precise GPS information and are voluntarily shared by users for public access, excluding private personal information. This enables objective representation of residents’ activity patterns, distribution, and movement characteristics [34]. Numerous scholars [27,35,36] have utilized these data to study recreational activity patterns in natural and built environments, validating their reliability.
To ensure representative sampling, trajectory data were collected across four seasons (April, July, October 2024, and January 2025). For each month, the first five rain-free workdays and holidays were selected [37], totaling 40 days, to effectively capture normalized recreational walking behavior. To maintain data quality, the trajectory data underwent cleaning procedures to remove anomalies such as location drift, duplicate uploads, abnormal speeds, and excessive trajectory lengths [27,33]. The final dataset comprised 7887 valid recreational walking trajectories, consisting of 3313 workday and 4574 holiday trajectories.

2.3. Research Methods

This study constructs urban green space recreational networks by treating recreational walking trajectories as “edges” and urban green spaces as “nodes”. The UGS network, based on population activity connections, essentially represents spatial patterns of how residents conduct recreational walks between different green spaces, facilitating understanding of residents’ activity behaviors and preferences. SNA enables simultaneous examination of network connectivity characteristics across multiple scales, including node, subgroup, and overall network levels [27]. (a) At the green space node scale, centrality metrics (degree centrality and closeness centrality) are calculated to identify key nodes within the network. These nodes reflect the role of individual green spaces within the overall system and reveal spatial patterns of recreational flows [27,33]. (b) At the regional subgroup scale, community detection algorithms are employed to investigate spatial variations in green space service distribution and identify potential service imbalances [38]. (c) At the overall network scale, network density and homophily indices are used to evaluate the connectivity and diversity of recreational flows [39]. At these three scales, UGS network characteristics are compared between workdays and holidays to examine differences in recreational flow spatial patterns, providing new insights for refined UGS planning (Figure 2).

2.3.1. Node Importance in RWN

Centrality analysis is utilized to measure node importance and influence within the recreational flow network. Common centrality metrics include degree centrality and closeness centrality. Of these, (a) degree centrality reflects green space attractiveness, where higher degree centrality indicates that a green space is traversed by more trajectories, identifying it as a key node in recreational flows [27,33]. (b) Closeness centrality measures the average path distance between green space nodes, where higher closeness centrality indicates better accessibility within the overall network, suggesting the green space serves a local recreational function and potentially acts as an intermediate point [40]. These metrics are implemented using the centrality algorithms in the NetworkX package (version 3.4.2) [41]. Formulas and corresponding descriptions are provided in Table 1.

2.3.2. Regional Differences in RWN

Regional difference analysis employs community detection, a network clustering method, to reveal internal connectivity patterns of recreational flow networks by identifying secondary group structures [38]. In green space recreational networks, community structures reflect spatial organization characteristics of human flow activities: communities exhibit frequent internal recreational flow interactions while connections between different communities are relatively sparse. The total number of communities indicates the degree of spatial differentiation in the urban green space system, where a higher number of communities suggests more pronounced spatial fragmentation characteristics. The structural evaluation of community divisions is primarily assessed through modularity metrics. Higher modularity values indicate that the green space recreational walking network exhibits distinct community characteristics, with tight internal connections and loose inter-community connections. When modularity values exceed 0.5, the network can be considered to have significant regional differences and activity isolation [42], manifested as limited human flow interactions between different communities and displaying clear spatial segregation characteristics. Community detection is implemented using the louvain_communities algorithm in the NetworkX [41].

2.3.3. Overall Characteristics of RWN

Network density and homophily indices are employed to evaluate structural stability and connectivity patterns. Network density reflects network cohesion, calculated as the ratio of actual connections to possible connections in the network [43]. High density indicates more frequent and widespread connections between green spaces, offering broader choices of recreational walking routes. Conversely, low density suggests sparse connections, where a few key green spaces may become primary destinations. Low network density might indicate higher sensitivity to the loss of certain nodes or connections—if some nodes are removed (e.g., green space renovation) or connections fail (e.g., road maintenance), the entire network’s functionality might be compromised. Network density is calculated using the density algorithm in the NetworkX.
The homophily index measures the degree to which nodes with similar attributes are connected within the network [39]. This study analyzes homophily based on different green space hierarchies (large-scale, community, and pocket green spaces). A lower homophily index indicates that different types of green spaces play important roles in recreational activities, while higher network homophily suggests weaker associations between green spaces of different scales. High homophily indices may indicate that differentiated services and facilities provided by green spaces of various scales are underutilized, potentially limiting the overall ecological benefits of the green space system. The homophily index is calculated using the homophily_index algorithm in the NetworkX.

3. Results

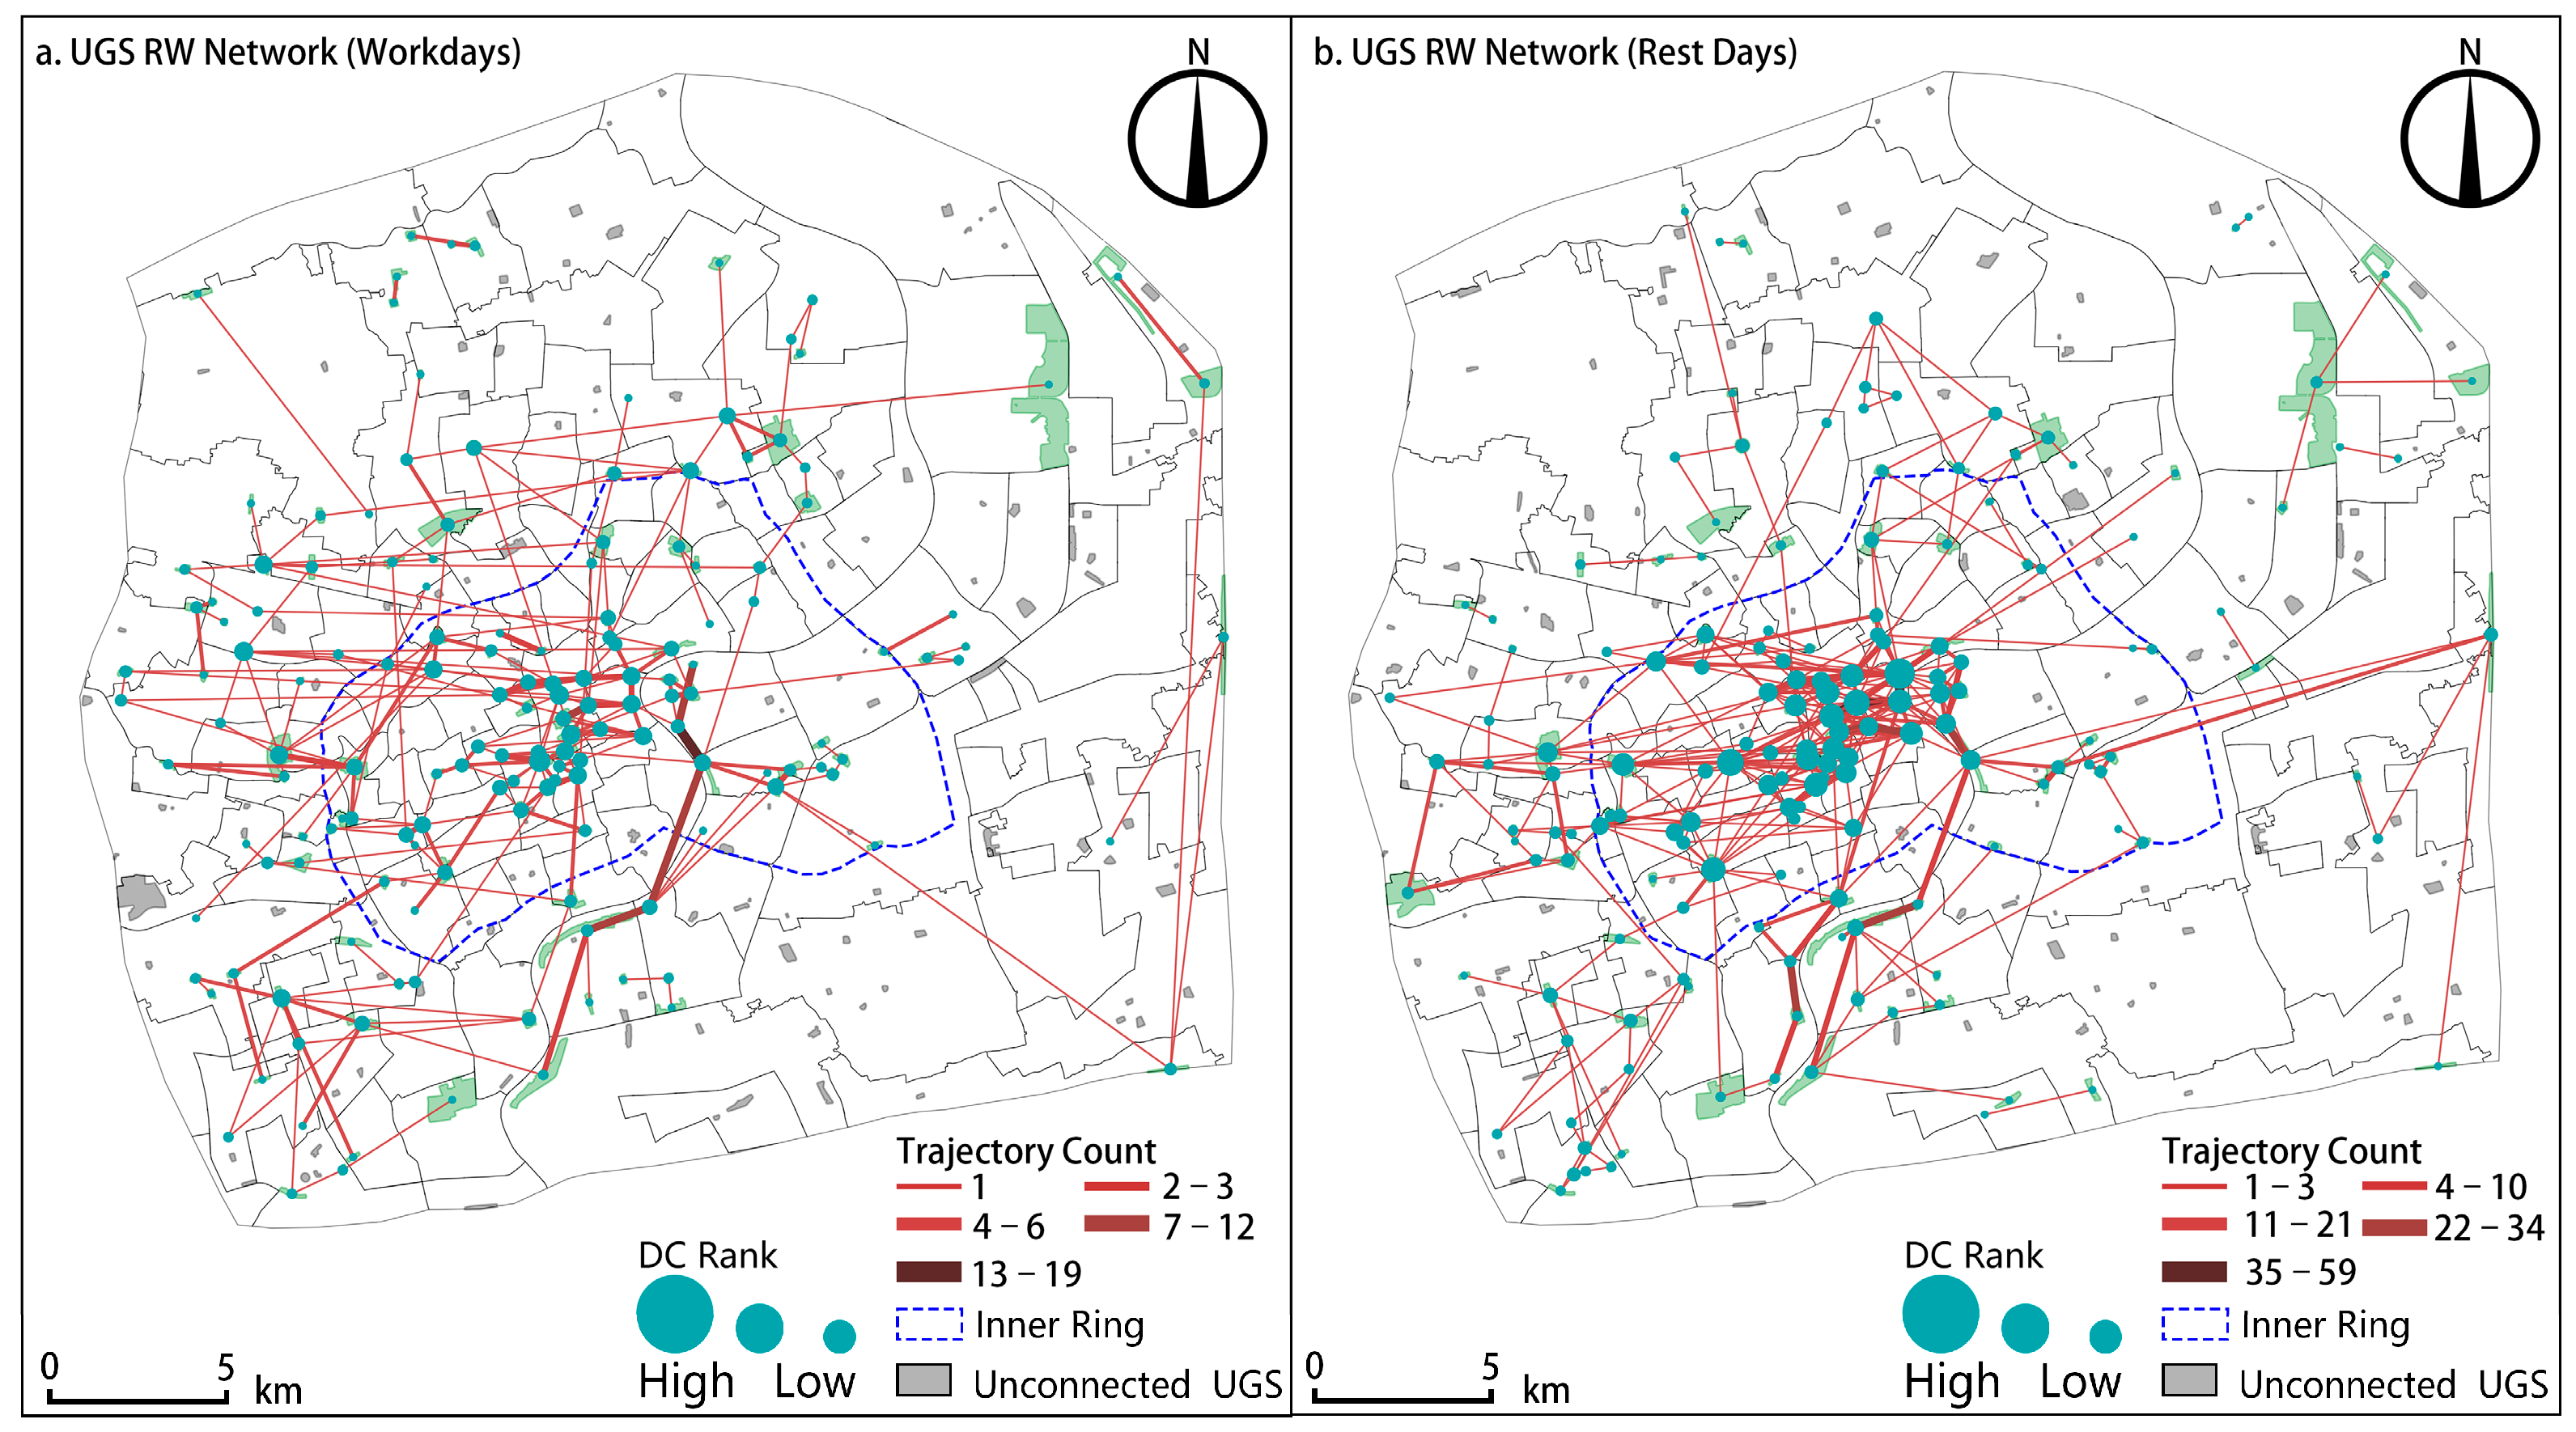
Network node construction results (Figure 3) show that among the 291 green spaces, 157 were connected by recreational walking trajectories on workdays, while 163 were connected on rest days. Regarding node distribution, rest days exhibited distinct high centrality clusters in the central urban area, while workdays showed more distribution on the western side of the study area. Isolated green spaces not incorporated into the recreational walking network were predominantly distributed outside the Inner Ring Road, particularly in the eastern, southern, and northern regions of the Outer Ring area.
Edge construction results revealed distinct temporal patterns. On workdays (Figure 3a), despite fewer trajectories, their distribution was more widespread, reflecting lower intensity but more dispersed green space usage patterns. On rest days (Figure 3b), the higher number of trajectories showed a more concentrated distribution with pronounced center-periphery characteristics, while workdays displayed more local small-scale connections, likely reflecting residents’ preference for nearby recreational activities. The holiday network formed distinct high-density clusters in the urban center with more complex and diverse connections, while the workday network displayed a more dispersed structure. This pattern reflects people’s tendency to converge on the central urban area for recreational activities during holidays. High-level edges in both workday and rest day networks were concentrated in the city center and along the Soochow Creek-Huangpu River waterfront. However, workday networks contained more low-level edges, indicating looser connection intensity. This difference suggests significantly increased usage of certain key paths during holidays. Edge areas showed weak connectivity in both periods, indicating a need to optimize peripheral green space connectivity and reduce isolation phenomena.

3.1. Node Importance Characteristics

Analysis of recreational walking network (RWN) centrality metrics reveals distinct spatiotemporal patterns in how urban green spaces (UGS) function within the overall system (Table 2). Across all UGS typologies, centrality values demonstrate systematic temporal variation, with both degree and closeness centrality metrics consistently higher during rest days compared to workdays. This temporal differentiation reflects fundamental shifts in recreational behavior patterns—during rest days, users engage in more extensive spatial activity, forming longer recreational circuits that connect multiple green spaces, while workday usage exhibits more localized, proximity-oriented patterns characterized by shorter paths between fewer destinations.
Examining the roles of different types of green spaces, large-scale green spaces exhibit the highest average degree centrality on rest days (0.0305), though their average degree centrality decreases to 0.0233 on workdays, they maintain relatively high connectivity. This suggests that large-scale green spaces serve as primary destinations for recreational activities regardless of temporal variations, although their attractiveness is more pronounced during rest days. Community green spaces exhibit lower average degree centrality on rest days, with a high proportion (54.2%) of low degree centrality, suggesting weaker connectivity during rest days. This unexpected pattern might reflect residents’ preference for larger, more amenity-rich spaces during their leisure time, potentially overlooking nearby community spaces. Surprisingly, pocket green spaces maintain the highest average closeness centrality among all three UGS types on both workdays (0.1702) and rest days (0.1787), indicating they function as critical intermediate nodes or “stepping stones” in the network. While their limited size and facilities constrain their capacity as primary destinations (reflected in moderate degree centrality), their strategic positioning within residential and employment areas minimizes average path distances between network components, thereby enhancing overall system connectivity and traversability. Their consistent performance across temporal contexts demonstrates their structural importance in maintaining network cohesion regardless of usage intensity variations.
These findings reveal a complementary hierarchical structure in the urban green space network: large-scale green spaces function as destination hubs with high attractiveness, community green spaces provide baseline recreational support with context-dependent importance, and pocket green spaces serve as critical connective elements enhancing network efficiency. This specialized differentiation in network functionality suggests that effective urban green space planning should transcend conventional size-based hierarchies to consider the systemic role each space type plays in sustaining recreational activity flows across varying temporal contexts.

3.2. Regional Differentiation Characteristics

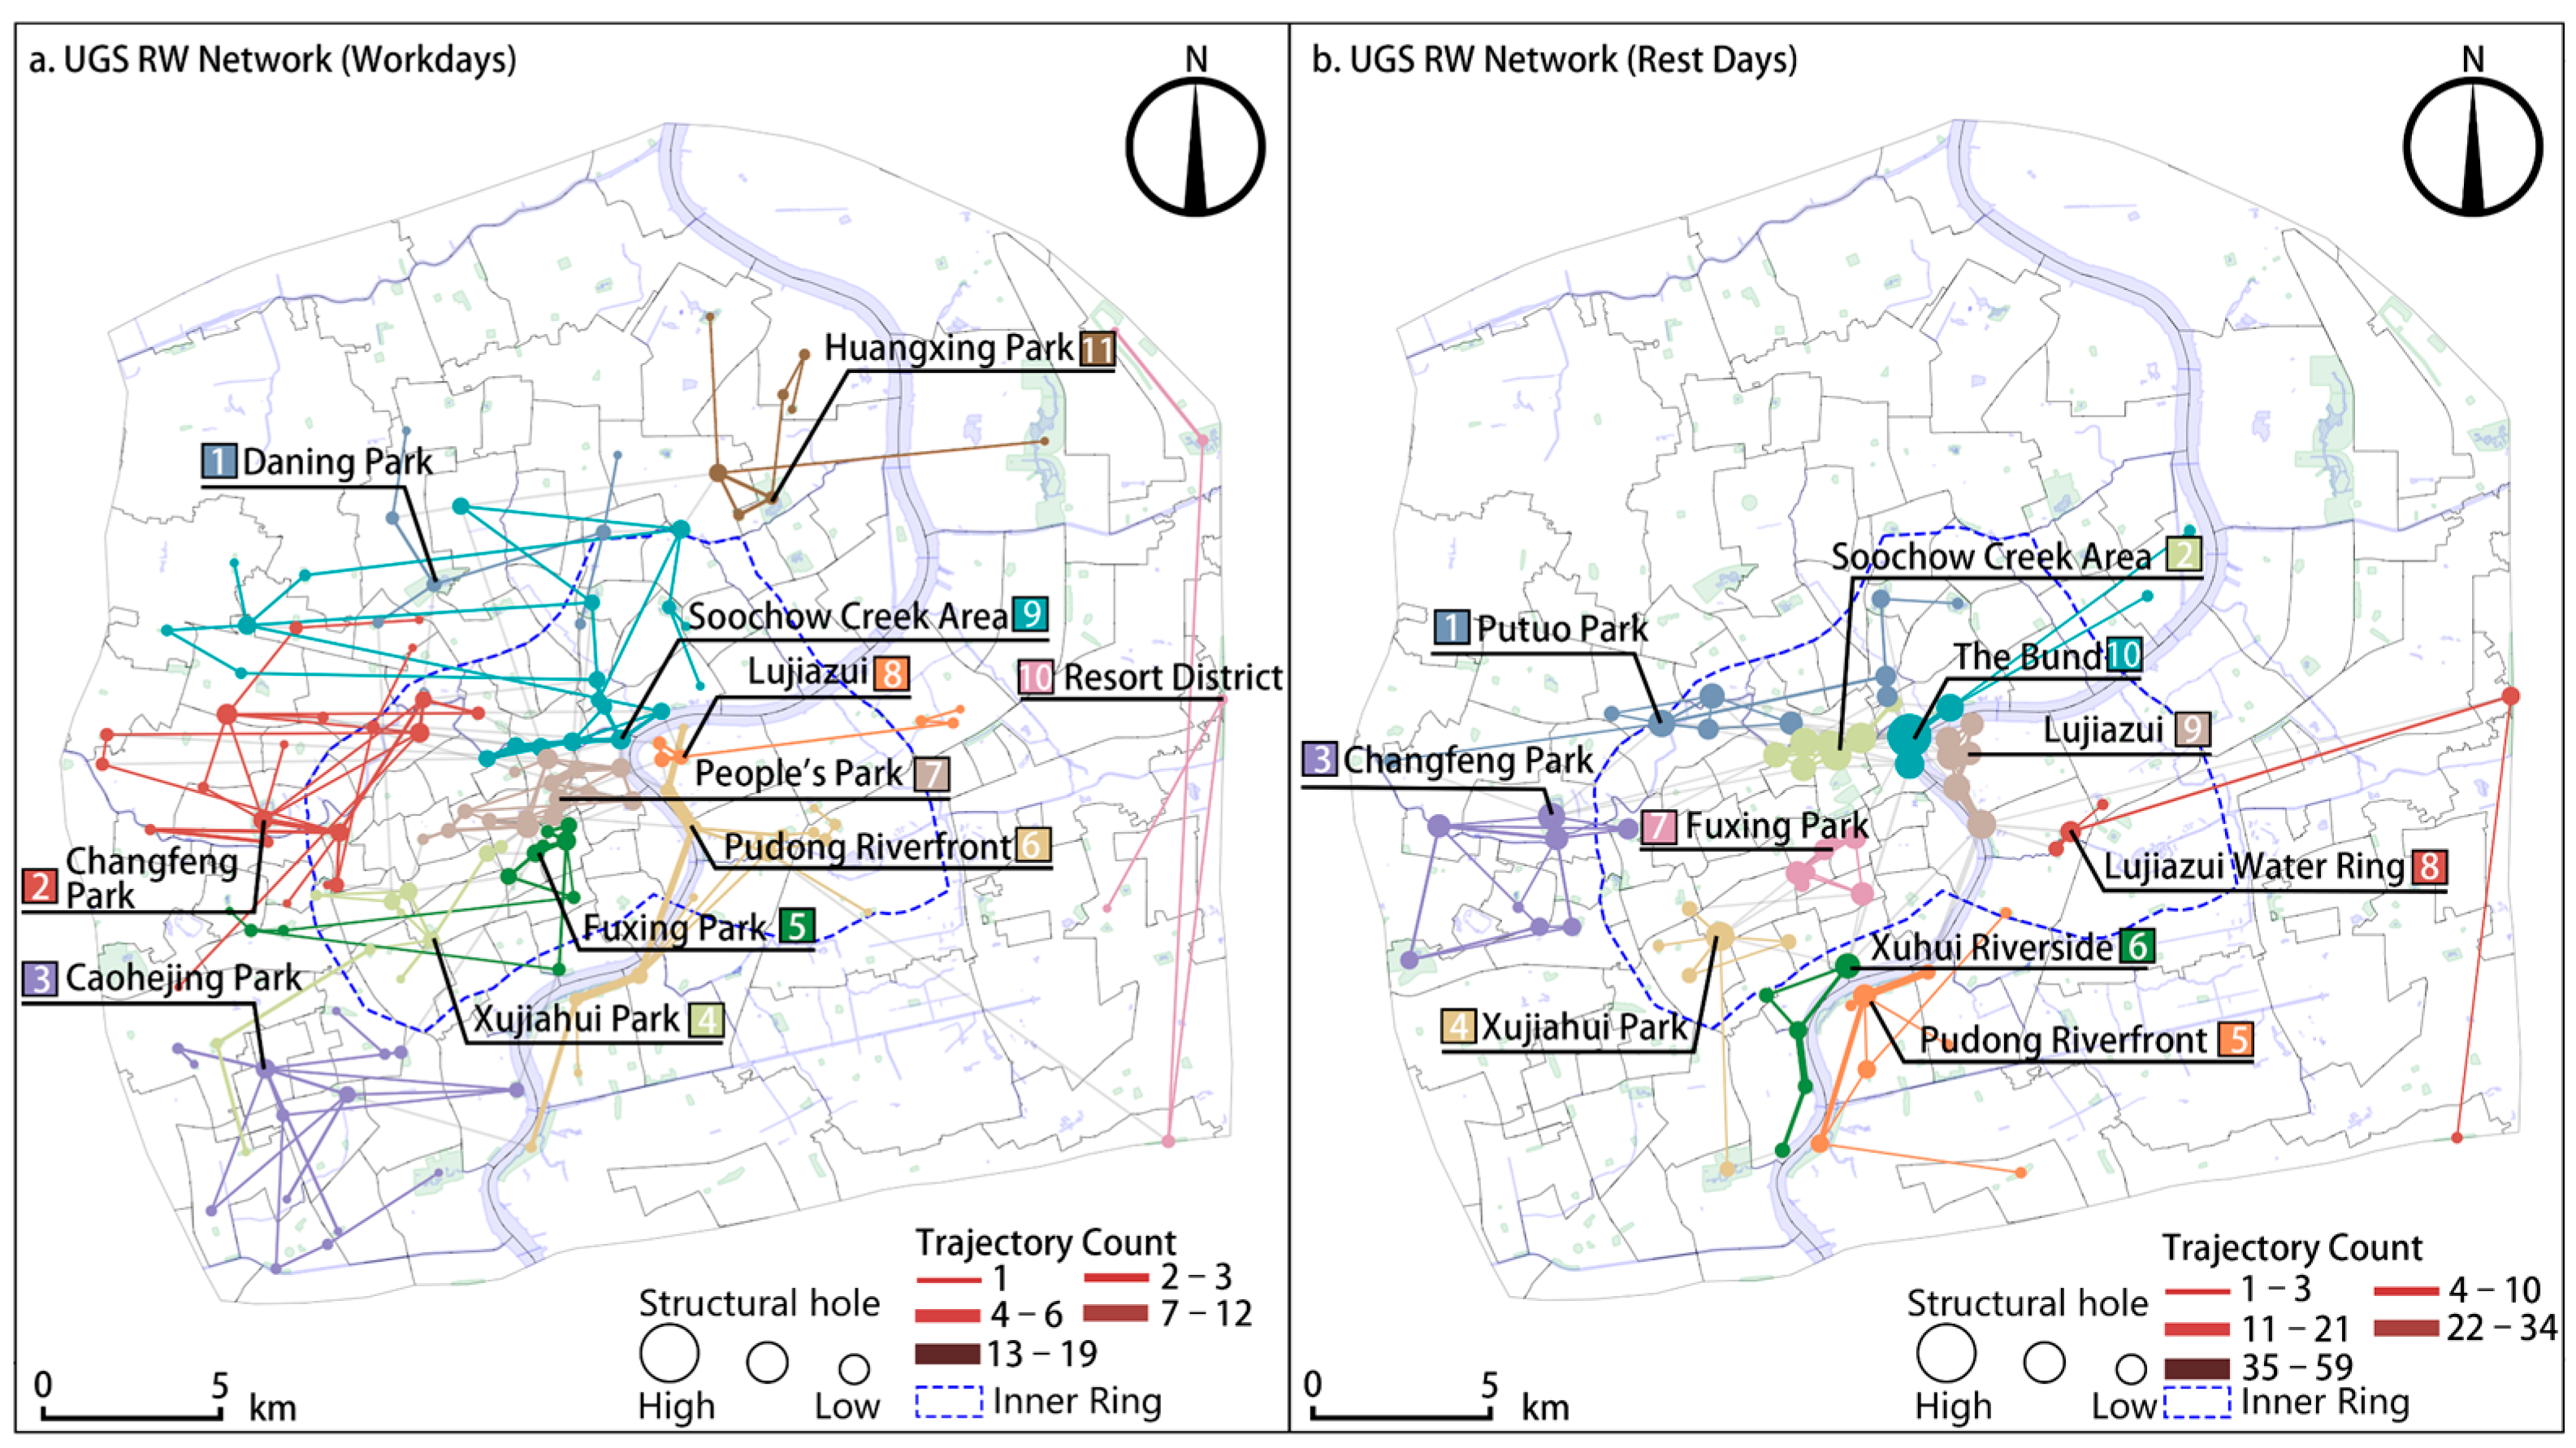
The community detection algorithm identified 11 subgroups in the workday recreational network and 10 subgroups in the rest day network for green spaces in the Outer Ring area (Figure 4). Notably, workday subgroups showed higher modularity (0.73) compared to rest day subgroups (0.65), indicating tighter internal connections within workday subgroups, sparser inter-subgroup connections, and relatively independent subgroups with fewer cross-subgroup activities compared to rest days.
The Huangpu River presents a clear isolation effect, with no cross-river subgroups appearing on either workdays or rest days. Workday subgroups exhibit dispersed spatial distribution with larger community sizes, displaying polycentric characteristics. In contrast, rest day subgroups are more concentrated within the Inner Ring, indicating more centralized recreational destinations and higher green space centrality during rest days. For example, the Pudong riverfront subgroup on workdays (Subgroup 6 in Figure 4a) shows more extended routes, while the rest day Pudong riverfront subgroup (Subgroup 5 in Figure 4b) is primarily formed around one or two core riverfront green spaces. Similarly, the Soochow Creek area also demonstrates this concentration pattern, with its rest day subgroup (Subgroup 2 in Figure 4b) showing more centralized clustering compared to its workday counterpart (Subgroup 9 in Figure 4a). These patterns indicate that residents prefer core green spaces with superior landscape design, waterfront views, and recreational amenities during rest days. This temporal variation reflects the dynamic nature of green space service functions: workdays primarily serve convenience functions, while rest days emphasize recreational experiences in key green spaces. This finding has important implications for green space system planning, highlighting the need to ensure convenient community-scale services while enhancing service quality in key areas to accommodate differentiated needs across different periods.

3.3. Overall Network Characteristics

As shown in Table 3, analysis of overall network characteristics reveals distinct patterns between workdays and rest days. A notable observation is that the overall network densities are substantially lower than community-level densities, indicating strong internal connections within communities but weak connections between different communities. This significant disparity suggests severe spatial isolation between communities, resulting in insufficient overall network connectivity. The overall network density on rest days is higher than on workdays, indicating more frequent city-wide connections during rest days. This temporal variation in network density reflects different recreational behavioral patterns, with rest days characterized by longer-distance travel and more diverse destination choices. The overall network homophily index shows similar values between workdays and rest days, with rest days displaying slightly higher homophily, possibly indicating increased consideration of large-scale green spaces during rest days. However, the relatively low homophily indices for both periods suggest that all types of green spaces play significant recreational support roles. Notably, Community 6 exhibits extremely low homophily during rest days, indicating highly mixed usage of different types of green spaces within this community. This pattern aligns with community-level observations, where individual communities also demonstrate higher internal density on rest days. Rest day subgroup clusters tend to be more compact, with green spaces readily forming high-density subgroups. For instance, Communities 9, 2, and 6, centered around core green spaces in Lujiazui, Nanjing West Road, and Xuhui Waterfront areas, function as popular urban recreational zones that attract substantial cross-district visitors on rest days, resulting in higher network density. These high-density clusters often correlate with areas featuring diverse recreational amenities and high-quality public spaces, suggesting the importance of comprehensive environmental design in promoting recreational activities.
The overall network homophily index (Table 3) shows similar values between workdays and rest days, with rest days displaying slightly higher homophily, possibly indicating increased consideration of large-scale green spaces during rest days. This moderate homophily level suggests a balanced usage pattern where green spaces of different scales complement each other in supporting recreational activities. The temporal stability of homophily indices indicates that the hierarchical structure of green space usage remains relatively consistent despite varying activity intensities between workdays and rest days. However, the relatively low homophily indices for both periods suggest that all types of green spaces play significant recreational support roles, highlighting the importance of maintaining diverse green space types within the urban fabric. Notably, Community 6 exhibits extremely low homophily during rest days, indicating highly mixed usage of different types of green spaces within this community. This exceptional case demonstrates how well-integrated green space systems can promote diverse recreational patterns and enhance network resilience.
These findings have important implications for urban green space planning and management. The disparity between overall and community-level network densities suggests the need for strengthening inter-community connections, possibly through strategic placement of new green spaces or enhancement of existing connecting corridors. The temporal variations in network characteristics indicate the importance of flexible management strategies that can accommodate different usage patterns between workdays and rest days. Furthermore, the balanced homophily indices support the value of maintaining diverse green space hierarchies in urban areas.

4. Discussion

This study reveals significant differences in RWNs of UGS between workdays and rest days in Shanghai’s Outer Ring Area. Higher network density and centrality metrics on rest days indicate more frequent recreational activities in key green spaces. The emergence of concentrated high-density clusters in the central urban area during rest days reflects the “magnet effect” of iconic green spaces such as waterfront areas [44]. Interestingly, we found that recreational walking exhibits broader spatial coverage on workdays, with dispersed patterns and local connections emphasizing the role of regional green spaces in meeting residents’ daily recreational needs, supporting the “15-min city” concept.

4.1. Persistent Structural Characteristics in Combined Temporal Networks

4.1.1. Node Connectivity Analysis

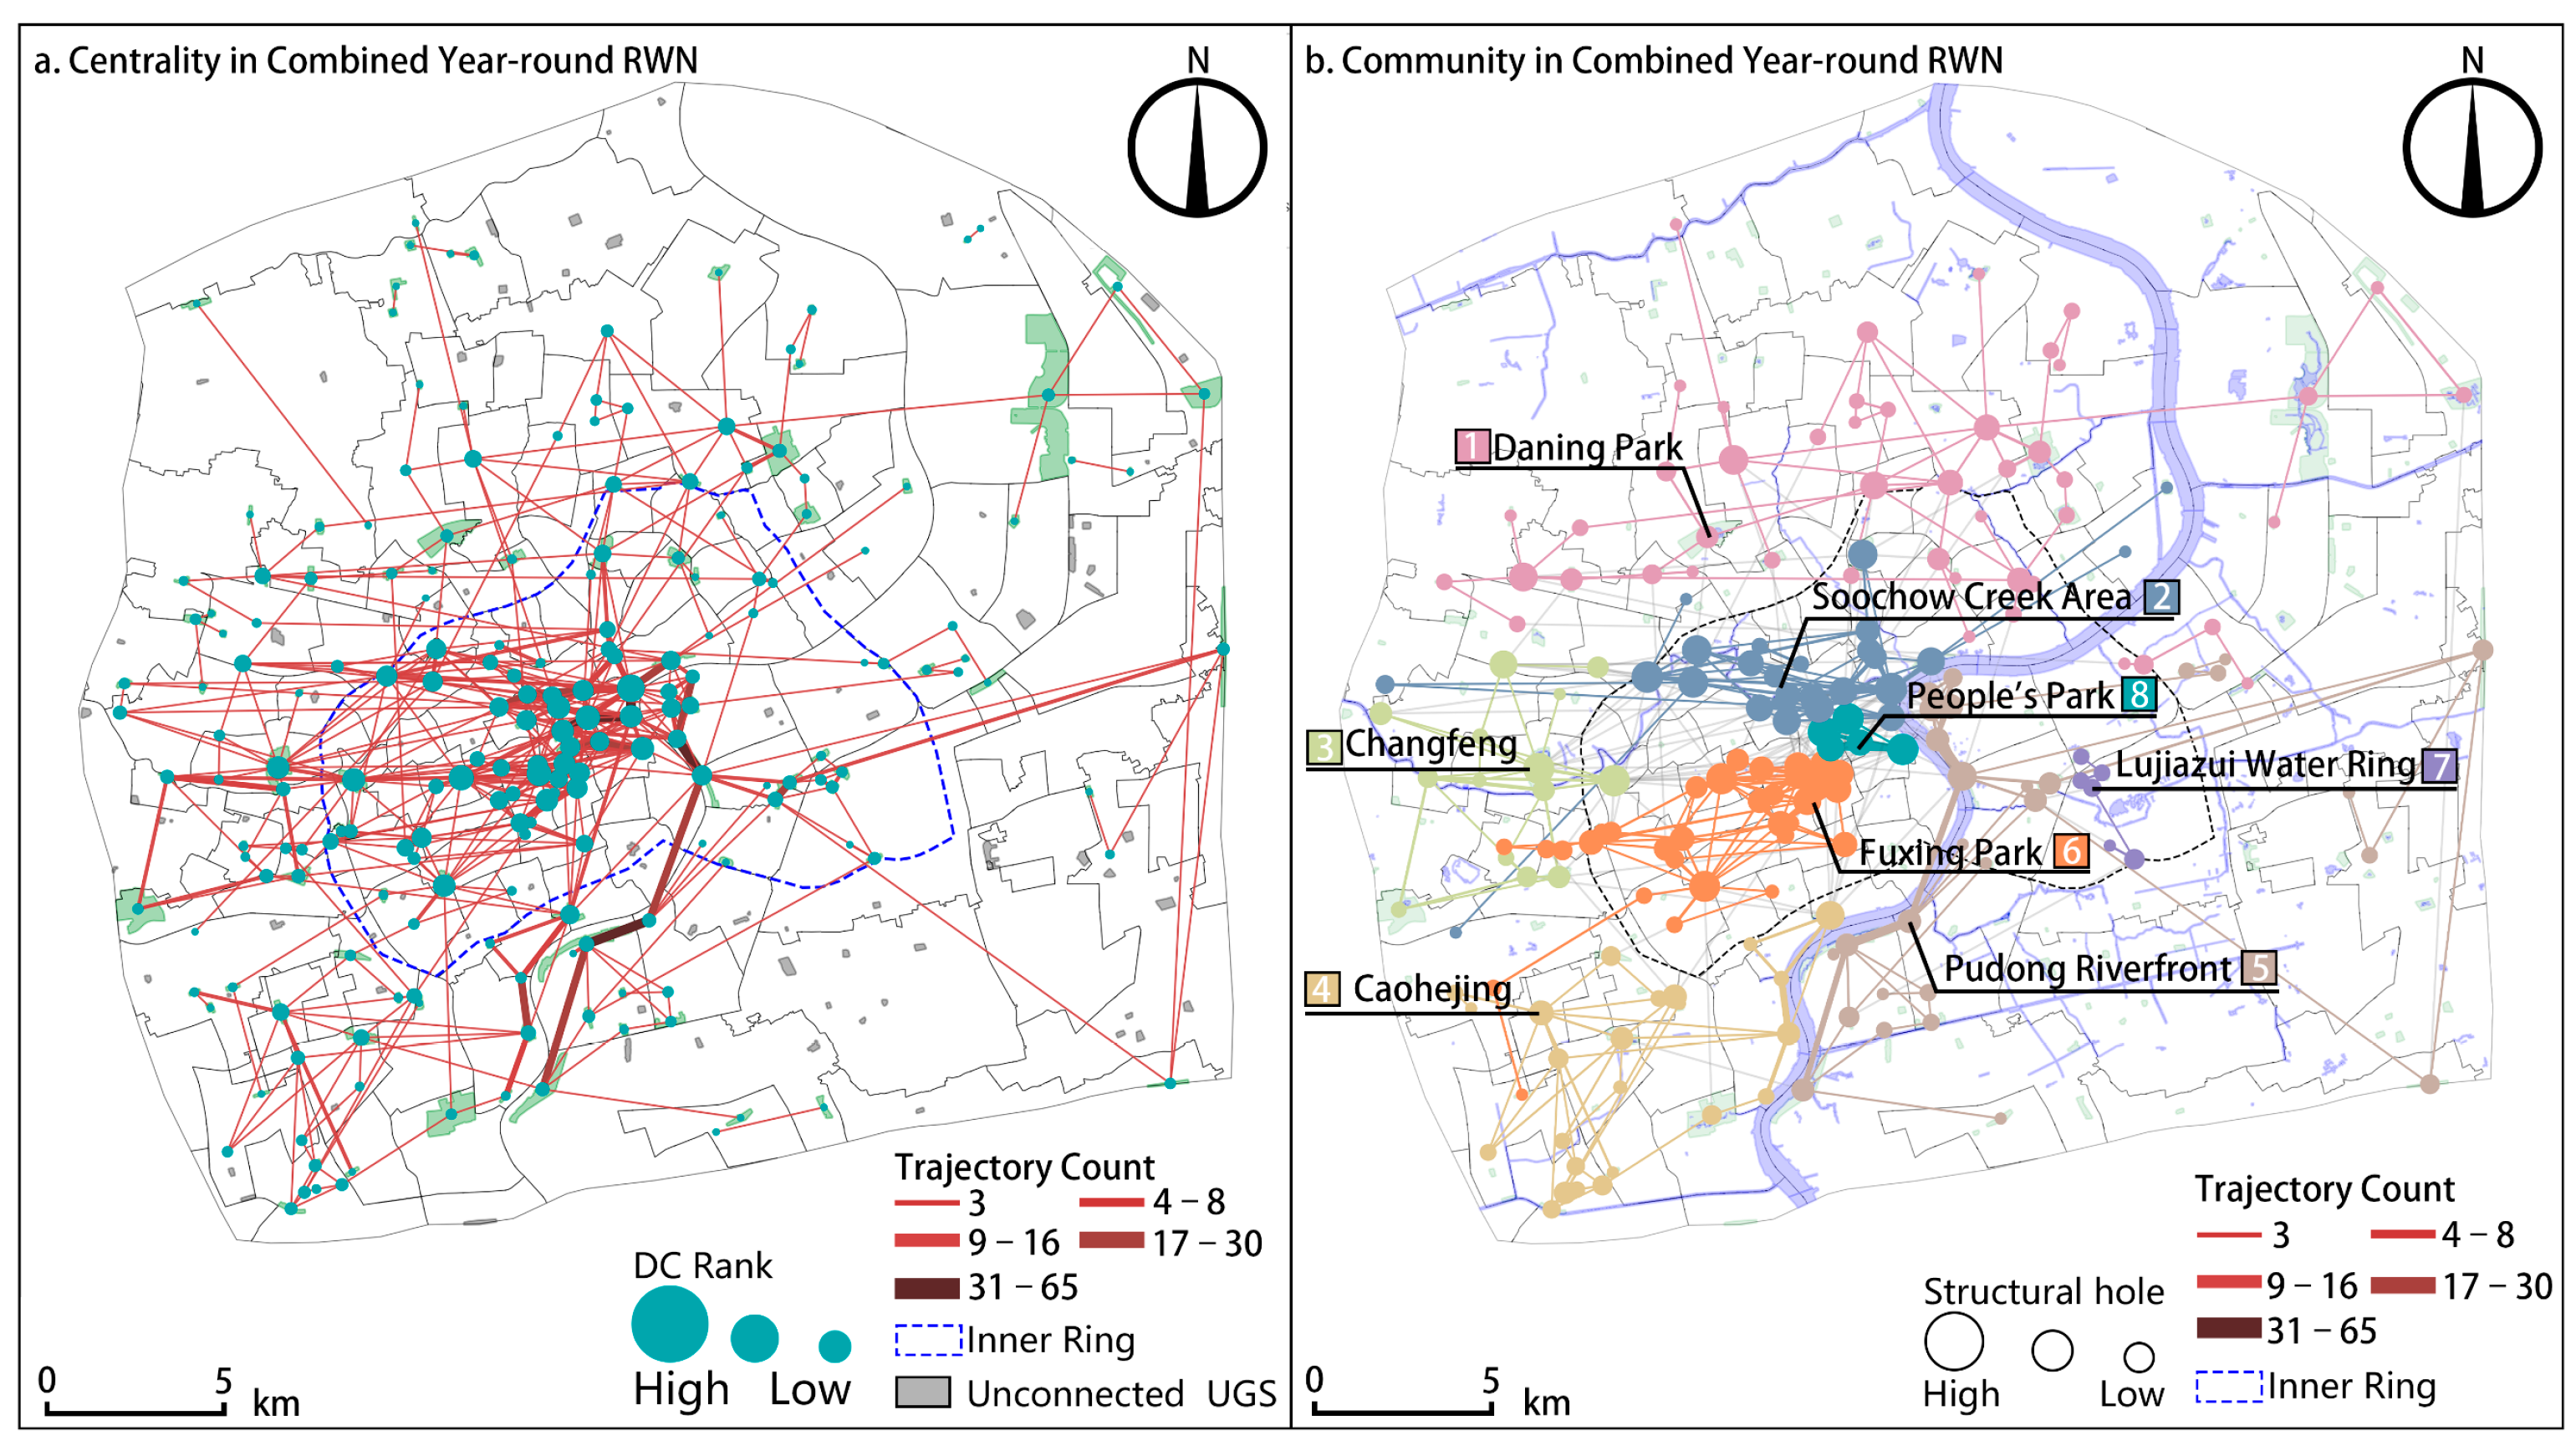
The merged network contains 199 green spaces, significantly higher than in individual periods (Figure 5a). This indicates that some green spaces serve different functions on workdays and rest days, with certain spaces being used only during specific periods. This temporal variation in usage patterns aligns with previous findings on workday-weekend activity space selection characteristics [45,46]. However, 92 green spaces remain unused during both periods, with these “persistently unused” spaces primarily distributed along the study area’s periphery. This distribution pattern reflects inequities in the spatial distribution of urban green space systems [12,47]. Regarding centrality, high-centrality nodes are predominantly concentrated in the core area within the Inner Ring, a pattern that becomes more pronounced in the merged network. The merged network exhibits a clearer “core-periphery” structure, consistent with central place theory in urban spatial structure, while also suggesting inadequate public service facility configuration in peripheral areas.

4.1.2. Community Structure Characteristics

The merged network forms 8 communities (Figure 5b), notably fewer than on rest days and workdays, indicating that previously independent communities have been integrated in the cross-temporal analysis, revealing spatiotemporal overlap in urban green space usage. However, the modularity of 0.65 still indicates significant isolation between community subgroups. This isolation differs from temporary period-specific isolation, instead reflecting deeper spatial barriers. Based on structural hole positions and remote sensing image analysis, these persistent isolations are closely related to urban physical barriers (such as major transportation corridors, industrial land) and social barriers (such as gated high-end communities, facility access restrictions). This finding demonstrates that recreational walking trajectories can precisely characterize actual green space isolation, supporting refined urban green space justice research. Furthermore, community sizes vary significantly, revealing a distinct center-periphery pattern in recreational space utilization. The largest community (Community 6) contains 50 nodes, accounting for 25.1% of connected nodes and located in peripheral areas, while the smallest communities (3 and 8) contain only 5–6 nodes, situated in the core areas of Pudong and Puxi respectively. This spatial organization aligns with the Size-Density Rule [13], which suggests that people tend to concentrate their recreational activities in fewer high-quality green spaces in core areas while displaying more dispersed usage patterns in peripheral zones.

4.1.3. Overall Characteristics

The overall network density (0.0360) is substantially lower than internal community densities, indicating weak inter-community connections (Table 4). This “internally cohesive, externally loose” network structure enhances local accessibility but may limit broader recreational opportunities, contrasting with New Urbanism’s principles of openness and connectivity. The smallest community (8) achieves complete connectivity (density 1.0000), demonstrating an example of a compact USG network. This suggests that large-scale planning should focus on establishing multi-level, networked green space systems, enhancing overall system efficiency through optimized spatial layout and connections. The homophily index of 0.4068 indicates a moderate level of mixed usage patterns, supporting diverse user needs and aligning with inclusive urban development concepts.

4.2. New Perspectives on Green Space Network Analysis Based on Real Connections

4.2.1. From Ecological Networks to “Human-Centric Networks”

While urban green space networks have long been a focus of planning and design disciplines, traditional ecological networks based on landscape morphological structure (patch-corridor-matrix) primarily emphasize patch connectivity to ensure ecological functions [48,49]. Since the influential work of Forman and Godron [50], this approach has dominated ecological planning and has been widely applied in urban contexts [51,52]. However, as Wendel et al. [53] have pointed out, neglecting human behavioral needs and user experience can result in “unused green space” [54]. This study responds to human-centric planning principles by constructing green space social networks based on “real connectivity”, which aligns with Gibson’s [55] affordance theory in landscape perception by capturing actual movement patterns rather than just visual preferences or stated behaviors.

4.2.2. From “Static Green Space Equity” to “Dynamic Green Space Justice”

Traditional research typically evaluates green space equity from an accessibility perspective [56,57]. However, such static spatial distance measurements fail to reflect actual usage patterns and the differentiated roles of various green spaces in supporting physical activities. This limitation has been acknowledged by researchers including Nesbitt et al. [56], who called for more dynamic approaches to equity assessment, but methodological approaches have remained limited.
Our study conducts network analysis based on recreational walking trajectories during workdays and rest days, considering not only green space accessibility but also residents’ active choices regarding green space service functions. This approach responds to Sister et al.’s [58] call for methods that incorporate actual usage in equity assessments. For example, the area containing Subgroup 3 on workdays (Figure 3a) does not form a subgroup on rest days, indicating a lack of high-quality UGS to attract holiday visitors for recreation. This paradigm shift from “static equity” to “dynamic justice” deepens our understanding of the interaction between human behavior and spatial configuration, providing new theoretical frameworks and methodological support for green space justice research. This research extends Rigolon et al.’s [16] three dimensions of environmental justice, particularly the concept of interactional justice.

4.3. Network Characteristics and Optimization Strategies

4.3.1. Differentiated Functional Positioning: Planning Strategies Based on Node Centrality

The research findings reveal complementary roles of different-sized green spaces in supporting recreational walking networks. Large-scale green spaces maintain high degree centrality on both rest days and workdays, confirming their status as core network nodes. This pattern supports previous research on attraction radii of large parks [59], but extends their work by quantifying network position rather than just usage frequency. Notably, pocket green spaces exhibit high closeness centrality, indicating their significant role in enhancing local accessibility. This finding challenges the “bigger is better” [60] that emphasizes park size as the primary determinant of usage, and instead supports theories on flexible arrangement of small green spaces to enrich ecosystem cultural services [61]. Based on these differentiated characteristics, we propose a hierarchical planning strategy. Low-centrality nodes should strengthen neighborhood service functions and improve infrastructure to meet daily fitness needs. Medium-centrality nodes should function as regional activity transit hubs, optimizing exercise experiences for residents. High-centrality nodes require enhanced greenway systems and station facilities to create spaces supporting various exercise intensities. This usage-based planning approach departs from traditional strategies that rely on green space size or construction hierarchy, thereby enabling design decisions that more accurately reflect actual demand. This concept aligns with people-centered planning theories [62] and flexible green space arrangement strategies [63]. Time-based management strategies have been mentioned in several studies [63,64], but rarely supported by empirical data. Furthermore, our research findings are already being reflected in Shanghai’s management practices, which has designated some community green spaces to operate 24 h a day, aligning well with weekday recreational usage patterns.

4.3.2. Reducing Spatial Isolation: Planning Strategies Based on Community Detection

SNA identified community subgroup isolation, revealing diverse causal factors: (a) Physical barriers, such as rivers and elevated highways, constitute two major obstacles to recreational walking. These barriers exemplify Lynch’s [65] concept of “edges”—linear elements functioning as boundaries between areas that potentially disrupt the continuity of urban experience. Transportation and water barriers documented in many global cities [66] create divisions not only in physical environment and spatial structure but also in human activity and social connections [67] (b) Structural homogeneity. Our research found certain areas lack comprehensive green space typologies and diverse greenway connections, with some long-distance trajectories demonstrating non-localized recreational walking patterns among residents. (c) Quality disparities. We observed waterfront green spaces attracting substantial recreational walking, particularly on rest days, potentially indicating that the quality of some green spaces fails to meet residents’ daily recreational needs. The significantly higher quality of core green spaces compared to others may lead to green gentrification [57].
For physical isolation, strategies should emphasize strengthening connections through landscape footbridges and other three-dimensional connection methods [27]. However, the critical challenge lies in identifying key locations for pedestrian infrastructure development. While traditional space syntax can assess road connectivity [68], it does not reflect actual human usage patterns and cannot determine the importance of connection points. Roper et al. [69] employed participatory mapping to have users mark specific locations where walking was difficult, though this approach is challenging to scale. Our approach based on “structural holes”—potential positions connecting different community subgroups—provides precise targets for strategic interventions. Through carefully designed interventions addressing the most severe gaps, major barriers can progressively transform into critical connections. Regarding quality disparities, numerous studies have already acknowledged park quality injustice that may lead to wellbeing disparities among residents [70]. Therefore, improving community green space quality is essential, particularly given the generally low centrality of community green spaces observed in our study. Strategies include developing iconic design elements, implementing specialized recreational facilities, and creating unique landscape features to transform ordinary peripheral spaces into “destination-quality” parks. For structural homogeneity issues, creating a more integrated and resilient recreational walking network would enhance green space accessibility for all residents across temporal and spatial dimensions.

5. Conclusions

This study employed social network analysis to construct recreational walking networks of green spaces in Shanghai’s Outer Ring Area using trajectory data from the 2bulu application, comparing network characteristics between workdays and rest days. The findings reveal differentiated roles of various-sized green spaces at the network node level, significant spatiotemporal variation patterns at the regional network level, and more intensive and diverse connections between green spaces during rest days at the overall network level. These temporal differences and functional homogeneity findings provide direction for enhancing network resilience and optimizing service efficiency.
The theoretical significance of this research is twofold. First, the “human-centric network” constructed from real trajectories transcends the limitations of traditional ecological network research, shifting focus from physical connectivity to functional relationships. Second, the introduction of a dynamic temporal dimension advances the paradigm shift from “static green space equity” to “dynamic green space justice”. This study provides new analytical tools for understanding urban green space system organization characteristics. At the practical level, this research provides planners with measurable criteria for urban green space systems: (a) Prioritizing interventions based on degree centrality and closeness centrality metrics of green spaces within recreational walking networks, with spaces showing high closeness but low degree centrality representing strategic opportunities for quality enhancement. (b) Using community isolation indices where modularity values exceeding 0.5 indicate significant spatial isolation requiring intervention, with priorities determined by constraint degrees—targeting structural holes to maximize network improvement with minimal investment. (c) Supplementing green space quantity and diversity based on network density and homophily indices, prioritizing diversified green spaces in areas exhibiting substantially low network density and high homogeneity. These findings not only enrich the theoretical understanding of urban green space networks but also provide practical guidance for developing more inclusive, connected, and resilient urban green space systems. However, several limitations warrant consideration: (a) Although our data volume is substantial and the temporal coverage extensive compared to other studies using 2bulu data [27,36], providing a certain level of representativeness, the 2bulu data itself has inherent biases. Young people and health-conscious populations are overrepresented in the user base, potentially introducing selection bias. For example, elderly residents typically prefer shorter walking distances and more frequent visits to nearby green spaces, which may lead our analysis to underestimate the importance of community green spaces. Future research could benefit from multi-source data (e.g., mobile signal data) integration and field validation through participatory mapping approaches. (b) While our data covers four seasons, selecting the first five (non-rainy) workdays and rest days for each season, the total of 40 days is still relatively limited compared to a full year, potentially introducing representativeness bias. (c) Although SNA effectively quantifies spatial connectivity and captures dynamic relationships among green spaces, it inherently emphasizes quantitative structural properties and may overlook essential contextual or qualitative dimensions of recreational walking behavior, such as personal motivations, perceived environmental quality, or social interactions. The absence of these qualitative insights could limit the interpretability and practical implications of network findings. Future research should integrate qualitative methods, including surveys, interviews, or ethnographic approaches, to better contextualize the patterns revealed through SNA, thereby providing more comprehensive insights for urban green space planning and management.

Author Contributions

J.Z.: resources, methodology, software, writing—original draft. Z.B.: conceptualization, supervision, editing, formal analysis. All authors have read and agreed to the published version of the manuscript.

Funding

This research did not receive any specific grant from funding agencies in the public, commercial, or not-for-profit sectors. The authors are solely responsible for the design, execution, and reporting of the study.

Data Availability Statement

The data that support the findings of this study are available from the corresponding author upon reasonable request.

Conflicts of Interest

The authors declare that they have no known competing financial interests or personal relationships that could have appeared to influence the work reported in this paper.

References

  1. Qiu, Y.; Chen, H.; Li, Z.; Wang, R.; Liu, Y.; Qin, X. Exploring Neighborhood Environmental Effects on Mental Health: A Case Study in Guangzhou, China. Prog. Geogr. 2019, 38, 283–295. [Google Scholar] [CrossRef]
  2. Juraszek, P.; Karolina, S.; Grajek, M. Mental Health in a Post-Pandemic Perspective: Economic and Social Costs. J. Educ. Health Sport 2024, 69, 55195. [Google Scholar] [CrossRef]
  3. Chen, F.; She, W.; Zeng, F.; Gao, M.; Wen, C.; Liu, G.; Wu, L.; Wu, Y.; Zhang, C. Optimization Strategy of Community Planning for Environmental Health and Public Health in Smart City under Multi-Objectives. Front. Public Health 2024, 12, 1347122. [Google Scholar] [CrossRef]
  4. Moniuszko, H.; Popek, R.; Nawrocki, A.; Stankiewicz-Kosyl, M.; Grylewicz, S.; Podoba, S.; Przybysz, A. Urban Meadow—A Recipe for Long-Lasting Anti-Smog Land Cover. Int. J. Phytoremediation 2024, 26, 1932–1941. [Google Scholar] [CrossRef]
  5. Wolf, I.D.; Wohlfart, T. Walking, Hiking and Running in Parks: A Multidisciplinary Assessment of Health and Well-Being Benefits. Landsc. Urban Plan. 2014, 130, 89–103. [Google Scholar] [CrossRef]
  6. Yan, J.; Fan, S.; Tian, G.; Mu, T.; Liu, H.; Zhang, Y.; Mu, B. Assessing and Optimizing the Connectivity of the Outdoor Green Recreation Network in Zhengzhou from the Perspective of Green Travel. Land 2024, 13, 2085. [Google Scholar] [CrossRef]
  7. Ma, J.; Lin, P.; Williams, J. Effectiveness of Nature-Based Walking Interventions in Improving Mental Health in Adults: A Systematic Review. Curr. Psychol. 2024, 43, 9521–9539. [Google Scholar] [CrossRef]
  8. Bustamante, G.; Guzman, V.; Kobayashi, L.C.; Finlay, J. Mental Health and Well-Being in Times of COVID-19: A Mixed-Methods Study of the Role of Neighborhood Parks, Outdoor Spaces, and Nature among US Older Adults. Health Place 2022, 76, 102813. [Google Scholar] [CrossRef]
  9. Luka, N. Walking beyond the City? On the Importance of Recreational Mobilities for Landscape Planning, Urban Design, and Public Policy. Mobilities 2023, 18, 789–804. [Google Scholar] [CrossRef]
  10. Zhang, Z.; Zeng, B. Low Residents’ Satisfaction with Wetland Leisure Demand in Typical Urban Areas of the Semi-Arid Region in Western China: Spatial Variations and Their Causes. Land 2024, 13, 777. [Google Scholar] [CrossRef]
  11. Richards, D.R.; Passy, P.; Oh, R.R.Y. Impacts of Population Density and Wealth on the Quantity and Structure of Urban Green Space in Tropical Southeast Asia. Landsc. Urban Plan. 2017, 157, 553–560. [Google Scholar] [CrossRef]
  12. Xu, C.; Haase, D.; Pribadi, D.O.; Pauleit, S. Spatial Variation of Green Space Equity and Its Relation with Urban Dynamics: A Case Study in the Region of Munich. Ecol. Indic. 2018, 93, 512–523. [Google Scholar] [CrossRef]
  13. Matasov, V.; Vasenev, V.; Matasov, D.; Dvornikov, Y.; Filyushkina, A.; Bubalo, M.; Nakhaev, M.; Konstantinova, A. COVID-19 Pandemic Changes the Recreational Use of Moscow Parks in Space and Time: Outcomes from Crowd-Sourcing and Machine Learning. Urban For. Urban Green. 2023, 83, 127911. [Google Scholar] [CrossRef] [PubMed]
  14. Li, L.; Du, Q.; Ren, F.; Ma, X. Assessing Spatial Accessibility to Hierarchical Urban Parks by Multi-Types of Travel Distance in Shenzhen, China. Int. J. Environ. Res. Public Health 2019, 16, 1038. [Google Scholar] [CrossRef]
  15. Žlender, V.; Ward Thompson, C. Accessibility and Use of Peri-Urban Green Space for Inner-City Dwellers: A Comparative Study. Landsc. Urban Plan. 2017, 165, 193–205. [Google Scholar] [CrossRef]
  16. Rigolon, A.; Fernandez, M.; Harris, B.; Stewart, W. An Ecological Model of Environmental Justice for Recreation. Leis. Sci. 2022, 44, 655–676. [Google Scholar] [CrossRef]
  17. Fonseca, F.; Ribeiro, P.J.G.; Conticelli, E.; Jabbari, M.; Papageorgiou, G.; Tondelli, S.; Ramos, R.A.R. Built Environment Attributes and Their Influence on Walkability. Int. J. Sustain. Transp. 2022, 16, 660–679. [Google Scholar] [CrossRef]
  18. Ewing, R.; Handy, S. Measuring the Unmeasurable: Urban Design Qualities Related to Walkability. J. Urban Des. 2009, 14, 65–84. [Google Scholar] [CrossRef]
  19. Chen, L.; Lu, Y.; Ye, Y.; Xiao, Y.; Yang, L. Examining the Association between the Built Environment and Pedestrian Volume Using Street View Images. Cities 2022, 127, 103734. [Google Scholar] [CrossRef]
  20. Kim, Y.; Yeo, H.; Lim, L. Sustainable, Walkable Cities for the Elderly: Identification of the Built Environment for Walkability by Activity Purpose. Sustain. Cities Soc. 2024, 100, 105004. [Google Scholar] [CrossRef]
  21. Schipperijn, J.; Bentsen, P.; Troelsen, J.; Toftager, M.; Stigsdotter, U.K. Associations between Physical Activity and Characteristics of Urban Green Space. Urban For. Urban Green. 2013, 12, 109–116. [Google Scholar] [CrossRef]
  22. Vallecillo, S.; La Notte, A.; Zulian, G.; Ferrini, S.; Maes, J. Ecosystem Services Accounts: Valuing the Actual Flow of Nature-Based Recreation from Ecosystems to People. Ecol. Model. 2019, 392, 196–211. [Google Scholar] [CrossRef] [PubMed]
  23. Power, D.D.; Lambe, B.M.; Murphy, N.M. Using Systems Science Methods to Enhance the Work of National and Local Walking Partnerships: Practical Insights from Ireland. Eur. J. Public Health 2022, 32, i8–i13. [Google Scholar] [CrossRef]
  24. El-adaway, I.H.; Abotaleb, I.S.; Vechan, E. Social Network Analysis Approach for Improved Transportation Planning. J. Infrastruct. Syst. 2017, 23, 5016004. [Google Scholar] [CrossRef]
  25. Wang, X.-C.; Wang, C.-Y.; Kim, H.-H. Research on the Characteristics of Chinese Tourists Flow to Thailand: Application of the Social Network Analysis (SNA) Method. J. Asian Finance Econ. Bus. 2021, 8, 243–251. [Google Scholar] [CrossRef]
  26. Song, Z.; Liu, W. Changes in the Attraction Area and Network Structure of Recreation Flows in Urban Green, Blue and Grey Spaces under the Impact of the COVID-19 Pandemic. Cities 2024, 146, 104744. [Google Scholar] [CrossRef]
  27. Shi, H.; Yao, L.; Liu, Q.; Wang, Y.; Wei, Z.; Zhao, M.; Ma, D. From Trajectories to Network: Delineating the Spatial Pattern of Recreational Walking in Guangzhou. Appl. Geogr. 2024, 170, 103344. [Google Scholar] [CrossRef]
  28. Liu, S.; Shen, P.; Huang, Y.; Jiang, L.; Feng, Y. Spatial Distribution Changes in Nature-Based Recreation Service Supply from 2008 to 2018 in Shanghai, China. Land 2022, 11, 1862. [Google Scholar] [CrossRef]
  29. Chen, J.; Tao, Z.; Wu, W.; Wang, L.; Chen, D. Influence of Urban Park Pathway Features on the Density and Intensity of Walking and Running Activities: A Case Study of Shanghai City. Land 2024, 13, 156. [Google Scholar] [CrossRef]
  30. Fan, P.; Wan, G.; Xu, L.; Park, H.; Xie, Y.; Liu, Y.; Yue, W.; Chen, J. Walkability in Urban Landscapes: A Comparative Study of Four Large Cities in China. Landsc. Ecol. 2018, 33, 323–340. [Google Scholar] [CrossRef]
  31. Giuliani, G.; Petri, E.; Interwies, E.; Vysna, V.; Guigoz, Y.; Ray, N.; Dickie, I. Modelling Accessibility to Urban Green Areas Using Open Earth Observations Data: A Novel Approach to Support the Urban SDG in Four European Cities. Remote Sens. 2021, 13, 422. [Google Scholar] [CrossRef]
  32. Fei, W.J.; Gao, X.F. A Review on Disaster Prevention and Reduction Function of Urban Green Space in China. J. Nanjing For. Univ. 2020, 44, 222. [Google Scholar] [CrossRef]
  33. Cai, Z.; Gao, D.; Xiao, X.; Zhou, L.; Fang, C. The Flow of Green Exercise, Its Characteristics, Mechanism, and Pattern in Urban Green Space Networks: A Case Study of Nangchang, China. Land 2023, 12, 673. [Google Scholar] [CrossRef]
  34. Zhou, L.; Lai, Y. Urban Spatial Heat Resilience Indicator Based on Running Activity Z-Score. Urban Sci. 2025, 9, 34. [Google Scholar] [CrossRef]
  35. Shi, H.; Huang, H.; Ma, D.; Chen, L.; Zhao, M. Capturing Urban Recreational Hotspots from GPS Data: A New Framework in the Lens of Spatial Heterogeneity. Comput. Environ. Urban Syst. 2023, 103, 101972. [Google Scholar] [CrossRef]
  36. Liu, W.; Wang, B.; Yang, Y.; Mou, N.; Zheng, Y.; Zhang, L.; Yang, T. Cluster Analysis of Microscopic Spatio-Temporal Patterns of Tourists’ Movement Behaviors in Mountainous Scenic Areas Using Open GPS-Trajectory Data. Tour. Manag. 2022, 93, 104614. [Google Scholar] [CrossRef]
  37. Yun, H.J.; Kang, D.J.; Lee, M.J. Spatiotemporal Distribution of Urban Walking Tourists by Season Using GPS-Based Smartphone Application. Asia Pac. J. Tour. Res. 2018, 23, 1047–1061. [Google Scholar] [CrossRef]
  38. Yang, Y.; Peng, S.; Park, D.-S.; Hao, F.; Lee, H. A Novel Community Detection Method of Social Networks for the Well-Being of Urban Public Spaces. Land 2022, 11, 716. [Google Scholar] [CrossRef]
  39. Xu, Y.; Belyi, A.; Santi, P.; Ratti, C. Quantifying Segregation in an Integrated Urban Physical-Social Space. J. R. Soc. Interface 2019, 16, 20190536. [Google Scholar] [CrossRef]
  40. Chen, J.; Chang, Z. Rethinking Urban Green Space Accessibility: Evaluating and Optimizing Public Transportation System through Social Network Analysis in Megacities. Landsc. Urban Plan. 2015, 143, 150–159. [Google Scholar] [CrossRef]
  41. Hagberg, A.; Swart, P.J.; Schult, D.A. Exploring Network Structure, Dynamics, and Function Using NetworkX; Los Alamos National Laboratory (LANL): Los Alamos, NM, USA, 2008. [Google Scholar]
  42. Newman, M.E.J. Modularity and Community Structure in Networks. Proc. Natl. Acad. Sci. USA 2006, 103, 8577–8582. [Google Scholar] [CrossRef] [PubMed]
  43. Tulin, M.; Pollet, T.V.; Lehmann-Willenbrock, N. Perceived Group Cohesion versus Actual Social Structure: A Study Using Social Network Analysis of Egocentric Facebook Networks. Soc. Sci. Res. 2018, 74, 161–175. [Google Scholar] [CrossRef] [PubMed]
  44. Fan, Z.; Duan, J.; Luo, M.; Zhan, H.; Liu, M.; Peng, W. How Did Built Environment Affect Urban Vitality in Urban Waterfronts? A Case Study in Nanjing Reach of Yangtze River. ISPRS Int. J. Geo-Inf. 2021, 10, 611. [Google Scholar] [CrossRef]
  45. Xie, X.; Zhou, H.; Gou, Z.; Yi, M. Spatiotemporal Patterns of the Use of Green Space by White-Collar Workers in Chinese Cities: A Study in Shenzhen. Land 2021, 10, 1006. [Google Scholar] [CrossRef]
  46. Xu, S.; Yuan, S.; Li, J.; Gao, X.; Hu, J. Urban Park Green Space Use Analysis Based on Trajectory Big Data: Experience from a Medium–Sized City in China. Heliyon 2024, 10, e26445. [Google Scholar] [CrossRef]
  47. Jiao, H.; Li, C.; Yu, Y.; Peng, Z. Urban Public Green Space Equity against the Context of High-Speed Urbanization in Wuhan, Central China. Sustainability 2020, 12, 9394. [Google Scholar] [CrossRef]
  48. Chen, N.-N.; Kang, S.-Z.; Zhao, Y.-H.; Zhou, Y.-J.; Yan, J.; Lu, Y.-R. Construction of Ecological Network in Qinling Mountains of Shaanxi, China Based on MSPA and MCR Model. Chin. J. Appl. Ecol. 2021, 32, 1545–1553. [Google Scholar] [CrossRef]
  49. Tang, F.; Zhou, X.; Wang, L.; Zhang, Y.; Fu, M.; Zhang, P. Linking Ecosystem Service and MSPA to Construct Landscape Ecological Network of the Huaiyang Section of the Grand Canal. Land 2021, 10, 919. [Google Scholar] [CrossRef]
  50. Forman, R.T.T.; Godron, M. Landscape Ecology; Wiley: Chichester, UK, 1986. [Google Scholar]
  51. Kong, F.; Yin, H.; Nakagoshi, N.; Zong, Y. Urban Green Space Network Development for Biodiversity Conservation: Identification Based on Graph Theory and Gravity Modeling. Landsc. Urban Plan. 2010, 95, 16–27. [Google Scholar] [CrossRef]
  52. Tian, Y.; Jim, C.Y.; Wang, H. Assessing the Landscape and Ecological Quality of Urban Green Spaces in a Compact City. Landsc. Urban Plan. 2014, 121, 97–108. [Google Scholar] [CrossRef]
  53. Wright Wendel, H.E.; Zarger, R.K.; Mihelcic, J.R. Accessibility and Usability: Green Space Preferences, Perceptions, and Barriers in a Rapidly Urbanizing City in Latin America. Landsc. Urban Plan. 2012, 107, 272–282. [Google Scholar] [CrossRef]
  54. Liu, T.; Yu, L.; Chen, X.; Chen, Y.; Li, X.; Liu, X.; Cao, Y.; Zhang, F.; Zhang, C.; Gong, P. Identifying Potential Urban Greenways by Considering Green Space Exposure Levels and Maximizing Recreational Flows: A Case Study in Beijing’s Built-up Areas. Land 2024, 13, 1793. [Google Scholar] [CrossRef]
  55. Gieseking, J.J.; Mangold, W.; Katz, C. The People, Place, and Space Reader; Taylor & Francis: London, UK, 2014. [Google Scholar]
  56. Nesbitt, L.; Meitner, M.J.; Girling, C.; Sheppard, S.R.J.; Lu, Y. Who Has Access to Urban Vegetation? A Spatial Analysis of Distributional Green Equity in 10 US Cities. Landsc. Urban Plan. 2019, 181, 51–79. [Google Scholar] [CrossRef]
  57. Wolch, J.R.; Byrne, J.; Newell, J.P. Urban Green Space, Public Health, and Environmental Justice: The Challenge of Making Cities ‘Just Green Enough’. Landsc. Urban Plan. 2014, 125, 234–244. [Google Scholar] [CrossRef]
  58. Sister, C.; Wolch, J.; Wilson, J. Got Green? Addressing Environmental Justice in Park Provision. Geojournal 2010, 75, 229–248. [Google Scholar] [CrossRef]
  59. Hillsdon, M.; Panter, J.; Foster, C.; Jones, A. The Relationship between Access and Quality of Urban Green Space with Population Physical Activity. Public Health 2006, 120, 1127–1132. [Google Scholar] [CrossRef]
  60. Rey Gozalo, G.; Barrigón Morillas, J.M.; Montes González, D. Perceptions and Use of Urban Green Spaces on the Basis of Size. Urban For. Urban Green. 2019, 46, 126470. [Google Scholar] [CrossRef]
  61. Gavrilidis, A.-A.; Zakerhaghighi, K.; Popa, A.-M.; Akbarian, S.Z.; Onose, D.-A.; Grădinaru, S.R.; Slave, R.-A. Perceptions of Cultural Ecosystem Services Provision by Small Public Urban Green Spaces: Perspectives from Different Cultural Backgrounds. Urban Ecosyst. 2024, 27, 699–716. [Google Scholar] [CrossRef]
  62. Gehl, J. Cities for People; Island Press: Washington, USA, 2013. [Google Scholar]
  63. Yu, P.; Yung, E.H.K.; Chan, E.H.W.; Wang, S.; Chen, Y.; Chen, Y. Capturing Open Space Fragmentation in High–Density Cities: Towards Sustainable Open Space Planning. Appl. Geogr. 2023, 154, 102927. [Google Scholar] [CrossRef]
  64. Jim, C.Y.; Chen, W.Y. Recreation–Amenity Use and Contingent Valuation of Urban Greenspaces in Guangzhou, China. Landsc. Urban Plan. 2006, 75, 81–96. [Google Scholar] [CrossRef]
  65. Lynch, K. Good City Form; MIT Press: Cambridge, MA, USA, 1984; ISBN 0-262-62046-4. [Google Scholar]
  66. van Eldijk, J.; Gil, J.; Marcus, L. Disentangling Barrier Effects of Transport Infrastructure: Synthesising Research for the Practice of Impact Assessment. Eur. Transp. Res. Rev. 2022, 14, 1. [Google Scholar] [CrossRef]
  67. Anciaes, P.; Nascimento, J.M. do Road Traffic Reduces Pedestrian Accessibility—Quantifying the Size and Distribution of Barrier Effects in an African City. J. Transp. Health 2022, 27, 101522. [Google Scholar] [CrossRef]
  68. Alalouch, C.; Al-Hajri, S.; Naser, A.; Al Hinai, A. The Impact of Space Syntax Spatial Attributes on Urban Land Use in Muscat: Implications for Urban Sustainability. Sustain. Cities Soc. 2019, 46, 101417. [Google Scholar] [CrossRef]
  69. Roper, J.; Ng, M.; Huck, J.; Pettit, C. A Participatory Mapping Approach to Capturing Perceived Walkability. Transp. Res. Part Policy Pract. 2024, 186, 104133. [Google Scholar] [CrossRef]
  70. Rigolon, A. A Complex Landscape of Inequity in Access to Urban Parks: A Literature Review. Landsc. Urban Plan. 2016, 153, 160–169. [Google Scholar] [CrossRef]
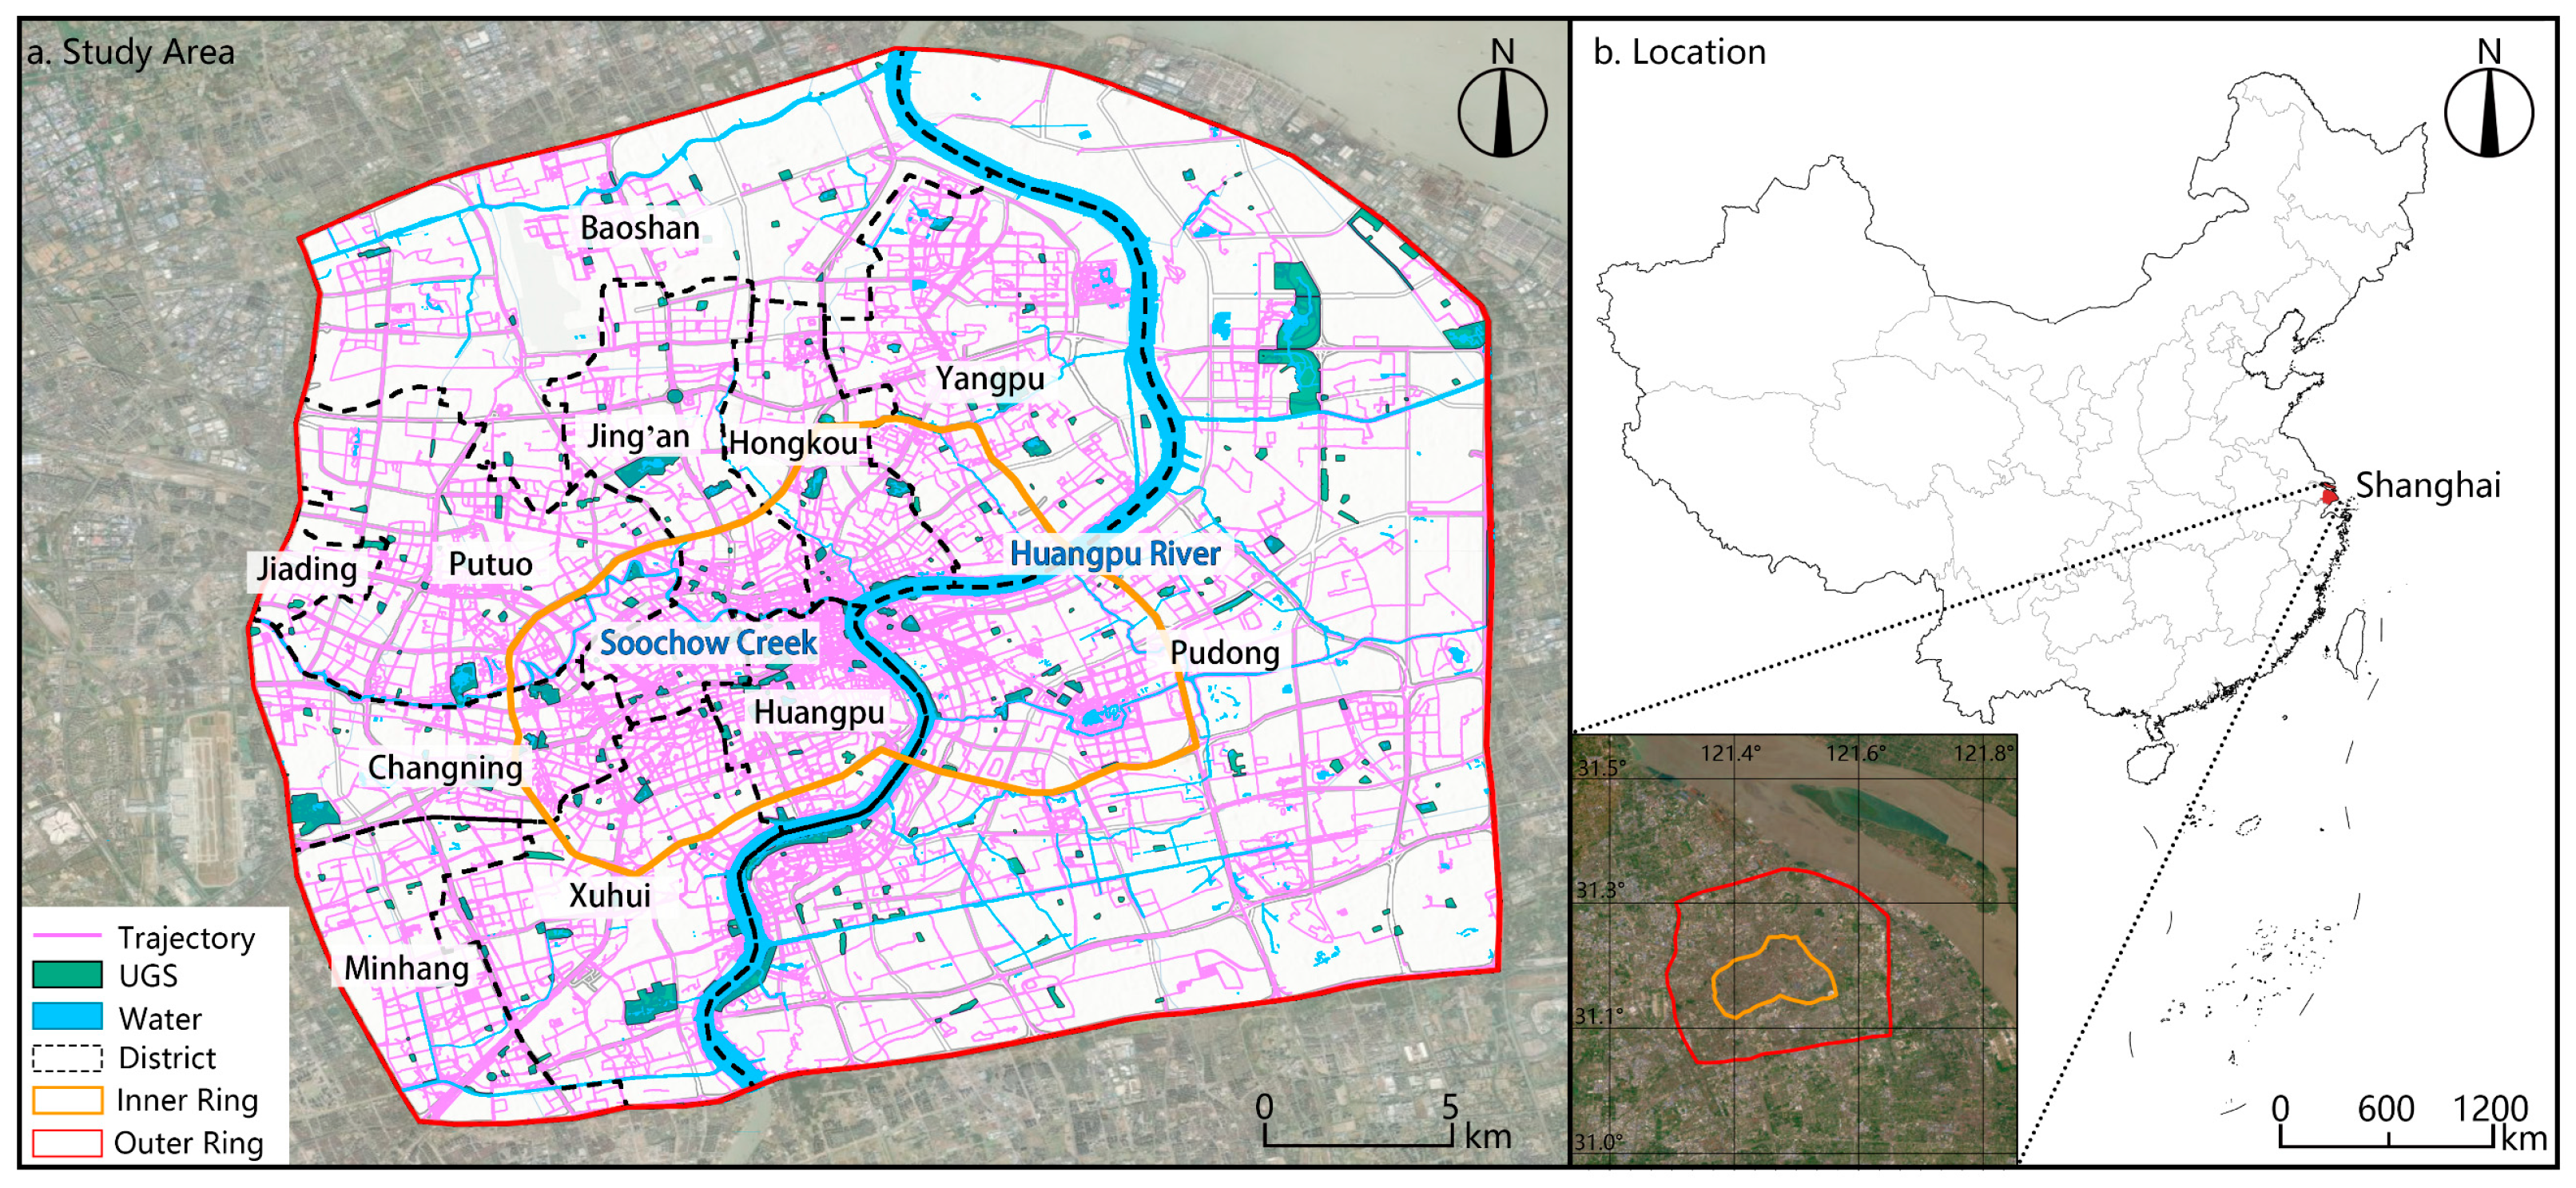
Figure 1. Research Area.
Urbansci 09 00111 g001
Figure 2. Technical Framework. Letters represent UGSs; colored lines indicate recreational walking trajectories; numbers in the matrix represent trajectory-based connection frequency between UGSs.
Urbansci 09 00111 g002
Figure 3. UGS RWN on Workdays and Rest Days.
Urbansci 09 00111 g003
Figure 4. Community Detection in UGS RWN on Workdays and Rest Days.
Urbansci 09 00111 g004
Figure 5. Structural Characteristics of Combined RWN. (a) Node centrality distribution and trajectory intensity in the combined network. (b) Community structure and structural holes in the combined network.
Urbansci 09 00111 g005
Table 1. Measurement Methods for RWN.
DimensionMetricFormulaDescription
Node ImportanceDegree Centrality C D v = deg v n 1 deg v is the number of direct connections from node v to other nodes, n is the total number of nodes in the network
Closeness Centrality C C v = n 1 t d v , t d v , t is the shortest path distance from node v to node t. The shorter the average shortest path distance from node v to all other nodes in the network, the higher the closeness centrality
Regional DifferencesModularity Q = 1 2 m i j A i j k i k j 2 m δ c i , c j m is   the   number   of   edges   in   the   network ,   A i j   is   the   connection   between   nodes   i   and   j ,   k i   and   k j   are   the   degrees   of   nodes   i   and   j ,   δ c i , c j is an indicator function that equals 1 when i and j belong to the same community and 0 otherwise.
Overall CharacteristicsNetwork Density D = 2 m n n 1 m is the number of edges in the network, n is the total number of nodes.
Homophily Index H = M m m is the number of edges in the network, M is the number of edges connecting nodes with the same attributes. H closer to 1 indicates nodes with similar attributes tend to connect with each other.
Table 2. Network Centrality Characteristics of Urban Green Spaces on Different Days.
Panel A: Rest Days
IndicatorsLarge UGSCommunity UGSPocket UGS
Mean Degree Centrality0.03050.02430.0257
Mean Closeness Centrality0.16410.16340.1787
High Degree Centrality18 (37.5%)26 (27.1%)7 (36.8%)
Medium Degree Centrality12 (25.0%)18 (18.8%)5 (26.3%)
Low Degree Centrality18 (37.5%)52 (54.2%)7 (36.8%)
High Closeness Centrality14 (29.2%)21 (21.9%)6 (31.6%)
Medium Closeness Centrality22 (45.8%)49 (51.0%)10 (52.6%)
Low Closeness Centrality12 (25.0%)26 (27.1%)3 (15.8%)
Panel B: Workdays
IndicatorsLarge UGSCommunity UGSPocket UGS
Mean Degree Centrality0.02330.01790.0170
Mean Closeness Centrality0.15510.14450.1702
High Degree Centrality23 (48.9%)24 (26.7%)6 (30.0%)
Medium Degree Centrality15 (31.9%)34 (37.8%)8 (40.0%)
Low Degree Centrality9 (19.2%)32 (35.6%)6 (30.0%)
High Closeness Centrality10 (21.3%)23 (25.6%)8 (40.0%)
Medium Closeness Centrality25 (53.2%)40 (44.4%)11 (55.0%)
Low Closeness Centrality12 (25.5%)27 (30.0%)1 (5.0%)
Note: Numbers in parentheses represent percentages of each green space type. High, medium, and low categories are determined by quartiles (top 25%, middle 50%, and bottom 25%, respectively).
Table 3. Network Characteristics of Community Clusters during Different Time Periods.
Panel A: Workdays
Community IDDensityHomophily Index
10.28570.3333
20.12860.4074
30.16190.3529
40.21820.5000
50.25450.2857
60.15000.3333
70.28570.4333
80.40000.1667
90.15790.3333
100.40000.2500
110.18180.2500
Overall0.02980.3369
Panel B: Rest Days
Community IDDensityHomophily Index
10.26670.5000
20.66670.3571
30.46430.3846
40.40000.3333
50.28570.2500
60.50000.0000
70.47620.3000
80.40000.5000
90.73330.2727
100.40000.2500
Overall0.04680.3787
Table 4. Community Characteristics in Combined Networks.
Community IDDensityHomophily Index
10.05390.4091
20.43940.3448
30.16300.4444
40.11680.4634
50.10580.3500
60.20230.3409
70.40000.5000
81.00000.4000
Overall0.03600.4068
Disclaimer/Publisher’s Note: The statements, opinions and data contained in all publications are solely those of the individual author(s) and contributor(s) and not of MDPI and/or the editor(s). MDPI and/or the editor(s) disclaim responsibility for any injury to people or property resulting from any ideas, methods, instructions or products referred to in the content.