Article

Fractal Clustering as Spatial Variability of Magnetic Anomalies Measurements for Impending Earthquakes and the Thermodynamic Fractal Dimension

by
Patricio Venegas-Aravena
1,*,
Enrique Cordaro
2,3 and
David Laroze
4
1
Department of Structural and Geotechnical Engineering, School of Engineering, Pontificia Universidad Católica de Chile, Vicuña Mackenna 4860, Macul, Santiago 8331150, Chile
2
Observatorios de Radiación Cósmicay Geomagnetismo, Departamento de Física, FCFM, Universidad de Chile, Casilla 487-3, Santiago 8330015, Chile
3
Facultad de Ingeniería, Universidad Autónoma de Chile, Pedro de Valdivia 425, Santiago 7500912, Chile
4
Instituto de Alta Investigación, CEDENNA, Universidad de Tarapacá, Casilla 7D, Arica 1000000, Chile
*
Author to whom correspondence should be addressed.
Fractal Fract. 2022, 6(11), 624; https://doi.org/10.3390/fractalfract6110624
Submission received: 24 August 2022 / Revised: 10 October 2022 / Accepted: 11 October 2022 / Published: 26 October 2022

Abstract

:
Several studies focusing on the anomalies of one specific parameter (such as magnetic, ionospheric, radon release, temperature, geodetic, etc.) before impending earthquakes are constantly challenged because their results can be regarded as noise, false positives or are not related to earthquakes at all. This rise concerns the viability of studying isolated physical phenomena before earthquakes. Nevertheless, it has recently been shown that all of the complexity of these pre-earthquake anomalies rises because they could share the same origin. Particularly, the evolution and concentration of uniaxial stresses within rock samples have shown the generation of fractal crack clustering before the macroscopic failure. As there are studies which considered that the magnetic anomalies are created by lithospheric cracks in the seismo-electromagnetic theory, it is expected that the crack clustering is a spatial feature of magnetic and non-magnetic anomalies measurements in ground, atmospheric and ionospheric environments. This could imply that the rise of multiparametric anomalies at specific locations and times, increases the reliability of impending earthquake detections. That is why this work develops a general theory of fractal-localization of different anomalies within the lithosphere in the framework of the seismo-electromagnetic theory. In addition, a general description of the fractal dimension in terms of scaling entropy change is obtained. This model could be regarded as the basis of future early warning systems for catastrophic earthquakes.

1. Introduction

The localization of impending earthquakes is a crucial task in order to avoid catastrophic results. Up to now, there have been several tools and techniques related to the preparation zone for earthquakes. For example, geodetic studies, rock experiments, acoustic emissions, fluid migration or magnetic anomalies are focused on active crustal-region close faults [1,2]. That is, the measurements of the progressive change of elastic properties of the lithosphere as the shear deformation at ground level [3]. Nevertheless, not all the processes in the preparation zone correspond to surface measurements. For instance, there are tomographic studies that show the generation and growth of crack clustering within rock samples which indicates that the interior of rock is constantly evolving prior to the main failure [4]. On the other hand, several studies of the Lithosphere–Atmosphere–Ionosphere effect (LAIC effect) consider magnetic measurements within a preparation zone defined by the Dobrovolsky area [5,6,7,8]. Here, the main assumption is the existence of a distance dependency of the magnetic anomalies with respect to the future epicenter of impending earthquakes. In other words, the measured magnetic anomalies, either at ground or ionospheric levels, should be clustered.
Recently, it has been shown that the crack generation within the lithosphere and the magnetic anomalies can be linked by the growth of fractal cracks which is the basic idea of the seismo-electromagnetic theory [9]. That is, each crack inside the lithosphere generates an electromagnetic pulse that can be measured above the Earth’s surface [10]. Then, it is expected that the magnetic anomalies behave similarly to the fractal clustering within the lithosphere. That is, there must exist spatial properties such as the clustering of anomalies prior to impending earthquakes. That is the reason why Section 2 describes, mathematically, the basic finding from x-rays tomography. Section 3 shows the properties that should be measured, either at ground or ionospheric level, by the magnetometer depending on the distance of the impending epicenter by considering the fractal clustering, and conclusions are in Section 4.

2. Theoretical Model

Experiments in dry or water-saturated rock samples show the growth of the volume of cracks in very reduced areas, before the main failure when samples are triaxially loaded [4,11,12], where the volume of these cracks is fractally distributed [13]. This indicates that the main failure will occur close to the denser cluster. A schematic representation can be seen in Figure 1. Note that this scheme was motivated by the experiments performed by [14]. Figure 1a shows the crack generation (magenta points) close to the impending macroscopic failure (blue patch). Figure 1b shows the same set-up where the load has increased, which implies that more crack generations are expected. Figure 1c shows the same cracks (magenta) enclosed in two different reference spheres. The dark blue sphere shows that there are more cracks created inside it, compared to the outside counterpart. This represents the spatial clustering of cracks. The same can be seen in Figure 1d for time. Figure 1e and f shows how the cracks are spatially distributed. That is, the number of cracks per volume unit is larger close to the center for both cases ( t 1 and t 2 ). In addition, the case from Figure 1f shows that the number of cracks within the reference sphere (dark blue) at t = t 2 have increased compared to those found when t = t 1 (Figure 1e) because of the differential load increase. This indicates the spatial–temporal clustering observed in some experiments [14]. Note that the maximum distance is set as constant because the Dobrovolsky area [7], which determines the preparation area, is constant for each earthquake.

Mathematical Description

The localization of damage and cracks within rock samples, which are the same as within the lithosphere, raises power laws among the different parameters because it corresponds to the transition from one unstable state into a more stable one [13,14,15,16]. Thus, the fractal formalism for the curve shown in Figure 1e and f can be written as [17]:
N r V ~ r D s c N r = N r V , r = α 1 V r D s c ,
where N r is the number of cracks at a given time in terms of the radial distance r , V the volume, D s c the fractal dimension for the spatial clustering which is positive and α 1 is a constant. Here, it is important to note that the increase in the load changes the value of D s c . Then, D s c is also a function of the stress evolution σ . This implies that D s c = D s c σ and N r = N r V , r , σ . This also implies that D s c could not be regarded as constant during the pre-earthquake stage [8,9,15]. As the volume also depends on the distance, the number of cracks as a function of distance at a given time is:
N r r , σ = α 0 r 3 D s c σ ,    
where α 0 = α 1 4 π / 3   . Equation (2) shows that the number of cracks depends on the power 3 D s c σ at a given distance r . This means that the number of cracks increases if D s c decreases. As the number of cracks increases due to the stress increase [8,9,14,15], it can be regarded that D s c and σ are negatively correlated. Specifically, D s c σ log σ 2 (see Appendix A for derivation). The lithospheric stress increase defines the Dobrovolsky area for each expected impending earthquake magnitude [7]. This implies that the volume of the preparation zone can be considered as constant for each earthquake ( V t o t L 0 3 ) and this constrains the boundaries where the crack generation could occur. Then, the number of cracks at a given time compared to the total volume can be written as:
N r r , σ = α 0 L 0 3 r D s c σ .
Here, the number of cracks at a given time, per total volume N r / V t o t , corresponds to the density of cracks. Then, Equation (3) describes the clustering as the rise of the crack density when the specific distance (volume) r that contains the cracks decreases.
On the other hand, it has been found that the cumulative number of daily magnetic anomalies, N t , at a specific location is proportional to the number of cracks and the stress change which generates those cracks [8,9]. This behavior is described by the sigmoid function which is defined as [8,9]:
N t = β 0 1 + e β 1 t t C = d σ d t ,
where β 0 and β 1 are constants, t is the time and t C is the critical time that corresponds to the time when the main earthquake occurs. Then, the total magnetic anomalies expected, N , within the preparation zone is:
N r , t = N t N r = α 0 β 0 L 0 3 1 + e β 1 t t C r D s c σ = α 0 L 0 3 d σ r , t d t r D s c σ r , t        
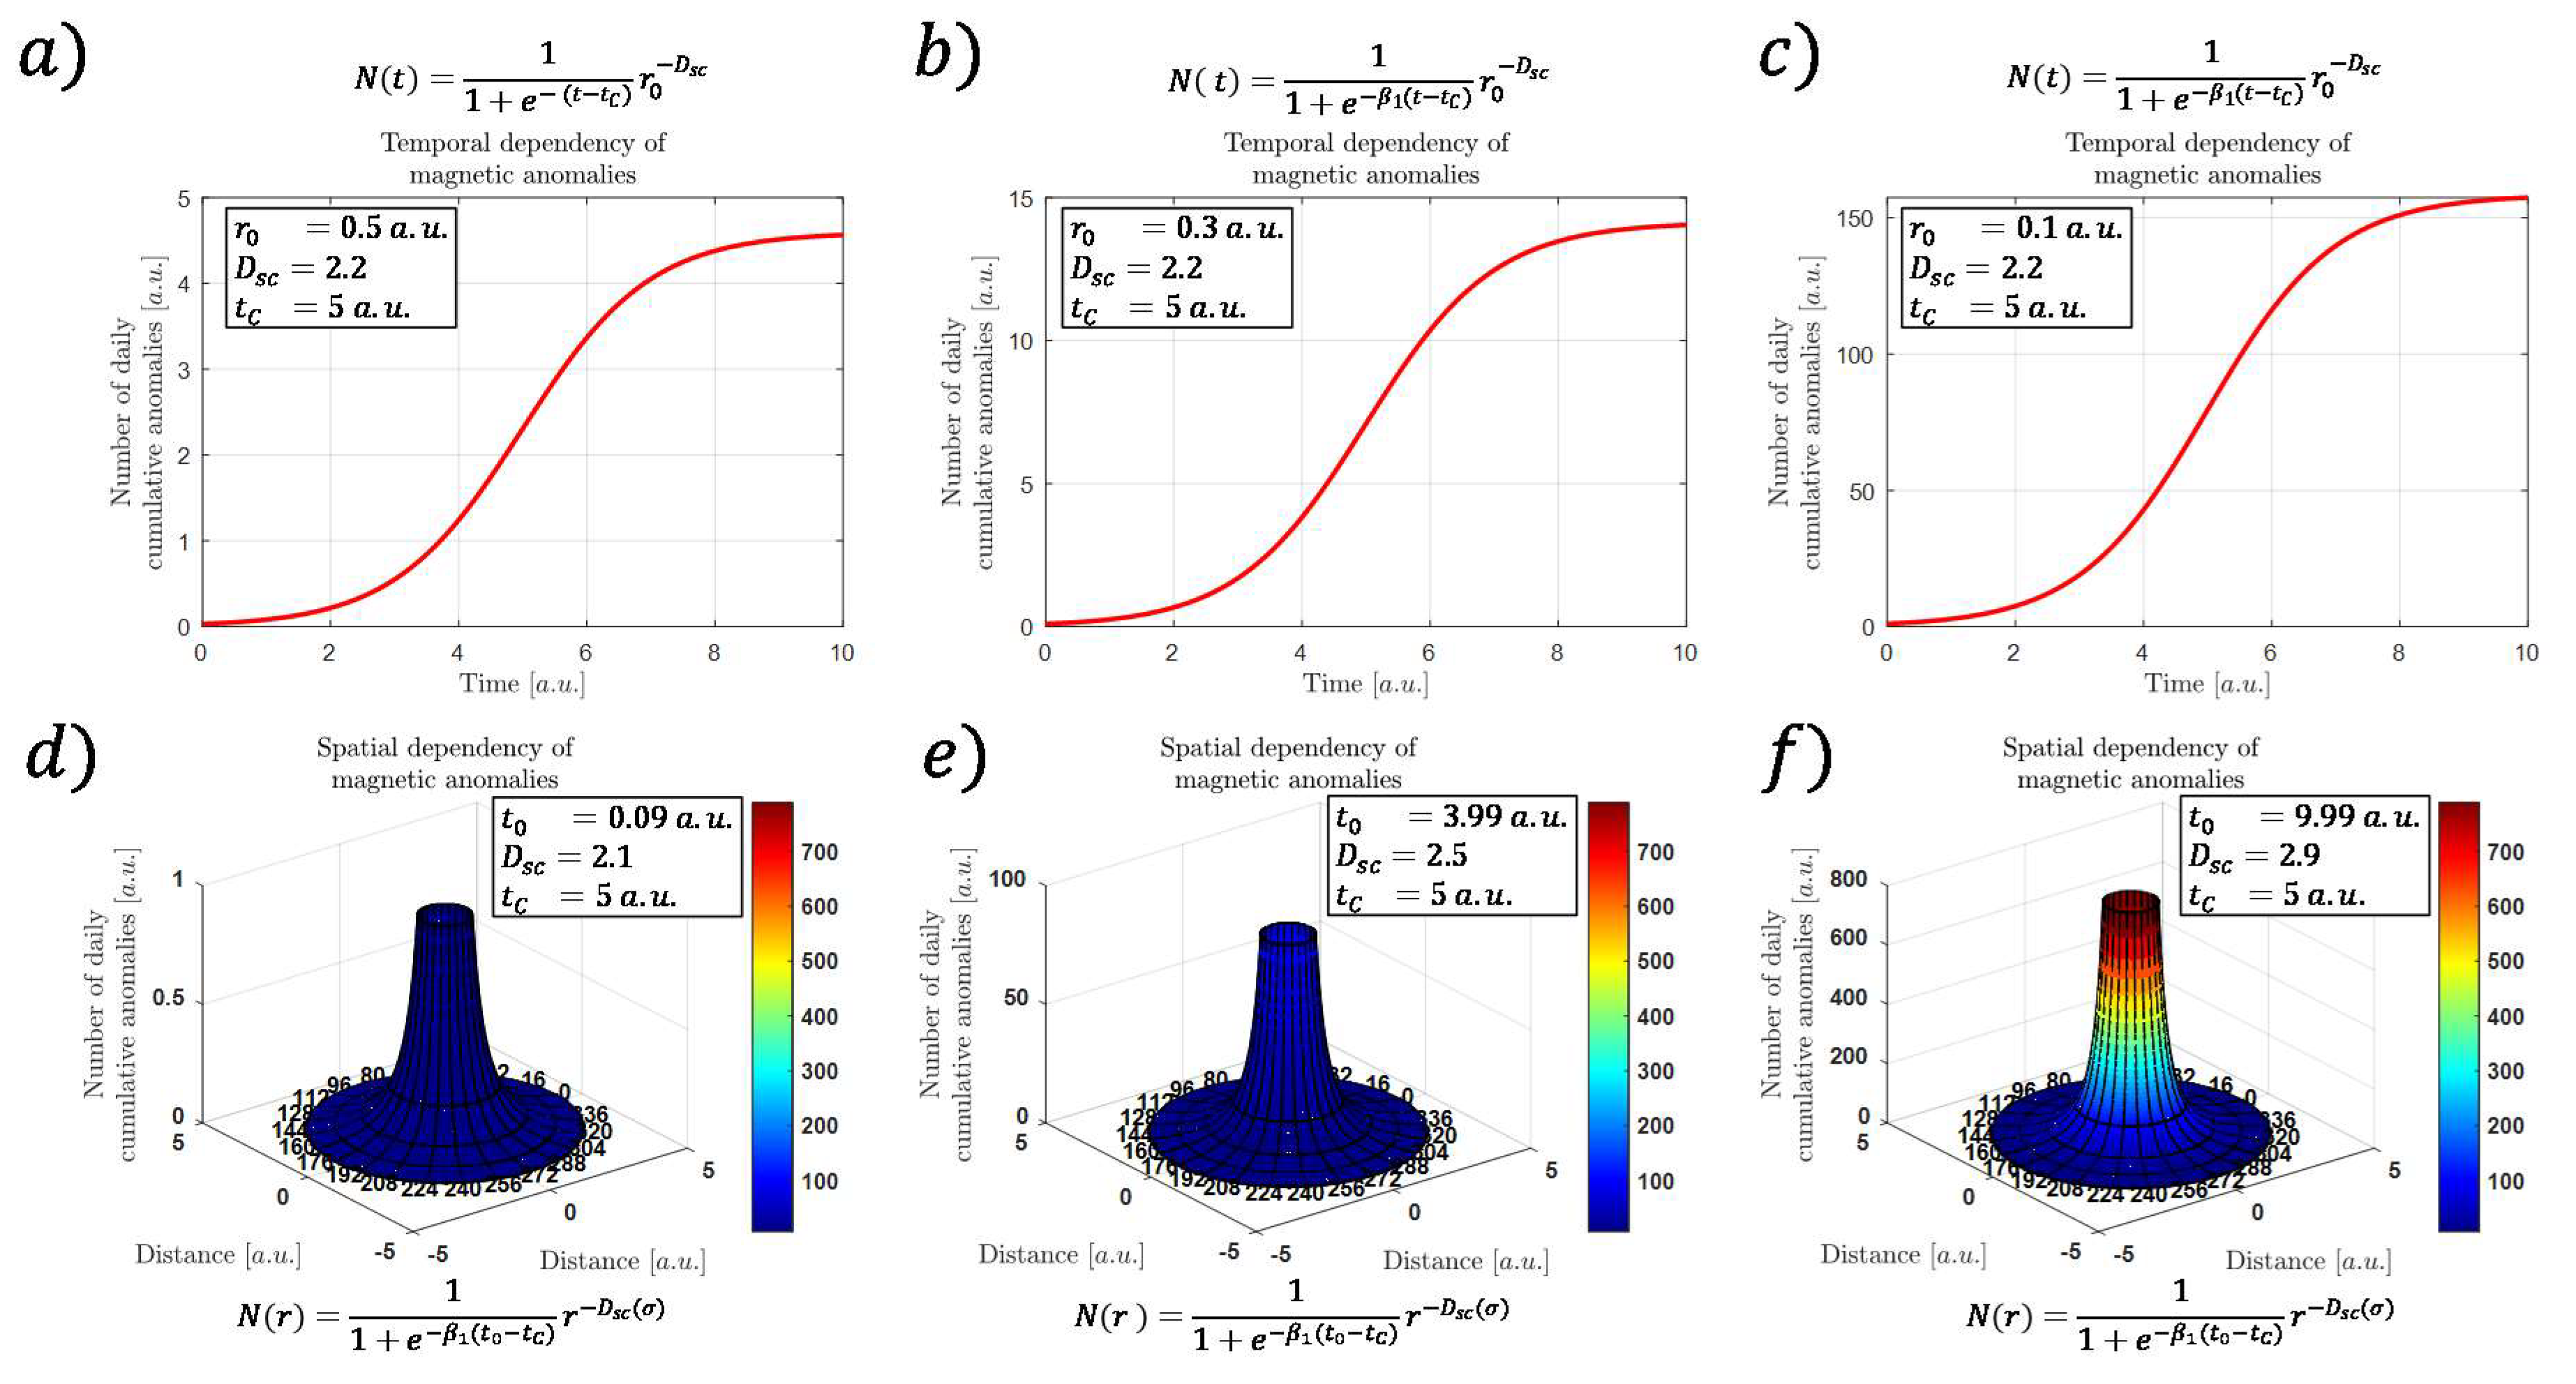
Here, it is important to note that N r corresponds to the spatial distribution of cracks up to a given time, N t , to the temporal evolution of cracks number, while N takes into account the complete description of the spatial and temporal evolution of crack number generation. In addition, it is also noted that the temporal evolution of crack numbers is given by σ . These stresses within the lithosphere could be regarded as heterogeneous. That is why stress and stress changes could be different at each different location. Figure 2 shows some examples of how Equation (5) describes the number of total anomalies within the preparation zone. The domain is r 0.1 ,   0.5   a . u . , t 0 ,   10   a . u . and t C = 5   a . u . , where a . u . means arbitrary units. For simplicity, all the constants from Equation (5) are equal to one ( α 0 = β 0 = β 1 = L 0 = 1   a . u . ). Figure 2a shows the time dependency of the daily cumulative anomalies for a specific point close to the boundary of the domain ( r 0 = 0.5   a . u . ). It is possible to observe that the number of maximum anomalies ( N 4.5   a . u . ) increases when the point is closer to the center. That is, N 14.5   a . u . for r = 0.3   a . u . (Figure 2b) and N 160   a . u . for r = 0.1   a . u . (Figure 2c). As N also depends on the position, Figure 2d shows the number of anomalies at each point of the domain, at a specific time t 0 = 0.09   a . u .. It is clear that the largest anomalies obtained are close to the center of the domain ( N ~ 1   a . u . ). The anomalies also increase when the time is larger. That is, N ~ 90   a . u . when t 0 = 3.99   a . u . (Figure 2e) and N ~ 750   a . u . when t 0 = 9.99   a . u . (Figure 2f). Then, as the focalization of cracks (and anomalies) increases when the time is larger at a point close to the impending earthquake, the model describes the main properties of fractal clustering.

3. Expected Atmosphere and Ionosphere Measurements

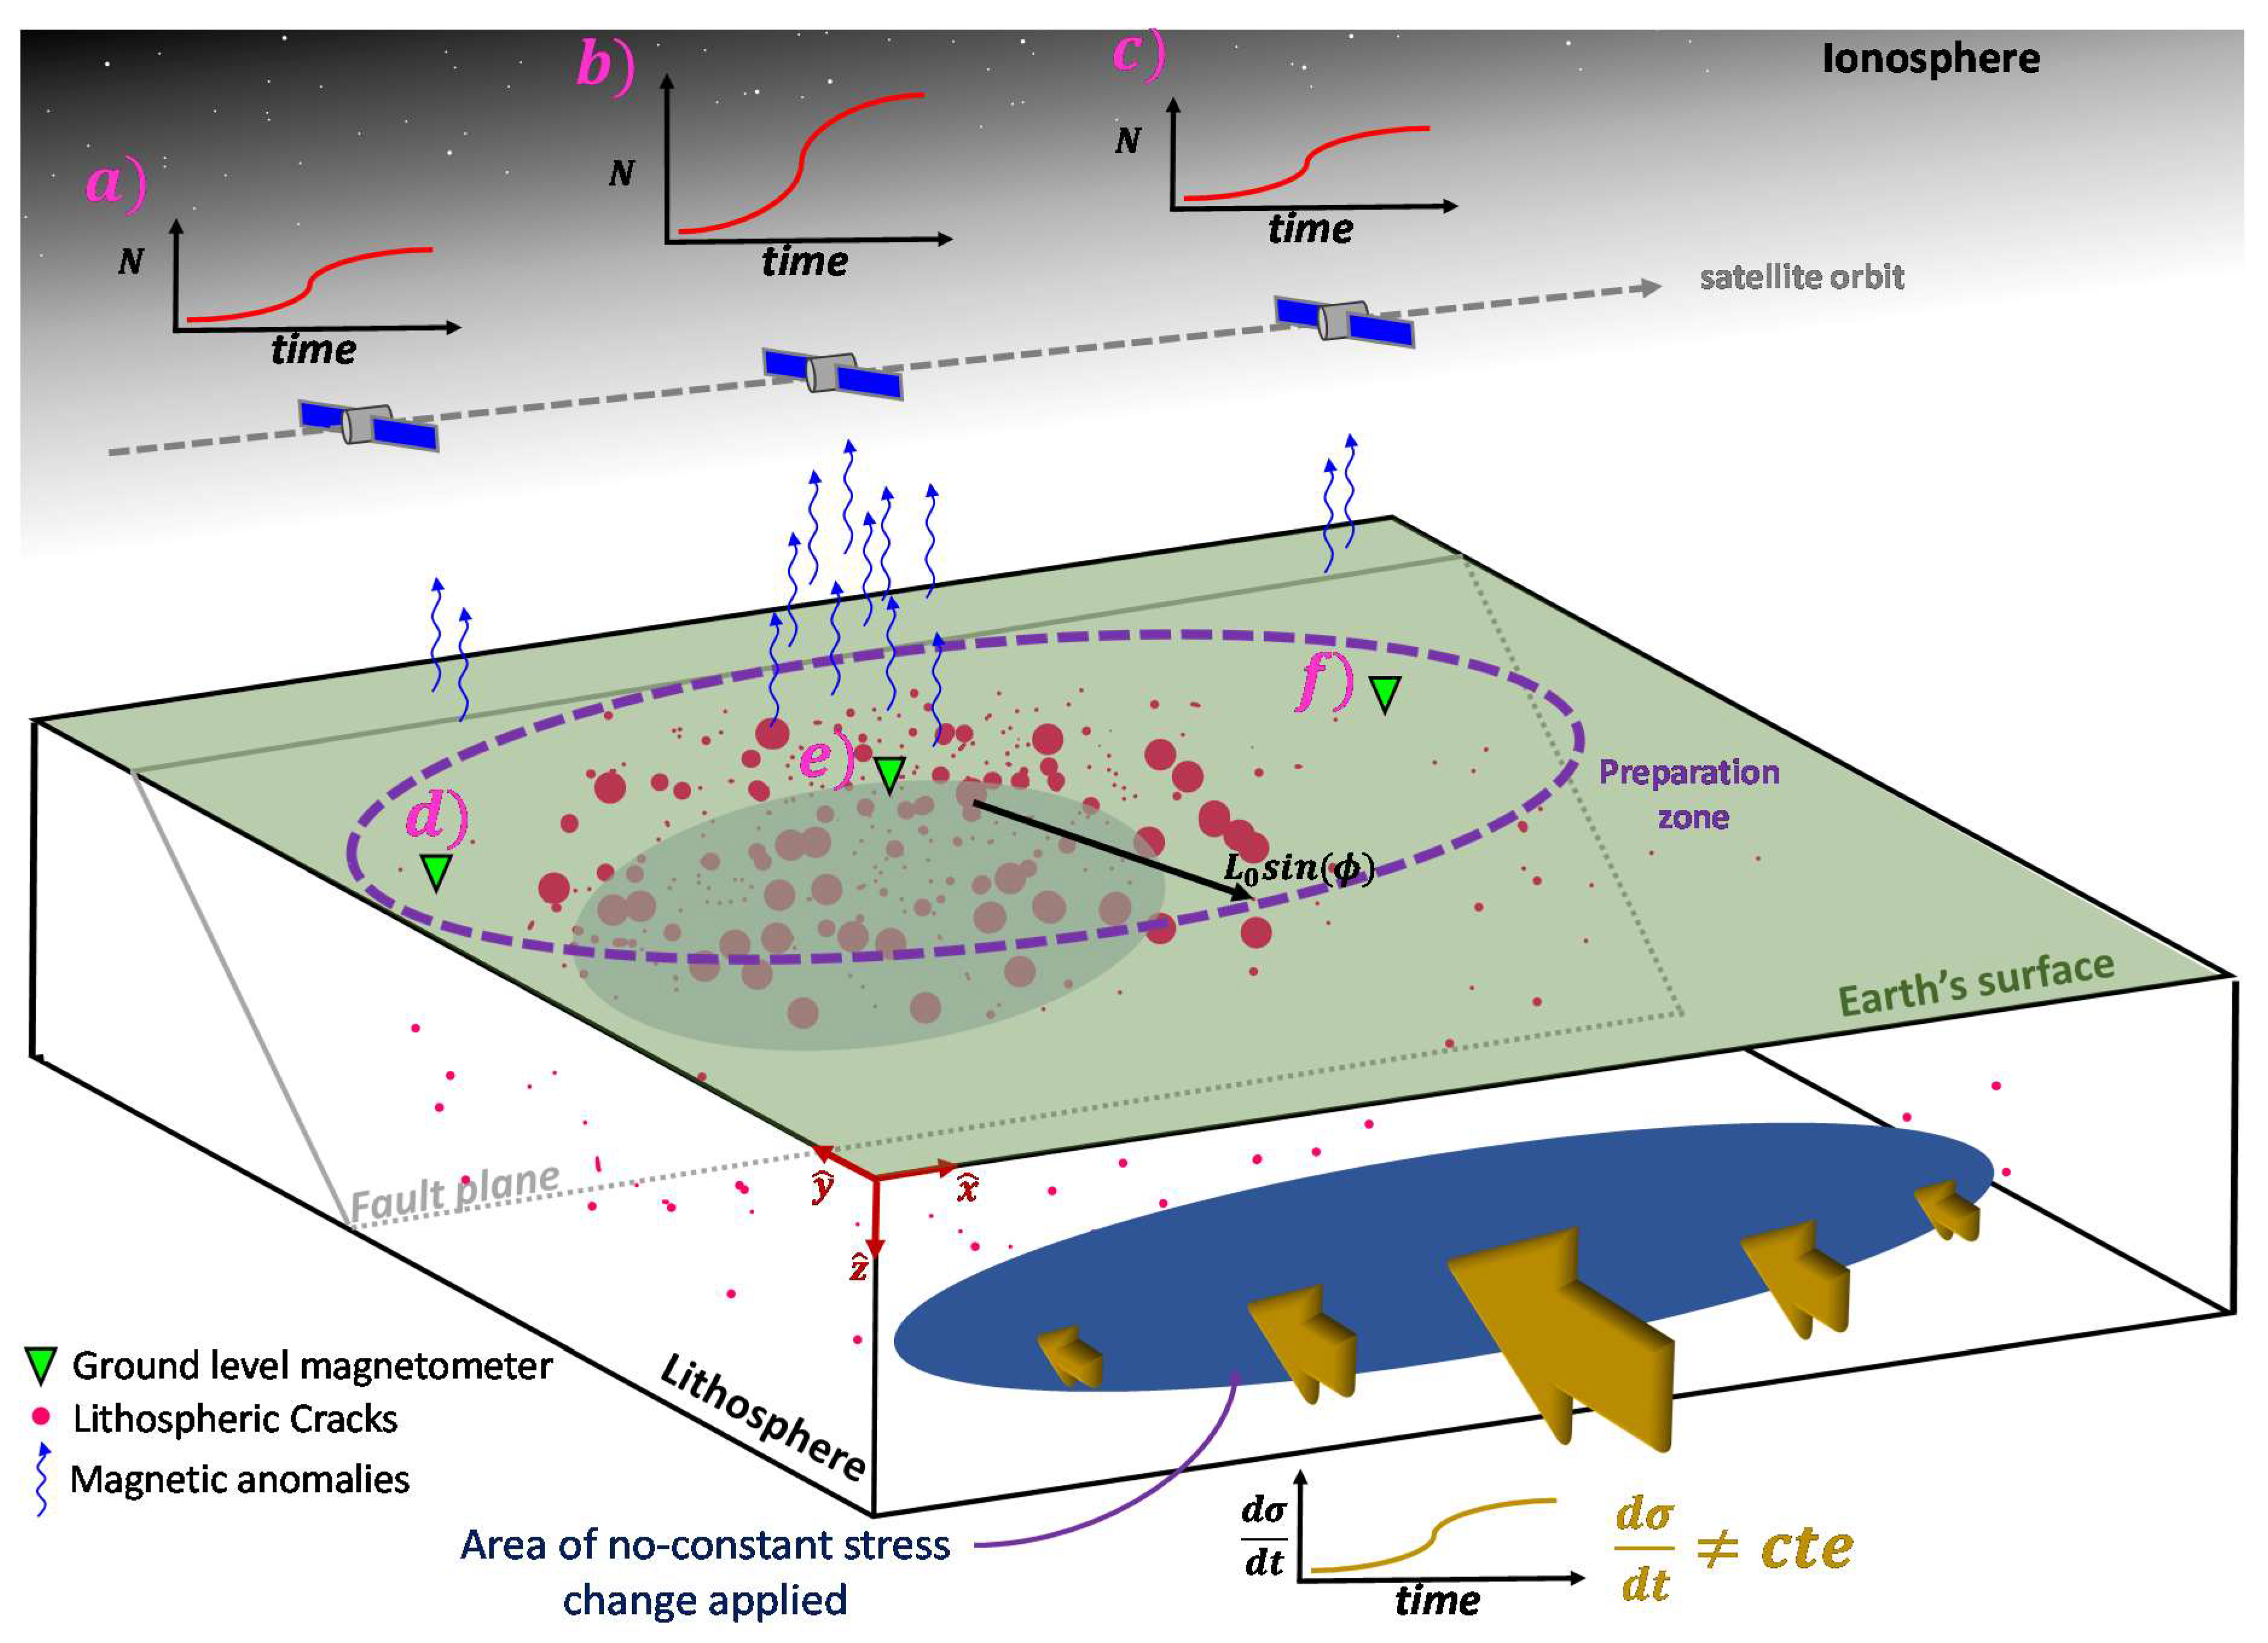
Despite cracks occurring within the lithosphere, the magnetic anomalies generated by those cracks can be measured outside the lithosphere, either atmosphere or ionosphere [5,8,9,10,18,19,20]. Then, it is expected that they can be measured at atmospheric and ionospheric level by replicating Equation (5). Figure 3 shows a schematic representation of the proposed model defined by Equation (5). The cracks, represented by magenta points, are clustered close to the impending earthquake (blue patch on the fault). The generation of these cracks releases electromagnetic pulses that can be measured either at ground [8] or ionospheric level [21,22]. Specifically, Figure 3a–c show the number of magnetic anomalies that any satellite should measure at those specific positions, with respect to the center of the crack clustering. The case of Figure 3a shows that the number of anomalies is lower compared to those obtained at the position shown in Figure 3b because the latter are closer to the clustering center. After the satellite passes the center of the crack clustering, the number of anomalies should decrease up to values similar to those found in the position shown in Figure 3a. This can be seen in the schematic plots shown in Figure 3a–c. Similarly, the magnetic anomalies should also be measured at ground level at each static station (green inverse triangles in Figure 3d–f). The number of daily anomalies should also depend on their proximity to the clustering center. That is why stations from Figure 3e should measure the larger number of anomalies. Note that the shape of N is always the same and the maximum N corresponds to the main difference between different stations, regardless of whether they are located at ground or ionospheric level.
The localization occurs as follows: let us consider two stations at a given time. Then, the number of anomalies is described as N 1 r 1 D s c and N 2 r 2 D s c for station 1 and 2, respectively. If N 2 > N 1 implies that r 2 is closer to the crack clustering and, therefore, to the impending earthquake location. Then, the localization improves if the comparison process is done among different stations and at different times.

3.1. Diffusion Effect for Other Pre-Earthquake Signals

Equation (5) is used for any anomaly that is generated by cracks as magnetic or electric signals within the lithosphere [10]. Nevertheless, Equation (5) does not necessarily describe the spatial variability of other pre-earthquake signals such as aerosol distribution, Radon gas generation, chemical reactions or ionospheric electron density content, because all of them could be affected by the diffusion process. Note that all the physical variables that can be affected by diffusivity are called diffusive parameters hereinafter. This means that the spatial distribution of the number of anomalous diffusive parameters could be different to that described in Equation (5). One way to incorporate the diffusive effect into Equation (5) is by considering a diffusive factor for each diffusive parameter. That is, let us consider the total number of anomalies from all the n different pre-earthquake signals N T as:
N T = N 1 + N 2 + + N n
It is important to note that all the processes considered in Equation (6) have the same origin: cracks generated by stress changes. Thus, the number of non-diffusive anomalies could be considered the closest to real cracks. Nonetheless, the number of diffusive anomalies could be lower because of the loss of energy. This means that there must be a factor that takes into account the reduction in the expected diffusive number of anomalies, depending on the physical nature of the considered phenomenon. For example, the diffusivity of ionospheric disturbs is not necessarily the same as the diffusivity related to radon gas emission because the former lies in plasma physics and the latter in the porosity of solids. Thus, expressing Equation (6) in terms of the non-diffusive process is needed.
Let us start by splitting Equation (6) into diffusivity ( N D ) and non-diffusivity ( N N D ) parameters as:
N T = N N D + N D  
Here, those parameters that are characterized by a non-diffusivity number of anomalies should be described by Equation (5). Then, Equation (7) becomes:
N T = α N + N N D      
where α is a constant. By applying the above-mentioned factor to non-diffusivity parameters, Equation (8) becomes:
N T = α N + k n Γ k N
where the sum considers all the non-diffusive parameters from k to n and Γ is a diffusive factor for each specific physical variable. It is important to note that the factors α and Γ k could depend on the spatial and temporal localization, as well as the height h , where the measurement is being performed. For example, let us consider the anomalous number of magnetic, Radon gas and electron density content at different heights. For ground level, there is no electron density content which implies that the total pre-signal anomalies must be given by N T N m a g n e t i c + N R a d o n . Let us consider now that there are no radon gas releases at ionospheric levels. This implies that the total number of anomalies must be obtained by N T N m a g n e t i c + N e l e c t r o n . If only magnetic anomalies are considered at ground level, then N T N m a g n e t i c , and if the magnetic anomalies are considered at ionospheric level, then N T λ N m a g n e t i c , where λ < 1 . This is because magnetic signals decrease with the distance. Then, fewer anomalies should be detected if the same magnetometer is used. Then, the total number of combined pre-earthquake anomalies should be governed by:
N T r , t , h = α + k n Γ k N r , t = ξ r , t , h N r , t ,  
where ξ r , t , h is the total factor that describes the different contributions of each physical phenomenon to the total number of anomalies.

3.2. Example of ξ by Considering Geometrical Attenuation of Magnetic Clustering

Let us consider the magnetic anomalies Δ B a measured at ground level and at ionospheric level at a specific time. The number of anomalies is determined by Equation (3), for both cases. Nonetheless, the magnetic amplitude decreases as 1 / d 2 [9], where d is the distance between the station and the anomaly origin. As the anomalies are defined above a certain threshold ( > Δ B t h r ) [8], the lithospheric magnetic anomalies measured at ionospheric level could be undetectable due to the ionospheric magnetic noise. As the anomalies rise because of the fractal cracks, their amplitude is also fractal [9,23,24]. This implies that the total number of magnetic anomalies in terms of the magnetic threshold is:
N T B = N 0 Δ B t h r Δ B B D s c σ d B = N 0 1 D s c σ Δ B 1 D s c σ Δ B t h r 1 D s c σ
where N 0 is the original number of anomalies generated within the lithosphere. Note that the magnetic threshold also depends on the distance d . In terms of altitude, the magnetic threshold is Δ B t h r d = Δ B t h r h cos ϕ   , where h is the altitude and ϕ the angle between the position of measurement and the zenith.
In normal conditions, at each level, it is possible to measure a certain number of anomalies. For example, N r g and N r i for the real measured anomalies at ground and ionospheric levels, respectively. Nevertheless, at ground level, there are missing anomalies between the real minimum anomalies B 0 and the magnetic threshold. That is, the real number of magnetic anomalies at ground level N T B g is
N T B g = N r g + N 0 1 D s c σ Δ B t h r g 1 D s c σ B 0 1 D s c σ
Similarly, the number of anomalies at ionospheric level should include the missing anomalies from B 0 up to Δ B t h r i . Then, the real number of anomalies at ionospheric level N T B i is:
N T B i = N r i + N 0 1 D s c σ Δ B t h r i 1 D s c σ B 0 1 D s c σ
By considering the total number of anomalies:
N T r , t , h = N 0 + N T B g + N T B i = ξ N 0
It is possible to determine that the factor ξ is:
ξ r , h = 1 + N r g + N r i + 1 1 D s c σ Δ B t h r g 1 D s c σ + Δ B t h r i 1 D s c σ 2 B 0 1 D s c σ
where the terms N r g and N r i contains the radial component r and the terms within the brackets the altitude information h in the magnetic thresholds.

4. Discussion

Several magnetic anomalies have been studied within the preparation area [5,8,18]. Most of these studies are restricted to a specific area, which are defined after the occurrence of large earthquakes. In addition, these anomaly studies could be considered useless in order to use pre-earthquake signals as forecast tools because the preparation area could span over hundreds, or even thousands, of kilometers [7]. The lack of spatial resolution of the data does not help to identify where an earthquake could strike. In addition, anomalies of specific physical phenomena could be regarded as false positives or non-earthquake related. For example, some ionospheric and magnetic studies are constantly challenged because some results that are attributed to lithospheric origin come from space disturbances are unrelated to earthquakes e.g., [25]. Nonetheless, if anomalies of several physical phenomena rise in similar times and at the same place, and exhibit similar localization, it means that they are connected by similar lithospheric origins, according to the seismo-electromagnetic theory. That is why multiparametric anomaly studies, described by Equations (6)–(9), and particularly, by the function ξ , are needed.
Despite this lack of multiparametric studies, there are a few promising works that show the spatial distribution of simultaneously ionospheric and atmospheric anomalies being located, mainly close to the Sunda Plate boundaries before the occurrence of the 2018 Mw = 7.5 Indonesia earthquake supplementary video in [26]. This link between the ionospheric and atmospheric measurements validates the atmospheric and ionospheric coupling of the LAIC effect. Nevertheless, the lithospheric origin of these signals is still not clear. To date, one of the most interesting explanations comes from the chemical activation of different crustal Peroxy as a result of stress changes in the upper section of the lithosphere [27]. Another explanation of the physical mechanism is described by the seismo-electromagnetic theory, in which the electromagnetic signals come from the self-similar crack of the lithosphere [9,10,15,28,29]. Both interpretations are supported by the fact that the Earth’s crust is stressed differently at different zones. For example, there are zones close to the convergent margin where the crust accelerates more than other zones, which implies stress accumulation and deformation before earthquakes [30]. Nevertheless, this stress accumulation is the physical process that generates fractally distributed cracks, which are also characterized by spatial localization [9,14,24,31,32], and are shown by the spatial–temporal ionospheric and atmospheric measurements [26]. In other words, the spatial–temporal properties of ionospheric and atmospheric measurements are well described by the spatial gradient of the distribution of cracks within the lithosphere (Equation (5)). This means that Equation (5) is consistent with theoretical works of fractals [9,19], experimental works on rock samples [10,14], geodetic field studies [30] and the atmospheric–ionospheric measurements close tectonic plate boundaries [26]. By adding that the lithospheric fractal cracking can also describe the wide range of electromagnetic frequencies related to impending earthquakes [9], the order of magnitude of magnetic anomalies that can disturb the ionosphere [9,33,34] and the description of earthquake magnitude by using co-seismic magnetic signals [9], it is possible to conclude that the lithospheric contribution to the LAIC effect is dominated by the spatial–temporal generation and distribution of cracks within the stressed lithosphere. That is, the atmospheric and ionospheric measurements correspond to a manifestation of the electromagnetic signals generated from the lithospheric cracking. This implies that a chemical reaction that could describe other and rarer effects, such as Radon gas generation or thermal changes [35,36,37,38,39,40], could be considered as a secondary or complementary effect of stressed rocks because it is not able to describe most of the abovementioned main features by itself. In addition, it is important to note that up to now, the LAIC effect is mainly focused on describing the coupling of different measurements by several chain processes but still lacks the link with standard seismology and their key properties or concepts. For example, there is no mention of the seismic moment M 0 in works related to precursor studies of the LAIC effect [33,35], while few studies correlate electric measurements to seismicity or laboratory experiments [41,42,43,44]. In contrast, the seismo-electromagnetic theory can link the standard seismological concept as the seismic moment, the stress drop and the change of the b-value before and after the main earthquake or even the spatial–temporal changes of the friction and seismic coupling on faults [9,44,45].
Regarding the fractal dimension in terms of thermodynamic forces (Appendix A), it can be highlighted that the increases in stress generate the reduction in the fractal dimension of the system for a constant or small thermodynamic flux J μ . This result is in agreement with the measurements. For instance, there is evidence that shows how the multifractal analysis is linked to seismicity. Particularly, [46] shows that the fractal dimension and seismicity are negatively correlated. That is, a lower fractal dimension increases the seismicity. Here, we have shown that this relation can be described physically by Equations (A5)–(A9). In terms of the surface of rocks, the lower the fractal dimension, the smoother the surface [47]. This indicates that the fault’s smoothness could occur due to the rise of stresses. Thus, the increases in stresses imply an increase in seismicity because it could be linked to the reduction in geometrical irregularities that lock faults. Note that stress increases generate slips that smooth the fault’s surface even further e.g., [48]. In mechanical terms, the energy per unit of area required to generate the seismic rupture (Fracture energy G C ) linearly depends on the geometrical irregularities, λ C , by a parameter known as slip weakening distance, D C [49]. This implies that the smoothness of faults reduces the resistance of faults to slip. Thus, the decrease in the thermodynamic fractal dimension shown in Equations (A5)–(A9) explains the physics of earthquake nucleation.
In more general terms, Equations (A6)–(A8) reveals that the thermodynamic fractal dimension depends on the ratio of the scaled and non-scaled entropy change. If the scaled (non-scaled) entropy changes represent the largest (smallest) parts of the system, it means that the decrease (increase) in D s c is dominated by the large (small) scale of the system. For example, Equations (A7) and (A8) indicates that fractal surfaces, such as faults, are rough (smooth) if the entropy increase is mainly driven by the small (large) scale of the system.
On the other hand, as the measurements indicate [24,26,50], the Atmospheric–Ionospheric measurements resemble the main spatial–temporal feature of the clustering which is a key feature of fractally distributed cracks. That is why Section 3.2 shows how the total anomalies generated by the clustering of fractal pre-seismic magnetic signals at ground and ionospheric level could be described by using the function ξ . Then, future works should be focused in order to improve the model of clustering localization by considering the correction shown in Equation (10) (Equation (15) proposed for solely magnetic measurement). That is, include other complex properties such as the geometry of the tectonic boundaries, more studies regarding the distribution of spatial anomalies and what is the contribution of each physical pre-earthquake variable to the total number of spatial–temporal anomalies.

5. Conclusions

It could be considered that the multiparametric studies regarding pre-earthquakes signals should be focused on common features such as fractal localization. That is why the main conclusions are:
  • Diffusive phenomena could not be a reliable precursor tool by itself.
  • The common fractal origin of the complex multiparametric anomalies prior to impending earthquakes must follow similar temporal and spatial properties.
  • Each effort regarding earthquake prediction must be done by considering several physical phenomena.
  • The Lithosphere–Atmosphere–Ionosphere coupling (LAIC effect) could be regarded as the results of the localization of the anomalies described in the seismo-electromagnetic theory.
  • No explanation of the LAIC effect could be done with no consideration of the common origin within the lithospheric dynamics.
  • The identification of the factor ξ r , t , h for each diffusive and non-diffusive phenomena could allow the development of further early warning systems.
  • The rise of anomalies could be related to changes in frictional and seismic coupling parameters on faults.
Regarding the thermodynamic fractal dimension, it can be concluded that:
  • It can be defined by a thermodynamic fractal dimension in terms of forces, fluxes and entropy.
  • The thermodynamic fractal dimension might be reduced (increased) when large (small) scale forces are applied to the system.
  • The thermodynamic fractal dimension is a physical parameter that describes the trade-off of the entropy increase between the smallest and largest scales of any self-affine system.
  • In fractal surfaces, the smoothness (roughness), due to the entropy increase, is dominated by the large (small) scale.
  • The decreases in the thermodynamic fractal dimension could be linked to the localization of anomalous pre-seismic signals and seismicity itself that are generated by large-scale stress increase.

Author Contributions

P.V.-A. proposed the core idea, mathematical development, and initial draft of the project. E.C. and D.L. contributed to the scientific discussions of the work. All authors have read and agreed to the published version of the manuscript.

Funding

This research was funded by Centers of Excellence with BASAL/ANID financing, Grant Nos. AFB180001, CEDENNA.

Data Availability Statement

All the data are open source and can be found using the references that are listed in the text.

Acknowledgments

The authors thank to Francesca Cordaro and Marcela Larenas for their strong support. The authors also thanks to Roxana Trujillo for her time and dedication reading this manuscript.

Conflicts of Interest

The authors declare that they have no conflicts of interest.

Appendix A

From reference [15], the temporal change of entropy d S μ / d t is related to the kth thermodynamic flux J k μ by the resistance coefficient K k l μ as:
d S μ d t = k = 1 M l = 1 m K k l μ J k μ J l μ  
where the resistance can be written in terms of the characteristic length r μ as:
K k l μ = r μ r 0 α K k l μ                    
where r 0 is a constant. Equation (A2) into Equation (A1) leads to the equation:
d S μ d t = r μ r 0 α k = 1 M l = 1 m K k l μ J k μ J l μ
This equation can be written as:
α = log d S μ d t k = 1 M l = 1 m K k l μ J k μ J l μ log r μ r 0
Nevertheless, this power is related to the Euclidean dimension D E and the fractal dimension by the relation α = D E D s c 1 [15]. This implies that Equation (A4) becomes:
D s c = D E 1 log d S μ d t k = 1 M l = 1 m K k l μ J k μ J l μ log r μ r 0
Equivalently, Equation (A5) can be written in terms of thermodynamic forces as:
D s c = D E 1 log i = 1 Q j = 1 q L i j μ X i μ X j μ k = 1 M l = 1 m K k l μ J k μ J l μ log r μ r 0
where L i j μ corresponds to the conductance coefficient. Equivalent, in terms of entropy change:
D s c = D E 1 k V log d S μ d S 0 μ
where d S μ is the differential form of Equation (A1), d S 0 μ is the non-scaled entropy change define by means of Equation (A2) and k V corresponds to the factor that represents the volumetric scale and is defined as k V = 1 / log r μ r 0 . Note that r μ represent the length of the largest scale in the system. This means that k V is constant for self-affine systems. Additionally, even a simplest form of the fractal dimension can be written as:
D s c = k V log Ω V
where Ω V = d S μ / d S 0 μ e 1 D E k V     and log   is the natural logarithm function. Note that Ω V is always positive because the exponential term is always positive as well as the second law of thermodynamics states that d S 0 . Equation (A8) is valid when both the original and the scaled system have non-zero entropy change. This implies that the fractal dimension rises when systems are non-reversible and dissipative. Equations (A5) and (A6) means that the fractal dimension can be written terms of thermodynamics quantities as entropy change, forces, fluxes resistivity, conductance and characteristic length. That is why this fractal dimension can be named as ‘thermodynamic fractal dimension’.
Particularly, the forces are the stress function X μ σ in this system. This implies that the fractal dimension can be written explicitly in terms of σ as:
D s c σ log σ 2  
Equation (A9) means that the increase in stress reduces the fractal dimension.

References

  1. Ben-Zion, Y.; Zaliapin, I. Localization and coalescence of seismicity before large earthquakes. Geophys. J. Int. 2020, 223, 561–583. [Google Scholar] [CrossRef]
  2. Kato, A.; Ben-Zion, Y. The generation of large earthquakes. Nat. Rev. Earth Environ. 2021, 2, 26–39. [Google Scholar] [CrossRef]
  3. Sibson, R.H. Preparation zones for large crustal earthquakes consequent on fault-valve action. Earth Planets Space 2020, 72, 31. [Google Scholar] [CrossRef]
  4. McBeck, J.A.; Zhu, W.; Renard, F. The competition between fracture nucleation, propagation, and coalescence in dry and water-saturated crystalline rock. Solid Earth 2021, 12, 375–387. [Google Scholar] [CrossRef]
  5. De Santis, A.; De Franceschi, G.; Spogli, L.; Perrone, L.; Alfonsi, L.; Qamili, E.; Cianchini, G.; Di Giovambattista, R.; Salvi, S.; Filippi, E.; et al. Geospace perturbations induced by the Earth: The state of the art and future trends. Phys. Chem. Earth Parts A/B/C 2015, 85–86, 17–33. [Google Scholar] [CrossRef] [Green Version]
  6. Özsöz, İ.; Ankaya Pamukçu, O. Detection and interpretation of precursory magnetic signals preceding October 30, 2020 Samos earthquake. Turk. J. Earth Sci. 2021, 30, 748–757. [Google Scholar] [CrossRef]
  7. Dobrovolsky, I.R.; Zubkov, S.I.; Myachkin, V.I. Estimation of the size of earthquake preparation zones. Pure Appl. Geophys. 1979, 117, 1025–1044. [Google Scholar] [CrossRef]
  8. Cordaro, E.G.; Venegas-Aravena, P.; Laroze, D. Long-term magnetic anomalies and their possible relationship to the latest greater Chilean earthquakes in the context of the seismo-electromagnetic theory. Nat. Hazards Earth Syst. Sci. 2021, 21, 1785–1806. [Google Scholar] [CrossRef]
  9. Venegas-Aravena, P.; Cordaro, E.G.; Laroze, D. A review and upgrade of the lithospheric dynamics in context of the seismo-electromagnetic theory. Nat. Hazards Earth Syst. Sci. 2019, 19, 1639–1651. [Google Scholar] [CrossRef] [Green Version]
  10. Vallianatos, F.; Tzanis, A. On the nature, scaling and spectral properties of pre-seismic ULF signals. Nat. Hazards Earth Syst. Sci. 2003, 3, 237–242. [Google Scholar] [CrossRef]
  11. McBeck, J.; Aiken, J.M.; Ben-Zion, Y.; Renard, F. Predicting the proximity to macroscopic failure using local strain populations from dynamic in situ X-ray tomography triaxial compression experiments on rocks. Earth Planet. Sci. Lett. 2020, 543, 116344. [Google Scholar] [CrossRef]
  12. McBeck, J.A.; Aiken, J.M.; Mathiesen, J.; Ben-Zion, Y.; Renard, F. Deformation Precursors to Catastrophic Failure in Rocks. Geophys. Res. Lett. 2020, 47, e2020GL090255. [Google Scholar] [CrossRef]
  13. Kandula, N.; Cordonnier, B.; Weiss, J.; Dysthe, D.K.; Renard, F. Dynamics of microscale precursors during brittle compressive failure in Carrara marble. J. Geophys. Res. 2019, 124, 6121–6139. [Google Scholar] [CrossRef]
  14. McBeck, J.; Ben-Zion, Y.; Renard, F. Fracture Network Localization Preceding Catastrophic Failure in Triaxial Compression Experiments on Rocks. Front. Earth Sci. 2021, 9, 778811. [Google Scholar] [CrossRef]
  15. Venegas-Aravena, P.; Cordaro, E.G.; Laroze, D. Natural Fractals as Irreversible Disorder: Entropy Approach from Cracks in the Semi Brittle-Ductile Lithosphere and Generalization. Entropy 2022, 24, 1337. [Google Scholar] [CrossRef]
  16. Stakhovsky, I.R. Scale Invariant Structure of Lithosphere Earthquake Source. In Processes in GeoMedia—Volume III; Chaplina, T., Ed.; Springer Geology: Cham, Switzerland, 2021. [Google Scholar] [CrossRef]
  17. Mandelbrot, B.B. The Fractal Geometry of Nature; W. H. Freeman: San Francisco, CA, USA, 1983; 468p. [Google Scholar]
  18. Florios, K.; Contopoulos, I.; Christofilakis, V.; Tatsis, G.; Chronopoulos, S.; Repapis, C.; Tritakis, V. Pre-seismic Electromagnetic Perturbations in Two Earthquakes in Northern Greece. Pure Appl. Geophys. 2020, 177, 787–799. [Google Scholar] [CrossRef]
  19. Wang, J.-H. A compilation of precursor times of earthquakes in Taiwan. Terr. Atmos. Ocean. Sci. 2021, 32, 411–441. [Google Scholar] [CrossRef]
  20. Schekotov, A.; Hayakawa, M. Seismo-meteo-electromagnetic phenomena observed during a 5-year interval around the 2011 Tohoku earthquake. Phys. Chem. Earth 2015, 85–86, 167–173. [Google Scholar] [CrossRef]
  21. Xiong, P.; Long, C.; Zhou, H.; Battiston, R.; De Santis, A.; Ouzounov, D.; Zhang, X.; Shen, X. Pre-Earthquake Ionospheric Perturbation Identification Using CSES Data via Transfer Learning. Front. Environ. Sci. 2021, 9, 779255. [Google Scholar] [CrossRef]
  22. De Santis, A.; Marchetti, D.; Perrone, L.; Campuzano, S.A.; Cianchini, G. Statistical correlation analysis of strong earthquakes and ionospheric electron density anomalies as observed by CSES-01. Il Nuovo Cim. C 2021, 44, 1–4. [Google Scholar] [CrossRef]
  23. Smirnova, N.A.; Hayakawa, M. Fractal characteristics of the ground-observed ULF emissions in relation to geomagnetic and seismic activities. J. Atmos. Sol. Terr. Phys. 2007, 69, 1833–1841. [Google Scholar] [CrossRef]
  24. Uritsky, V.; Smirnova, N.; Troyan, V.; Vallianatos, F. Critical dynamics of fractal fault systems and its role in the generation of pre-seismic electromagnetic emissions. Phys. Chem. Earth 2004, 29, 473–480. [Google Scholar] [CrossRef]
  25. Tozzi, R.; Masci, F.; Pezzopane, M. A stress test to evaluate the usefulness of Akaike information criterion in short-term earthquake prediction. Sci. Rep. 2020, 10, 21153. [Google Scholar] [CrossRef] [PubMed]
  26. Marchetti, D.; De Santis, A.; Shen, X.; Campuzano, S.A.; Perrone, L.; Piscini, A.; Di Giovambattista, R.; Jin, S.; Ippolito, A.; Cianchini, G.; et al. Possible Lithosphere-Atmosphere-Ionosphere Coupling effects prior to the 2018 Mw = 7.5 Indonesia earthquake from seismic, atmospheric and ionospheric data. J. Asian Earth Sci. 2020, 188, 104097. [Google Scholar] [CrossRef]
  27. Freund, F. Pre-earthquake signals: Underlying physical processes. J. Asian Earth Sci. 2011, 41, 383–400. [Google Scholar] [CrossRef]
  28. Stroh, A.N. The Formation of Cracks in Plastic Flow II. Philos. Trans. R. Soc. Lond. 1955, A232, 548–560. [Google Scholar] [CrossRef]
  29. Fan, H. Interfacial Zener-Stroh Crack. ASME J. Appl. Mech. 1994, 61, 829–834. [Google Scholar] [CrossRef]
  30. Bedford, J.R.; Moreno, M.; Deng, Z.; Oncken, O.; Schurr, B.; John, T.; Báez, J.C.; Bevis, M. Months-long thousand-kilometre-scale wobbling before great subduction earthquakes. Nature 2020, 580, 628–635. [Google Scholar] [CrossRef]
  31. Vallianatos, F.; Triantis, D. Scaling in Pressure Stimulated Currents related with rock fracture. Physica A 2008, 387, 4940–4946. [Google Scholar] [CrossRef]
  32. Anastasiadis, C.; Triantis, D.; Stavrakas, I.; Vallianatos, F. Pressure Stimulated Currents (PSC) in marble samples. Ann. Geophys. 2004, 47, 21–28. [Google Scholar] [CrossRef]
  33. Kuo, C.L.; Lee, L.C.; Huba, J.D. An improved coupling model for the lithosphere-atmosphere-ionosphere system. J. Geophys. Res. Space Phys. 2014, 119, 3189–3205. [Google Scholar] [CrossRef]
  34. Kelley, M.C.; Swartz, W.E.; Heki, K. Apparent ionospheric total electron content variations prior to major earthquakes due to electric fields created by tectonic stresses. J. Geophys. Res. Space 2017, 122, 6689–6695. [Google Scholar] [CrossRef]
  35. Pulinets, S.; Ouzounov, D. Lithosphere–Atmosphere–Ionosphere Coupling (LAIC) model—An unified concept for earthquake precursors validation. J. Asian Earth Sci. 2011, 41, 371–382. [Google Scholar] [CrossRef]
  36. Sornette, D.; Ouillon, G.; Mignan, A.; Freund, F. Preface to the Global Earthquake Forecasting System (GEFS) special issue: Towards using non-seismic precursors for the prediction of large earthquakes. Eur. Phys. J. Spec. Top. 2021, 230, 1–5. [Google Scholar] [CrossRef]
  37. Zhang, Y.; Meng, Q.; Ouillon, G.; Sornette, D.; Ma, W.; Zhang, L.; Zhao, J.; Qi, Y.; Gengh, F. Spatially variable model for extracting TIR anomalies before earthquakes: Application to Chinese Mainland. Remote Sens. Environ. 2021, 267, 112720. [Google Scholar] [CrossRef]
  38. Muto, J.; Yasuoka, Y.; Miura, N.; Iwata, D.; Nagahama, H.; Hirano, M.; Ohmomo, Y.; Mukai, T. Preseismic atmospheric radon anomaly associated with 2018 Northern Osaka earthquake. Sci. Rep. 2021, 11, 7451. [Google Scholar] [CrossRef]
  39. Enomoto, Y.; Yamabe, T.; Sugiura, S.; Kondo, H. Laboratory investigation of coupled electrical interaction of fracturing rock with gases. Earth Planets Space 2021, 73, 90. [Google Scholar] [CrossRef]
  40. Hwa Oh, Y.; Kim, G. A radon-thoron isotope pair as a reliable earthquake precursor. Sci. Rep. 2015, 5, 13084. [Google Scholar] [CrossRef] [Green Version]
  41. Chen, H.-J.; Chen, C.-C.; Ouillon, G.; Sornette, D. A paradigm for developing earthquake probability forecasts based on geoelectric data. Eur. Phys. J. Spec. Top. 2021, 230, 381–407. [Google Scholar] [CrossRef]
  42. Klyuchkin, V.N.; Novikov, V.A.; Okunev, V.I.; Zeigarnik, V.A. Comparative analysis of acoustic and electromagnetic emissions of rocks. IOP Conf. Ser. Earth Environ. Sci. 2021, 929, 012013. [Google Scholar] [CrossRef]
  43. Li, D.; Wang, E.; Li, Z.; Ju, Y.; Wang, D.; Wang, X. Experimental investigations of pressure stimulated currents from stressed sandstone used as precursors to rock fracture. Int. J. Rock Mech. Min. Sci. 2021, 145, 104841. [Google Scholar] [CrossRef]
  44. Heraud, J.A.; Centa, V.A.; Mamani, P.; Menendez, D.; Vilchez, N.; Bleier, T. Some Statistical Results from the Triangulation of Electromagnetic Precursors Occurring at the Subduction Zone, Related with Earthquake Activity in Central Peru. In Proceedings of the 2021 XXXIVth General Assembly and Scientific Symposium of the International Union of Radio Science (URSI GASS), Rome, Italy, 28 August 2021–04 September 2021; pp. 1–4. [Google Scholar] [CrossRef]
  45. Venegas-Aravena, P.; Cordaro, E.G.; Laroze, D. The spatial–temporal total friction coefficient of the fault viewed from the perspective of seismo-electromagnetic theory. Nat. Hazards Earth Syst. Sci. 2020, 20, 1485–1496. [Google Scholar] [CrossRef]
  46. Pastén, D.; Czechowski, Z.; Toledo, B. Time series analysis in earthquake complex networks. Chaos 2018, 28, 083128. [Google Scholar] [CrossRef] [PubMed]
  47. Lee, Y.-H.; Carr, J.R.; Barr, D.J.; Haas, C.J. The fractal dimension as a measure of the roughness of rock discontinuity profiles. Int. J. Rock Mech. Min. Sci. Geomech. Abstr. 1990, 27, 453–464. [Google Scholar] [CrossRef]
  48. Dascher-Cousineau, K.; Kirkpatrick, J.D.; Cooke, M.L. Smoothing of Fault Slip Surfaces by Scale-Invariant Wear. J. Geophys. Res. Solid Earth 2018, 123, 7913–7930. [Google Scholar] [CrossRef]
  49. Ohnaka, M. The Physics of Rock Failure and Earthquakes; Cambridge University Press: Cambridge, UK, 2013. [Google Scholar] [CrossRef]
  50. Fan, M.; Zhu, K.; De Santis, A.; Marchetti, D.; Cianchini, G.; Piscini, A.; He, X.; Wen, J.; Wang, T.; Zhang, Y.; et al. Analysis of Swarm Satellite Magnetic Field Data for the 2015 Mw 7.8 Nepal Earthquake Based on Nonnegative Tensor Decomposition. IEEE Trans. Geosci. Remote Sens. 2022, 60, 2006119. [Google Scholar] [CrossRef]
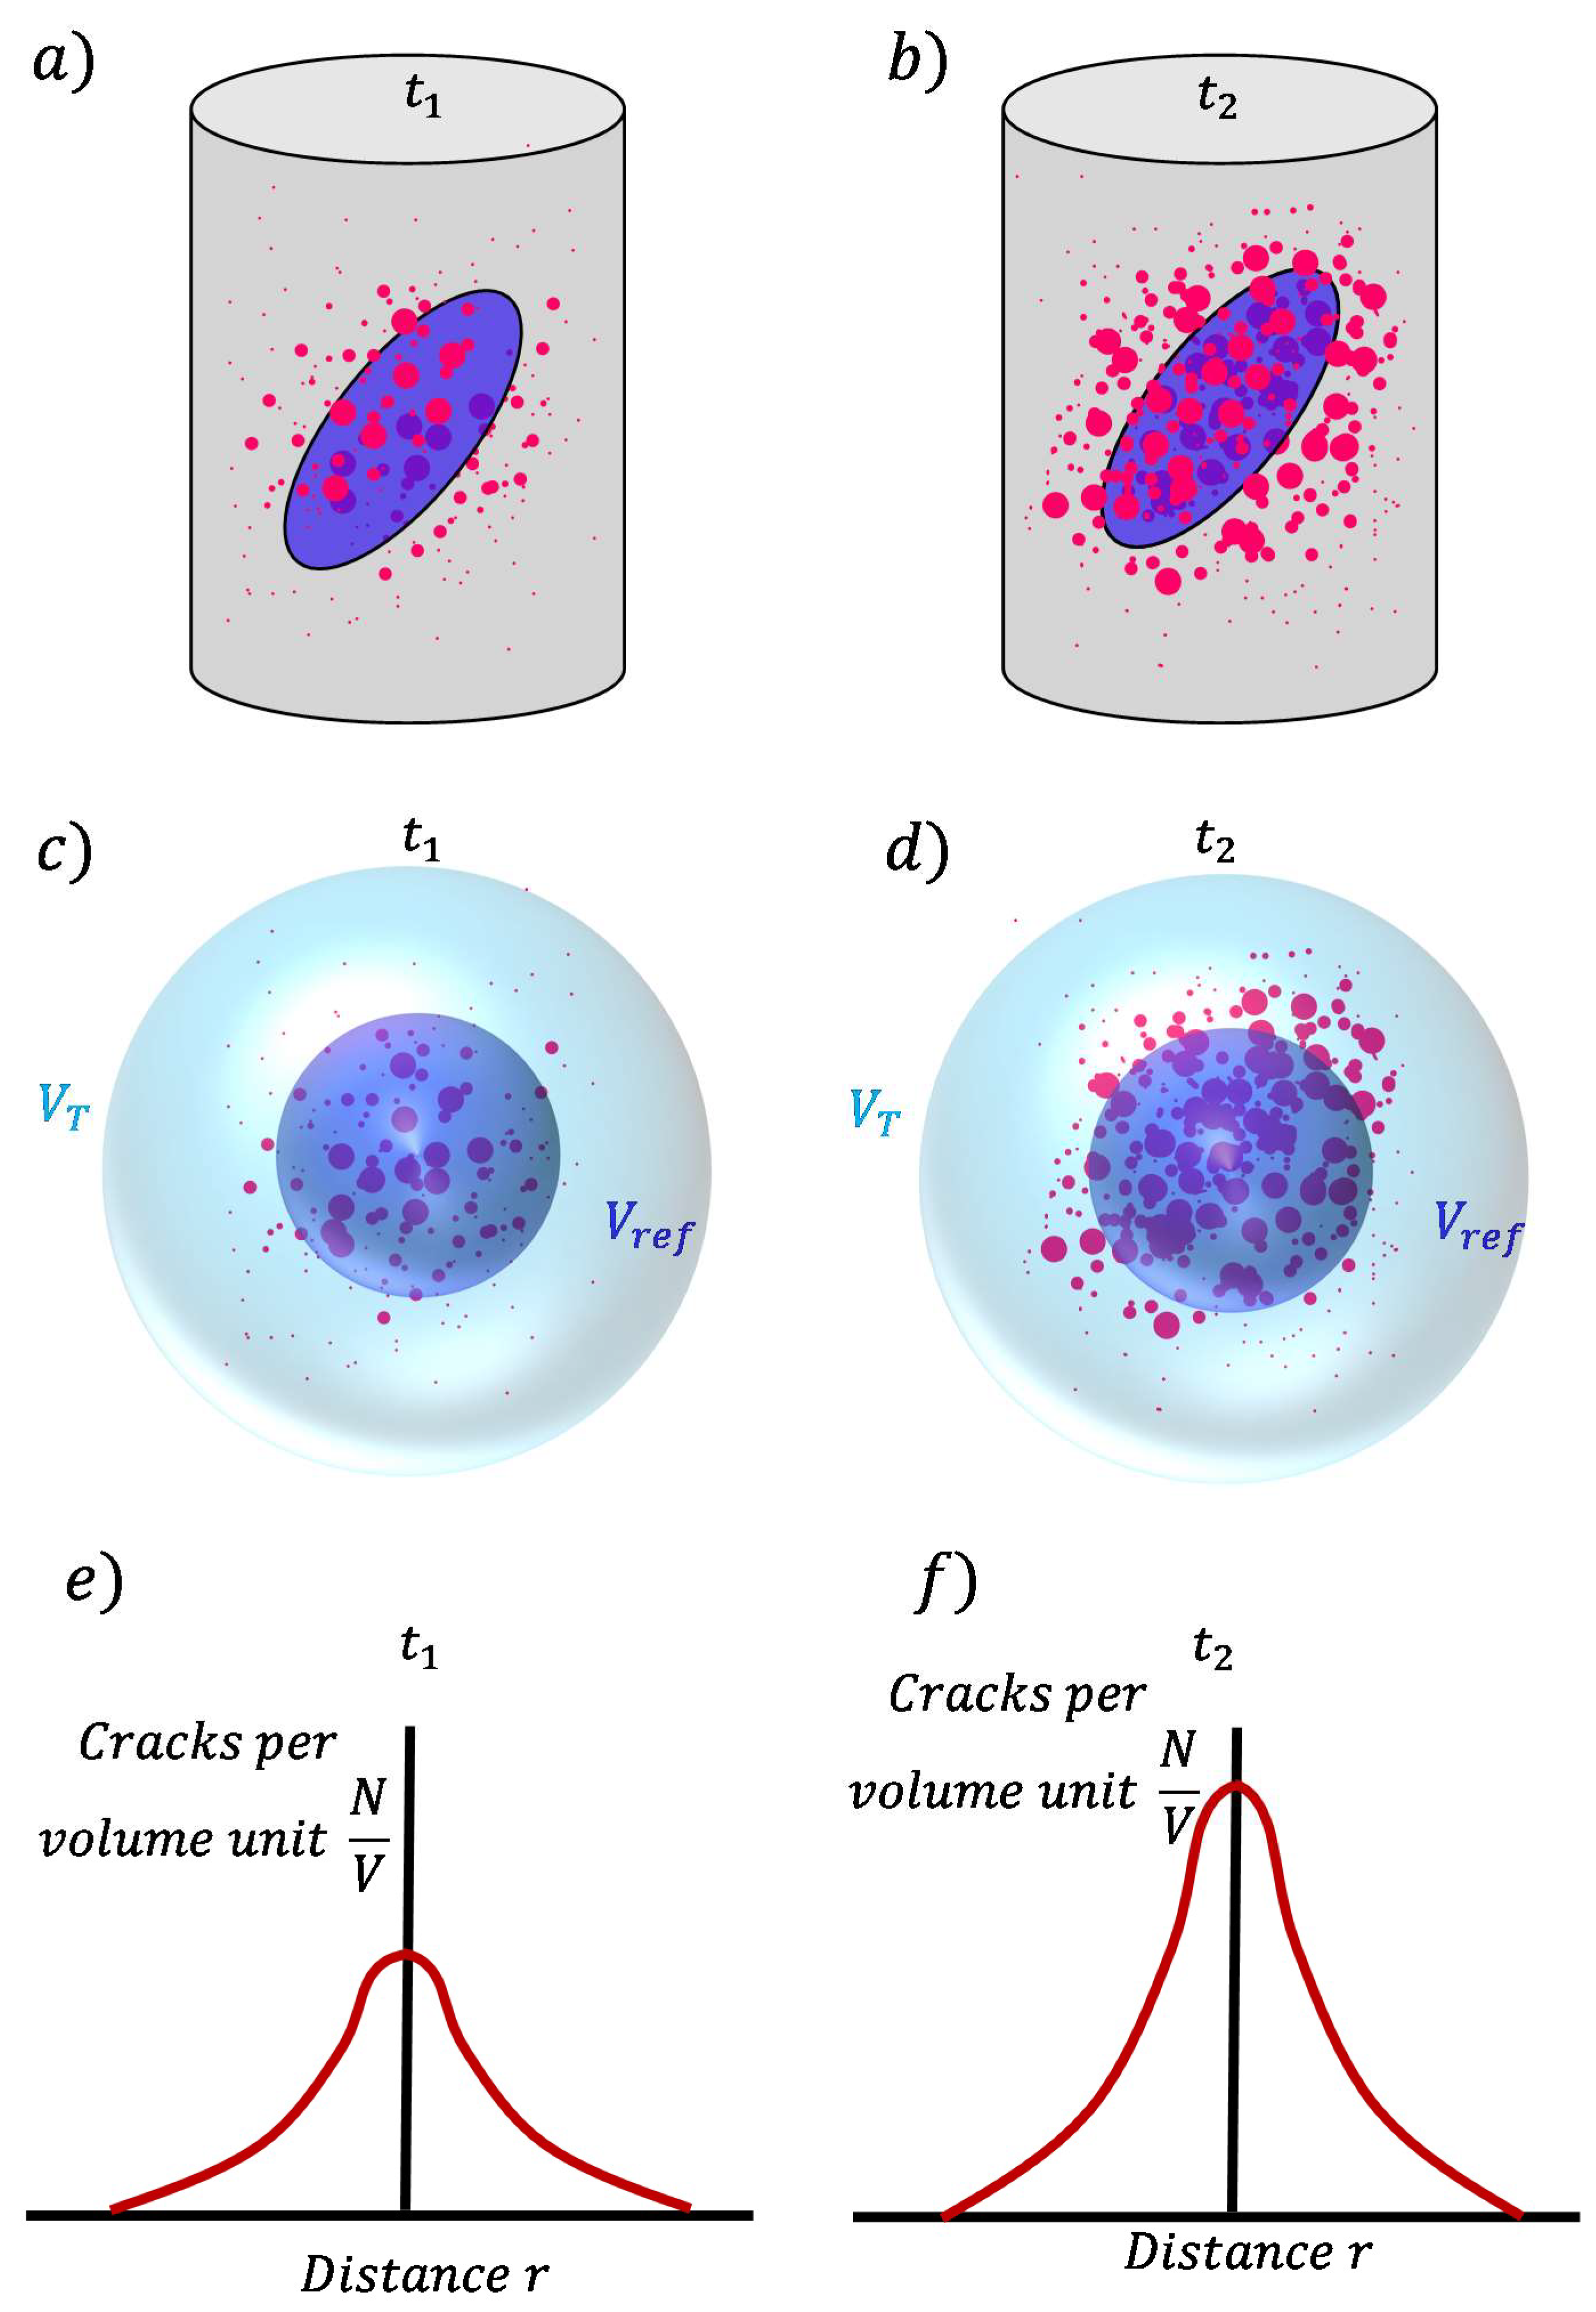
Figure 1. Schematic representation of crack clustering based on results from [11,12,13]. (a) Rock sample’s reaction to triaxial load for two different times. The magenta points represent cracks generated due to the load, and the blue patch represents the impending macroscopic fault. (b) The same physical properties in time t 2 where the load increases. (c,d) represent the amount of crack generated by volume unit. The reference volume is shown as a blue sphere which encloses more cracks than the light blue one does. (e,f) shows the number of cracks per volume area depending on the distance from the center of the reference’s spheres. It is clear that the number of cracks per volume units decreases with distance. Note that the spatial localization increases for time t 2 in (f).
Fractalfract 06 00624 g001
Figure 2. Representation of the number of daily cumulative magnetic anomalies evolution regarding time and position described by Equation (5). (ac) represent the time evolution of Equation (5). Note that the maximum number of anomalies increases while the position r is close to the center. The spatial evolution of the anomalies is shown in (df). Here, the maximum number of anomalies increases within the spatial domain at different times. Then, magnetic anomalies occur close the center of the preparation zone and increases with time. This implies that Equation (5) effectively shows the clustering of cracks and anomalies.
Fractalfract 06 00624 g002
Figure 3. Schematic representation of the generation of magnetic anomalies. It is possible to observe that the cracks (magenta points) are clustered close to the faults (light blue patch) when non-constant stress is applied (yellow arrows). This cracking generates electromagnetic signals (blue curved lines) that can be measured at ground level (green triangles) and at ionospheric level (satellites). Note that all this process occurs only within the preparation zone delimited by the purple-segmented circle. As the cracks are clustered, the closest station and satellites will record more anomalies (b and e) compared to those that are closer to the process zone’s boundary (a, c, d and f).
Fractalfract 06 00624 g003
Publisher’s Note: MDPI stays neutral with regard to jurisdictional claims in published maps and institutional affiliations.