Abstract
Porous alumina ceramics with different porosities were prepared via atmospheric pressure sintering using a sacrificial template method with alumina powder as the raw material and carbon fiber (CF) and graphite as pore-forming agents. The effects of the contents and ratios of the pore-forming agents and the aspect ratios of CF on the microstructure, mechanical properties, pore size, and pore-size distribution of the porous alumina samples were investigated. In addition, the surface fractal dimension (Ds) of porous alumina samples with different pore-forming agents was evaluated based on the mercury intrusion porosimetry data. The pore-size distribution of the prepared porous alumina samples showed single, double, or multiple peaks. The pore structure of the samples maintained the fibrous shape of the original CF and the flake morphology of graphite with a uniform pore-size distribution, but the pore structure and morphology were different. With the increase in the content of the pore-forming agent, the porosity of the samples gradually increased to a maximum of 63.2%, and the flexural strength decreased to a minimum of 12.36 MPa. The pore structure of the porous alumina samples showed obvious fractal characteristics. Ds was closely related to the pore structure parameters of the samples when the content of the pore-forming agent was 70 vol.%. It decreased with an increase in the sample porosity, most probable pore size and median pore size, but increased with an increase in the sample flexural strength.
1. Introduction
Porous ceramics are composite materials constituting a ceramic matrix and gases distributed in numerous internal pores in the ceramic matrix [1,2,3,4,5,6]. It has the advantages of traditional ceramics, such as high-temperature, corrosion, and oxidation resistance, in addition to being lightweight and having a high specific surface area and a low thermal conductivity [7,8,9,10]. The permeability, thermal insulation, and sound absorption properties of porous ceramics are outstanding among many other properties. Such ceramics are vital in high-temperature equipment insulation [11] and high-temperature filtration [12] and are also widely used in catalytic carriers, sound absorption, gas-sensitive materials, and biological materials [13,14,15]. However, the performance of porous ceramics largely depends on their pore structures. The pore structure is key in the study of porous ceramic materials and poses a challenge [6,15,16,17,18].
Usually, pores are characterized using various types of high-resolution scanning electron microscopes (SEM), photoelectromagnetic observation techniques, such as nuclear magnetic resonance (NMR) and computed tomography scans, or fluid intrusion techniques, such as mercury pressure and cryogenic liquid nitrogen adsorption [19,20,21,22,23]. Although various types of SEM can observe pore morphologies and sizes, they cannot quantify the pore parameters. NMR and nitrogen adsorption are usually employed only to characterize pore parameters at the nanoscale. In contrast, a mercury intrusion porosimeter (MIP) can be used to measure pores with diameters ranging from 0.005 to 1000 μm, making MIP more applicable than other test methods for ceramic-based materials [24,25].
Owing to the excellent properties of porous ceramics, many studies have shown that the microstructure of porous materials significantly affects the intrinsic properties. For example, the pore size and its distribution greatly affect the mechanical properties, thermal properties, permeability, permeation rate, and filtration properties of porous materials. Characterizing the macro–microstructure of porous materials is essential in the preparation and application of porous materials. Traditional characterization methods generally reduce the pore structure to a parallel-plate, cylindrical pore, or sphere-stacking model [26,27]. However, the pores of porous materials have different sizes and shapes. Because of the random pore distribution and complex structure, the traditional techniques are oversimplified and insufficient for characterizing porous ceramic materials. Since porous materials with complex pore structures are difficult to characterize using Euclidean geometry, they can only be studied using statistics. The microstructures of porous materials are characterized to an extent based on self-similarity; thus, fractal geometry can be used for quantitative characterization [28,29,30,31,32,33]. The fractal dimension is an important parameter for quantifying the geometric complexity and characteristics of fractal sets. Therefore, if a suitable fractal model is obtained, the fractal dimension can be calculated, which is used to effectively quantify the complexity and irregularity of pore structures.
In characterizing complex pore structures, there are various types of fractal dimensions, including the fractal dimensions of the pore surface, pore volume, tortuosity, air void, fracture surface, cracks, and particle size distribution [34]. Among them, the pore surface fractal dimension (Ds) is used to quantify pore surface complexity [35,36]. Currently, Ds is mainly calculated using the models developed by Neimark [37,38] and Zhang and Li [39,40]. Neimark’s model is analogous to the relationship of the Ds determined using the adsorption method, which is based on an ideal cylindrical pore assumption, and its calculation results have some errors. In contrast, Zhang and Li’s model is based on the principle of MIP testing and establishes a scalar form that is both consistent with the fractal geometry theory and compatible with the specific process of MIP measurements, which better employs the MIP data to determine accurate correct surface fractal dimensions.
Currently, people use Zhang and Li’s model to explore the fractal characteristics of various porous materials so as to further analyze the relationship between pore structure and the pore surface fractal dimension. Jin et al. [29] put forward the ratio of fractal dimension and pore volume calculated by this model as a new parameter of strength model through testing the strength and pore structure of Portland cement mortar. The relationship between strength and pore structure is accurately simulated, and regression analysis shows that the strength model has high prediction accuracy. Li et al. [31] used this model to study the fractal characteristics of pores in Hybrid Basalt Polypropylene fiber-Reinforced Concrete (HBPRC). The results showed that the Ds of HBPRC pores decreased successively in gel region, capillary region and macropore region, but there was no obvious fractal feature in transition region, which laid a foundation for further investigation of the reasons for the deterioration of HBPRC structure.
To summarize, it is necessary to further investigate the pore characteristics of porous alumina. In this study, porous alumina samples with different porosities were prepared by sintering under atmospheric pressure using alumina powder as the raw material and carbon fiber (CF) of different sizes and graphite as pore-forming agents. The pore structure and Ds of porous alumina with various pore-forming agent contents were also assessed based on the MIP data. The variation law of Ds under different pore-forming agents was compared and analyzed. The relationship between the fractal dimensions and the pore structure and flexural strength was examined in detail.
2. Materials and Methods
2.1. Raw Materials
Here, α-calcined alumina powder (>99.9%, CT3000SG, Almatis GmbH, Ludwigshafen, Germany) was used as the ceramic phase with an average particle size of 0.5 μm. CF with three specifications (>99.9%) was used as a pore-forming agent, and the specific properties are shown in Table 1. The lengths of the CF with a 14.5-μm diameter were 90, 150, and 200 μm. Graphite powder (>99.9%, Malvern Instruments, Worcestershire, UK) with a density of 2.25 g·cm−3 and an average diameter of 28.7 μm was also used as a pore-forming agent. CF and graphite exist in the form of fiber and flake, respectively, in the ceramic matrix.

Table 1.
Properties of three kinds of carbon fiber.
2.2. Preparation of Porous Alumina
In situ porous alumina ceramics were prepared via sintering, during which the internal pore-forming agents were combusted [41,42]. Alumina, CF, and graphite powders were wet-mixed for 24 h using a ball mill with alumina as the grinder. Ethanol was then evaporated at a low temperature, and the sample was dried in an oven at 110 °C for 12 h. The dried powder mixture was then sieved through a 200-mesh sieve. The obtained powder was loaded into a compression mold and prepressed for 20 s at 125 MPa using a rapid prototyping machine before being molded at 500 MPa using a cold isostatic press. Finally, it was sintered at 1550 °C for 2 h at a heating rate of 1 °C min−1 in the air atmosphere and cooled from the sintering temperature to 300 °C at a rate of 10 °C min−1. Porous alumina samples were obtained after cooling naturally to room temperature.
The volume ratios of the alumina powder to the CF and graphite with different aspect ratios were 3:7, 5:5, and 7:3, and for the pore-forming agents, the volume ratios of CF to graphite were 3:7, 5:5, and 7:3, respectively. The ratios of the raw material for the prepared 27 samples are listed in Table 2.
Table 2.
The ratios of raw materials.
2.3. Characterization Methods
The porosity of the samples was measured using the Archimedes method. An X-ray diffraction (XRD) analyzer (D8 Discover, Bruker AXS, Karlsruhe, Germany) was used to determine the crystal structure of the sintered samples. The four-point flexural method was employed to measure the flexural strength of the specimens using a universal testing machine (1600 series, INSTRON, High Wycombe, UK). Before the experiment, the surfaces of the specimen were polished so that the upper and lower surfaces were parallel, and the sample was chamfered. The sample was 3 mm × 4 mm × 30 mm, the upper and lower spans were 10 and 20 mm, respectively, and the loading rate was 0.5 mm·min−1. SEM (LEO 1530 FESEM, Gemini/Zeiss, Oberkochen, Germany) was employed to observe the microstructure of the sample. The pore-size distribution of the samples was measured by MIP (AutoPore IV 9500 V1.04, Micromeritics GmbH, Germany). The contact angle and surface tension used for the calculations were 141.3° and 485 × 10−3 N·m−1, respectively.
A fractal model based on a thermodynamic approach, derived by Zhang and Li, was employed in the MIP tests. This model can more accurately characterize the pore-size distribution of porous alumina ceramics. Zhang and Li’s model is based on the conservation of energy during MIP testing, i.e., the increase in surface energy of the system is equal to the work done around it, as expressed below:
where W is the work done by the external pressure, V the volume of the intruded mercury, γL the surface tension between the mercury and the pore surface, θ the contact angle between the mercury and the pore surface, and S the pore surface area. Integrating the pressure at different stages of the mercury compression process, Equation (2) can be obtained as follows:
where SE is the fractal area of the Euclidean space pore surface and Pi and ΔVi are the pressure applied at stage i of mercury pressure and the volume of mercury intruded, respectively. The correlation between the fractal surface area in a porous medium and the volume enclosed by this surface is expressed in Equation (3):
Based on dimensional analysis, the above equation can be translated into the following form, which expresses the relationship between the volume extruded into the pore space and the corresponding pore surface coverage:
where k is a factor relating the surface area and the corresponding volume, Vn the cumulative pore volume of the nth stage, and δn the yardstick size for measuring the circumference of pores with a radius equal to or smaller than rn. Combining Equations (1) and (4), Equation (5) can be obtained.
where C is a regression constant. According to Equation (5), the MIP data can correspond in a log–log coordinate system by calculation. Using linear regression, Ds is the slope of the curve.
3. Results and Discussion
3.1. Pore-Size Distribution and Porosity of Alumina Samples
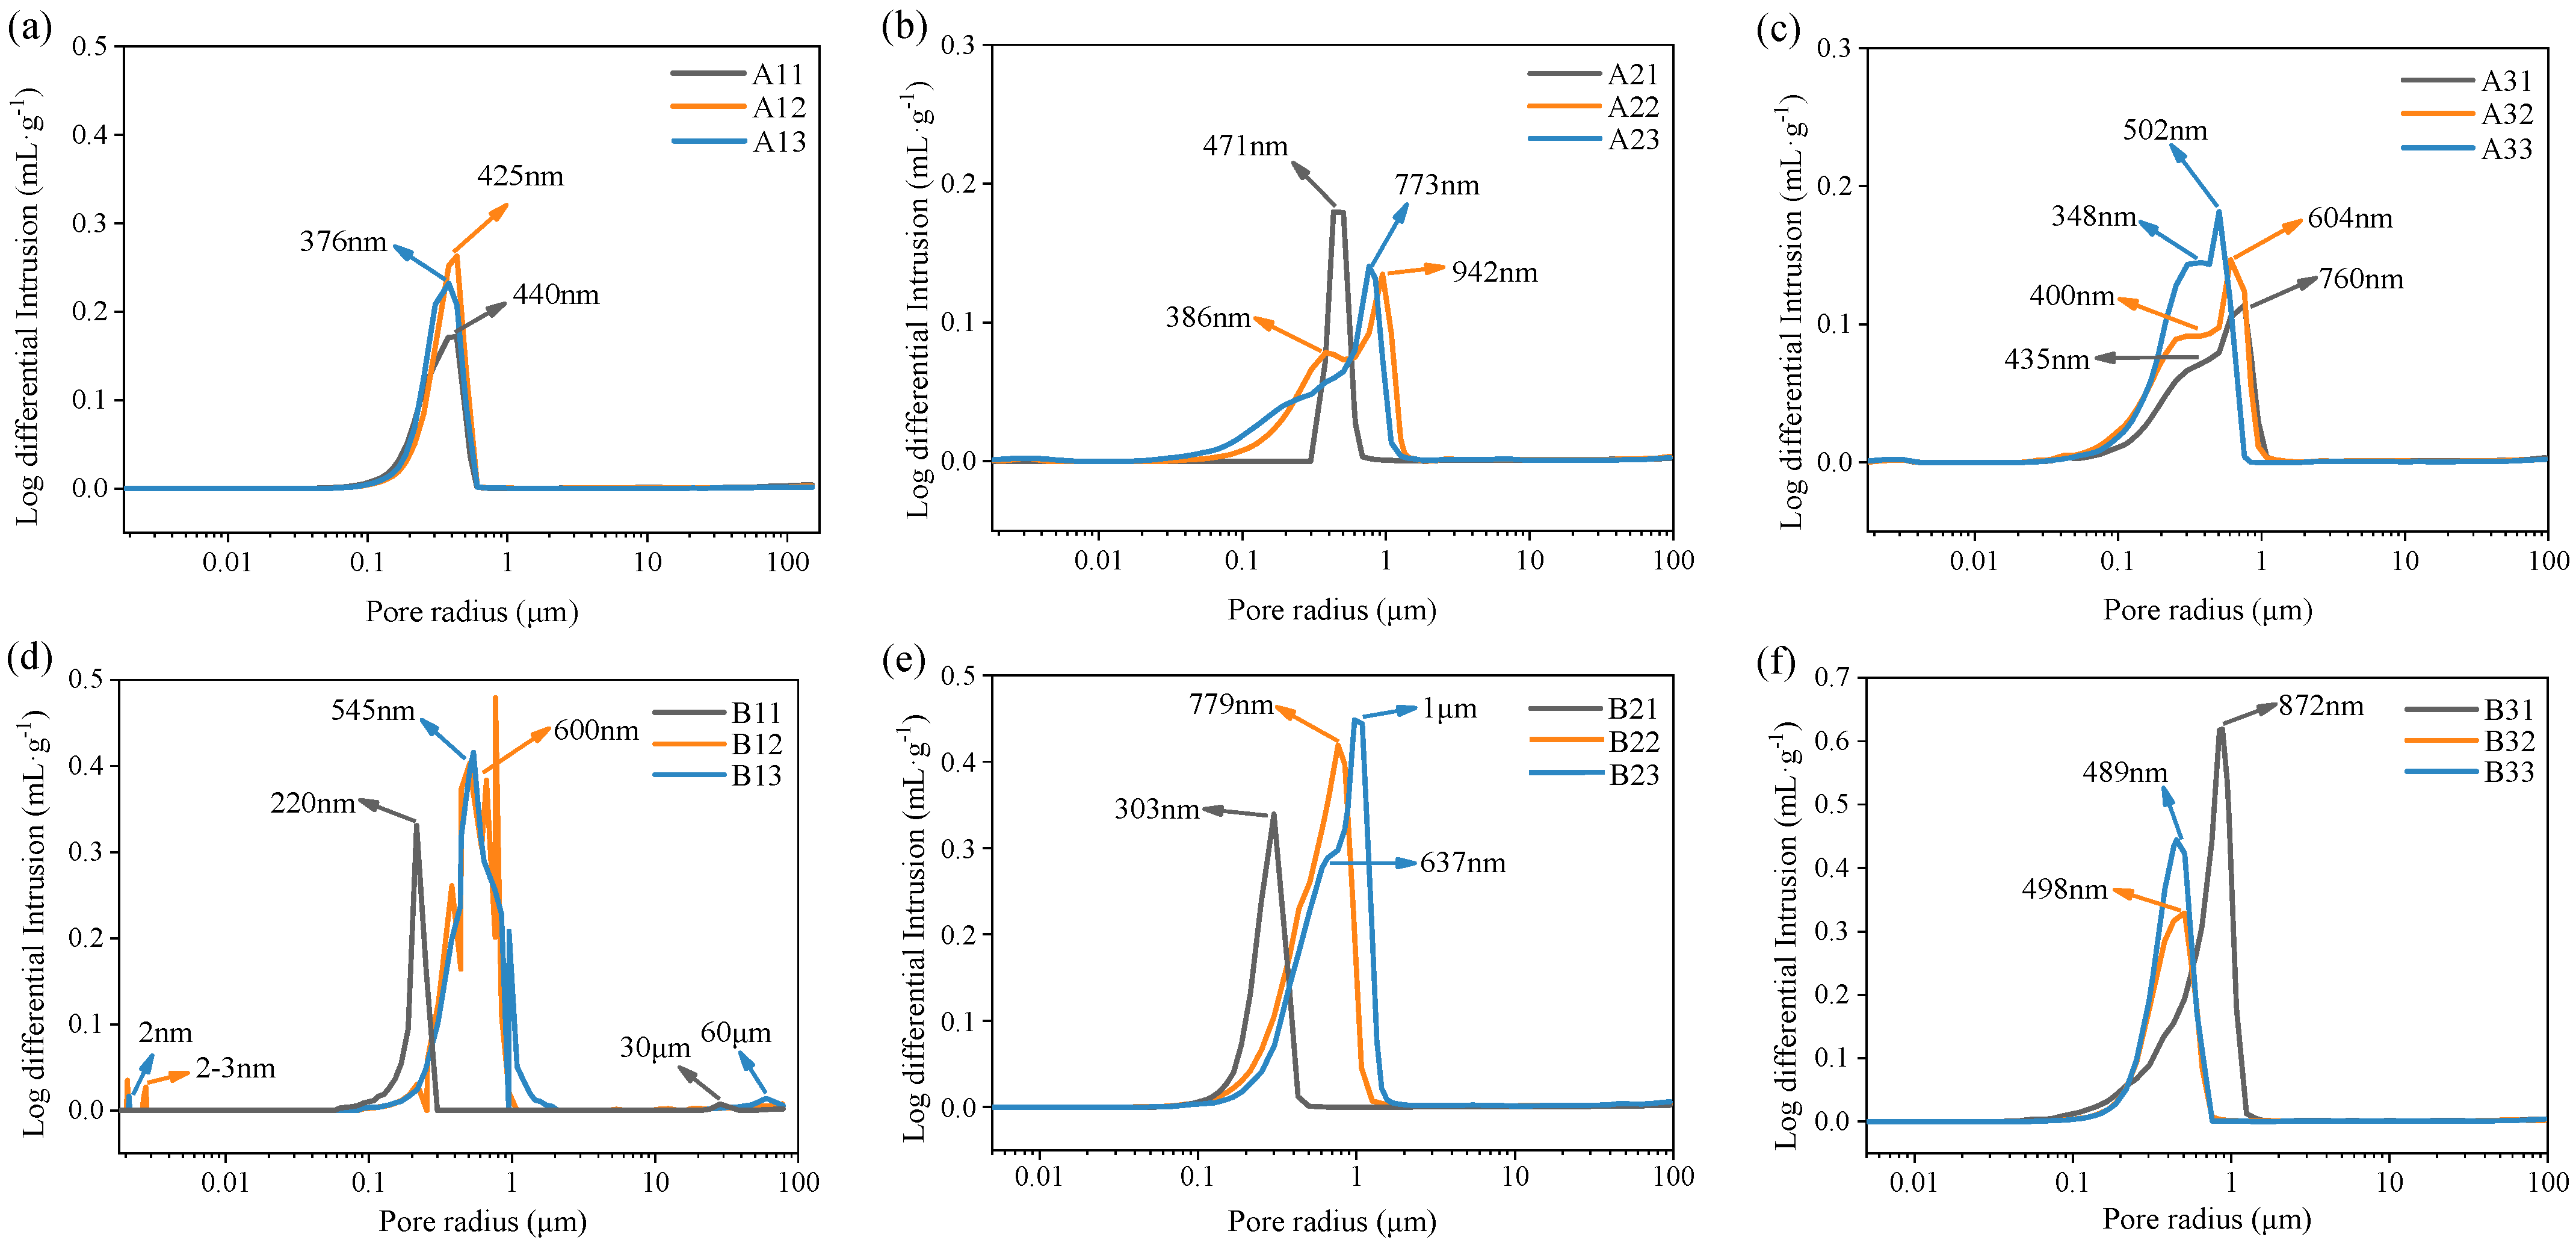
The pore-size distribution of the porous alumina samples with different volumes of pore-forming agents, ratios of CF to graphite, and aspect ratios of CF as pore-forming agents are shown in Figure 1. When 30 and 50 vol.% of the pore-forming agents were added (samples A11–B33), and the proportion of CF in the pore-forming agents was certain, the most probable pore size of the porous alumina samples showed no specific change pattern as the aspect ratio of CF was increased. Some samples showed a double- or triple-peak distribution. The most probable pore size for the samples with 50 and 70 vol.% CF in the pore-forming agents decreased with an increase in the CF aspect ratio when the pore-forming agent was 70 vol.% (C11–C33). In contrast, the most probable pore size for the samples with 30 vol.% CF in the pore-forming agents increased as the CF aspect ratio increased from 1 to 1.5 μm. Only sample C22 showed double peaks, indicating that the pore-size distribution of the sintered samples was not conducive to double or multiple peaks. The pore-size distributions for samples A11–C33 indicate that the measured pore size is lower than the average diameter of the pore-forming agents, which also shows that an ink-bottle pore structure was formed in the samples.
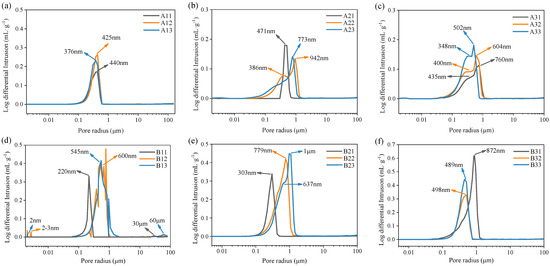
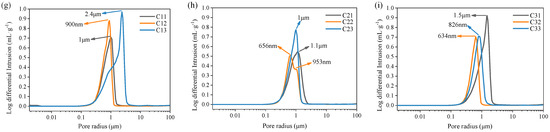
Figure 1.
Pore size distribution in porous alumina samples with different contents of pore-forming agents. (a) 30 vol.% pore formers (CF:Graphite = 3:7) + 70 vol.% alumina; (b) 30 vol.% pore formers (CF:Graphite = 5:5) + 70 vol.% alumina; (c) 30 vol.% pore formers (CF:Graphite = 7:3) + 70 vol.% alumina; (d) 50 vol.% pore formers (CF:Graphite = 3:7) + 50 vol.% alumina; (e) 50 vol.% pore formers (CF:Graphite = 5:5) + 50 vol.% alumina; (f) 50 vol.% pore formers (CF:Graphite = 7:3) + 50 vol.% alumina; (g) 70 vol.% pore formers (CF:Graphite = 3:7) + 30 vol.% alumina; (h) 70 vol.% pore formers (CF:Graphite = 5:5) + 30 vol.% alumina; (i) 70 vol.% pore formers (CF:Graphite = 7:3) + 30 vol.% alumina.
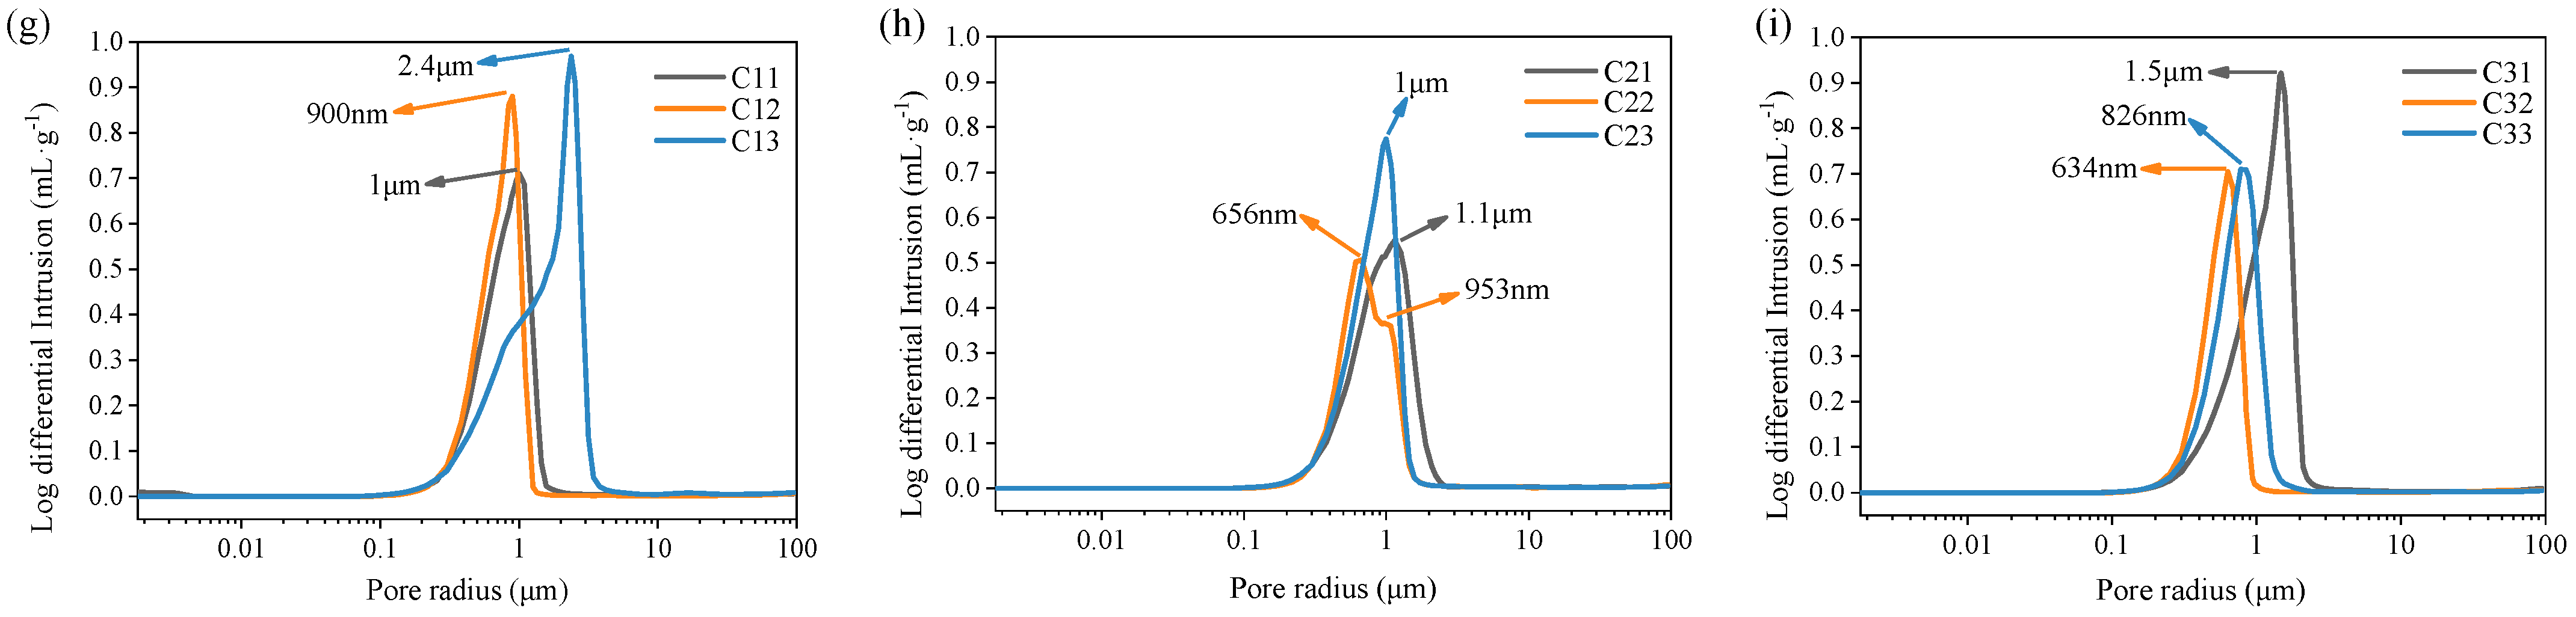
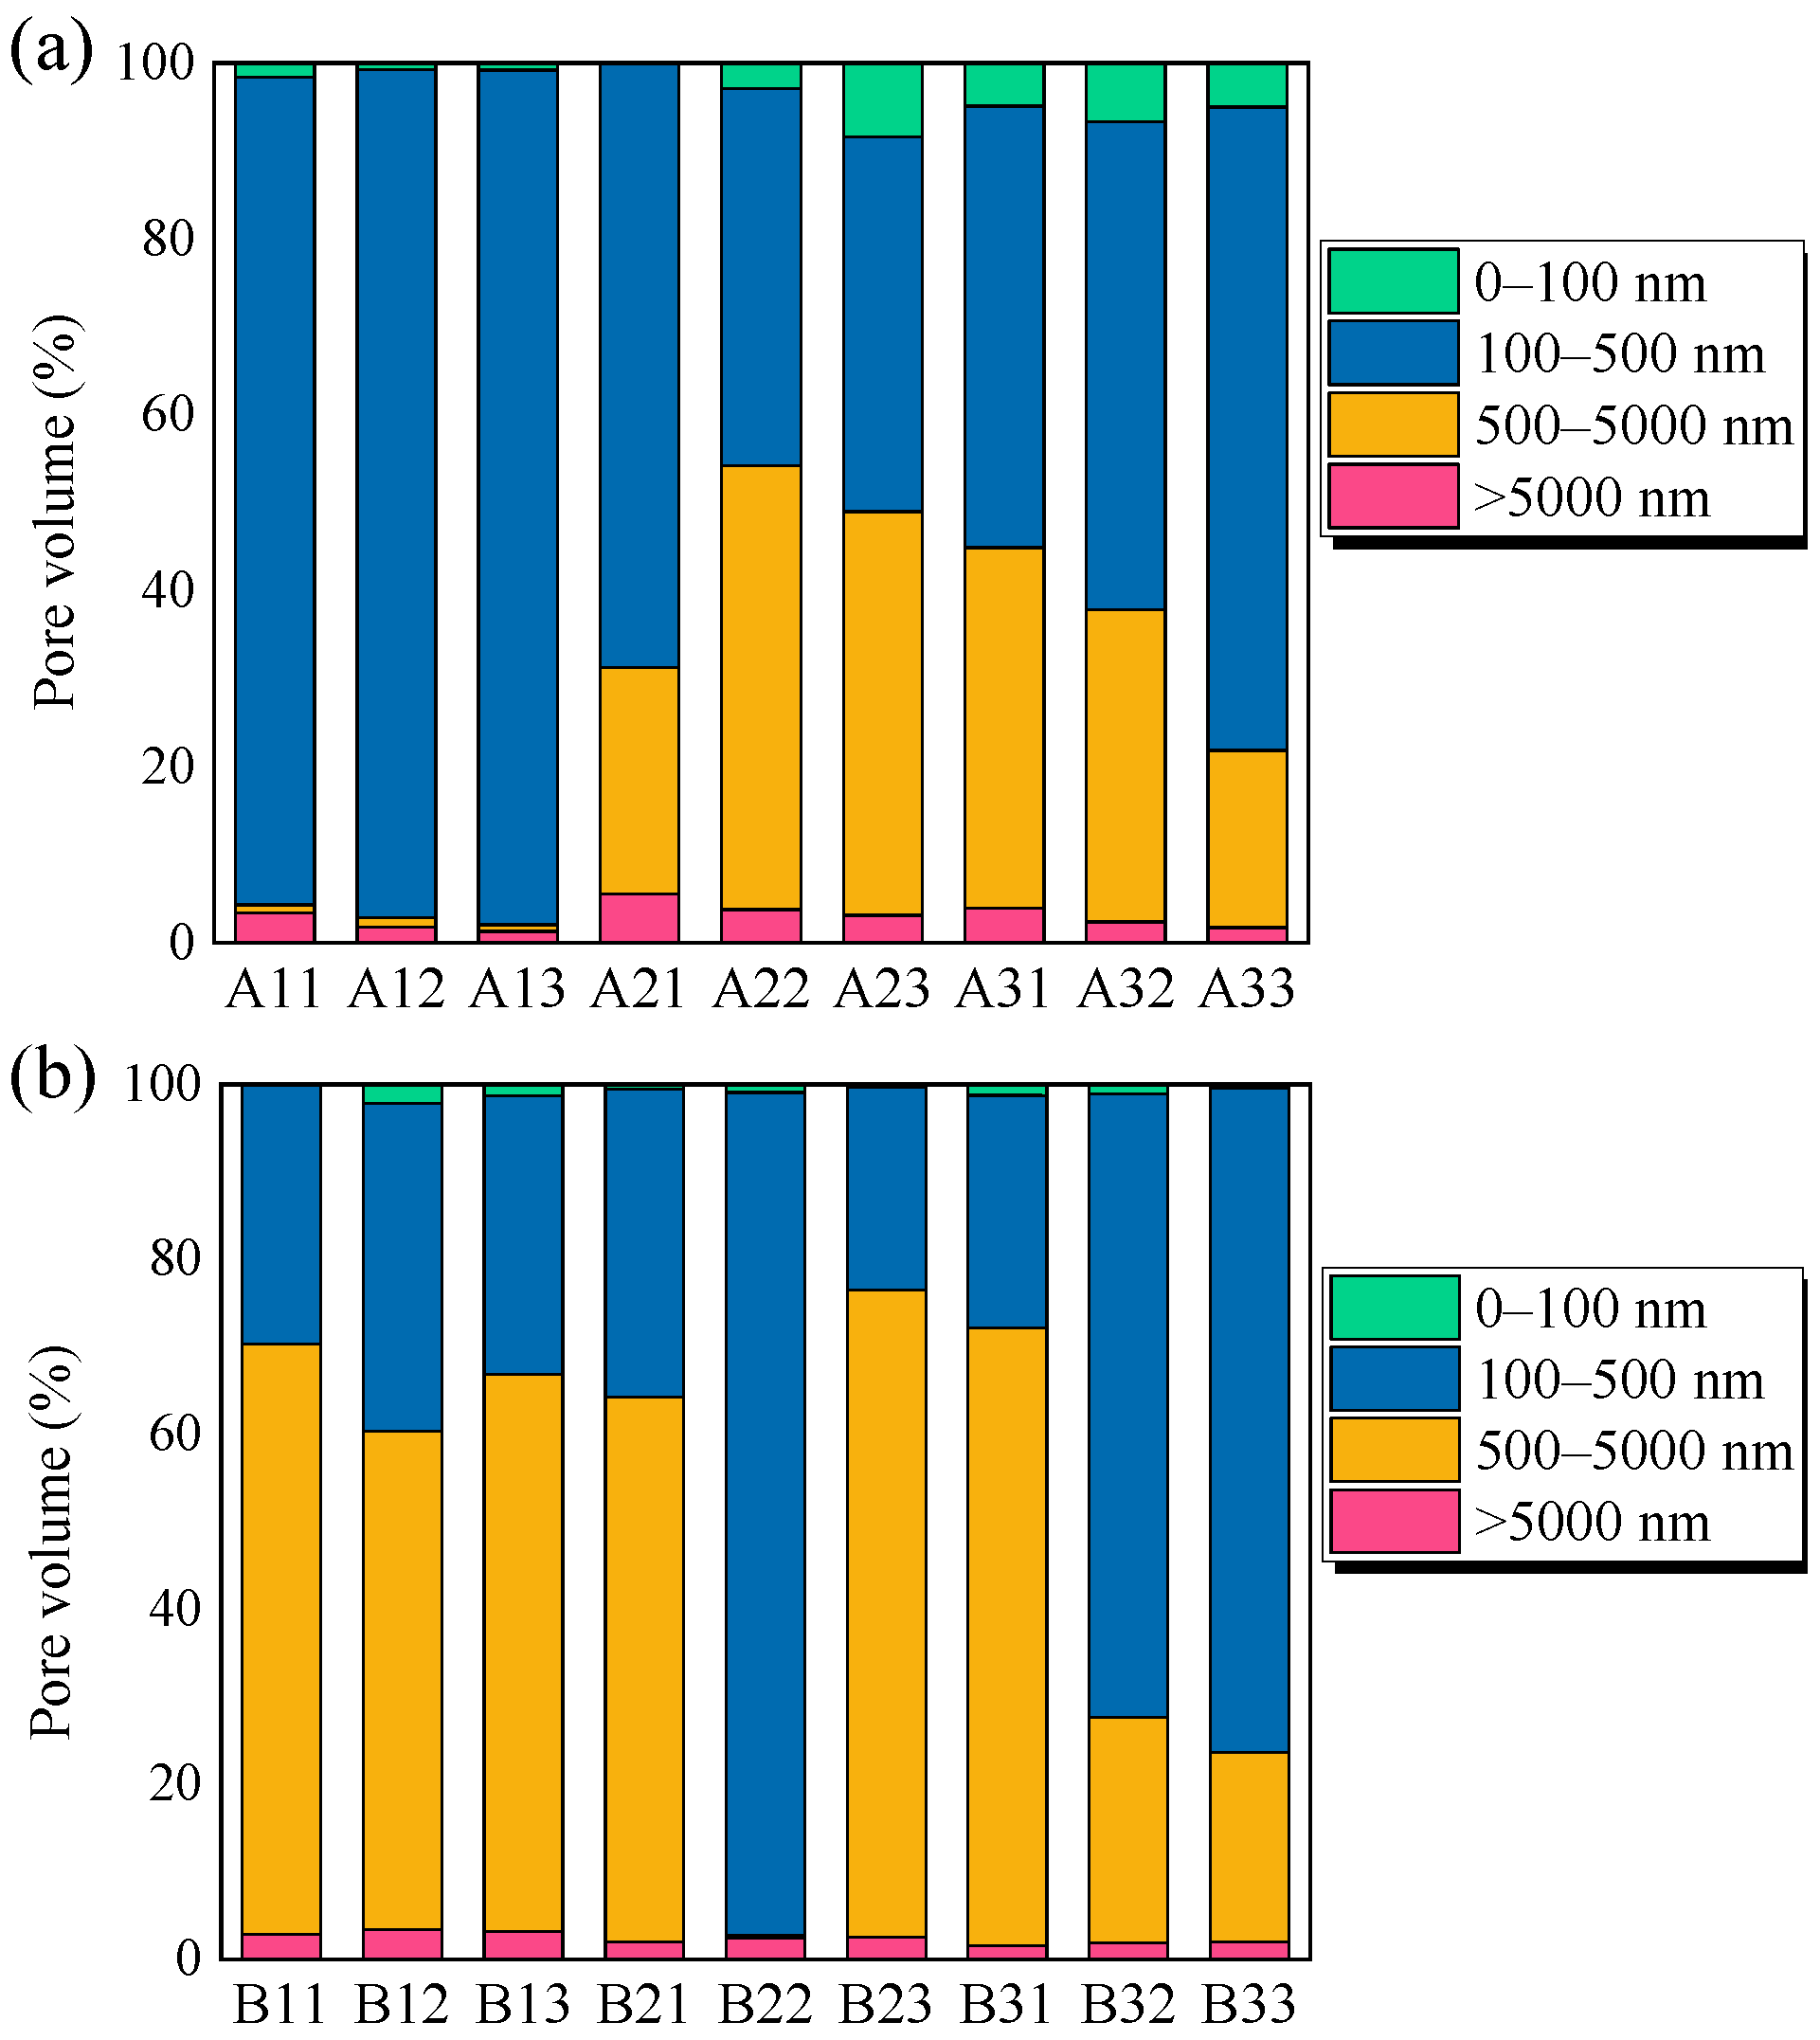
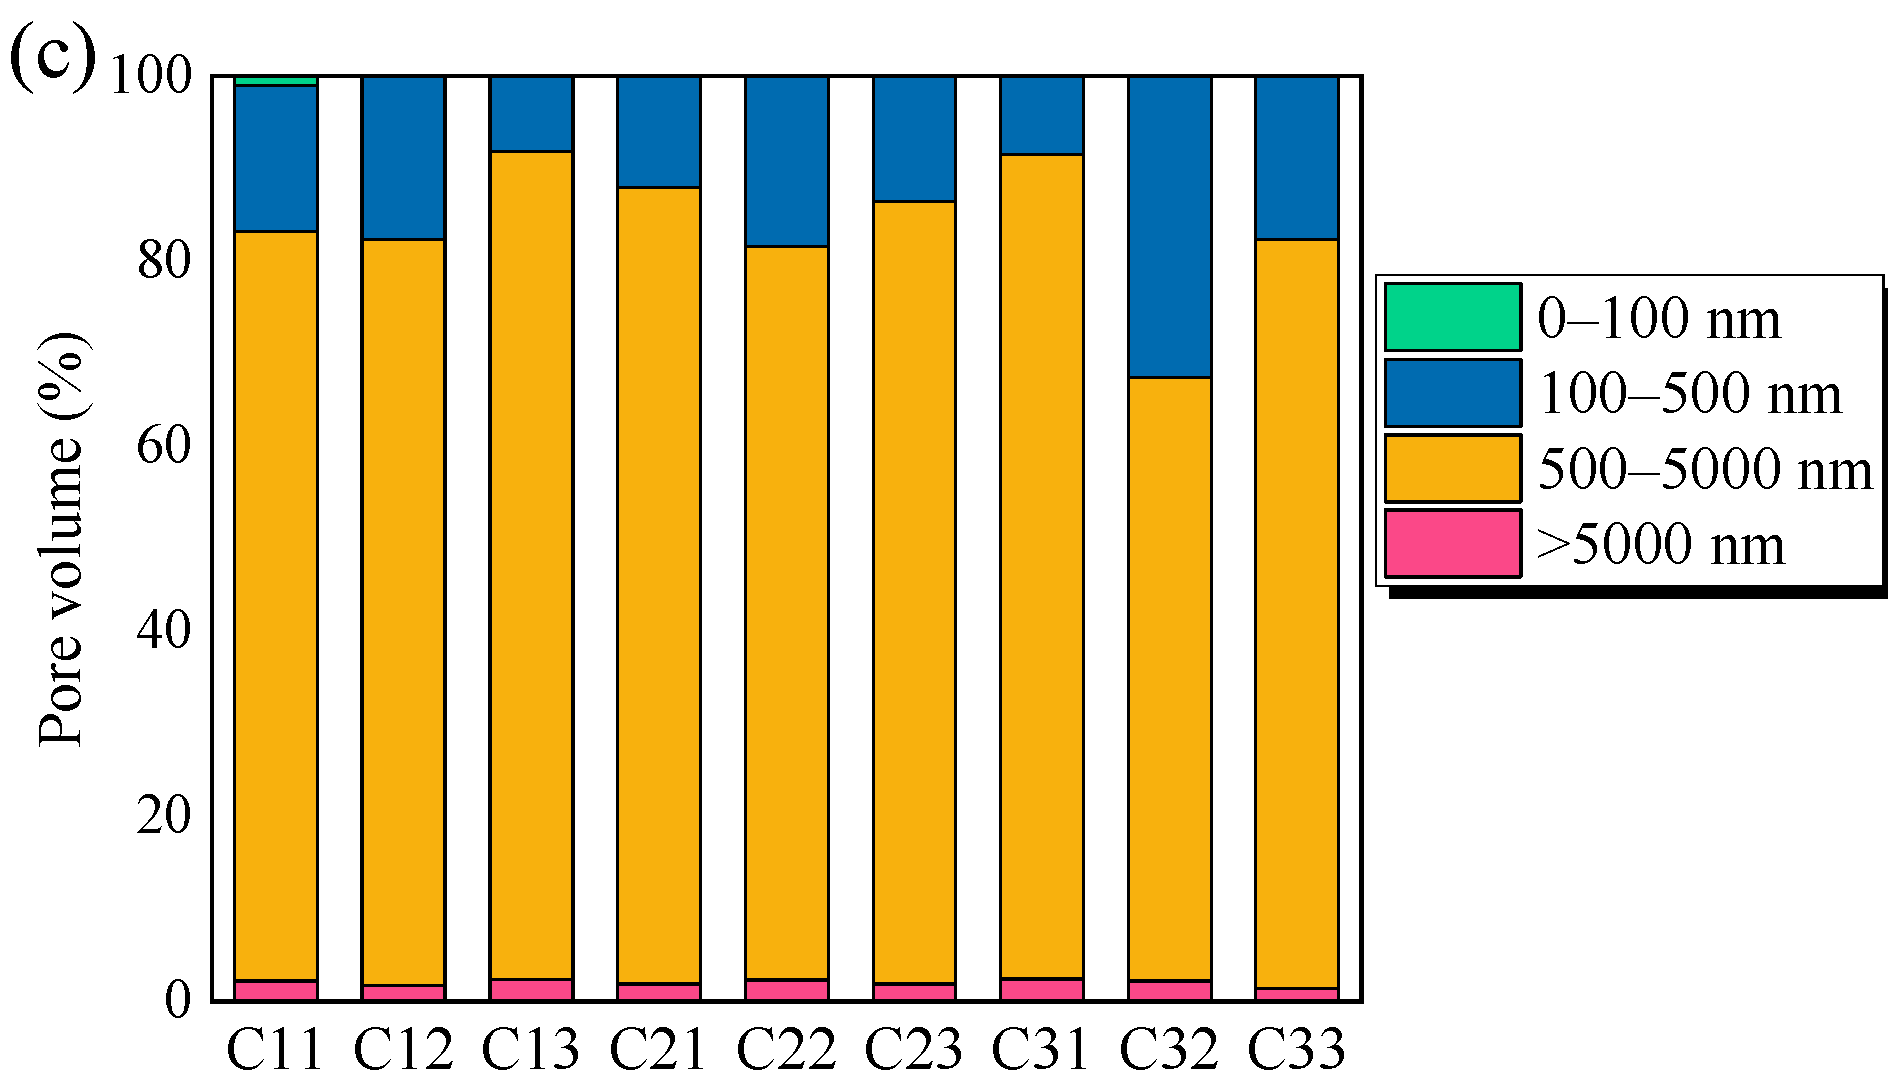
The effect of the ratio of the pore-forming agents and the CF aspect ratio on the pore volume of porous alumina samples in different pore size ranges was investigated to directly analyze the effects of the pore-forming volume content. The pore size ranges were divided into 0–100, 100–500, 500–5000, and >5000 nm. The volume fractions of these pores are shown in Figure 2. For the samples with 30 vol.% of the pore-forming agent, 500–5000- and 0–100-nm pores occupied a certain proportion with an increase in the CF aspect ratio. As shown in Figure 2b, 100–500-nm pores in sample B22 increased rapidly compared with those in other samples, and the volume fraction was approximately 96%. For the sample with 70 vol.% of the pore-forming agents, different ratios of the pore-forming agents and different lengths of CF had little effect on the distribution of pore sizes at all levels in the sample. Pores in the range of 500–5000 nm were dominant, indicating that an increase in the volume content of the pore-forming agents promoted the generation of large pores.

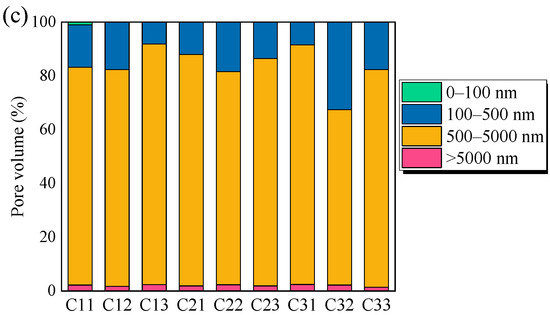
Figure 2.
Pore volume fraction of porous alumina samples with different pore-forming agent contents. (a) 30 vol.% pore formers + 70 vol.% alumina; (b) 50 vol.% pore formers + 50 vol.% alumina; (c) 70 vol.% pore formers + 30 vol.% alumina.
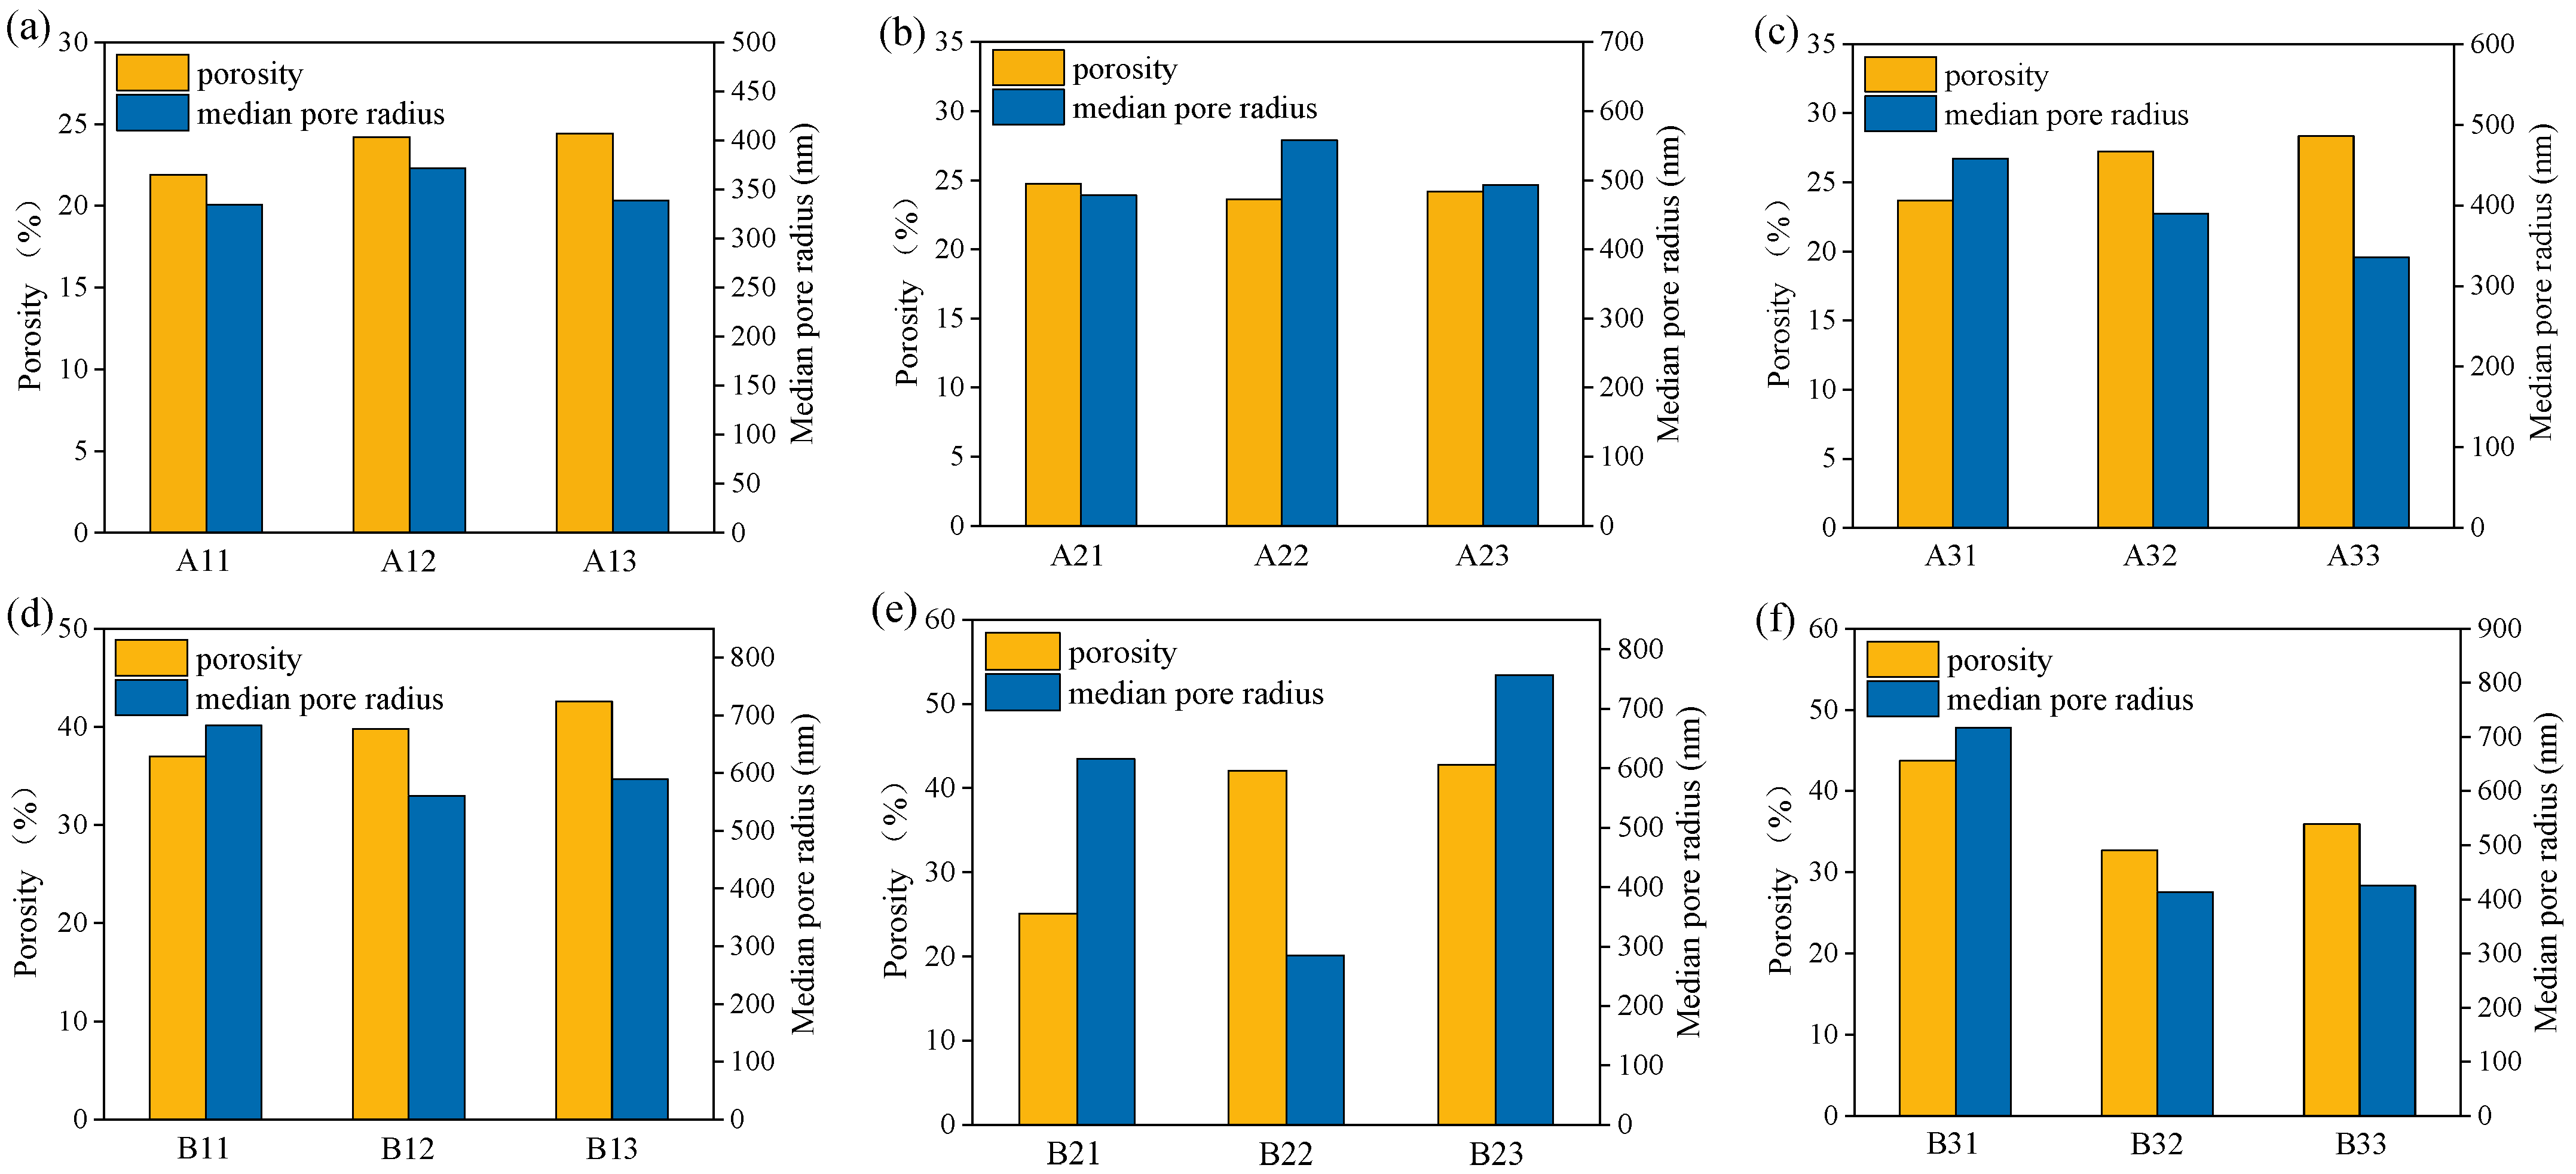
The porosity and median pore sizes of the porous alumina measured using the mercury pressure method are shown in Figure 3. The sample with 30 vol.% of the pore-forming agents had little effect on the porosity and median pore sizes of the sintered porous alumina samples. Figure 3d,e show that the porosity of the samples increased with an increase in the proportion of CF in the pore-forming agents for CF with 6.2 and 10.3 aspect ratios. When the aspect ratio of CF was 13.8, the porosity of the samples increased and then decreased as the CF proportion in the pore-forming agents increased. The porosity and median pore size of the samples decreased and then increased as the proportion of CF in the pore-forming agents increased when the content of the pore-forming agents was 50 vol.% for all three aspect ratios of CF. This is because the high-volume content of flake graphite hindered volume diffusion and further densification between the alumina particles before complete combustion, resulting in the high porosity of the samples. The porosity of the samples was lowest when the volume ratio of CF to graphite was 1:1. As the volume of CF continued to increase, it affected the densification of the preformer at the same pressure, indicating that the porosity of the preformer was relatively high, resulting in higher porosity of the sintered sample.

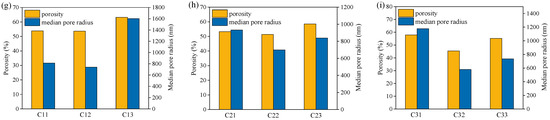
Figure 3.
Physical properties of porous alumina samples measured using a mercury intrusion porosimeter. (a) 30 vol.% pore formers (CF:Graphite = 3:7) + 70 vol.% alumina; (b) 30 vol.% pore formers (CF:Graphite = 5:5) + 70 vol.% alumina; (c) 30 vol.% pore formers (CF:Graphite = 7:3) + 70 vol.% alumina; (d) 50 vol.% pore formers (CF:Graphite = 3:7) + 50 vol.% alumina; (e) 50 vol.% pore formers (CF:Graphite = 5:5) + 50 vol.% alumina; (f) 50 vol.% pore formers (CF:Graphite = 7:3) + 50 vol.% alumina; (g) 70 vol.% pore formers (CF:Graphite = 3:7) + 30 vol.% alumina; (h) 70 vol.% pore formers (CF:Graphite = 5:5) + 30 vol.% alumina; (i) 70 vol.% pore formers (CF:Graphite = 7:3) + 30 vol.% alumina.
3.2. Mechanical Properties of Porous Alumina
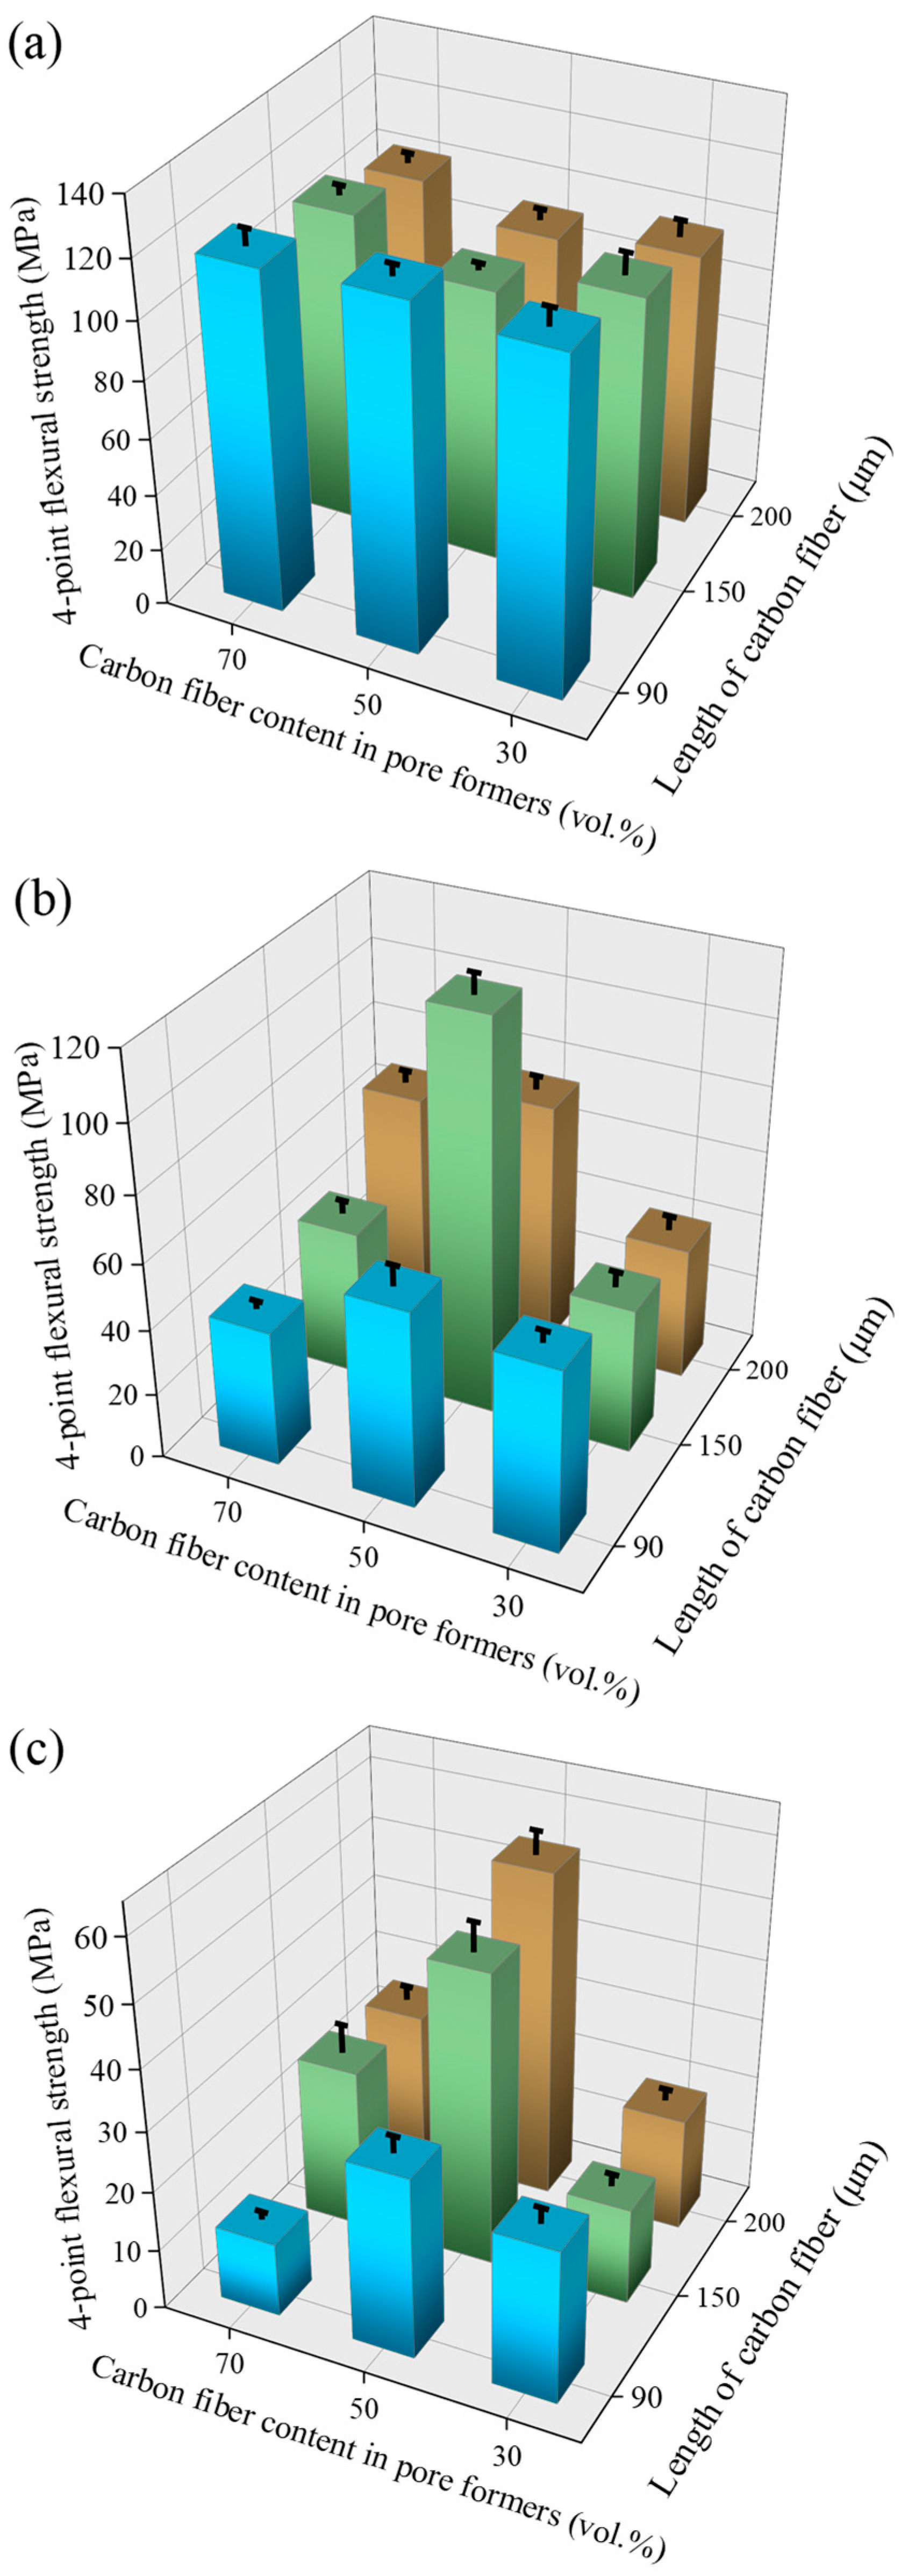
The flexural strengths of the samples with different pore-forming agents after sintering are shown in Figure 4. Figure 4a shows that the CF aspect ratio and content in the pore-forming agent did not significantly affect the four-point flexural strengths of the samples with 30 vol.% of the pore-forming agent, which ranged from 92.28 to 120.56 MPa. With a lower content of the pore-forming agents, the dispersion of the pore-forming agents in the preformers was more uniform. As shown in Figure 4b,c, the flexural strength of the samples with different ratios of the pore-forming agents and CF aspect ratios under the same condition of controlling the pore-forming agent content varied corresponding to the variation of the porosity of the samples. For the sample with 50 vol.% of the pore-forming agents and a CF aspect ratio of 6.2, the mechanical properties increased slightly and then decreased as the volume content of CF in the pore-forming agent increased. The mechanical properties of the samples with a CF aspect ratio of 10.3 increased significantly and then decreased as the volume of CF increased. The highest strength of 118.73 MPa was achieved for the sample with 50 vol.% CF and 150-μm length, which was closely related to the internal pore structure of the sample and consistent with the results of sample B22 (Figure 2). For the samples with a CF aspect ratio of 13.8, the mechanical properties increased and then decreased slightly as the volume content of CF increased. For the samples with 70 vol.% pore-forming agents, the four-point flexural strengths of the samples with three CF aspect ratios increased and then decreased as the CF content in the pore-forming agents increased, and the maximum values obtained with a CF to graphite ratio of 1:1 were 30.07, 48.65, and 54.68 MPa, respectively.
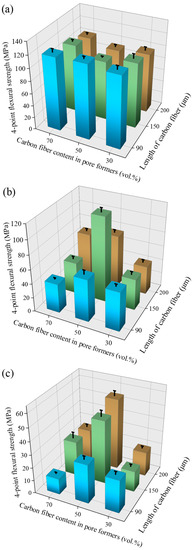
Figure 4.
Flexural strength of porous alumina samples with different pore-forming agent contents. (The volume fractions of pore-forming agents are (a) 30 vol.%, (b) 50 vol.%, and (c) 70 vol.%).
3.3. Phase Composition and Microstructure of Porous Alumina
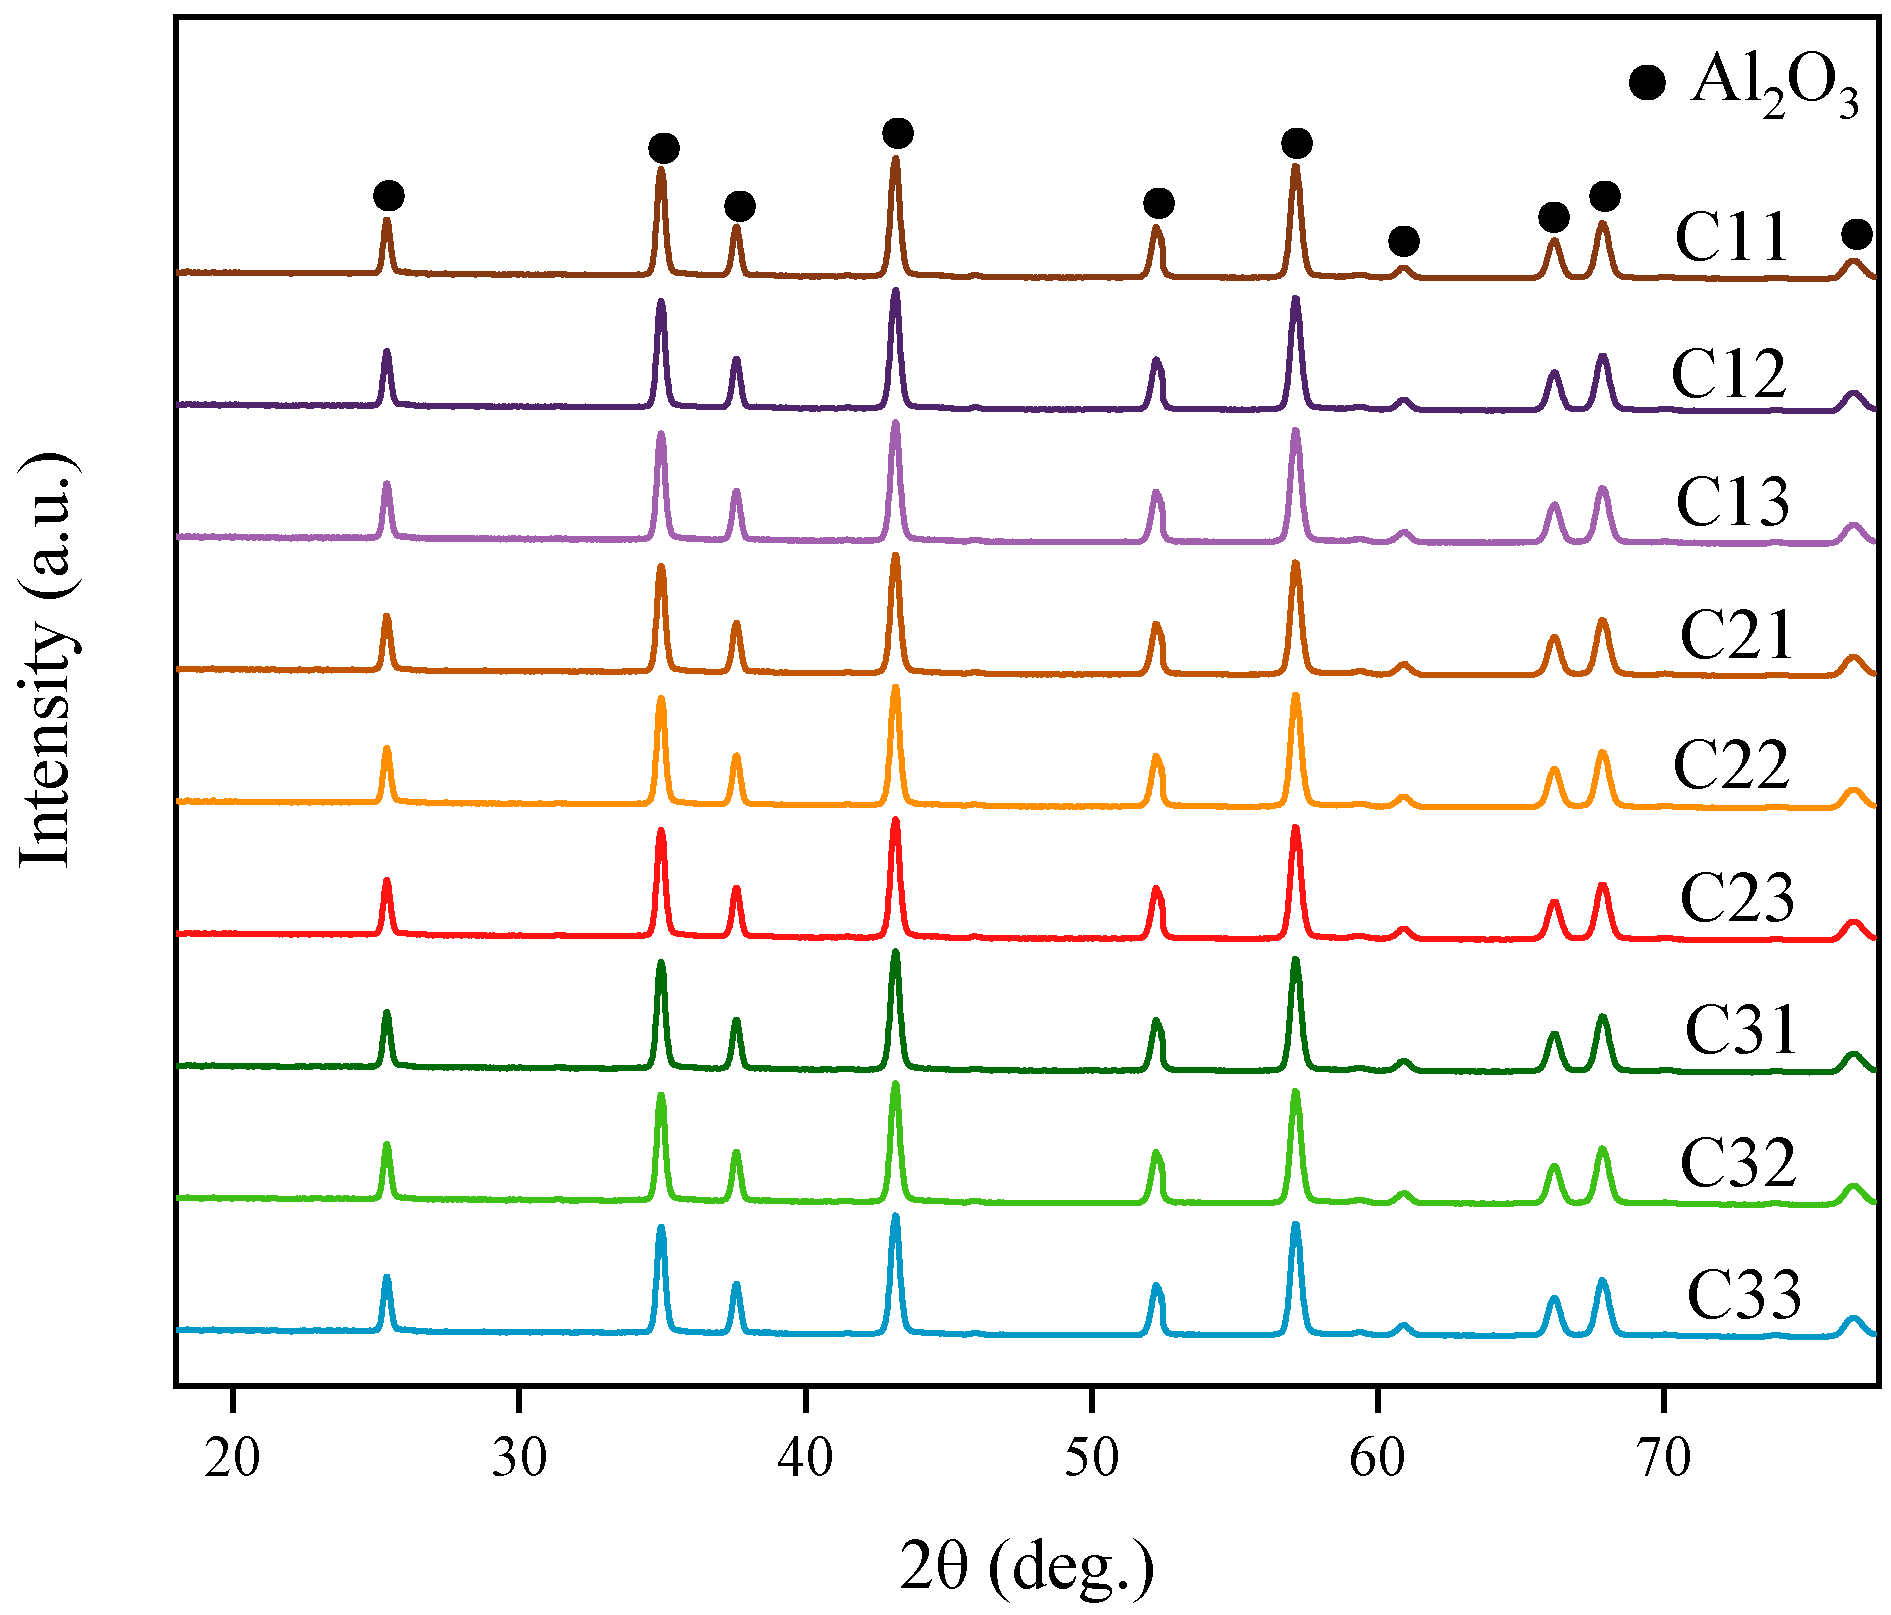
The compositions of the prepared porous alumina samples were analyzed. Figure 5 shows the XRD of the samples with 70 vol.% pore-forming agents. The samples sintered at 1500 °C and held for 2 h showed only typical diffraction peaks of alumina. The CF and graphite were completely combusted during the sintering of the raw material mixtures with compositions, and no residual pore-forming agents were observed in the products. When the pore-forming agent content was 30 vol.% and 50 vol.%, the XRD patterns of the samples were consistent with those of the sample with 70 vol.% pore-forming agents.

Figure 5.
X-ray diffraction of porous alumina samples with 70 vol.% pore-forming agents.
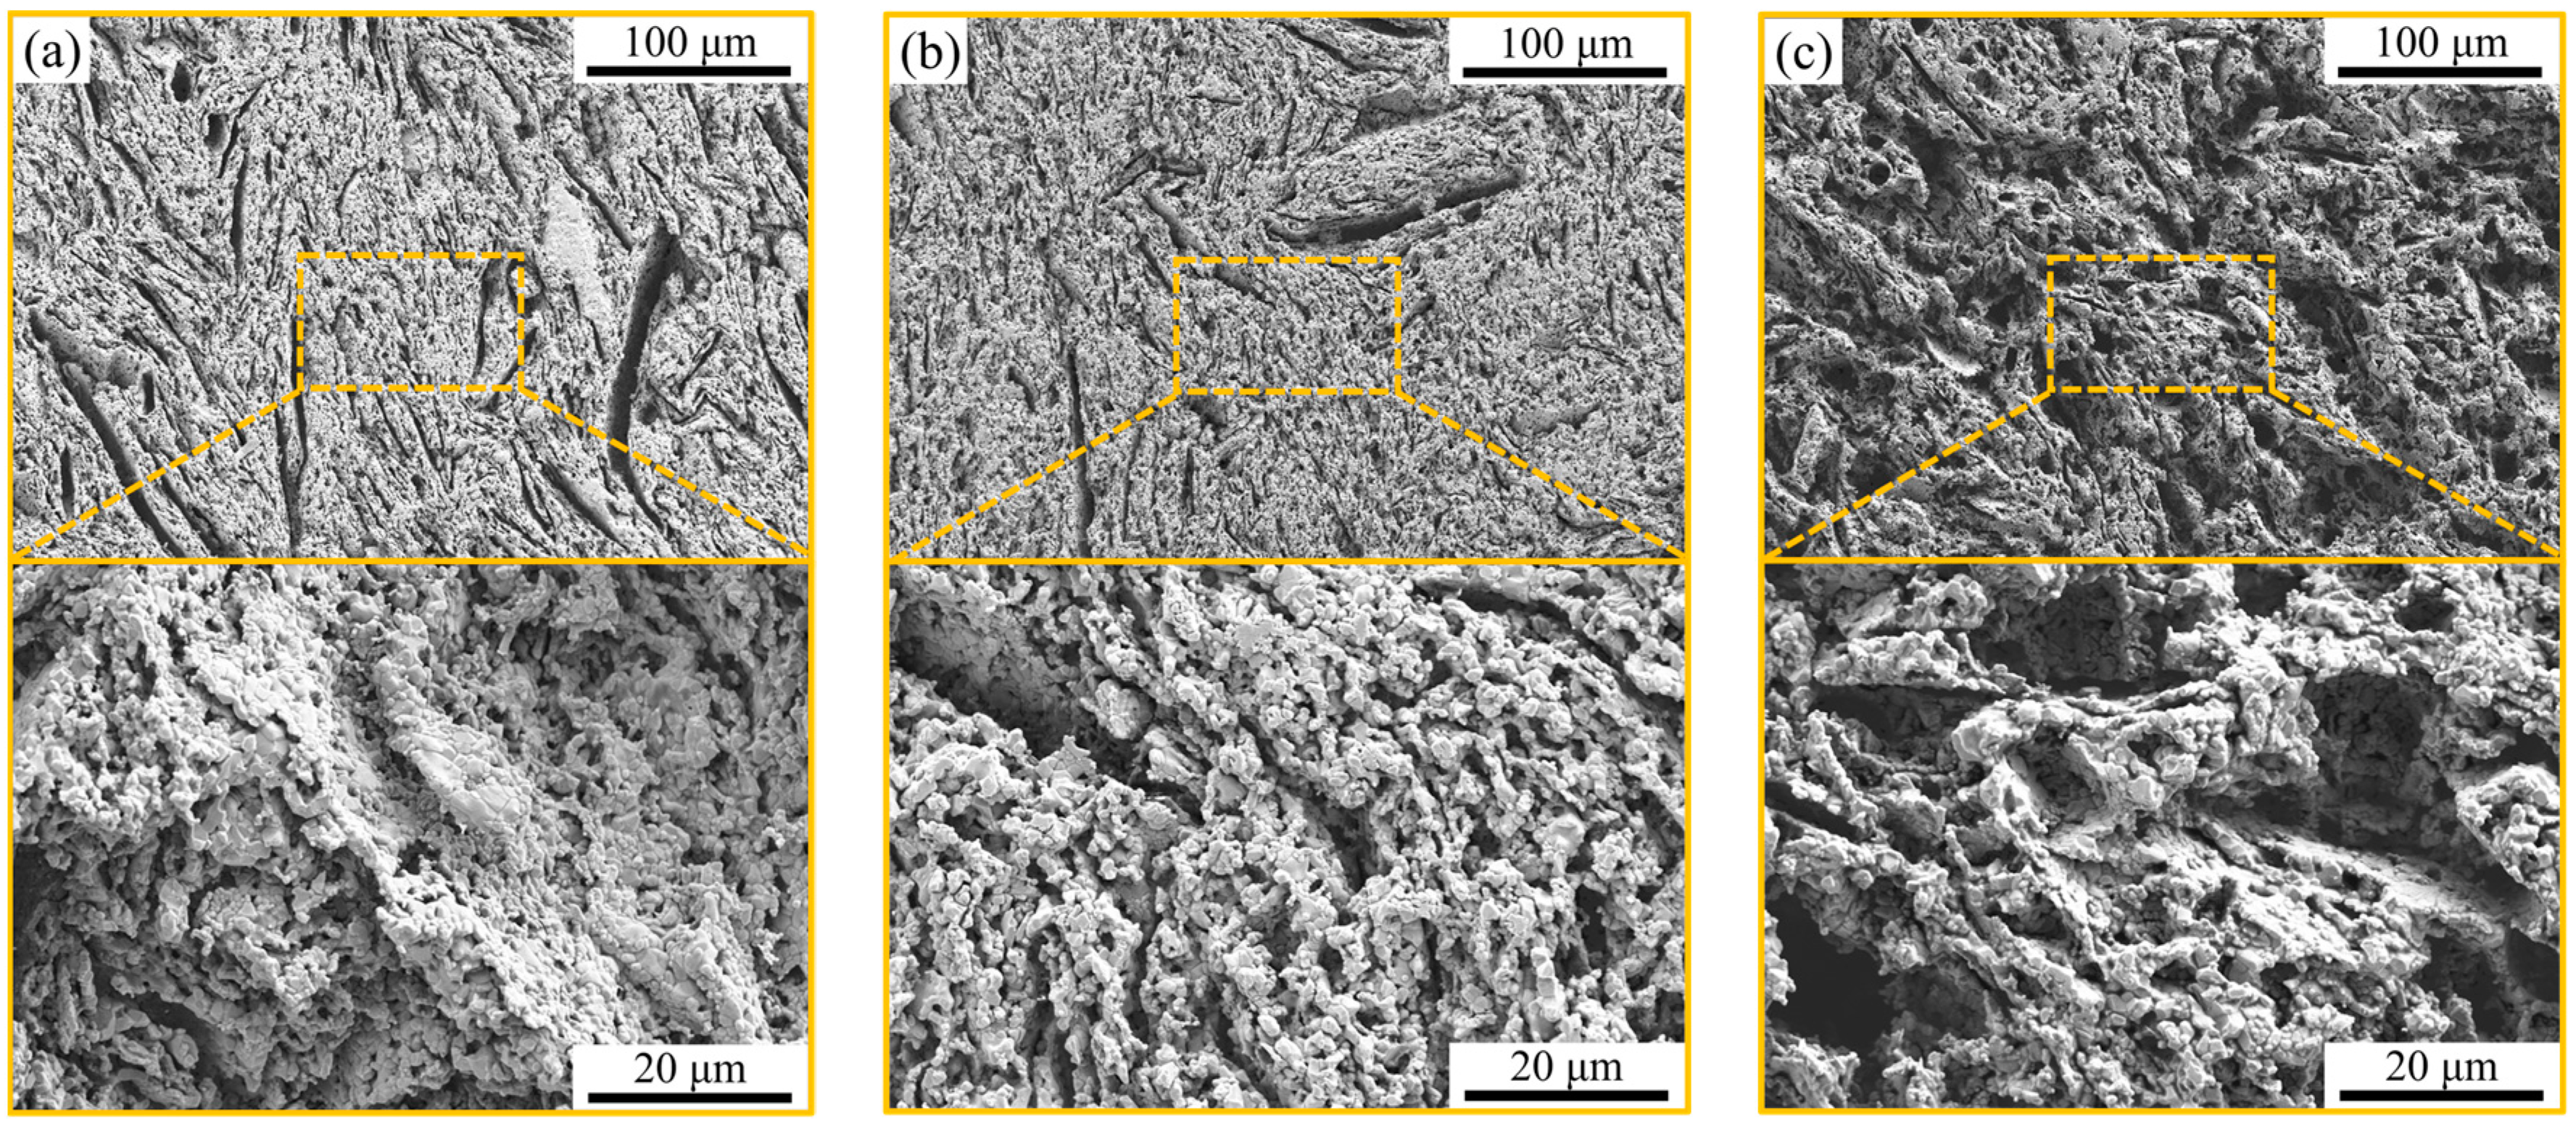
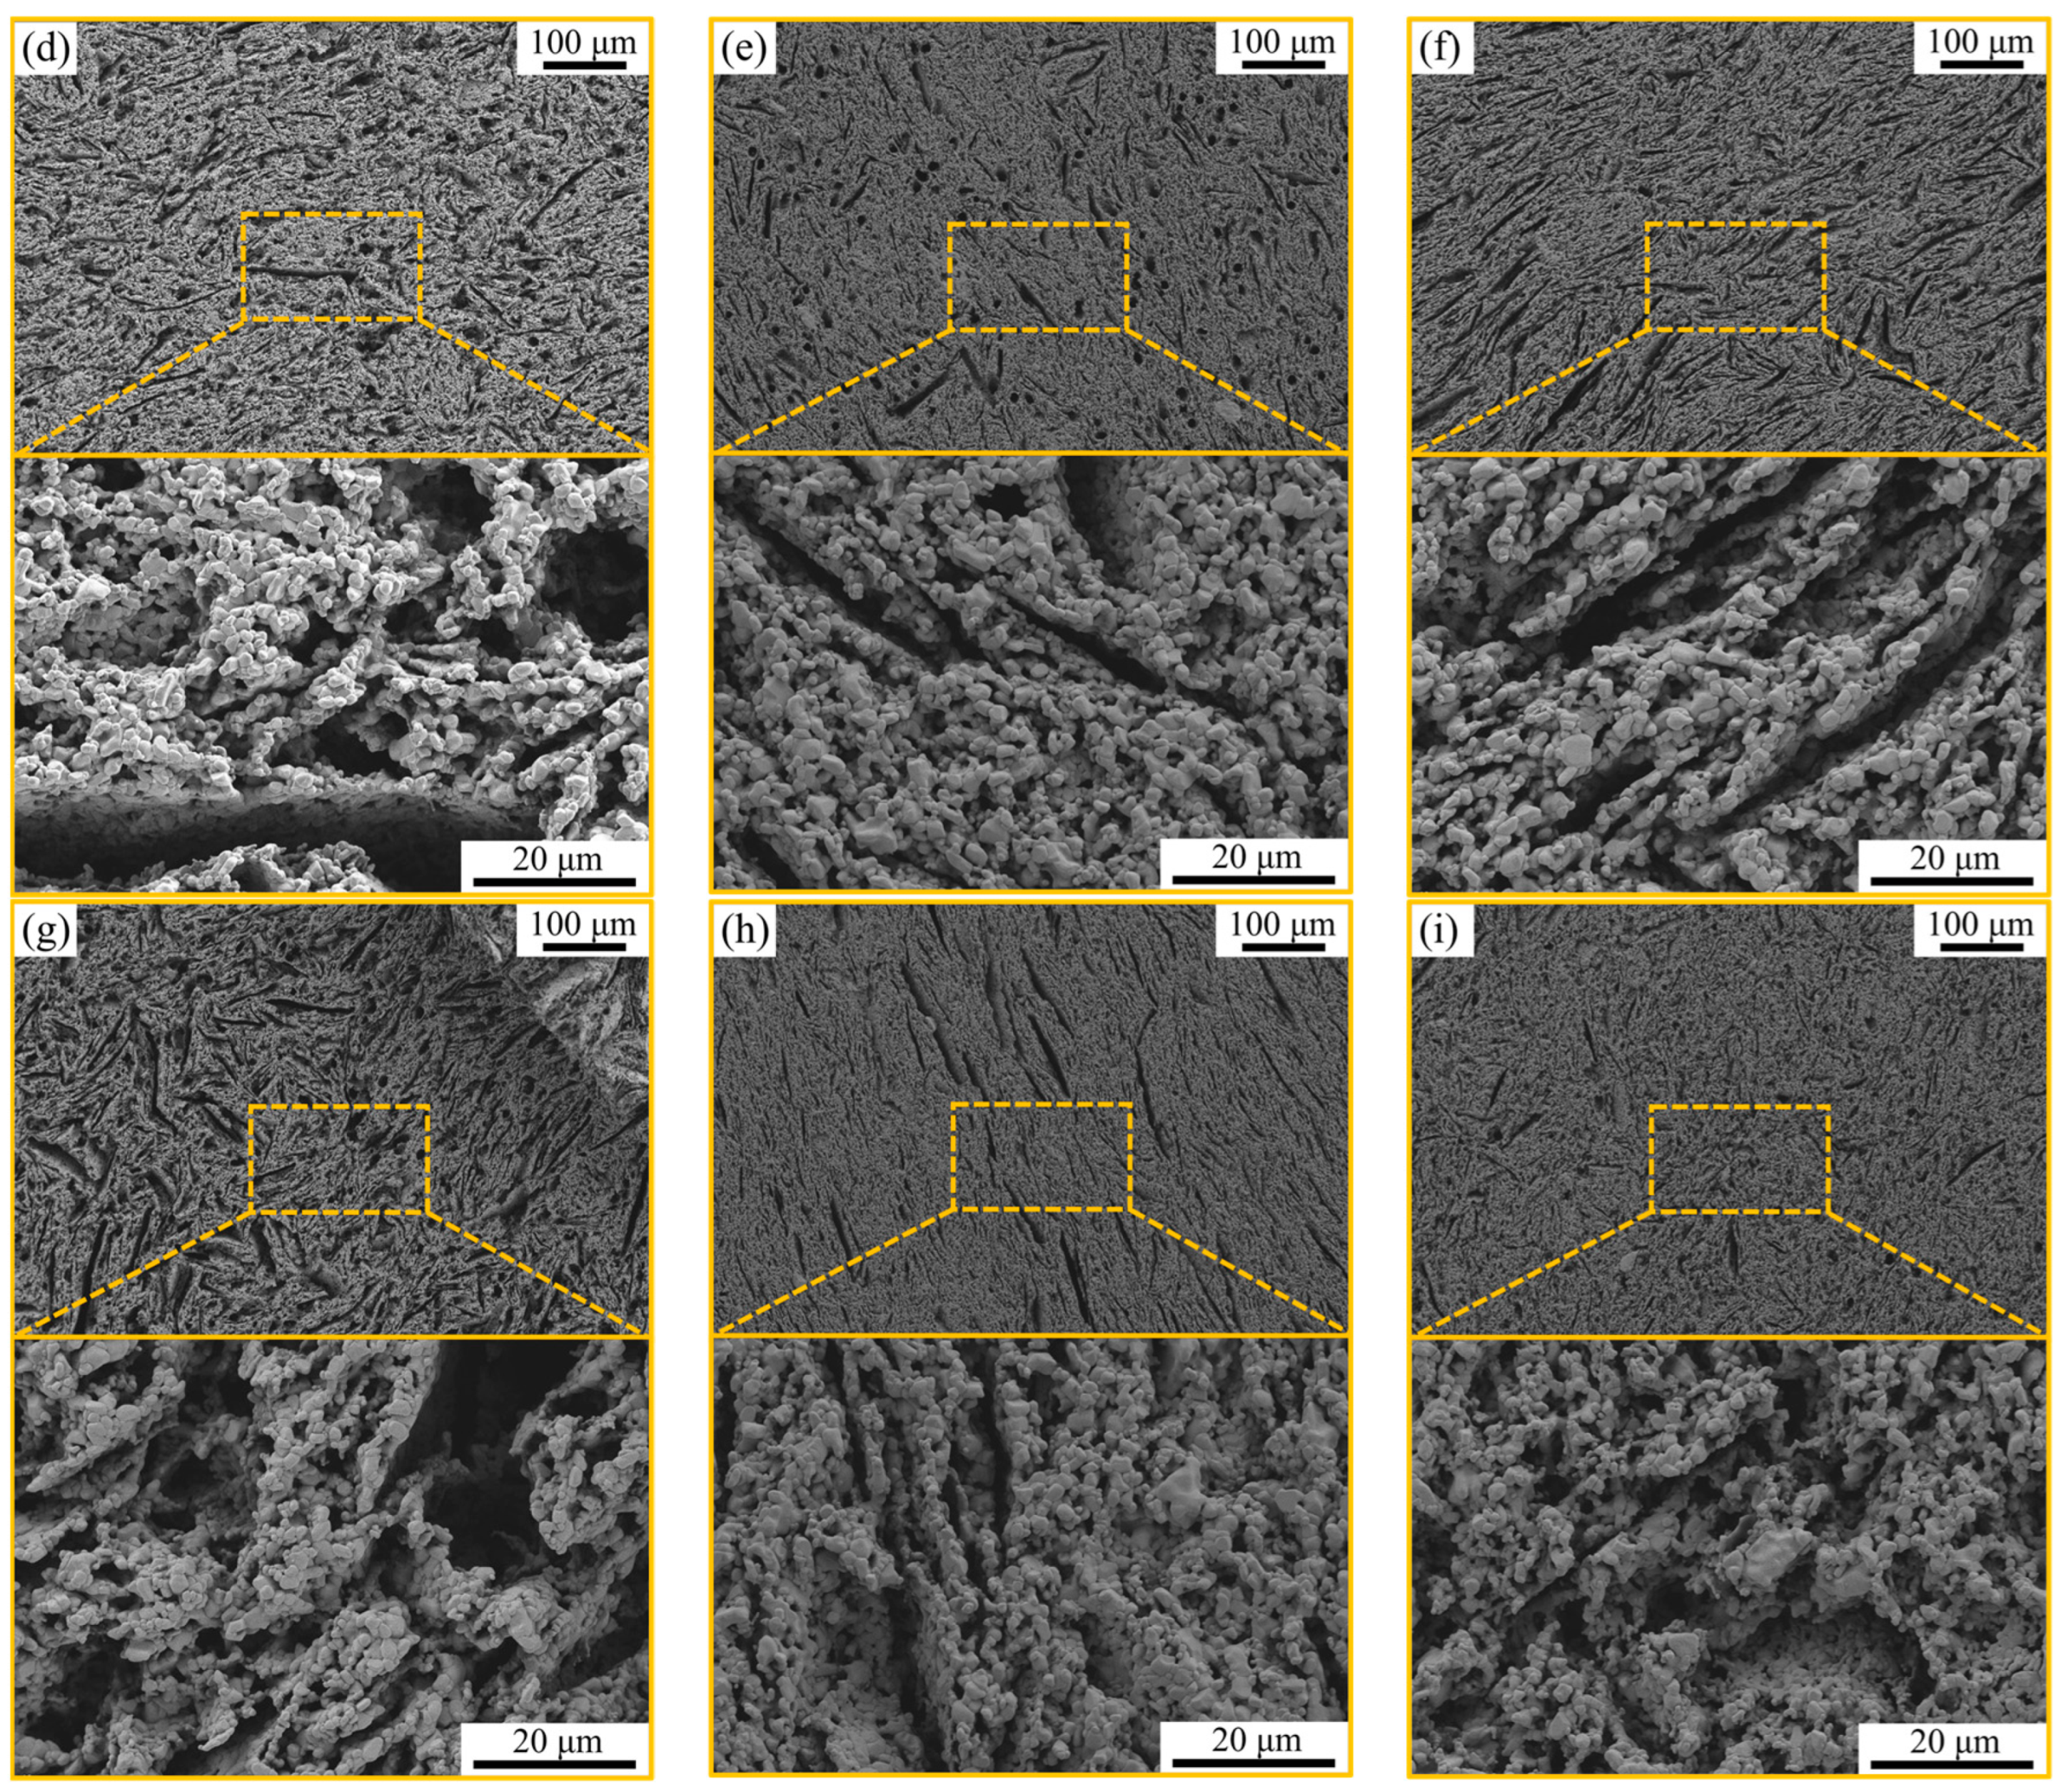
The surface morphology of the sintered porous alumina samples with 70 vol.% pore-forming agents is shown in Figure 6 (Figure 6a–i represent samples C11–C33, respectively). In the past, porous materials were prepared by a single pore-forming agent, but the composite pore-forming agents were studied, and the morphology of the pore-forming agent was different: one is fibrous, the other is flat. From the figure, the pore structures of the samples maintained the fibrous shape of the original CF and the flake morphology of graphite. The pore sizes were uniformly distributed, indicating that the pore-forming agents were uniformly distributed in the raw material mixture before sintering. The alumina particles were sintered together to form larger grains, and the alumina ceramic matrix was not very dense. This is attributed to the relatively high aspect ratio of CF, and the direction of mixing in the raw material mixture was random; thus, large pores were generated during the prepressing of the performer. Moreover, there were many small pores, and the sizes of the alumina ceramic particles were also relatively low. For the porous alumina samples with 30 and 50 vol.% pore-forming agents, the microscopic morphology was similar to that of the sample with 70 vol.% pore-forming agents, and the pore shapes were fibrous and flaky, but the pore content was slightly reduced.
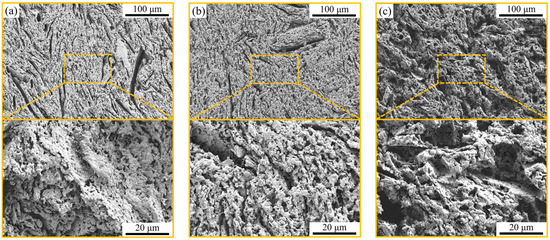
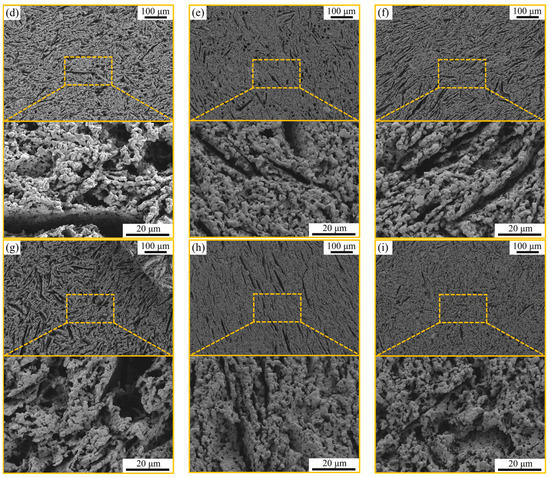
Figure 6.
Scanning electron microscopy (SEM) images of porous alumina samples with 70 vol.% pore-forming agents. (a) 90 μm CF:Graphite = 3:7; (b) 150 μm CF:Graphite = 3:7; (c) 200 μm CF:Graphite = 3:7; (d) 90 μm CF:Graphite = 5:5; (e) 150 μm CF:Graphite = 5:5; (f) 200 μm CF:Graphite = 5:5; (g) 90 μm CF:Graphite = 7:3; (h) 150 μm CF:Graphite = 7:3; (i) 200 μm CF:Graphite = 7:3.
3.4. Fractal Characteristics of Porous Alumina
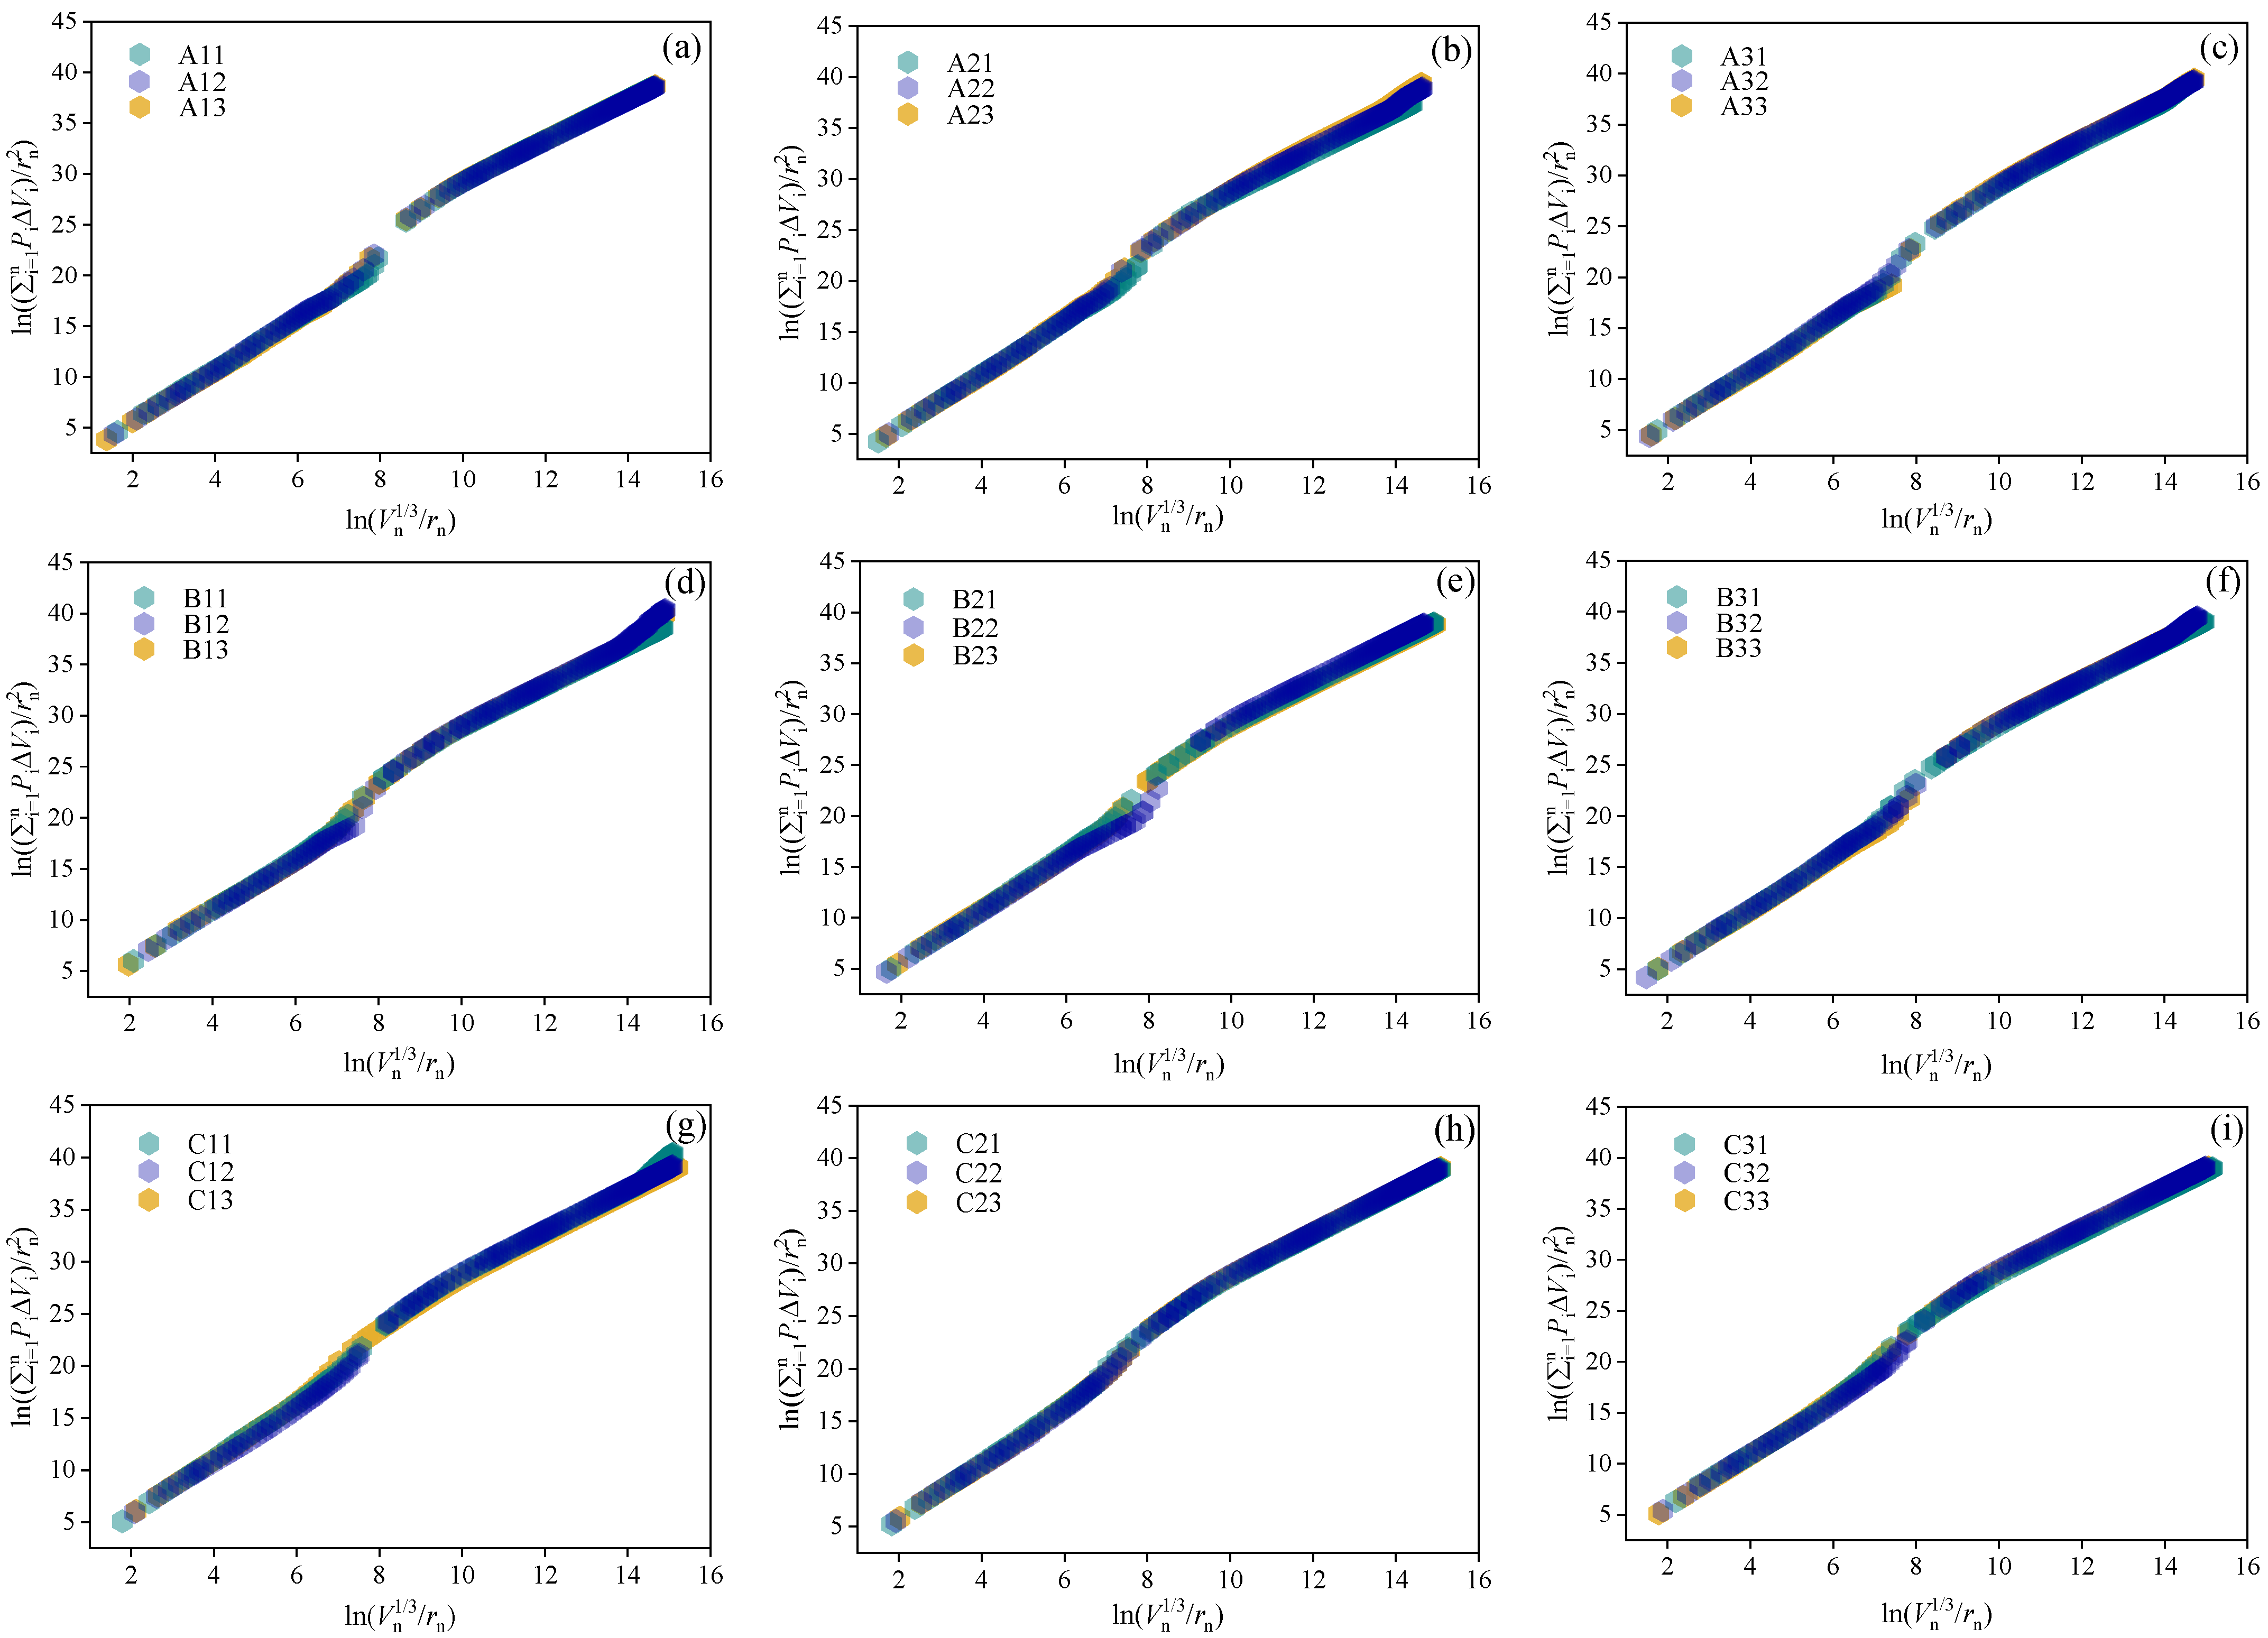
Based on the MIP experimental data and Equation (5), the Ds and determination coefficient (R2) of porous alumina samples with different pore-forming agent contents were calculated, as shown in Figure 7. The Ds and R2 of the porous alumina samples with different pore-forming agents are listed in Table 3.
Figure 7.
Bi-logarithmic plots of and for porous alumina samples with different pore-forming agent contents. (a) 30 vol.% pore formers (CF:Graphite = 3:7) + 70 vol.% alumina; (b) 30 vol.% pore formers (CF:Graphite = 5:5) + 70 vol.% alumina; (c) 30 vol.% pore formers (CF:Graphite = 7:3) + 70 vol.% alumina; (d) 50 vol.% pore formers (CF:Graphite = 3:7) + 50 vol.% alumina; (e) 50 vol.% pore formers (CF:Graphite = 5:5) + 50 vol.% alumina; (f) 50 vol.% pore formers (CF:Graphite = 7:3) + 50 vol.% alumina; (g) 70 vol.% pore formers (CF:Graphite = 3:7) + 30 vol.% alumina; (h) 70 vol.% pore formers (CF:Graphite = 5:5) + 30 vol.% alumina; (i) 70 vol.% pore formers (CF:Graphite = 7:3) + 30 vol.% alumina.
Table 3.
Surface fractal dimensions (Ds) of porous alumina pore surfaces.
The regression of the MIP results for 27 porous alumina samples showed that there was a good correlation between and for Ds between 2 and 3, and the correlation coefficients R2 were more than 0.98. The strong correlation indicates that the fractal characteristics of the pore structure of the porous alumina samples were significant. Comparing the data of samples, A, B, and C, the fractal dimensions gradually decreased with an increase in the volume fraction of the pore-forming agent. With an increase in the pore-forming agent, the porosity in the samples increased, and more small pores interconnected to form large pores. With an increase in the CF content, the CF agglomerated in the ceramic matrix, thereby worsening the dispersion. In addition, the fibers overlapped and staggered frequently. Thus, the proportion of macropores increased, and the pore structure complexity and Ds decreased.
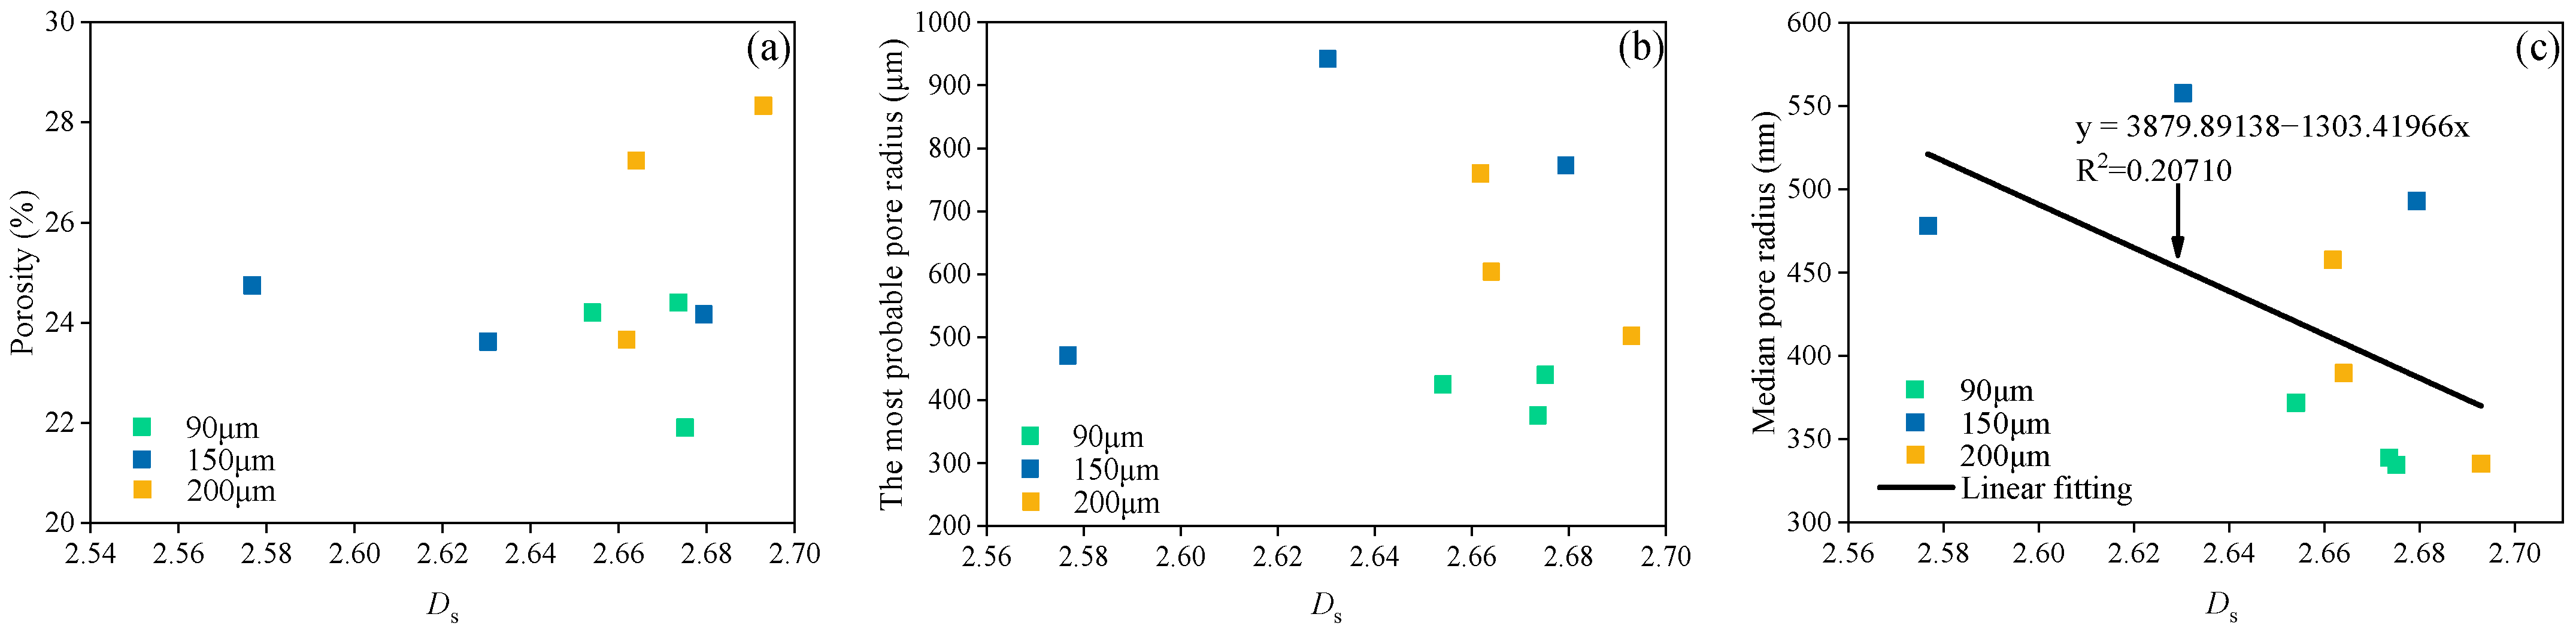
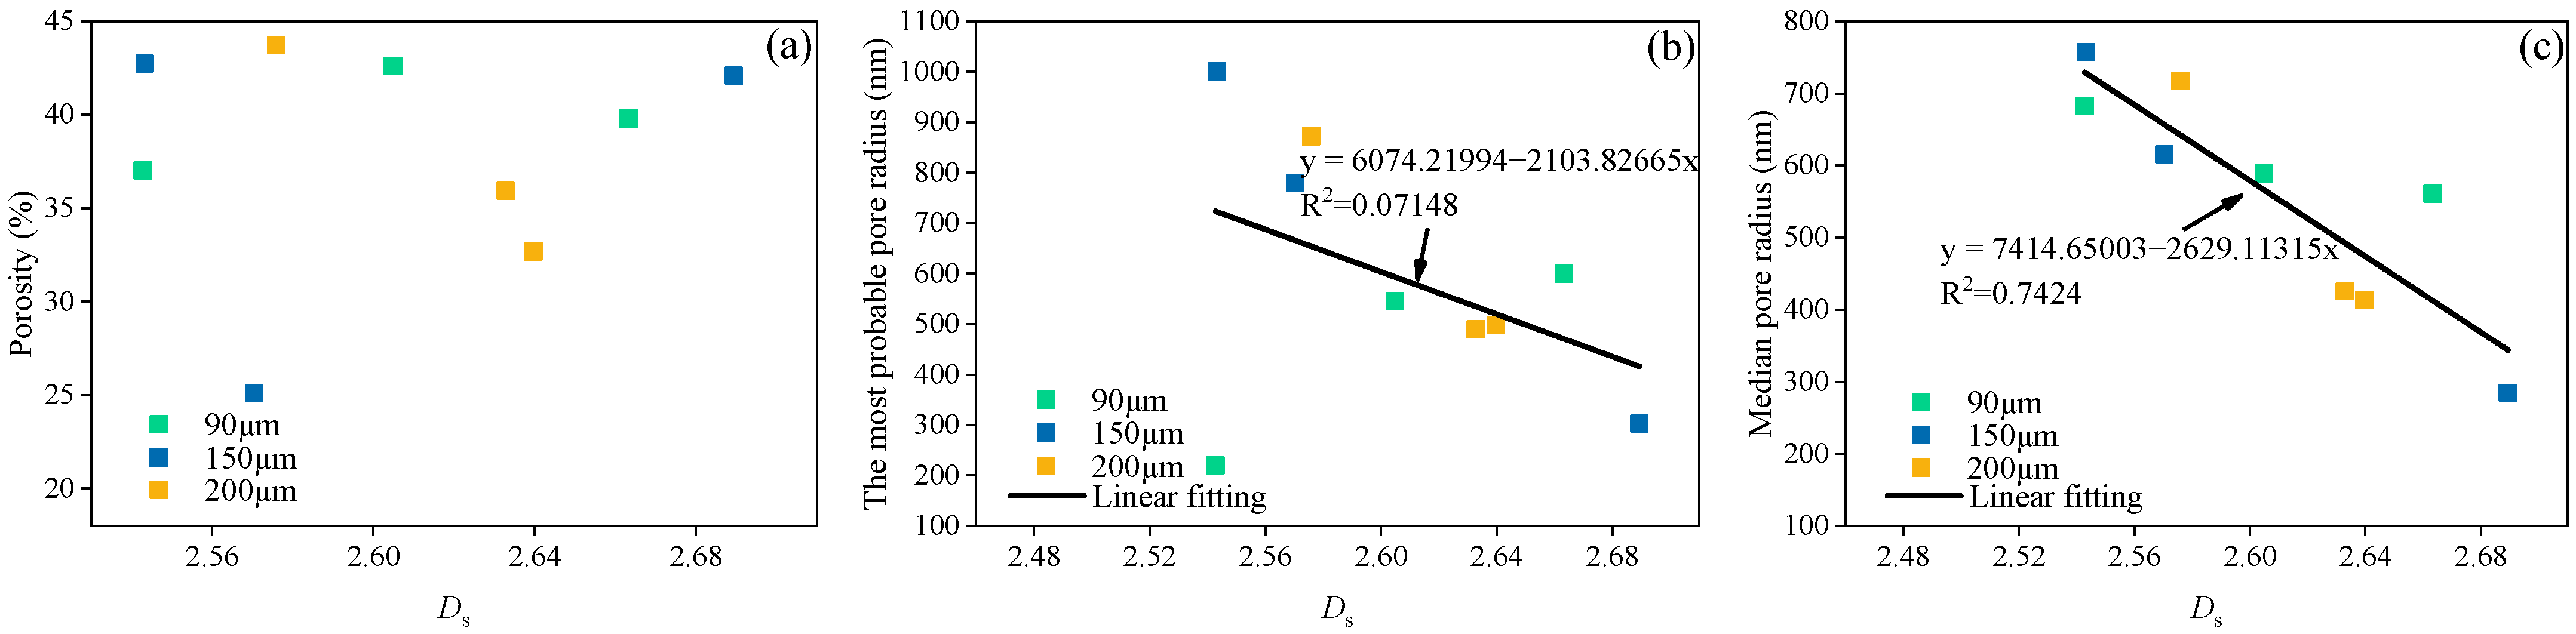
Figure 8 and Figure 9 show the Ds of the porous alumina samples versus the porosity, most probable pore size, and median pore size of the samples for pore-forming agent contents of 30 vol.% and 50 vol.%, respectively. There is a weak or no correlation between the Ds of the samples and the pore structure parameters for the two pore-forming agent contents, the data dispersion is large, and R2 between the two is low. When the content of the pore-forming agent was low, the distribution of CF was not regular with a change in the CF aspect ratio and content, and the randomness of the pore composition in the sample was large. Therefore, there was no close relationship between Ds and the pore structure of these samples.
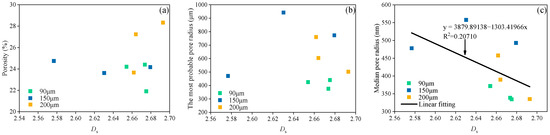
Figure 8.
Relationship between Ds and (a) porosity, (b) the most probable pore size, and (c) median pore radius for porous alumina samples with 30 vol.% pore-forming agents.
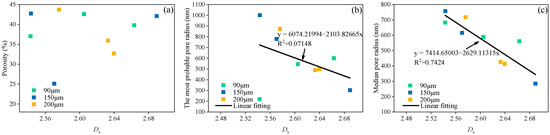
Figure 9.
Relationship between Ds and (a) porosity, (b) the most probable pore size, and (c) median pore radius for porous alumina samples with 50 vol.% pore-forming agents.
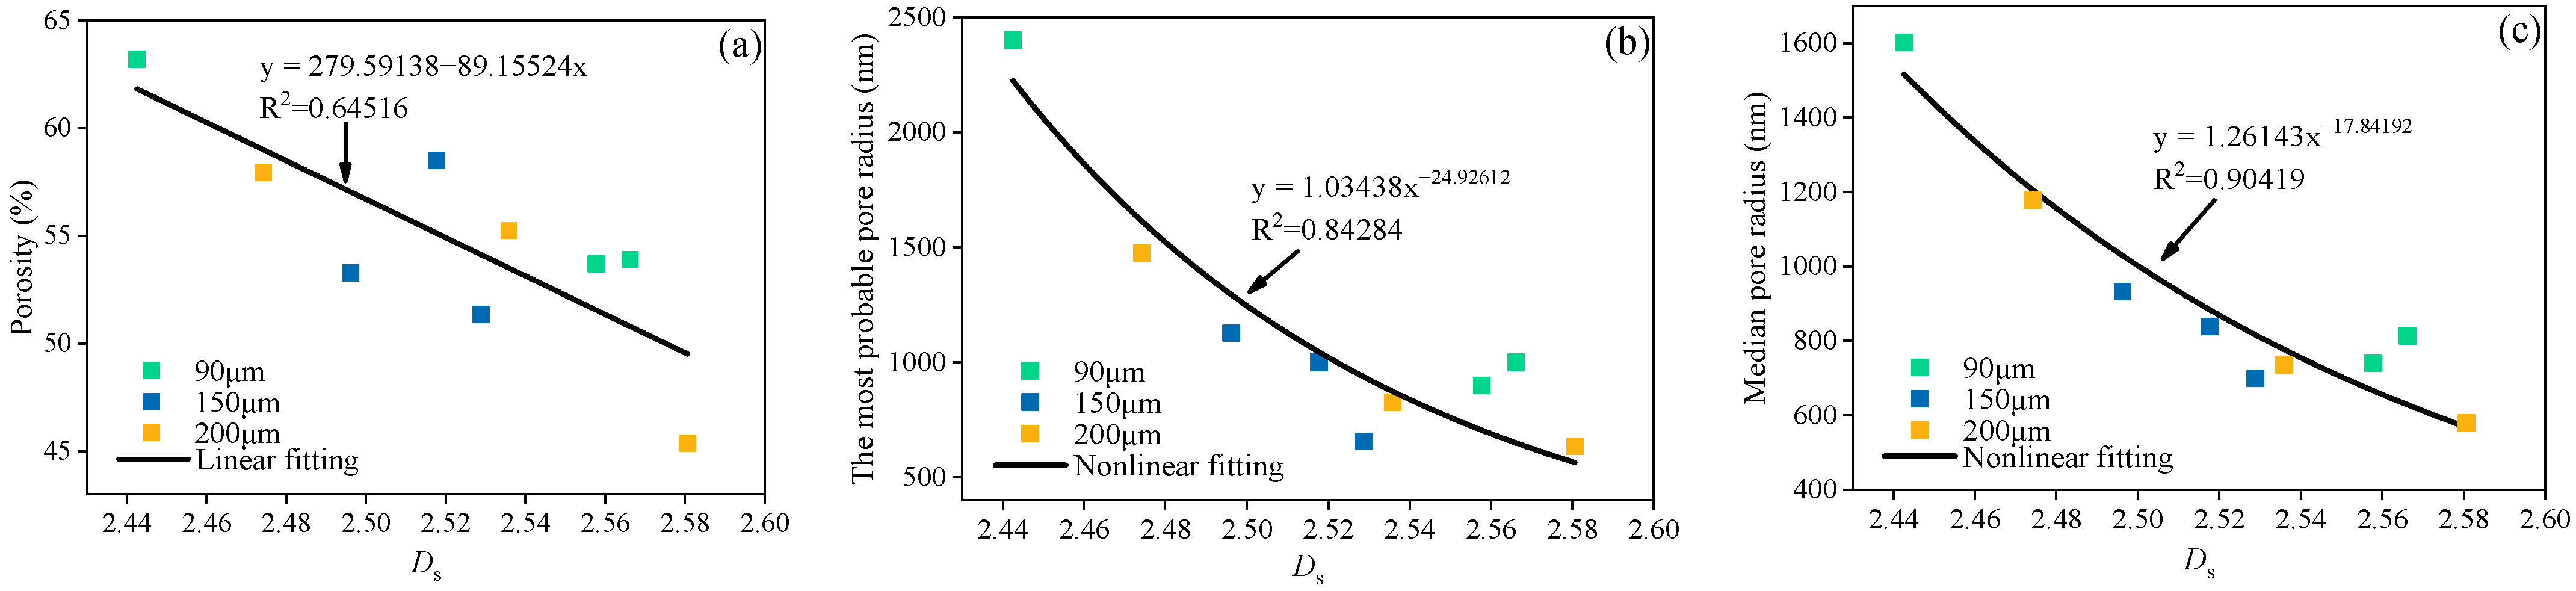
The relationships between the Ds and porosity, most probable pore size and median pore size of the samples with 70 vol.% pore-forming agents are shown in Figure 10. The porosity, most probable pore size, and median pore size of the samples decreased with increasing Ds. Among them, the porosity varied linearly with Ds, showing an R2 of 0.64516. The most probable pore size and median pore size have exponential relationships with Ds with a negative regression index and a high R2 of 0.84284 and 0.90419, respectively. The results showed that the Ds of porous alumina samples and the structure parameters were closely related, indicating that the pore structure could be accurately and comprehensively characterized using Ds.
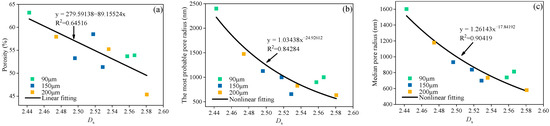
Figure 10.
Relationship between Ds and (a) porosity, (b) the most probable pore size, and (c) median pore radius of porous alumina samples with 70 vol.% pore-forming agents.
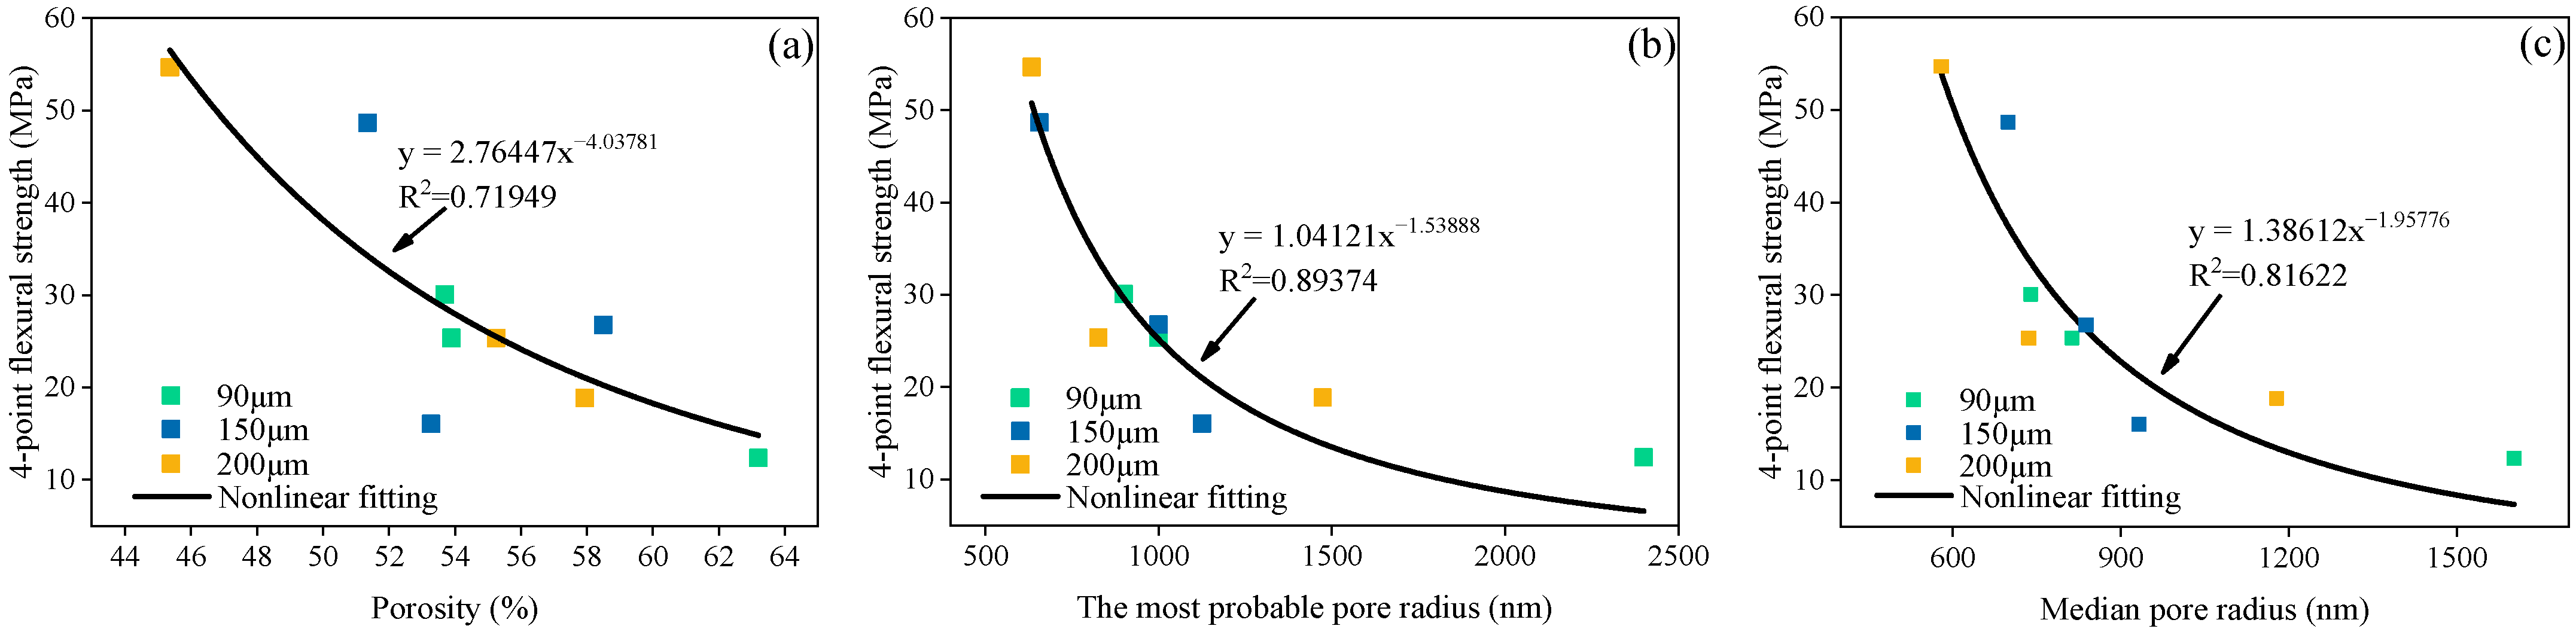
The relationships between the porosity, most probable pore size, median pore size, and flexural strength of the samples with 70 vol.% pore-forming agents are shown in Figure 11. The flexural strength of the samples decreased with an increase in the porosity, most probable pore size, and median pore size, showing negative correlations. R2 of 0.71949, 0.89374, and 0.81622, respectively, were obtained by nonlinear fitting, indicating that the pore structure of the samples is closely related to the flexural strength. In other words, the larger the pores and the higher the porosity in the sample, the lower the flexural strength of the sample.
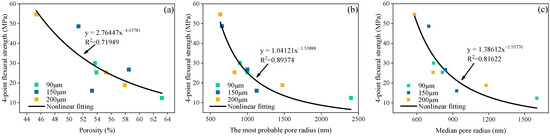
Figure 11.
Relationship between flexural strength and (a) porosity, (b) the most probable pore size, and (c) median pore radius of porous alumina samples with 70 vol.% pore-forming agents.
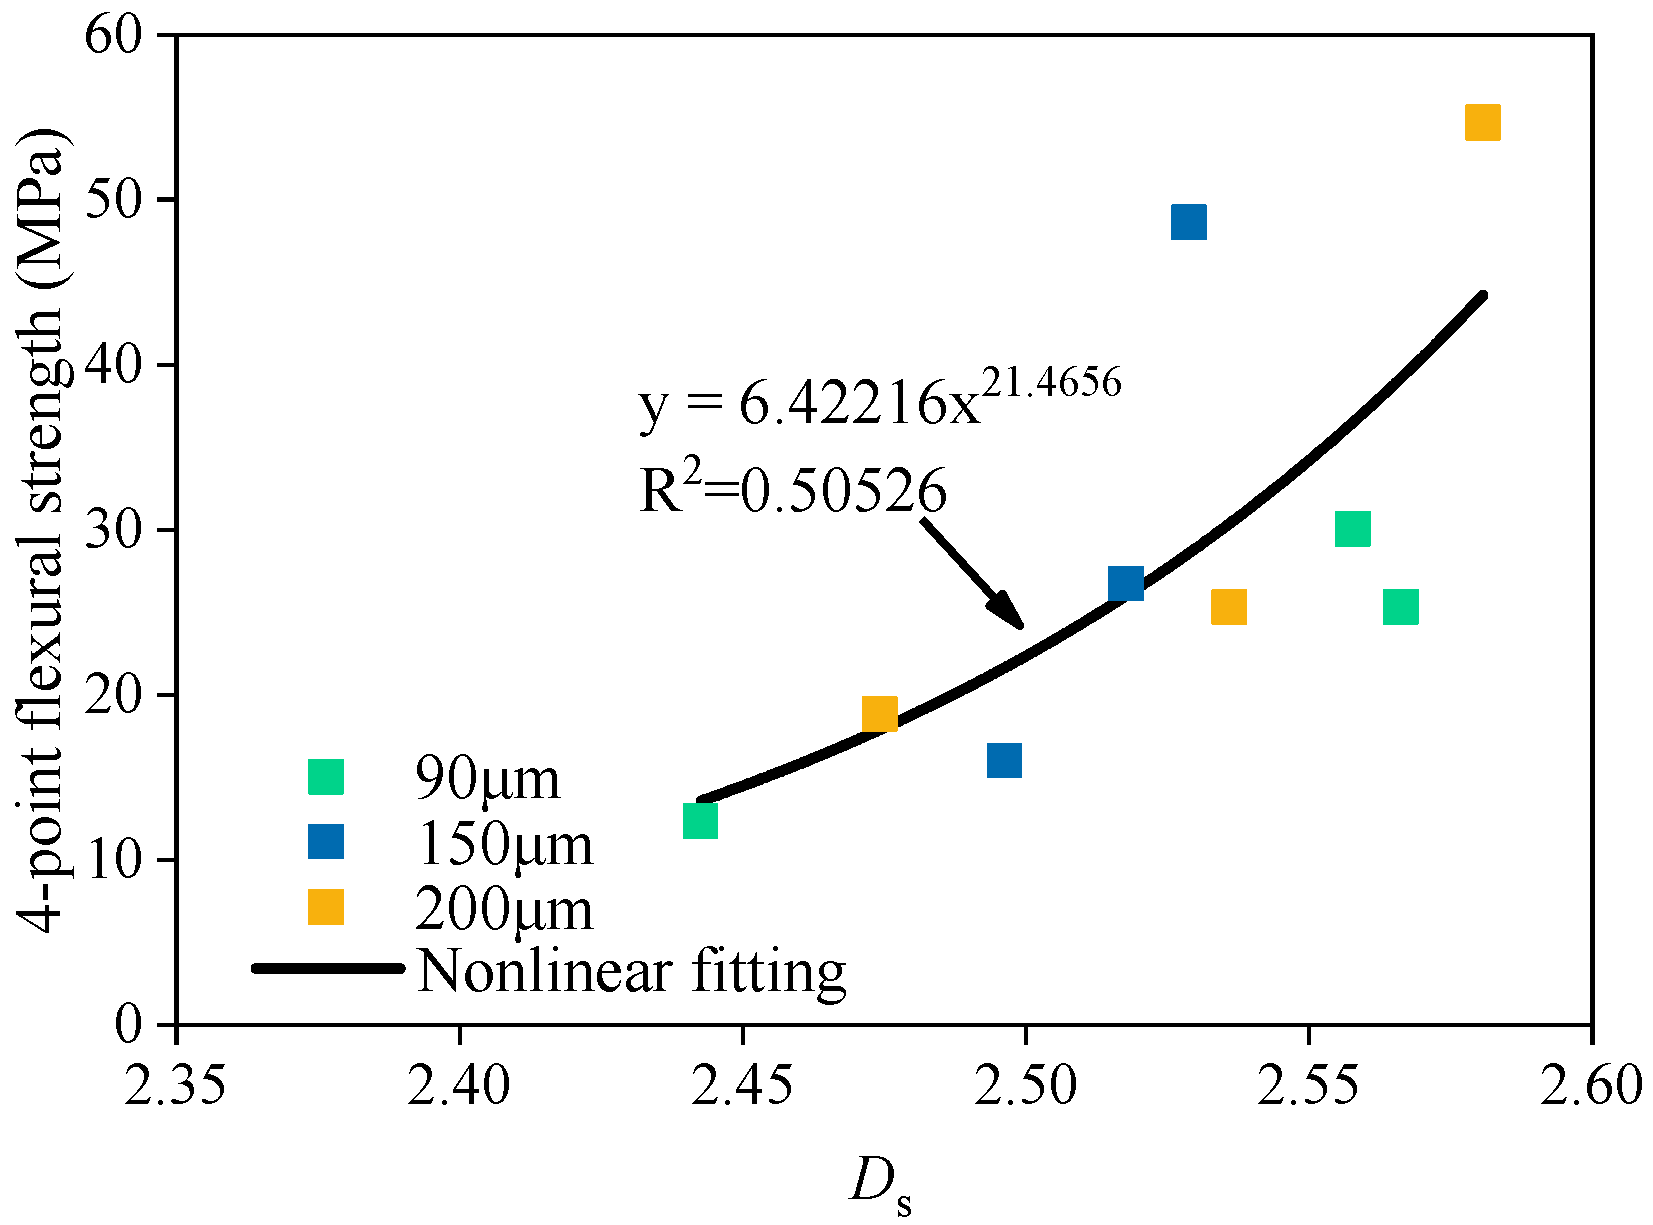
The relationship between the flexural strength and Ds of porous alumina samples with 70 vol.% pore-forming agents is shown in Figure 12. The flexural strength and Ds showed an exponential relationship with a negative regression index. This indicates that the flexural strength of the samples gradually increased as Ds increased. In other words, with a decrease in porosity, the relative content of the pores increased, and the complexity of the pore structure increased accordingly, which is consistent with the results in Figure 11.
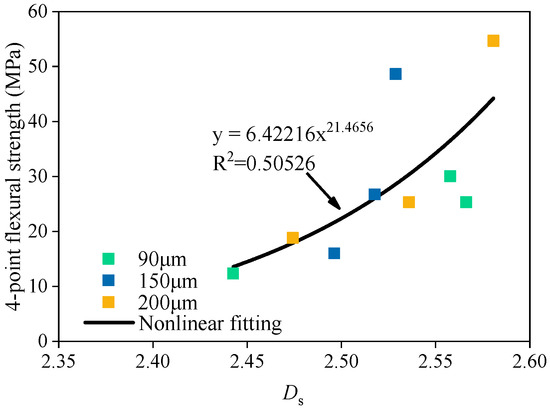
Figure 12.
Relationship between the flexural strength and Ds of porous alumina samples with 70 vol.% pore-forming agents.
4. Conclusions
The pore structure and morphology of the prepared porous alumina samples varied with the volume content of the pore-forming agents, CF to graphite ratio, and CF aspect ratios. With 70 vol.% pore-forming agents, the formation of double or multiple peaks was hindered, and as the volume fraction of the pore-forming agent increased, the porosity of the samples increased, especially the open pore rate, and the proportion of large pores in the samples increased. The increase in the proportion of large pores and porosity decreased the flexural strength of the samples. The pore structure of the samples had significant fractal characteristics. There was no significant correlation between Ds and the pore structure parameters of the samples when the pore-forming agents were 30 and 50 vol.% because CF decreased the densification of the samples. When the content of the pore-forming agents was low, as the CF aspect ratio and content varied, the randomness of the pore composition within the samples improved, and the complexity of the pore structure changed nonuniformly. When the content of the pore-forming agents was 70 vol.%, the proportion of large pores in the samples increased, and the pore structure complexity decreased. Ds was closely and highly negatively correlated with the pore structure parameters of the samples. In addition, the pore structure significantly affected the mechanical properties of the samples. The Ds of the samples was positively correlated with the flexural strength; it increased with an increase in the flexural strength of the samples.
Author Contributions
Conceptualization, C.C.; methodology, C.C.; validation, L.F.; formal analysis, C.C. and L.F.; investigation, L.F.; resources, C.C.; data curation, C.C.; writing—original draft preparation, L.F.; writing—review and editing, C.C.; supervision, C.C.; project administration, Y.W. and C.C.; funding acquisition, Y.W. All authors have read and agreed to the published version of the manuscript.
Funding
This research was funded by the National Natural Science Foundation of China (No. 51974218).
Institutional Review Board Statement
Not applicable.
Informed Consent Statement
Not applicable.
Data Availability Statement
The data are available from the corresponding author upon request.
Conflicts of Interest
The authors declare no conflict of interest.
References
- Dang, W.; Wang, W.; Wu, P.; Li, F.; Zhao, K.; Tang, Y. Freeze-cast porous AL2O3 ceramics strengthened by up to 80% ceramics fibers. Ceram. Int. 2022, 48, 9835–9841. [Google Scholar] [CrossRef]
- Yang, J.; Long-Hua, X.U.; Hou-Qin, W.U.; Jin, J. Preparation and properties of porous ceramics from spodumene flotation tailings by low-temperature sintering. T. Nonferr. Metal. Soc. 2021, 31, 2797–2811. [Google Scholar] [CrossRef]
- Zhang, Y.; Wu, Y.; Yang, X.; Li, D.; Zhang, X.; Dong, X.; Yao, X.; Liu, J.; Guo, A. High-strength thermal insulating mullite nanofibrous porous ceramics. J. Eur. Ceram. Soc. 2020, 40, 2090–2096. [Google Scholar] [CrossRef]
- Yu, J.; Yang, Z.; Song, Z.; Deng, K.; Ren, Z. Preparation of porous al 2 o 3 ceramics with in situ formed c-nanowires derived form silicone resin. Mater. Lett. 2018, 212, 271–274. [Google Scholar] [CrossRef]
- Liu, R.; Xu, T.; Wang, C.-A. A review of fabrication strategies and applications of porous ceramics prepared by freeze-casting method. Ceram. Int. 2016, 42, 2907–2925. [Google Scholar] [CrossRef]
- Mocciaro, A.; Lombardi, M.B.; Scian, A.N. Ceramic material porous structure prepared using pore-forming additives. Refract. Ind. Ceram. 2017, 58, 65–68. [Google Scholar] [CrossRef]
- Studart, A.R.; Gonzenbach, U.T.; Tervoort, E.; Gauckler, L.J. Processing routes to macroporous ceramics: A review. J. Am. Ceram. Soc. 2006, 89, 1771–1789. [Google Scholar] [CrossRef]
- Kultayeva, S.; Kim, Y.W.; Song, I.H. Effects of dopants on electrical, thermal, and mechanical properties of porous sic ceramics. J. Eur. Ceram. Soc. 2021, 41, 4006–4015. [Google Scholar] [CrossRef]
- Novais, R.M.; Seabra, M.P.; Labrincha, J.A. Ceramic tiles with controlled porosity and low thermal conductivity by using pore-forming agents. Ceram. Int. 2014, 40, 11637–11648. [Google Scholar] [CrossRef]
- Xu, H.; Liu, J.; Guo, A.; Du, H.; Hou, Z. Porous silica ceramics with relatively high strength and novel bi-modal pore structure prepared by a TBA-based gel-casting method. Ceram. Int. 2012, 38, 1725–1729. [Google Scholar] [CrossRef]
- Wei, Z.; Li, S.; Li, Y.; Li, X.; Xiang, R.; Xu, N. Porous alumina ceramics with enhanced mechanical and thermal insulation properties based on sol-treated rice husk. Ceram. Int. 2018, 44, 22616–22621. [Google Scholar] [CrossRef]
- Liu, J.; Ren, B.; Wang, Y.; Lu, Y.; Wang, L.; Chen, Y.; Yang, J.; Huang, Y. Hierarchical porous ceramics with 3d reticular architecture and efficient flow-through filtration towards high-temperature particulate matter capture. Chem. Eng. J. 2019, 362, 504–512. [Google Scholar] [CrossRef]
- Hammel, E.C.; Ighodaro, O.L.R.; Okoli, O.I. Processing and properties of advanced porous ceramics: An application based review. Ceram. Int. 2014, 40, 15351–15370. [Google Scholar] [CrossRef]
- Vogt, U.F.; Györfy, L.; Herzog, A.; Graule, T.; Plesch, G. Macroporous silicon carbide foams for porous burner applications and catalyst supports. J. Phys. Chem. Solids 2007, 68, 1234–1238. [Google Scholar] [CrossRef]
- Guzman, I.Y. Certain principles of formation of porous ceramic structures. Properties and applications (A review). Glass Ceram. 2003, 60, 280–283. [Google Scholar] [CrossRef]
- Zuo, K.H.; Zeng, Y.P.; Jiang, D. Effect of polyvinyl alcohol additive on the pore structure and morphology of the freeze-cast hydroxyapatite ceramics. Mat. Sci. Eng. C-Mater. 2010, 30, 283–287. [Google Scholar] [CrossRef]
- Chen, F.; Ma, L.; Shen, Q.; Zhang, L. Pore structure control of starch processed silicon nitride porous ceramics with near-zero shrinkage. Mater. Lett. 2011, 65, 1410–1412. [Google Scholar] [CrossRef]
- Liu, J.; Ren, B.; Zhu, T.; Yan, S.; Zhang, X.; Huo, W.; Chen, Y.; Yang, J. Enhanced mechanical properties and decreased thermal conductivity of porous alumina ceramics by optimizing pore structure. Ceram. Int. 2018, 44, 13240–13246. [Google Scholar] [CrossRef]
- Yang, H.M.; Zhang, S.M.; Wang, L.; Chen, P.; Shao, D.K.; Tang, S.W.; Li, J.Z. High-ferrite portland cement with slag: Hydration, microstructure, and resistance to sulfate attack at elevated temperature. Cement Concrete Comp. 2022, 130, 104560. [Google Scholar] [CrossRef]
- Li, X.; Yao, D.; Zuo, K.; Xia, Y.; Yin, J.; Liang, H.; Zeng, Y.P. Fabrication, microstructural characterization and gas permeability behavior of porous silicon nitride ceramics with controllable pore structures. J. Eur. Ceram. Soc. 2019, 39, 2855–2861. [Google Scholar] [CrossRef]
- Zhang, J.; Bian, F.; Zhang, Y.; Fang, Z.; Fu, C.; Guo, J. Effect of pore structures on gas permeability and chloride diffusivity of concrete. Constr. Build. Mater. 2018, 163, 402–413. [Google Scholar] [CrossRef]
- Lei, H.; Wu, X.; Chen, R. Preparation of porous alumina abrasives and their chemical mechanical polishing behavior. Thin Solid Films 2012, 520, 2868–2872. [Google Scholar] [CrossRef]
- Song, Y.; Zhou, J.-W.; Bian, Z.-N.; Dai, G.-Z. Pore structure characterization of hardened cement paste by multiple methods. Adv. Mater. Sci. Eng. 2019, 2019, 3726953. [Google Scholar] [CrossRef]
- Brun, M.; Casnedi, L.; Pia, G. Bending strength of porous ceramics tiles: Bounds and estimates of effective properties of an intermingled fractal units’ model. Ceram. Int. 2018, 44, 10241–10248. [Google Scholar] [CrossRef]
- Zeng, Q.; Chen, S.; Yang, P.; Peng, Y.; Wang, J.; Zhou, C.; Wang, Z.; Yan, D. Reassessment of mercury intrusion porosimetry for characterizing the pore structure of cement-based porous materials by monitoring the mercury entrapments with x-ray computed tomography. Cement Concrete Comp. 2020, 113, 103726. [Google Scholar] [CrossRef]
- Mandelbrot; Benoit, B. The fractal geometry of nature. Am. J. Phys. 1998, 51, 268–287. [Google Scholar] [CrossRef]
- Posadas, A.N.D.; Giménez, D.; Quiroz, R.; Protz, R. Multifractal characterization of soil pore systems. Soil Sci. Soc. Am. J. 2003, 67, 1631–1639. [Google Scholar] [CrossRef]
- Peng, Y.; Tang, S.; Huang, J.; Tang, C.; Wang, L.; Liu, Y. Fractal analysis on pore structure and modeling of hydration of magnesium phosphate cement paste. Fractal Fract. 2022, 6, 337. [Google Scholar] [CrossRef]
- Jin, S.; Zhang, J.; Han, S. Fractal analysis of relation between strength and pore structure of hardened mortar. Constr. Build. Mater. 2017, 135, 1–7. [Google Scholar] [CrossRef]
- Meng, Q.; Qin, Q.; Yang, H.; Zhou, H.; Wu, K.; Wang, L. Fractal characteristics of the pore structure of coral powder-cement slurry under different fractal models. Fractal Fract. 2022, 6, 145. [Google Scholar] [CrossRef]
- Li, D.; Niu, D.; Fu, Q.; Luo, D. Fractal characteristics of pore structure of hybrid basalt–polypropylene fibre-reinforced concrete. Cem. Concr. Comp. 2020, 109, 103555. [Google Scholar] [CrossRef]
- Casnedi, L.; Licheri, R.; Brun, M.; Pia, G. From nature geometry to material design: Advanced fractal nature analysis for predicting experimental elastic properties. Ceram. Int. 2020, 46, 23947–23955. [Google Scholar] [CrossRef]
- Wang, L.; Zhou, S.; Shi, Y.; Huang, Y.; Zhao, F.; Huo, T.; Tang, S. The Influence of Fly Ash Dosages on the Permeability, Pore Structure and Fractal Features of Face Slab Concrete. Fractal Fract. 2022, 6, 476. [Google Scholar] [CrossRef]
- Wang, L.; Zeng, X.; Yang, H.; Lv, X.; Guo, F.; Shi, Y.; Hanif, A. Investigation and application of fractal theory in cement-based materials: A review. Fractal Fract. 2021, 5, 247. [Google Scholar] [CrossRef]
- Bai, S.; Guan, X. New approach for evaluating chloride ion penetration of mortar in cold environments. Adv. Cem. Res. 2021, 33, 285–294. [Google Scholar] [CrossRef]
- Wang, L.; Yu, Z.; Liu, B.; Zhao, F.; Tang, S.; Jin, M. Effects of fly ash dosage on shrinkage, crack resistance and fractal characteristics of face slab concrete. Fractal Fract. 2022, 6, 335. [Google Scholar] [CrossRef]
- Mahamud, M.; López, Ó.; Pis, J.J.; Pajares, J.A. Textural characterization of coals using fractal analysis. Fuel Process. Technol. 2003, 81, 127–142. [Google Scholar] [CrossRef]
- Neimark, A. A new approach to the determination of the surface fractal dimension of porous solids. Phys. A. 1992, 191, 258–262. [Google Scholar] [CrossRef]
- Zhang, B.; Li, S. Determination of the surface fractal dimension for porous media by mercury porosimetry. Ind. Eng. Chem. Res. 1995, 34, 1383–1386. [Google Scholar] [CrossRef]
- Cai, Y.; Liu, D.; Pan, Z.; Che, Y.; Liu, Z. Investigating the effects of seepage-pores and fractures on coal permeability by fractal analysis. Transp. Porous Med. 2015, 111, 479–497. [Google Scholar] [CrossRef]
- Chen, Y.; Guo, W.; Luo, Y.; Ma, Z.; Zhang, L.; Yue, Z. Microwave and terahertz properties of porous Ba4(Sm,Nd,Bi)28/3Ti18O54 ceramics obtained by sacrificial template method. J. Am. Ceram. Soc. 2021, 104, 5679–5688. [Google Scholar] [CrossRef]
- Hedayat, N.; Du, Y.; Ilkhani, H. Review on fabrication techniques for porous electrodes of solid oxide fuel cells by sacrificial template methods. Renew. Sust. Energy Rev. 2017, 77, 1221–1239. [Google Scholar] [CrossRef]

Publisher’s Note: MDPI stays neutral with regard to jurisdictional claims in published maps and institutional affiliations. |
© 2022 by the authors. Licensee MDPI, Basel, Switzerland. This article is an open access article distributed under the terms and conditions of the Creative Commons Attribution (CC BY) license (https://creativecommons.org/licenses/by/4.0/).