Article

The Formative Factors of a Rock Burst Based on Energy Calculations and the Experimental Verification of Butterfly-Shaped Plastic Zones

1
School of Civil Engineering and Architecture, Qingdao Huanghai University, Qingdao 266427, China
2
School of Safety Engineering, North China Institute of Science & Technology, Langfang 065201, China
3
School of Resource Engineering, Xi’an University of Architecture and Technology, Xi’an 710055, China
4
College of Safety Science and Engineering, Henan Polytechnic University, Jiaozuo 454003, China
5
Shandong Lansheng Mining Technology Co., Ltd., Weifang 262400, China
*
Author to whom correspondence should be addressed.
Fractal Fract. 2023, 7(11), 829; https://doi.org/10.3390/fractalfract7110829
Submission received: 4 September 2023 / Revised: 30 October 2023 / Accepted: 7 November 2023 / Published: 20 November 2023
(This article belongs to the Special Issue Fractal and Fractional in Geotechnical Engineering)

Abstract

:
The research on the formation factors of rock burst is one of the main research directions of rock mechanics in recent years, which is helpful to solve the problem of rock burst accidents. So, in this study, the calculation method of energy released during rock burst is first obtained by using different medium models, and then, the formation factors of rock bursts are obtained by comparing the calculation energy with the actual accident energy. The method of energy calculation utilizes the difference between elastoplastic and pure elastic models to innovatively quantify the specific values of energy released before and after the occurrence of the rock burst. It is considered that the stress and plastic zone state before the occurrence of rock burst have an important influence on the occurrence of the accident and are one of the formation factors, while the deviatoric stress field and butterfly-shaped plastic zone create conditions for greater energy release. In addition, the trigger stress constitutes another formation factor. The plastic zone state before rock failure is verified by the experimental test; the location distribution shape of acoustic emission (AE) events during the later stage of compression failure is approximately the same as theoretical result. The results also preliminarily indicated the fractal characteristics of acoustic emission events distribution before sample failure. The study obtained the formative factors of rock burst accident, which provides a new ideas and references for the research on the formation of rock bursts.

1. Introduction

The dynamic disasters of rock engineering perplex safe construction in many engineering fields. The so-called dynamic disasters mainly include rock burst occurring in tunnels [1], rock burst occurring in non-coal mines [2], rock burst occurring in coal mines (different from the disasters occurring in non-coal mines, the medium is coal, and the mining impact is greater) [3], coal and gas outbursts occurring in coal mines [4], slope collapses occurring during metro engineering [5], etc. The common point of these dynamic disasters is the instantaneous dynamic failure of coal or rock, which is often related to the medium state and human construction activities [6]. In terms of dynamic disasters, coal mine rock burst accidents have occurred more frequently in China in recent years, bringing huge pressure to safety production. The study of the mechanism of geotechnical engineering disasters is a fundamental work that can provide direction for subsequent monitoring [7,8], warning [9], and evaluation [10].
In view of the frequent occurrence of rock burst accidents in coal mines, scholars have also carried out a lot of research, mainly focusing on their occurrence mechanism [11], monitoring and early warning indicators [12] and methods [12,13], and risk treatment measures [11,14]. The research on the mechanism of rock burst dynamic disaster is the most important, which has attracted more scholars to study. In recent decades, various mechanisms have been formed, such as early energy theory [15], early strength theory [16], early stiffness theory [17], early rock burst tendency theory [18], intermediate instability theory [19], intermediate three-factor theory [20], intermediate three-criteria theory [21], later dynamic and static load theory [20], later rock burst initiation theory [22], later butterfly rock burst theory [23,24], etc. Some of these mechanisms or theories have put forward some concepts and descriptions, while others have established models and carried out strict mechanical derivation. which may be more scientific.
For the research methods of rock bursts, some studies focus on a specific condition, such as fault influence [25,26], high-strength mining faces [27,28], stress anomaly particularity [29], large vibration interference [30], periodic movement of hard roofs [31], etc. Other studies are conducted only from a certain angle, for example rock strength [32], stress analysis [33], energy analysis [34], special rock properties [20], gas coupling [35]. Some use theoretical reasoning and calculation [36,37], some use laboratory research [38,39], some use numerical simulation [40,41], and some only use a conceptual expression. Rigorous mathematical and mechanical reasoning is highly recommended for scientific and engineering problems, and numerical simulation can be used to reflect or verify regular problems. If the simplest calculation method and the simplest model can be established to explain the common problems for geotechnical engineering, the rock burst mechanism will be easier to reveal (like the famous Oakham criterion [42]: if there are two or more different hypotheses about the same phenomenon, the simpler or falsifiable one should be adopted).
As for the stress state when rock burst occurs, it is clear that it must be a situation with certain characteristics, and then the smaller triggering stress leads to the accident [43]. How the energy changes before and after the occurrence is directly related to the root cause of the occurrence mechanism. In order to study the mechanism of rock burst more scientifically, the energy conversion before, after, and during its occurrence is calculated from an energy perspective, which is an important research content in the field of rock dynamics. This study first proposes a method to calculate the system energy, and then obtains which mechanical state is more likely to reach the accident energy through this method. The results show that the butterfly-shaped plastic zone state caused by the bias stress field is more dangerous. Finally, the whole process AE monitoring of a loaded sample is carried out from the laboratory scale to verify the butterfly mode before failure. The experiment fully considered the specific situation of the original waveform, and adopted a more appropriate event location method, and finally obtained the butterfly-shaped plastic zone. The energy calculation method, rock burst mechanism, and its verification obtained in this study provide a new idea for the study of the rock burst mechanism.

2. Numerical Methodology

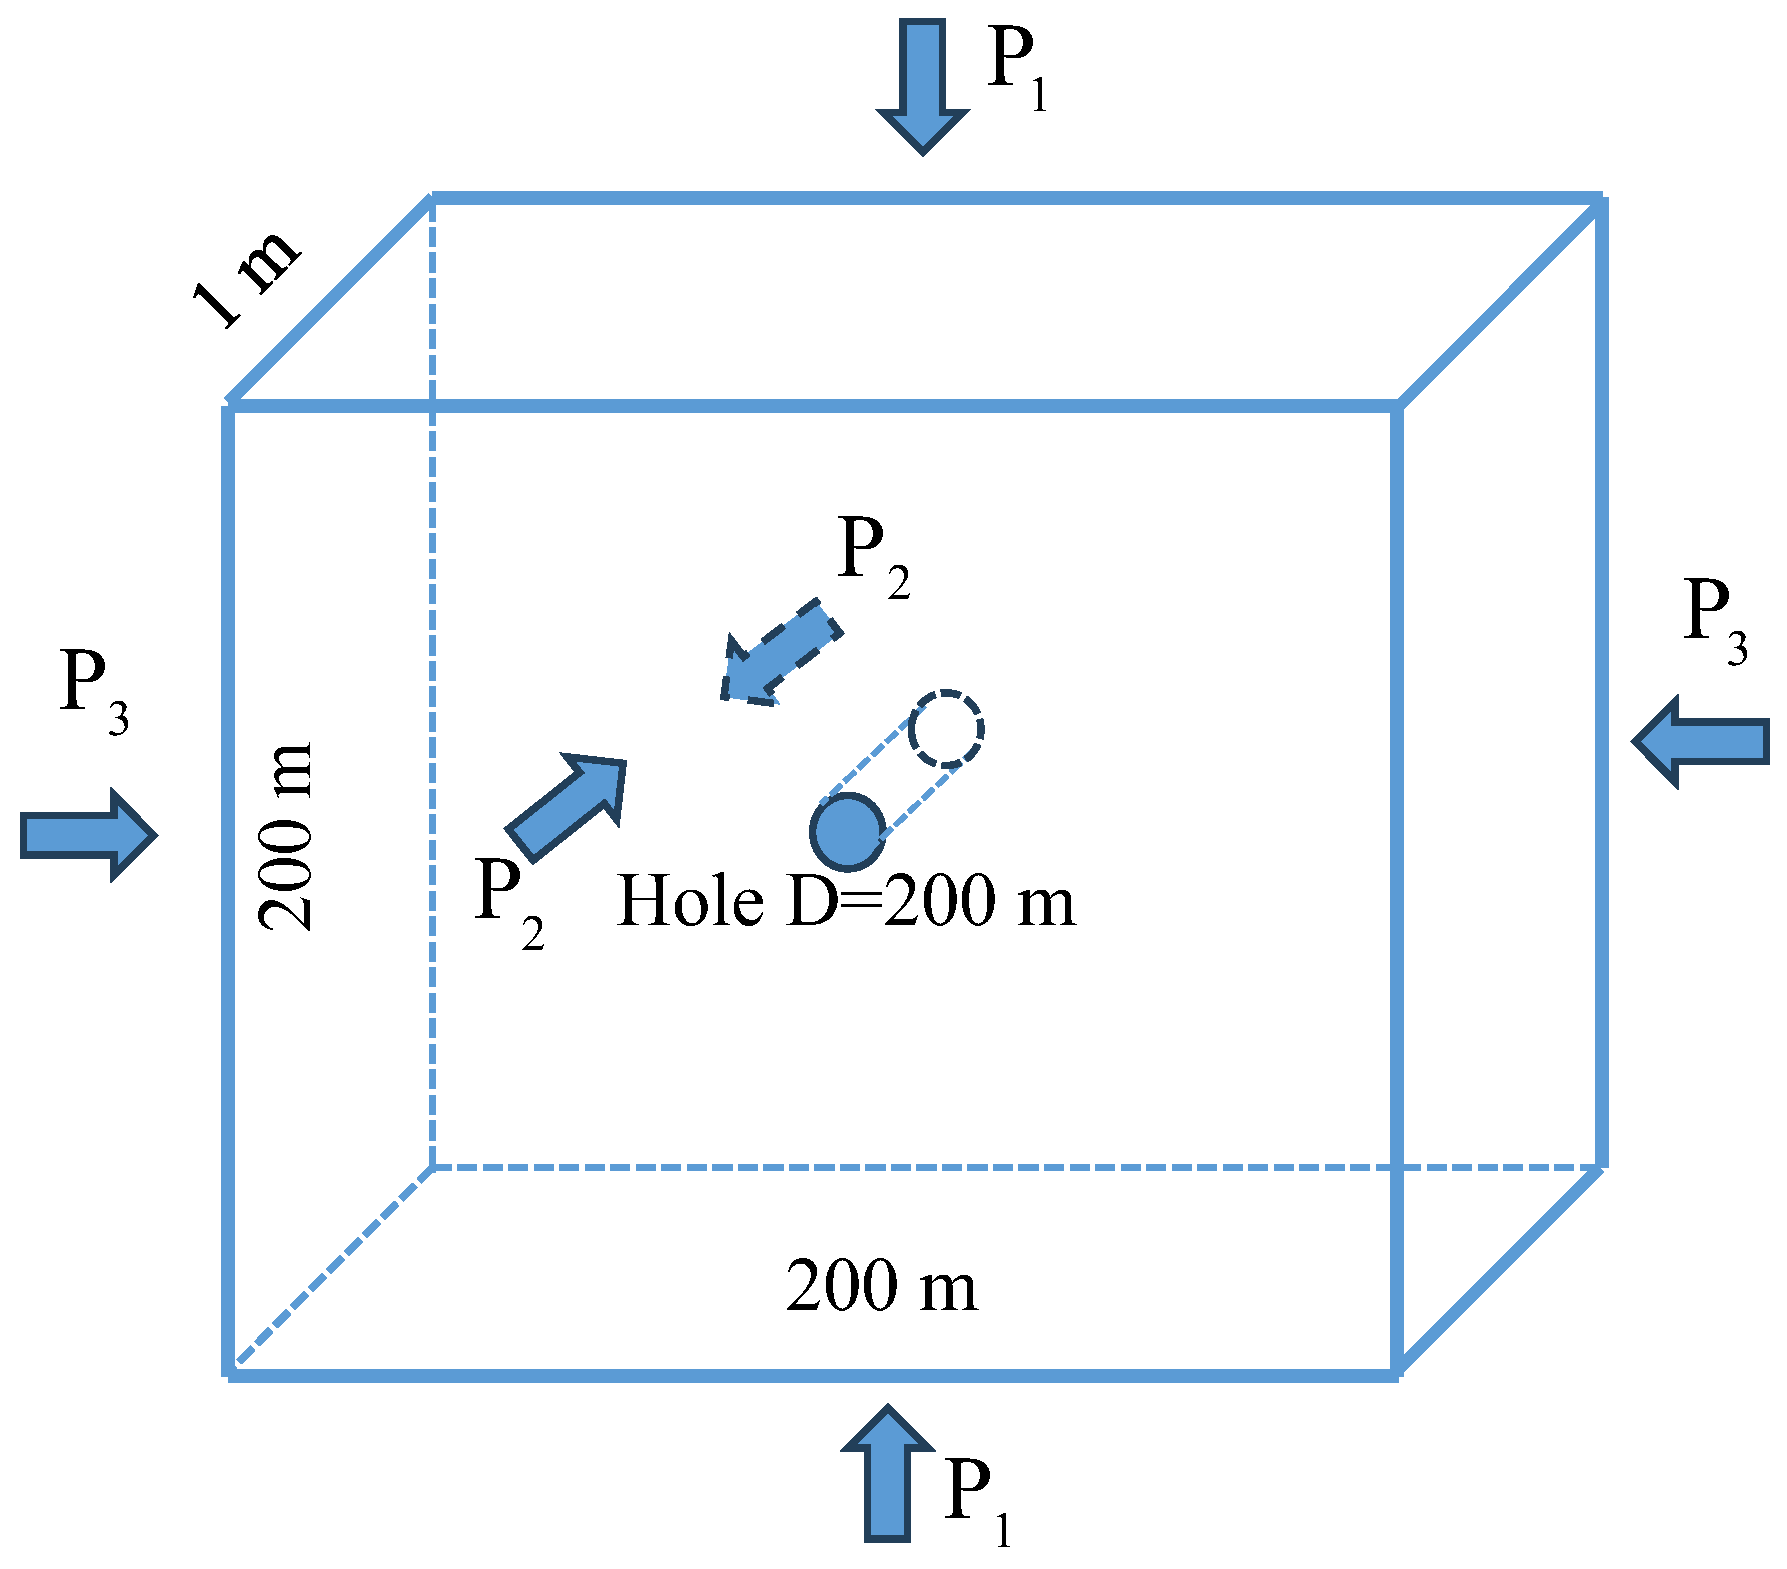
Rock burst accidents occur in rock masses, but rock masses are often relatively large and difficult to study via mechanical models and analysis. So, this study narrowed down the scope of the study and reflected big problems through small models. Due to the fact that regular knowledge is only obtained through model establishment and energy calculation, and the stress and situation of small model are less different from the actual environment in which the tunnel is located, the research method of the small model is considered feasible. In addition, considering the feasibility of the calculation, the method proposed in this study is completed by means of FLAC3D numerical simulation and theoretical calculation, the rock mass (total volume is Ω) involved in the rock burst accident is picked out separately as the research object in the numerical simulation, and a hole is set in the middle of it to respect mining space. The rock mass is subjected to an isotropic force, which can be simplified as a three-dimensional stress of (P1, P2, P3), where P1, P2, and P3 are the main force. The rock mass is composed of many units (f(x, y, z)), and the force of these units can also be simplified as (σ1i, σ2i, σ3i), where σ1i, σ2i, and σ3i are the main stress. The energy of each element in this mechanical state can be calculated by Equation (1) [32].
f x ,   y ,   z = 1 2 E i σ 1 i 2 + σ 2 i 2 + σ 3 i 2 2 μ i σ 1 i σ 2 i + σ 2 i σ 3 i + σ 1 i σ 3 i
where Ei is the elastic modulus of the corresponding element and μ i is the Poisson ratio of the corresponding element.
The stress state before the rock burst accident is named as pre-state stress field (PSSF), after being affected by a trigger stress field (named TSF; a high probability arises from roof fracture or coal rock fracture [44]), the stress state after being applied is named as the later state stress field (LSSF). During FLAC3D numerical simulation, in the model, the loaded media can be pure elastic or elastoplastic, and the energy of the two media under the named PSSF and LSSF states are UPSSF, UPSSF′, ULSSF, and ULSSF′, respectively. When the model is purely elastic, whether it is PSSF or LSSF, all elements are purely elastic, and the formula can be expressed as Equation (2), However, when the model is elastoplastic, under the action of PSSF, some elements will become elastoplastic (Ωe). Under LSSF, a part of elastoplastic elements (ΔΩp) will be added compared with PSSF, so the energy under UPSSF′ and ULSSF′ states can be expressed as Equations (3) and (4), respectively.
U PSSF / L S SF = Ω ( PSSF / LSSF ) f ( x , y , z ) dV
U PSSF = Ω e ( PSSF ) f ( x , y , z ) dV e + Ω p ( PSSF ) f ( x , y , z ) dV p      
U LSSF = ( Ω e Δ Ω p ) ( LSSF ) f ( x , y , z ) d ( V e Δ V P ) + ( Ω p + Δ Ω p ) ( LSSF ) f ( x , y , z ) d ( V p + Δ V P )
where V represents all units of the rock mass. Ve and Vp represent the units of pure elastic and elastoplastic, respectively.
Under the action of PSSF and LSSF, the energy difference (DPSSF/LSSF) between the pure elastic model and elastic–plastic model rock mass is expressed as Equation (5). The difference of energy difference between PSSF and LSSF is the total energy in the process of mechanical state change. However, the elastic wave energy (W) [45] needs to be multiplied by β (elastic wave energy conversion coefficient, the value is 1~10% [27,46]), as in Equation (6).
D PSSF / LSSF = U PSSF / LSSF     U PSSF / L SSF
W = β ( D LSSF     D PSSF )
The calculation chart process of energy release during the mechanical state change process of rock mass from PSSF to LSSF is denoted in Figure 1. Firstly, calculate the energy difference between the pure elastic and elastic-plastic models under the mechanical state of PSSF (DPSSF), and then calculate the energy difference under the mechanical state of LSSF (DLSSF). The difference between DPSSF and DLSSF is the released energy from PSSF to LSSF. When calculating the release energy, it is not simply the difference between UPSSF and ULSSF when it is the elastic–plastic model, but the stored energy under the pure elastic model also needs to be considered in order to calculate the accurate release energy value. This study comprehensively considered the differences between pure elastic and elastic–plastic models under two mechanical states, and eliminated the influence of model size. The obtained energy calculation process and results can be compared with the actual energy release of on-site accidents, which can be used to infer the most likely occurrence condition of rock burst, and is of great significance to reveal the mechanism of rock burst.

3. Results

An example model of 200 × 200 × 1 m (the model and force application direction are shown in Figure 2, the diameter of the hole is 5.6 m, and the application direction of P2 is front and rear) was taken to calculate the rock mass energy under different mechanical states (PSSF as (P1 = 20 MPa, P2 = 20 MPa, P3 = 20 MPa), ΔP as 1 MPa, and only added to P1) and different model conditions, according to the proposed method and the final energy release result. The shear strength, cohesion, friction angle, and tensile strength of the used medium are 1.3 GPa, 3 MPa, 25°, and 1.77 MPa, respectively.
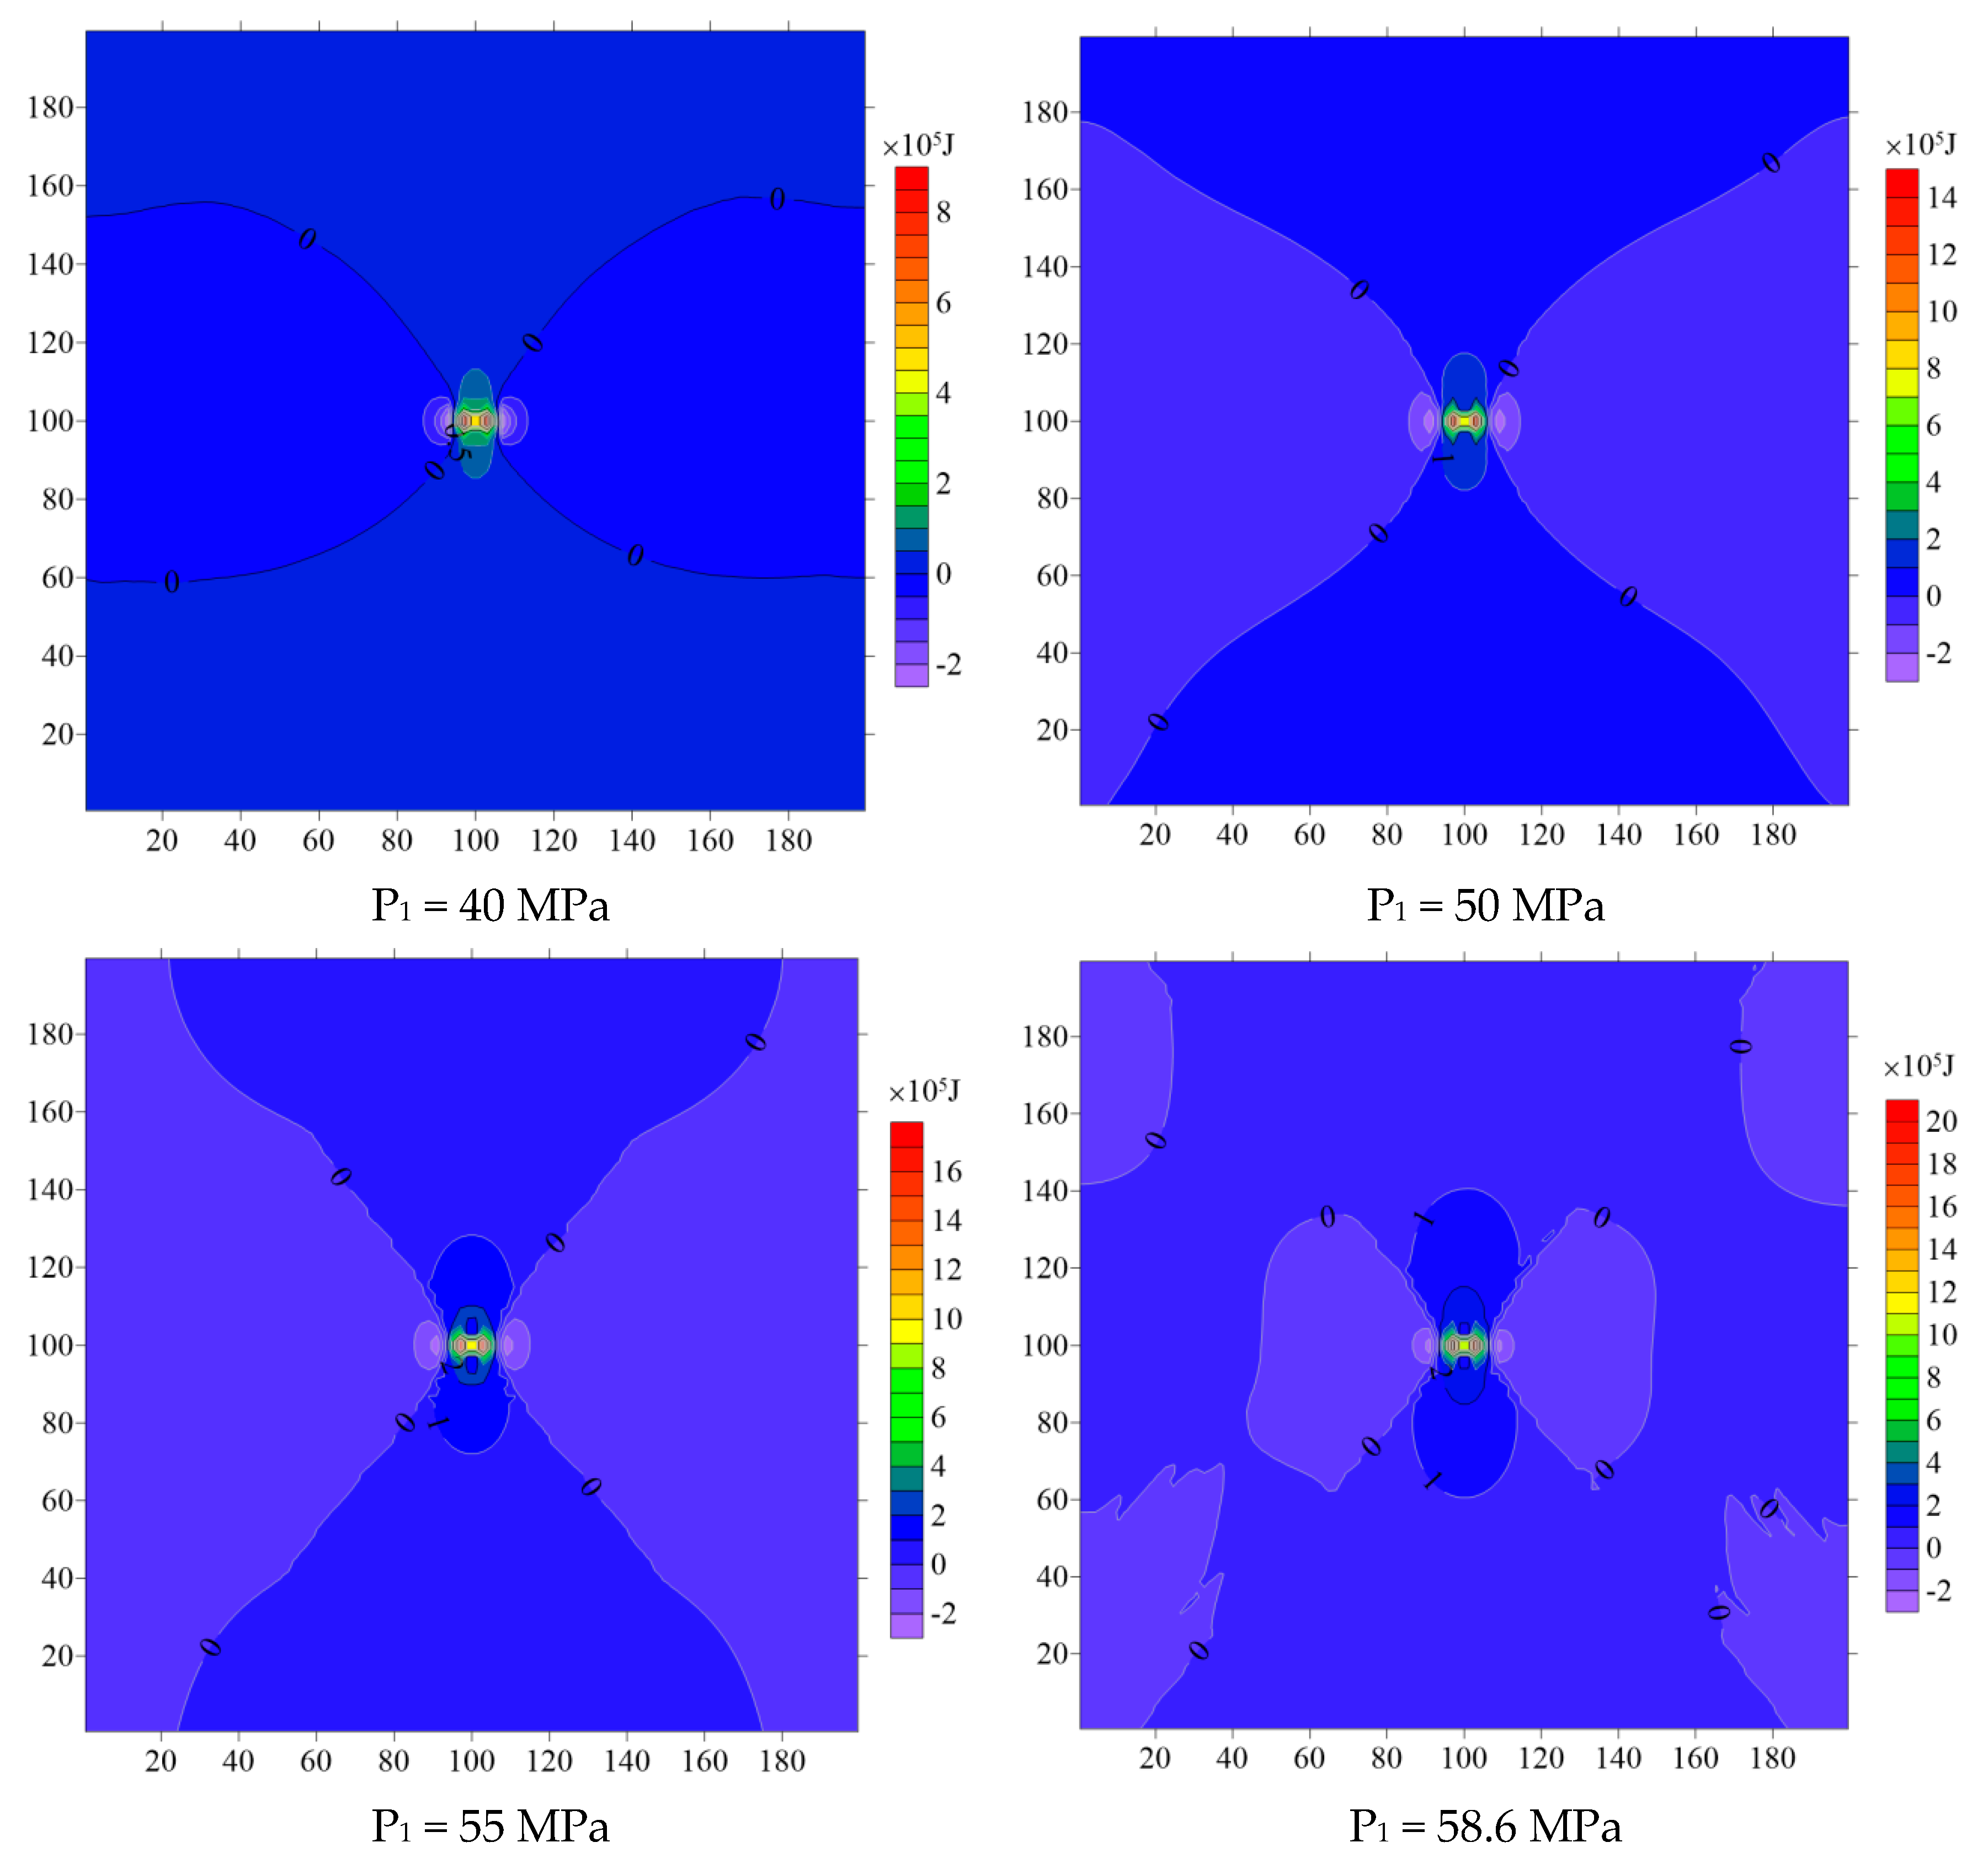
From the numerical simulation results, it can be seen that under the conditions of the elastoplastic model, the shape of the plastic zone presents a butterfly shape when P1 is bigger than 50 MPa (η bigger than 2.5, similar as the results in [47]); a more pronounced butterfly shape (extending further) has emerged when P1 = 55 MPa (at this time, η = 2.75). The concentration phenomenon of plastic zone and stored energy distribution around the hole is closely related to the existence of hole. At the same time, the energy difference also continues to increase and expand with the increase in drilling P1, as in Figure 3 (DLSSF distribution when P1 = 40 MPa, 50 MPa, 55 MPa, 58.6 MPa). Another interesting point is that some unit bodies do not release energy when subjected to changes in force, but instead absorb energy (it may be due to the fact that certain unit bodies tend to be subjected to more uniform forces, or the occurrence of tensile phenomena leads to a decrease in the calculated energy value). As the vast majority of unit bodies release energy, the final energy result of the entire sample is releasing state.
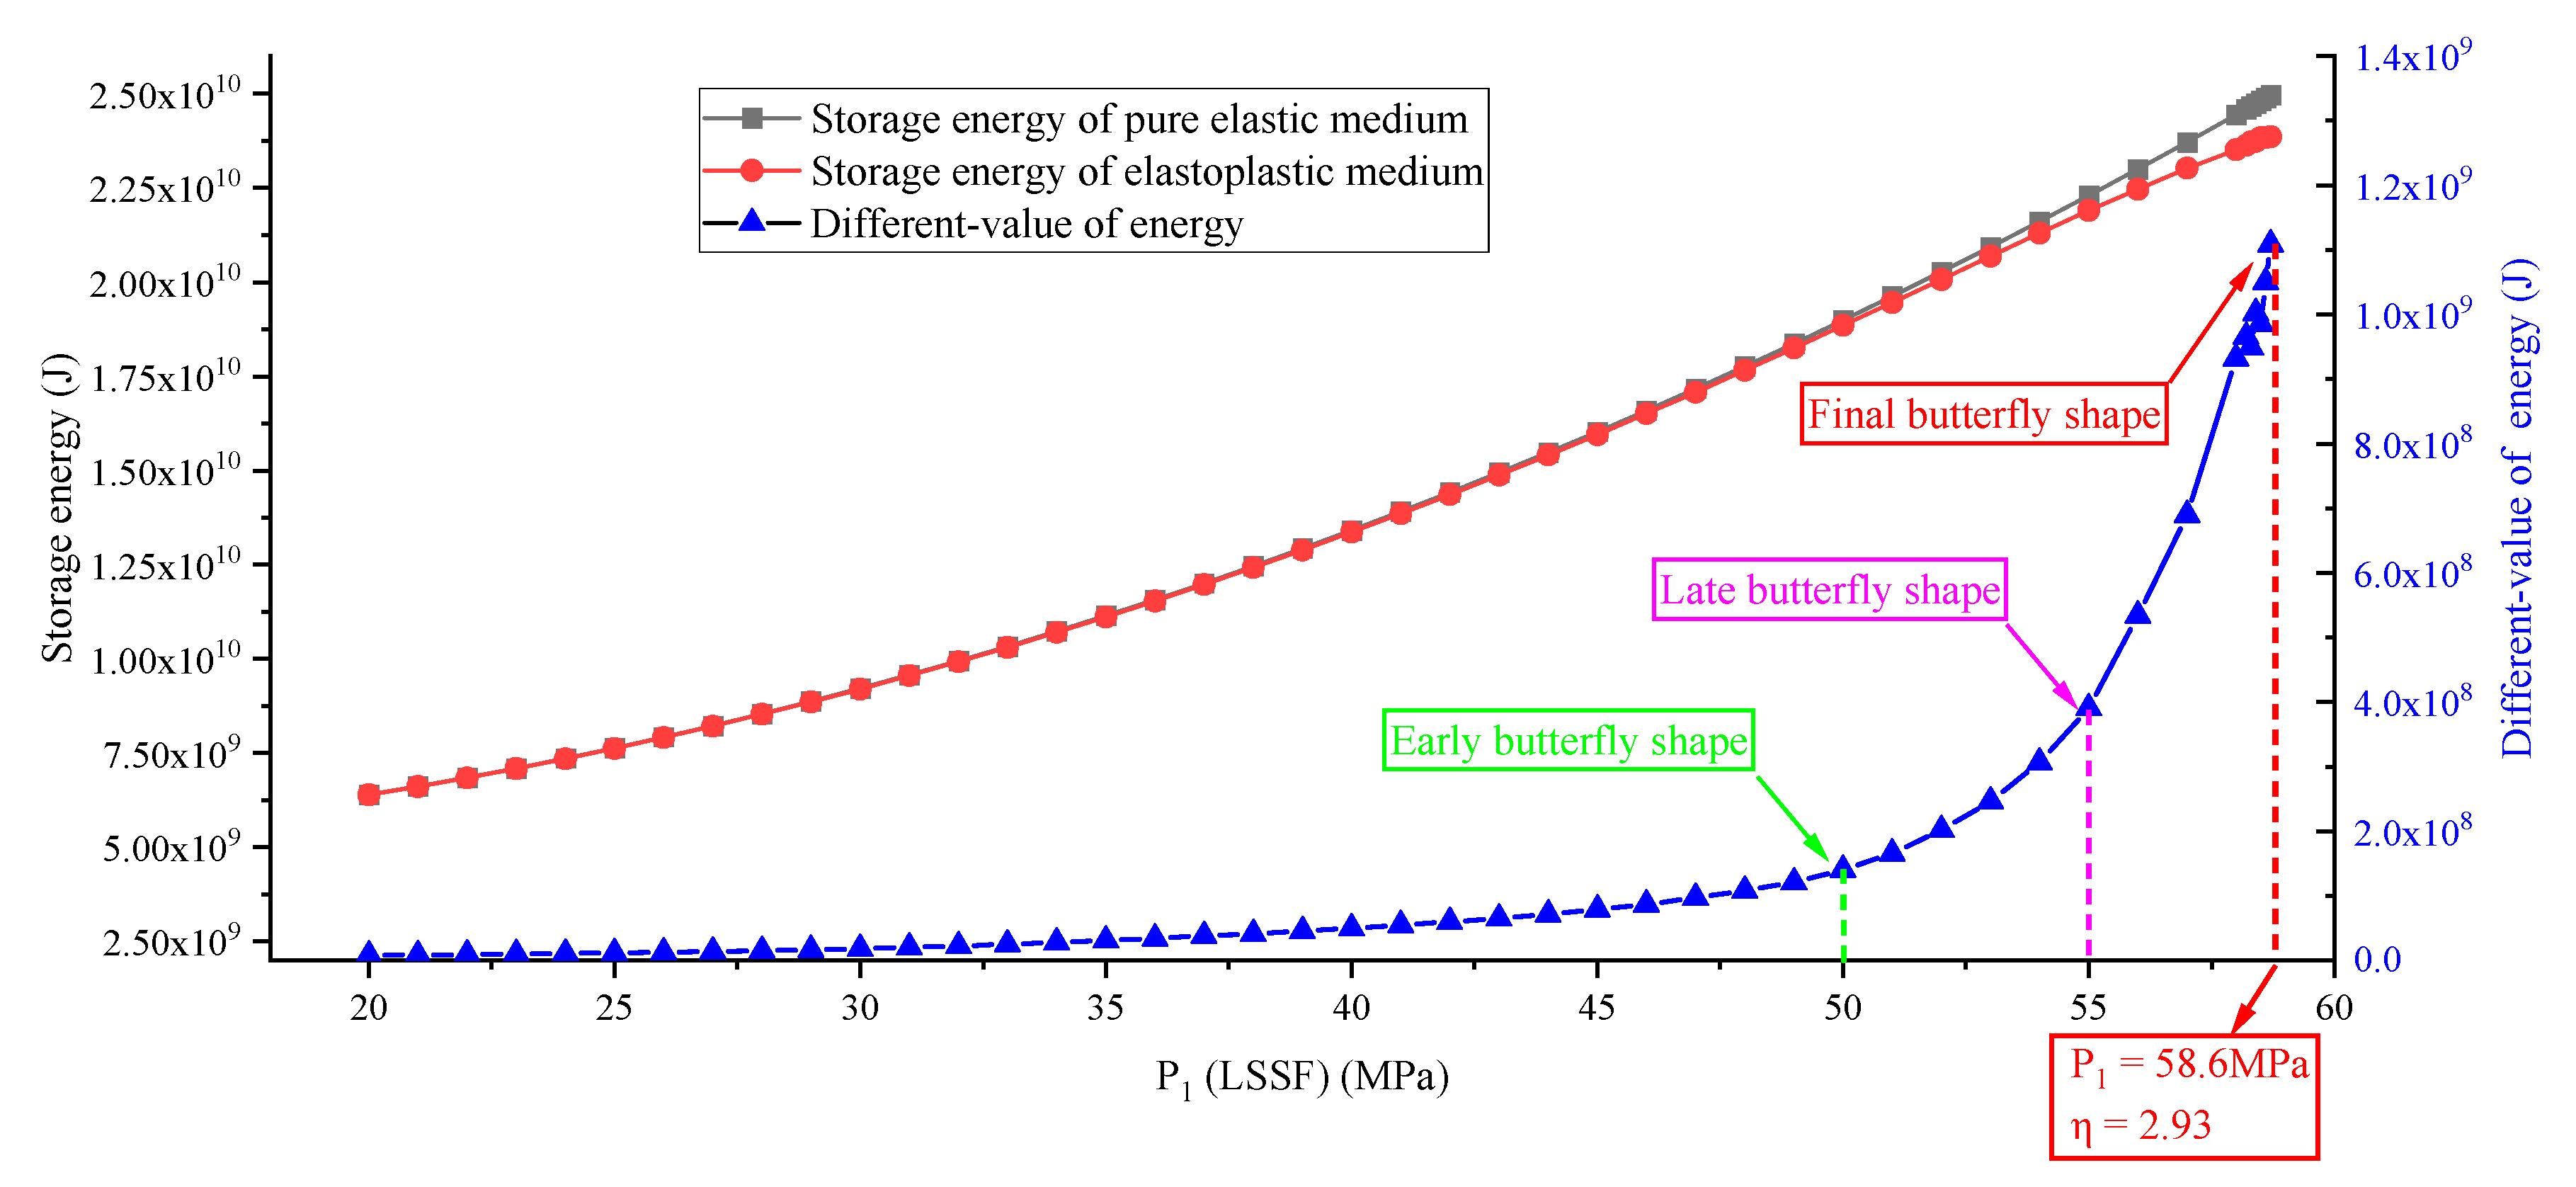
The change curve of the storage and different-value of energy are denoted in Figure 4; it can be seen intuitively from the figure that both storage energy of pure elastic medium and elastoplastic medium are increasing with the increase in P1, but the increasing speed is different (only describing the change in P1 is because the values of P2 and P3 have not changed in all mechanical states). The different-value of energy increases and acceleration are various with the increase in P1, and mainly divided into three stages. The obvious critical points of the three stages are P1 = 50 MPa, P1 = 55 MPa, and P1 = 58.6 MPa, respectively. Interestingly, P1 = 50 MPa is the starting point of the “early butterfly”, P1 = 55 MPa is the starting point of the “late butterfly”, and P1 = 58.6 MPa is the value of the “final butterfly”. The η values corresponding to the three critical points are 2.5, 2.75 and 2.93, respectively. The above fact shows that the shape of plastic zone is closely related to the different-value of energy, the butterfly shape is strengthened with the increase in P1 and, meanwhile, the different-value of energy is also increased.
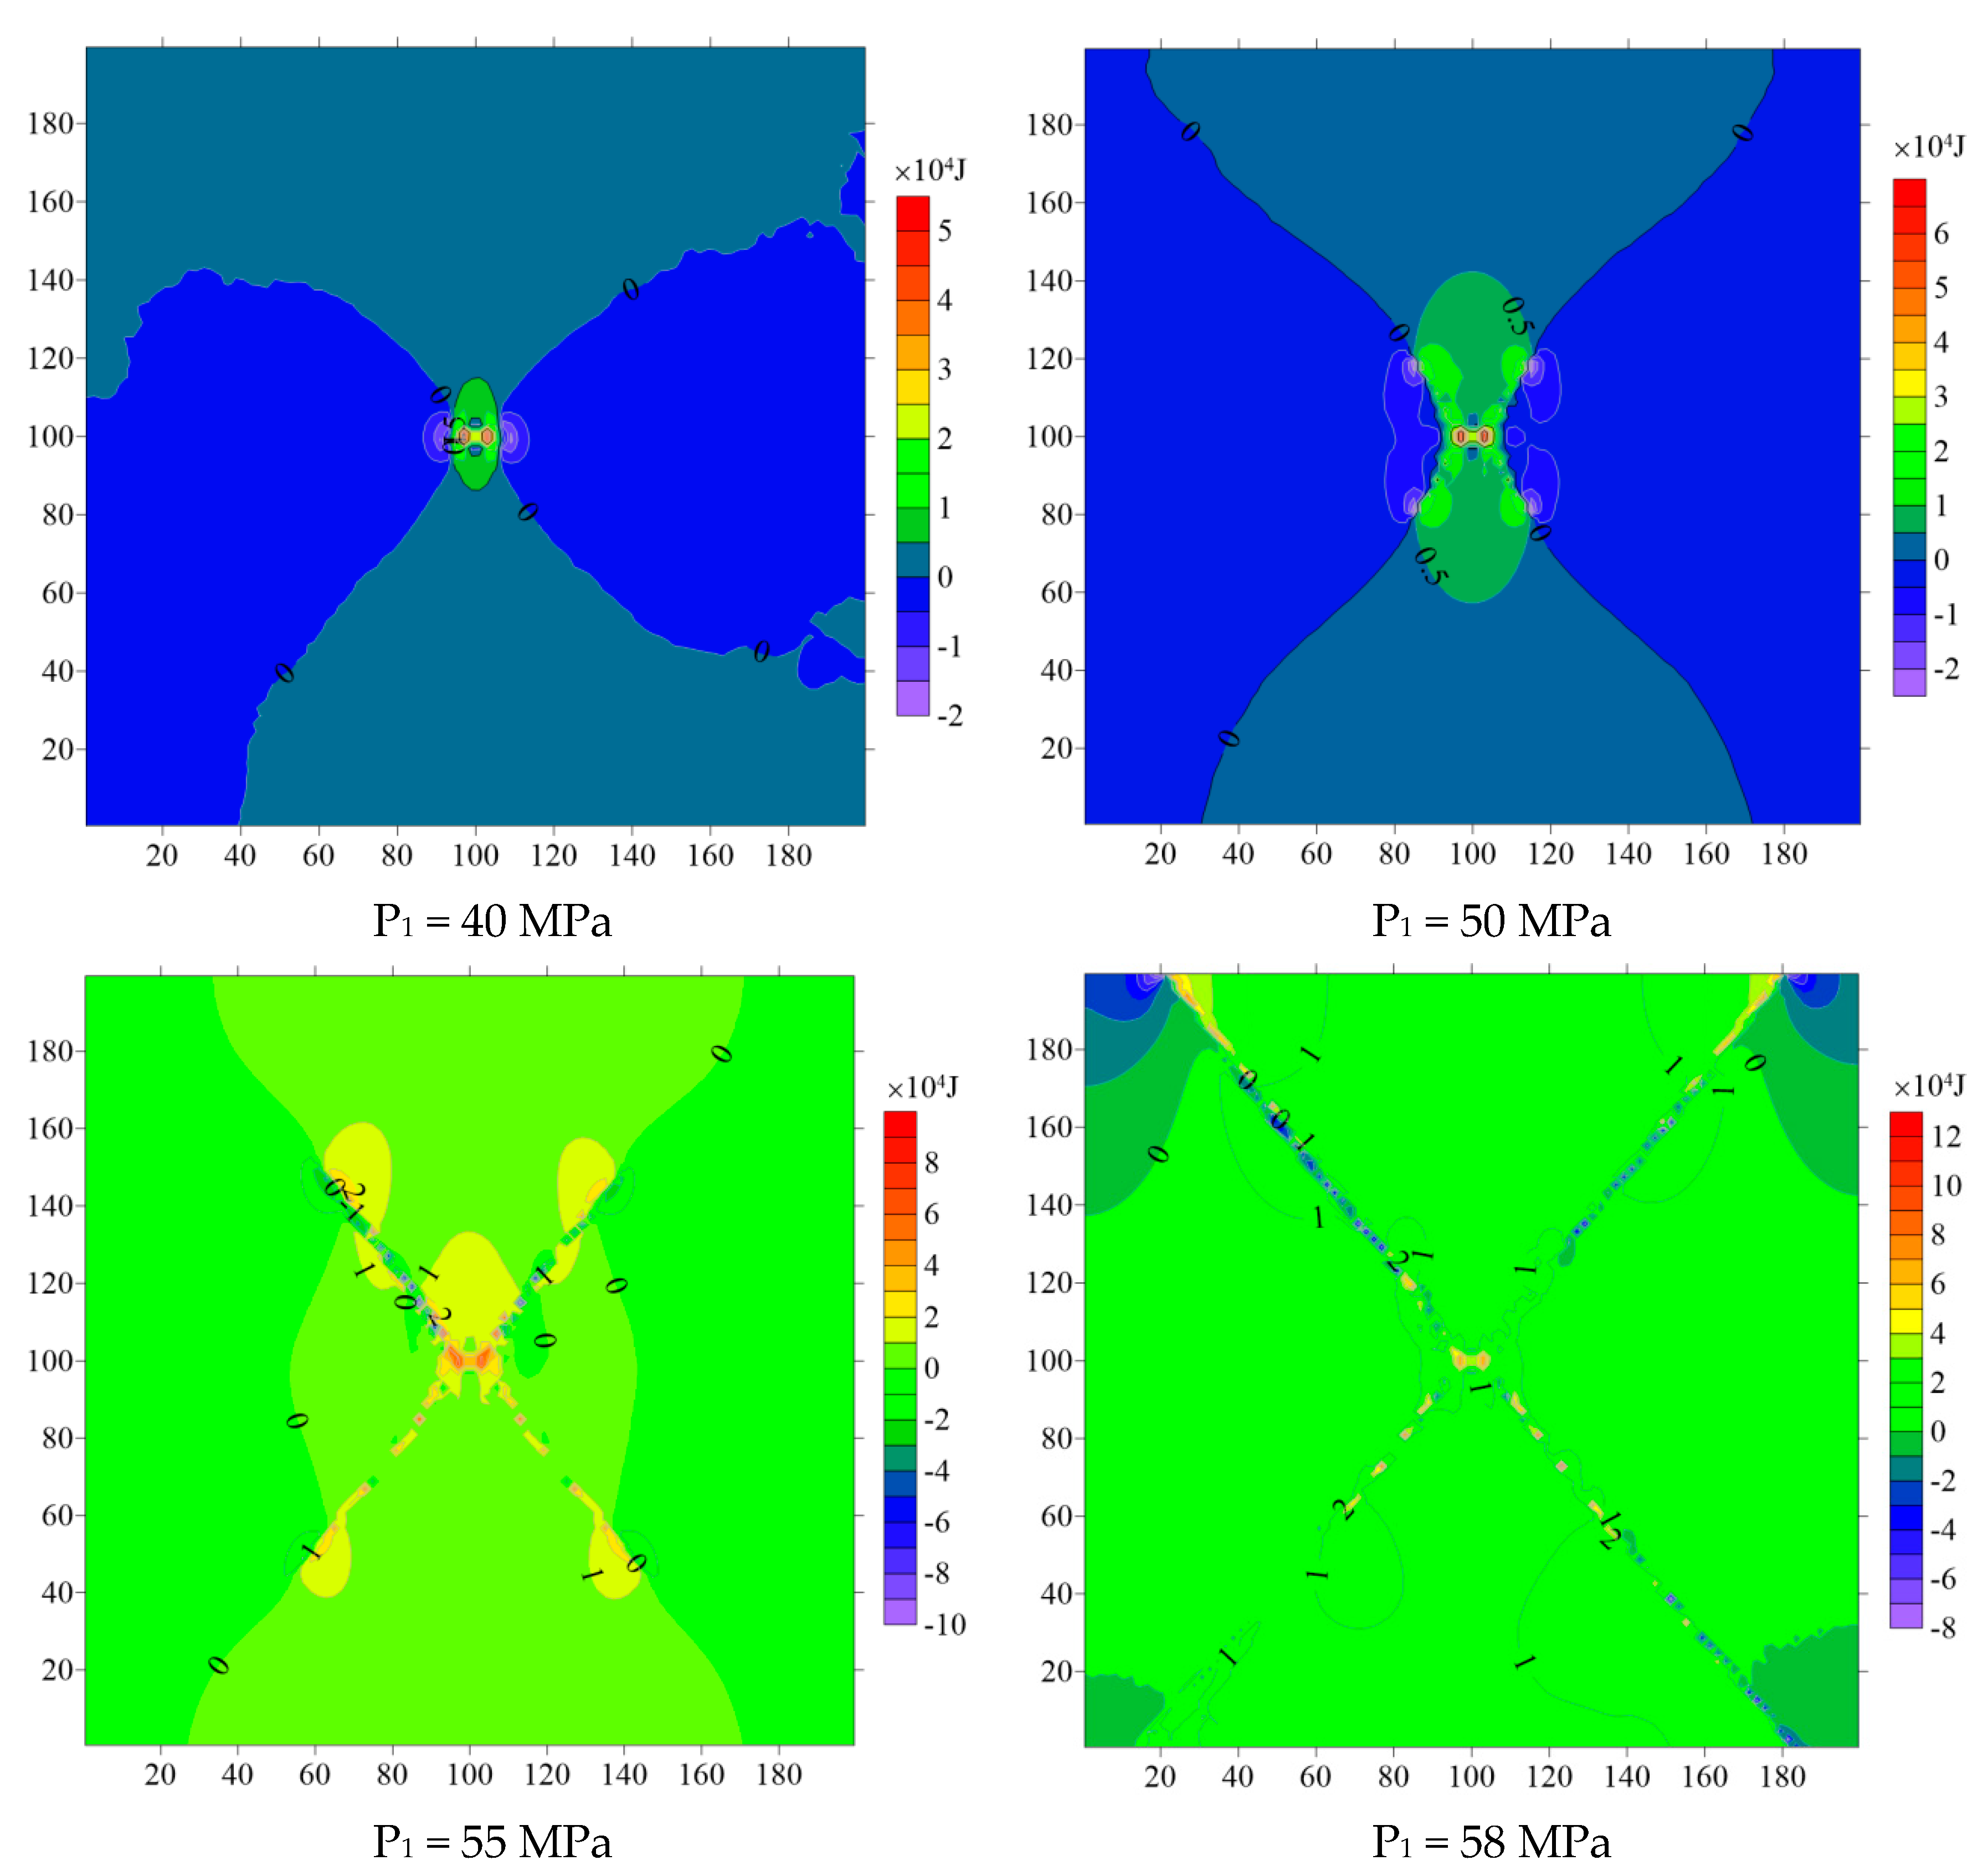
Divide the energy of the unit body by the volume of the unit body to obtain the energy release density map of the rock mass, and the release energy density map of butterfly related mechanical states are shown in Figure 5. The results show that the distribution of energy release density and plastic zone has a strong management, and has experienced a process from small butterfly to large butterfly. From the value of energy distribution, the greater the force, the greater the density value, and the more concentrated the distribution.
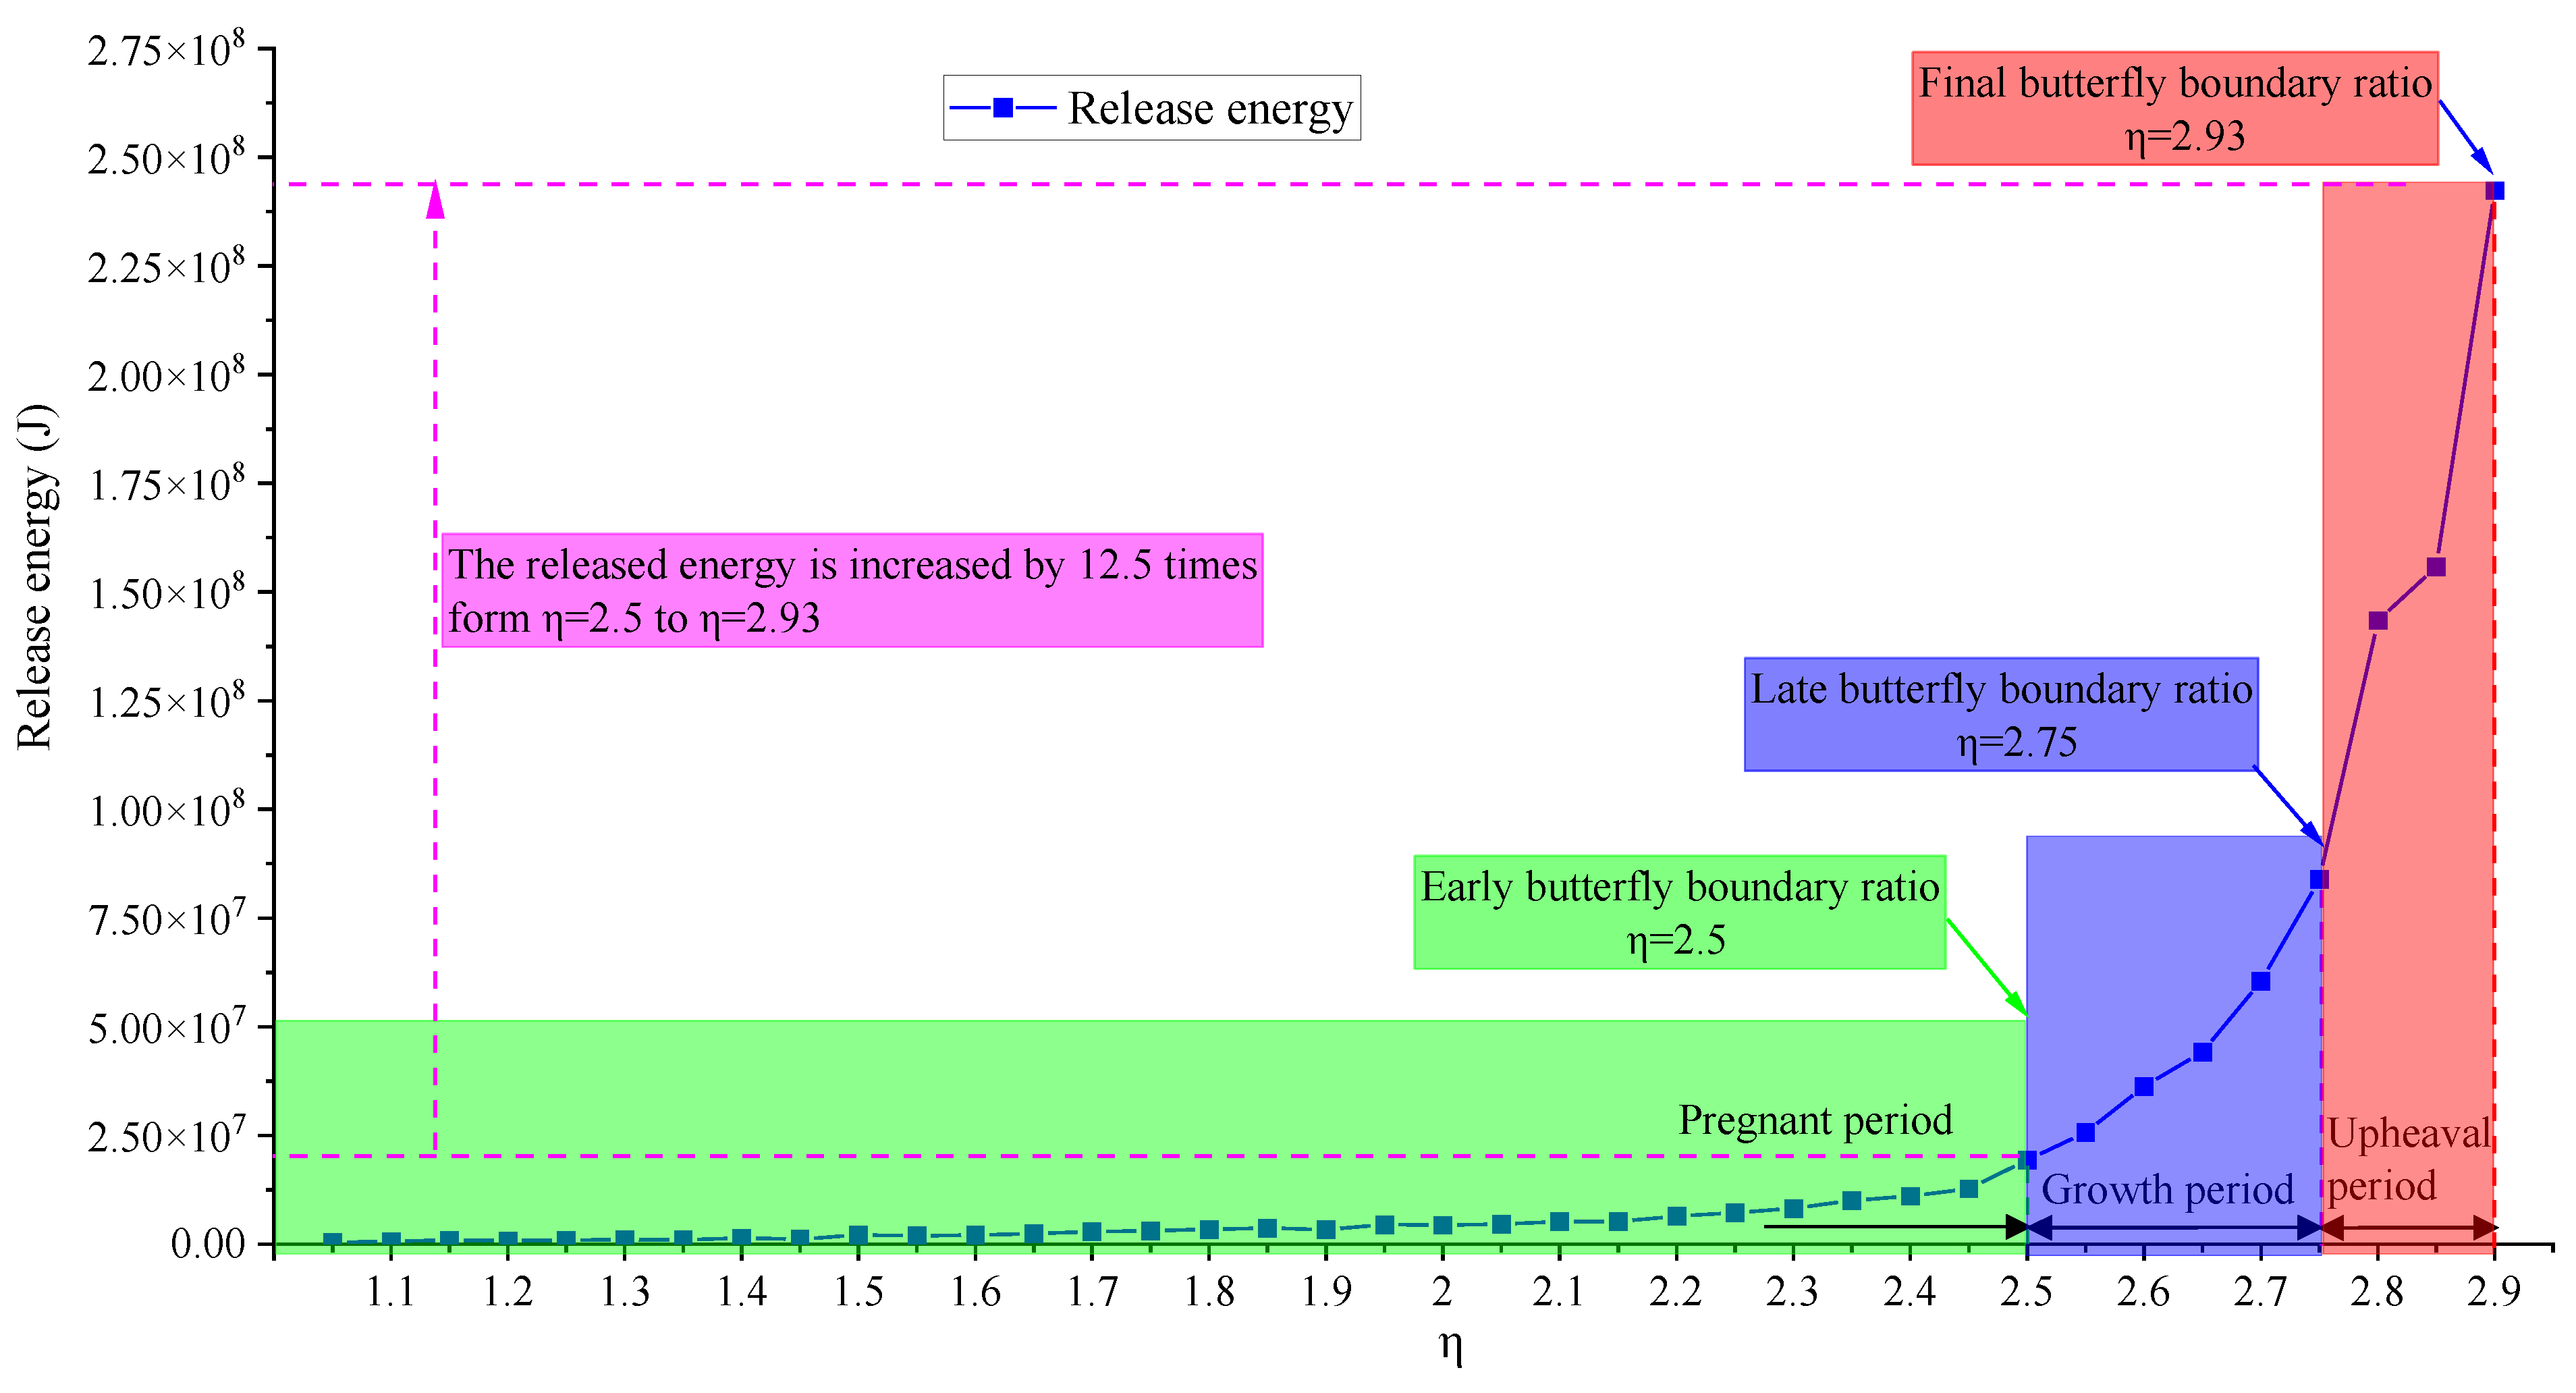
The calculation results of the released energy of rock mass are shown in Figure 6, from which it can be seen that the phased characteristics are obvious. The entire process shown in the figure can be divided into three stages: the pregnant period, growth period, and upheaval period, representing the phenomenon of releasing energy from small to large, respectively, and then rapidly increasing. Results show that even with the same TSF, different PSSFs have a great impact on the results of the energy release. When the shape of the plastic zone caused by the PSSF (when there is deviatoric loading [48], and P1/P3 is mostly >2.5) of rock mass is butterfly, the change in the released amount forms an inflection point, and the corresponding η values are 2.5 MPa, 2.75 MPa, and 2.93, respectively, the released energy is increased by 12.5 times form η = 2.5 to η = 2.93.
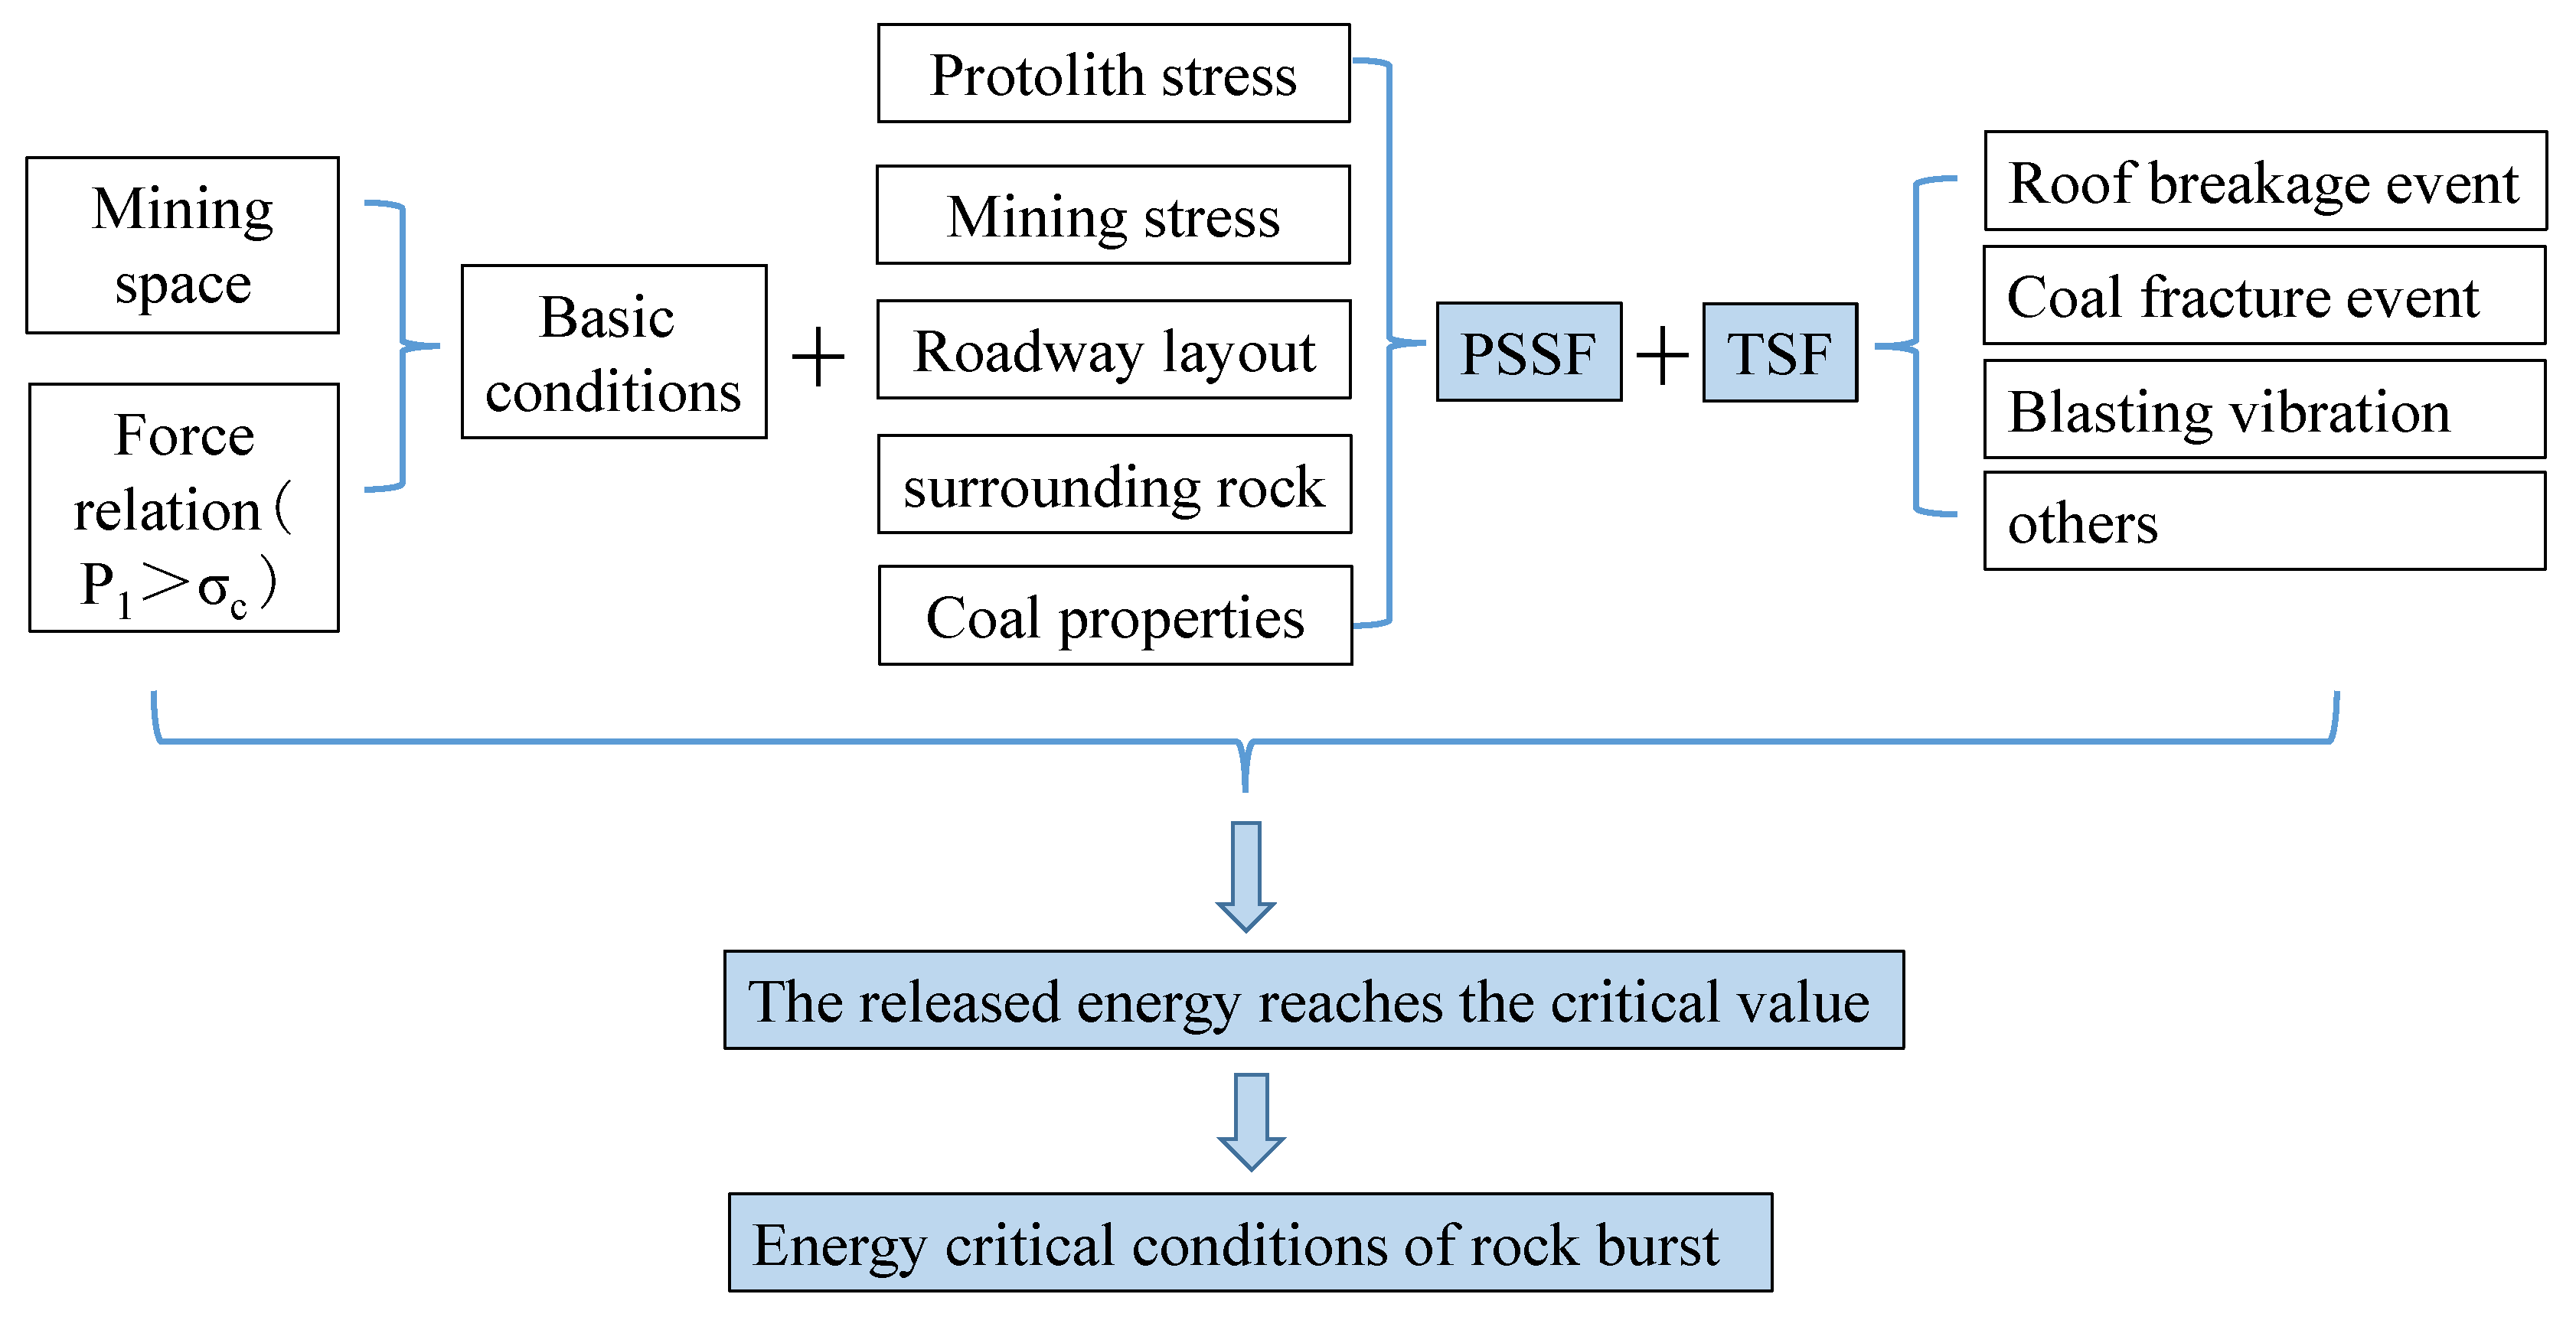
The calculated energy of the rock burst can be compared with the actual energy. It can be seen that the released energy of the accident is matched with the calculated energy from the above energy change results, and the formation factors of rock burst are the butterfly plastic zone caused by PSSF and appropriate TSF in addition to the basic conditions (mining space and force relation are easily satisfied). The PSSFs are related to the protolith stress, mining stress, roadway layout, surrounding rock, coal properties, etc. The TSFs are related to the roof breakage event, coal fracture event, blasting vibration, etc. Further, these factors are finally reflected in PSSF and TSF, otherwise it is difficult to meet the energy conditions. When the energy release reaches the critical value, the energy conditions for the accident can be met, as in Figure 7.

4. Discussion

The formation factors of rock burst have been obtained in the Section 3. In fact, the conclusive key factor of large ratio PSSF is based on less requirements of TSF under “late butterfly shape” or “final butterfly shape” of the plastic zone, so the required minimum TSF to reach the critical energy value under different stage based on a total energy of 107 J is indicated in Figure 8. The results show that in the non-butterfly stage (P1 less than 50 MPa), the minimum TSF required is 1~14 MPa, while in the butterfly stage (P1 more than 50 MPa and less than 55 MPa), the value is reduced to 0.2 MPa, and in the late butterfly stage (P1 more than 55 MPa), the value is even reduced to 0.1 MPa, which is easy to achieve in realistic data. The above facts confirm the key factor role of a large ratio PSSF for a rock burst, which is similar to the result of rock bursts caused by larger difference existing between horizontal and vertical stresses in [49].
In fact, the implicit equation of the plastic zone boundary under the condition of the uniform medium model is obtained in a previous study [24]. The plastic zone distributions of typical mechanical states obtained by Equation (7). The results show that when P1 = 40 MPa, the shape of plastic zone is not butterfly, but when P1 = 50 MPa, the butterfly state is more obvious. When P1 = 55 MPa, the maximum radius of the plastic zone Rmax extends to 15 m, and when P1 = 58.6 MPa, the Rmax extends to 90 m. The plastic zone results of previous theoretical calculations are the same as those in this study, while this study focuses more on the variation law of energy corresponding to plastic zone.
9 1 η 2 ( a r ) 8 + 12 ( 1 η ) 2 + 6 ( 1 η ) 2 cos 2 θ ( a r ) 6
+ 10 1 η 2 cos 2 2 θ 4 1 η 2 sin 2 φ cos 2 2 θ 2 1 η 2 sin 2 2 θ 4 1 η 2 cos 2 θ + ( 1 + η ) 2 ( a r ) 4
+ 4 1 η 2 cos 4 θ + 2 ( 1 η 2 ) cos 2 θ 4 ( 1 η 2 ) sin 2 φ cos 2 θ 4 C ( 1 η ) sin 2 φ cos 2 θ P 3 ( a r ) 2
+ 1 η 2 sin 2 φ ( 1 + η + 2 C cos φ P 3 sin φ ) 2 = 0
Another index of the plastic zone is the area of plastic zone, which not only represents the depth of the plastic zone, but also comprehensively reflects the volume of the plastic zone. Therefore, the variation curves of plastic zone Rmax, area S, and released energy with the increase in P1 are compared in Figure 9. From the comparison results, the three indicators all formed a certain inflection point when η = 2.5, 2.75, and 2.93, but the difference is the rate and degree of change. The most drastic change is the released energy index, followed by Rmax index, and finally S. Although the change degree of the three indexes is different, they all reflect the mutation phenomenon, which shows that the rock burst mechanism relying on large ratio PSSF and butterfly shape plastic zone is reasonable.
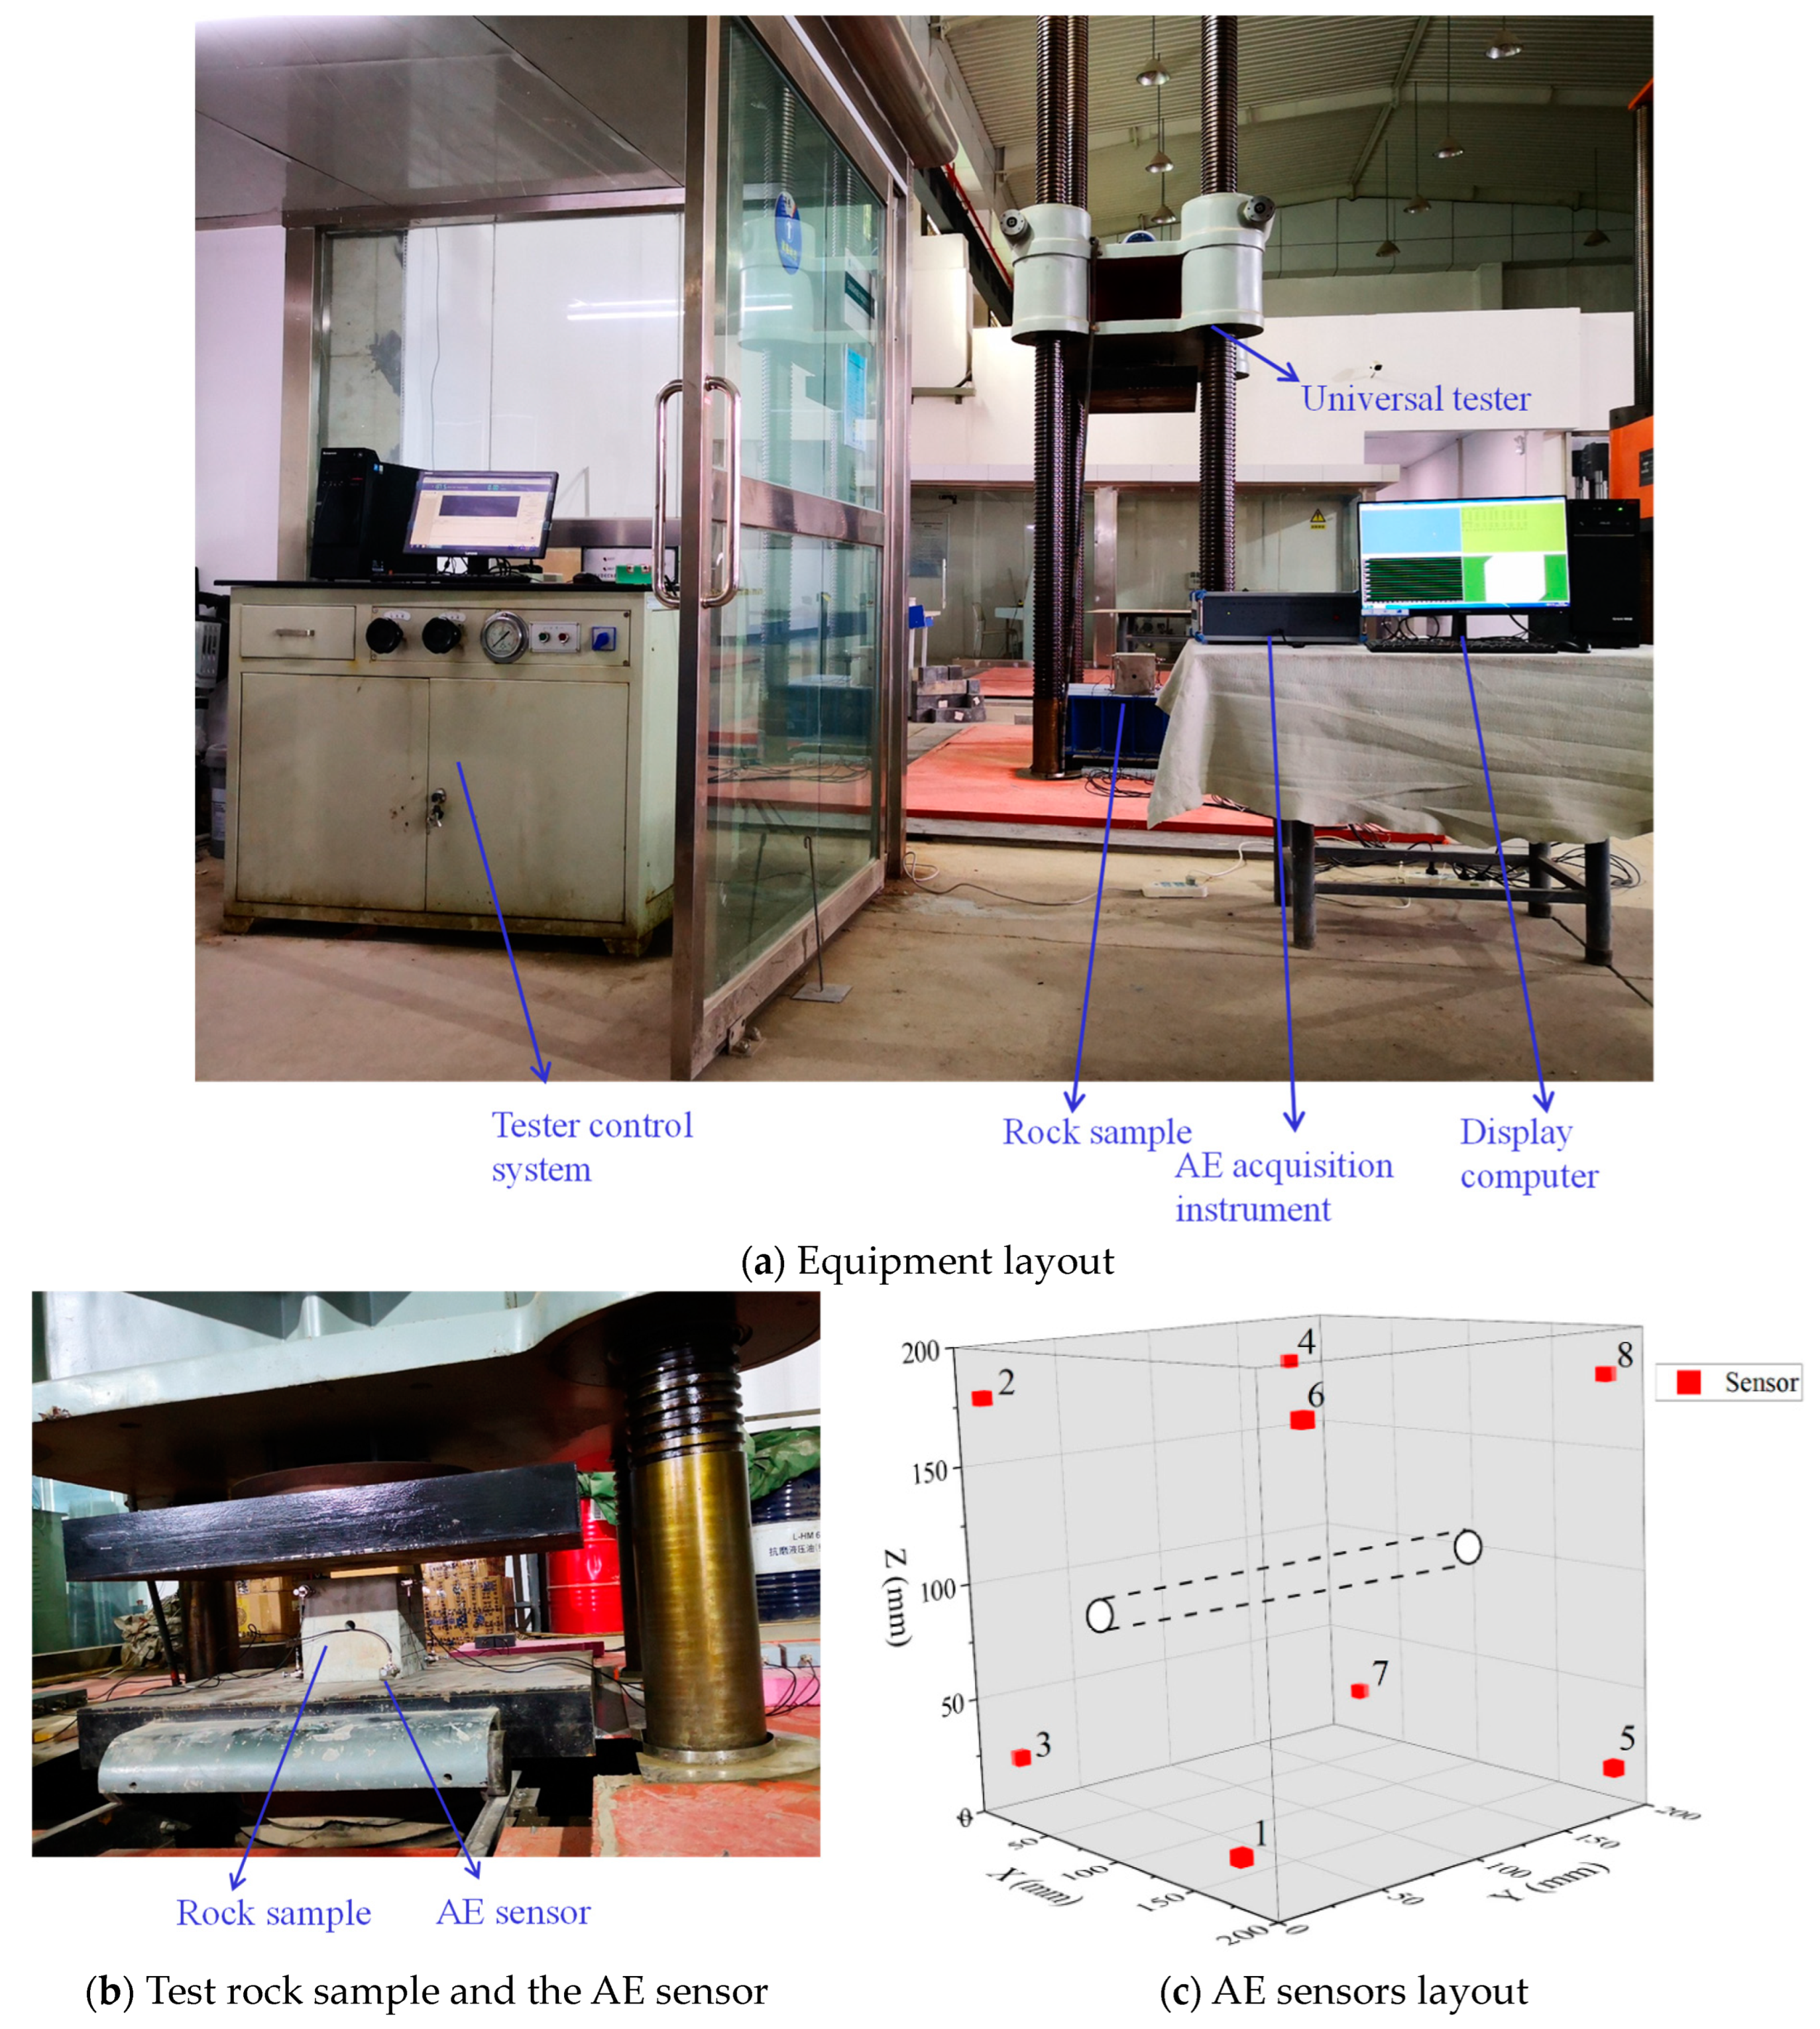
The above analysis obtained the important influence of butterfly plastic zone based on theoretical calculation and numerical simulation. An experimental verification is more reliable; therefore, the whole process of AE monitoring of sample loading process is implemented. The equipment is denoted in Figure 10a, which mainly includes a universal tester and its control system, an AE acquisition system, and a rock sample. The sample is a kind of sandstone with a rock burst tendency (shown in Figure 10b), and the size is 200 cubic millimeters (a 20 mm diameter central hole is set in the axial direction to represent the roadway, and the direction is assumed to be in the Y direction). The uniaxial loading method is adopted for the experiment, until the sample is completely crushed. The sampling frequency of AE system is 6 MHz, and a total of eight sensors are used for signal acquisition, as in Figure 10c. The study focuses more on the positioning of AE events within the few seconds before rock failure, so as to verify the shape of plastic zone area before failure.
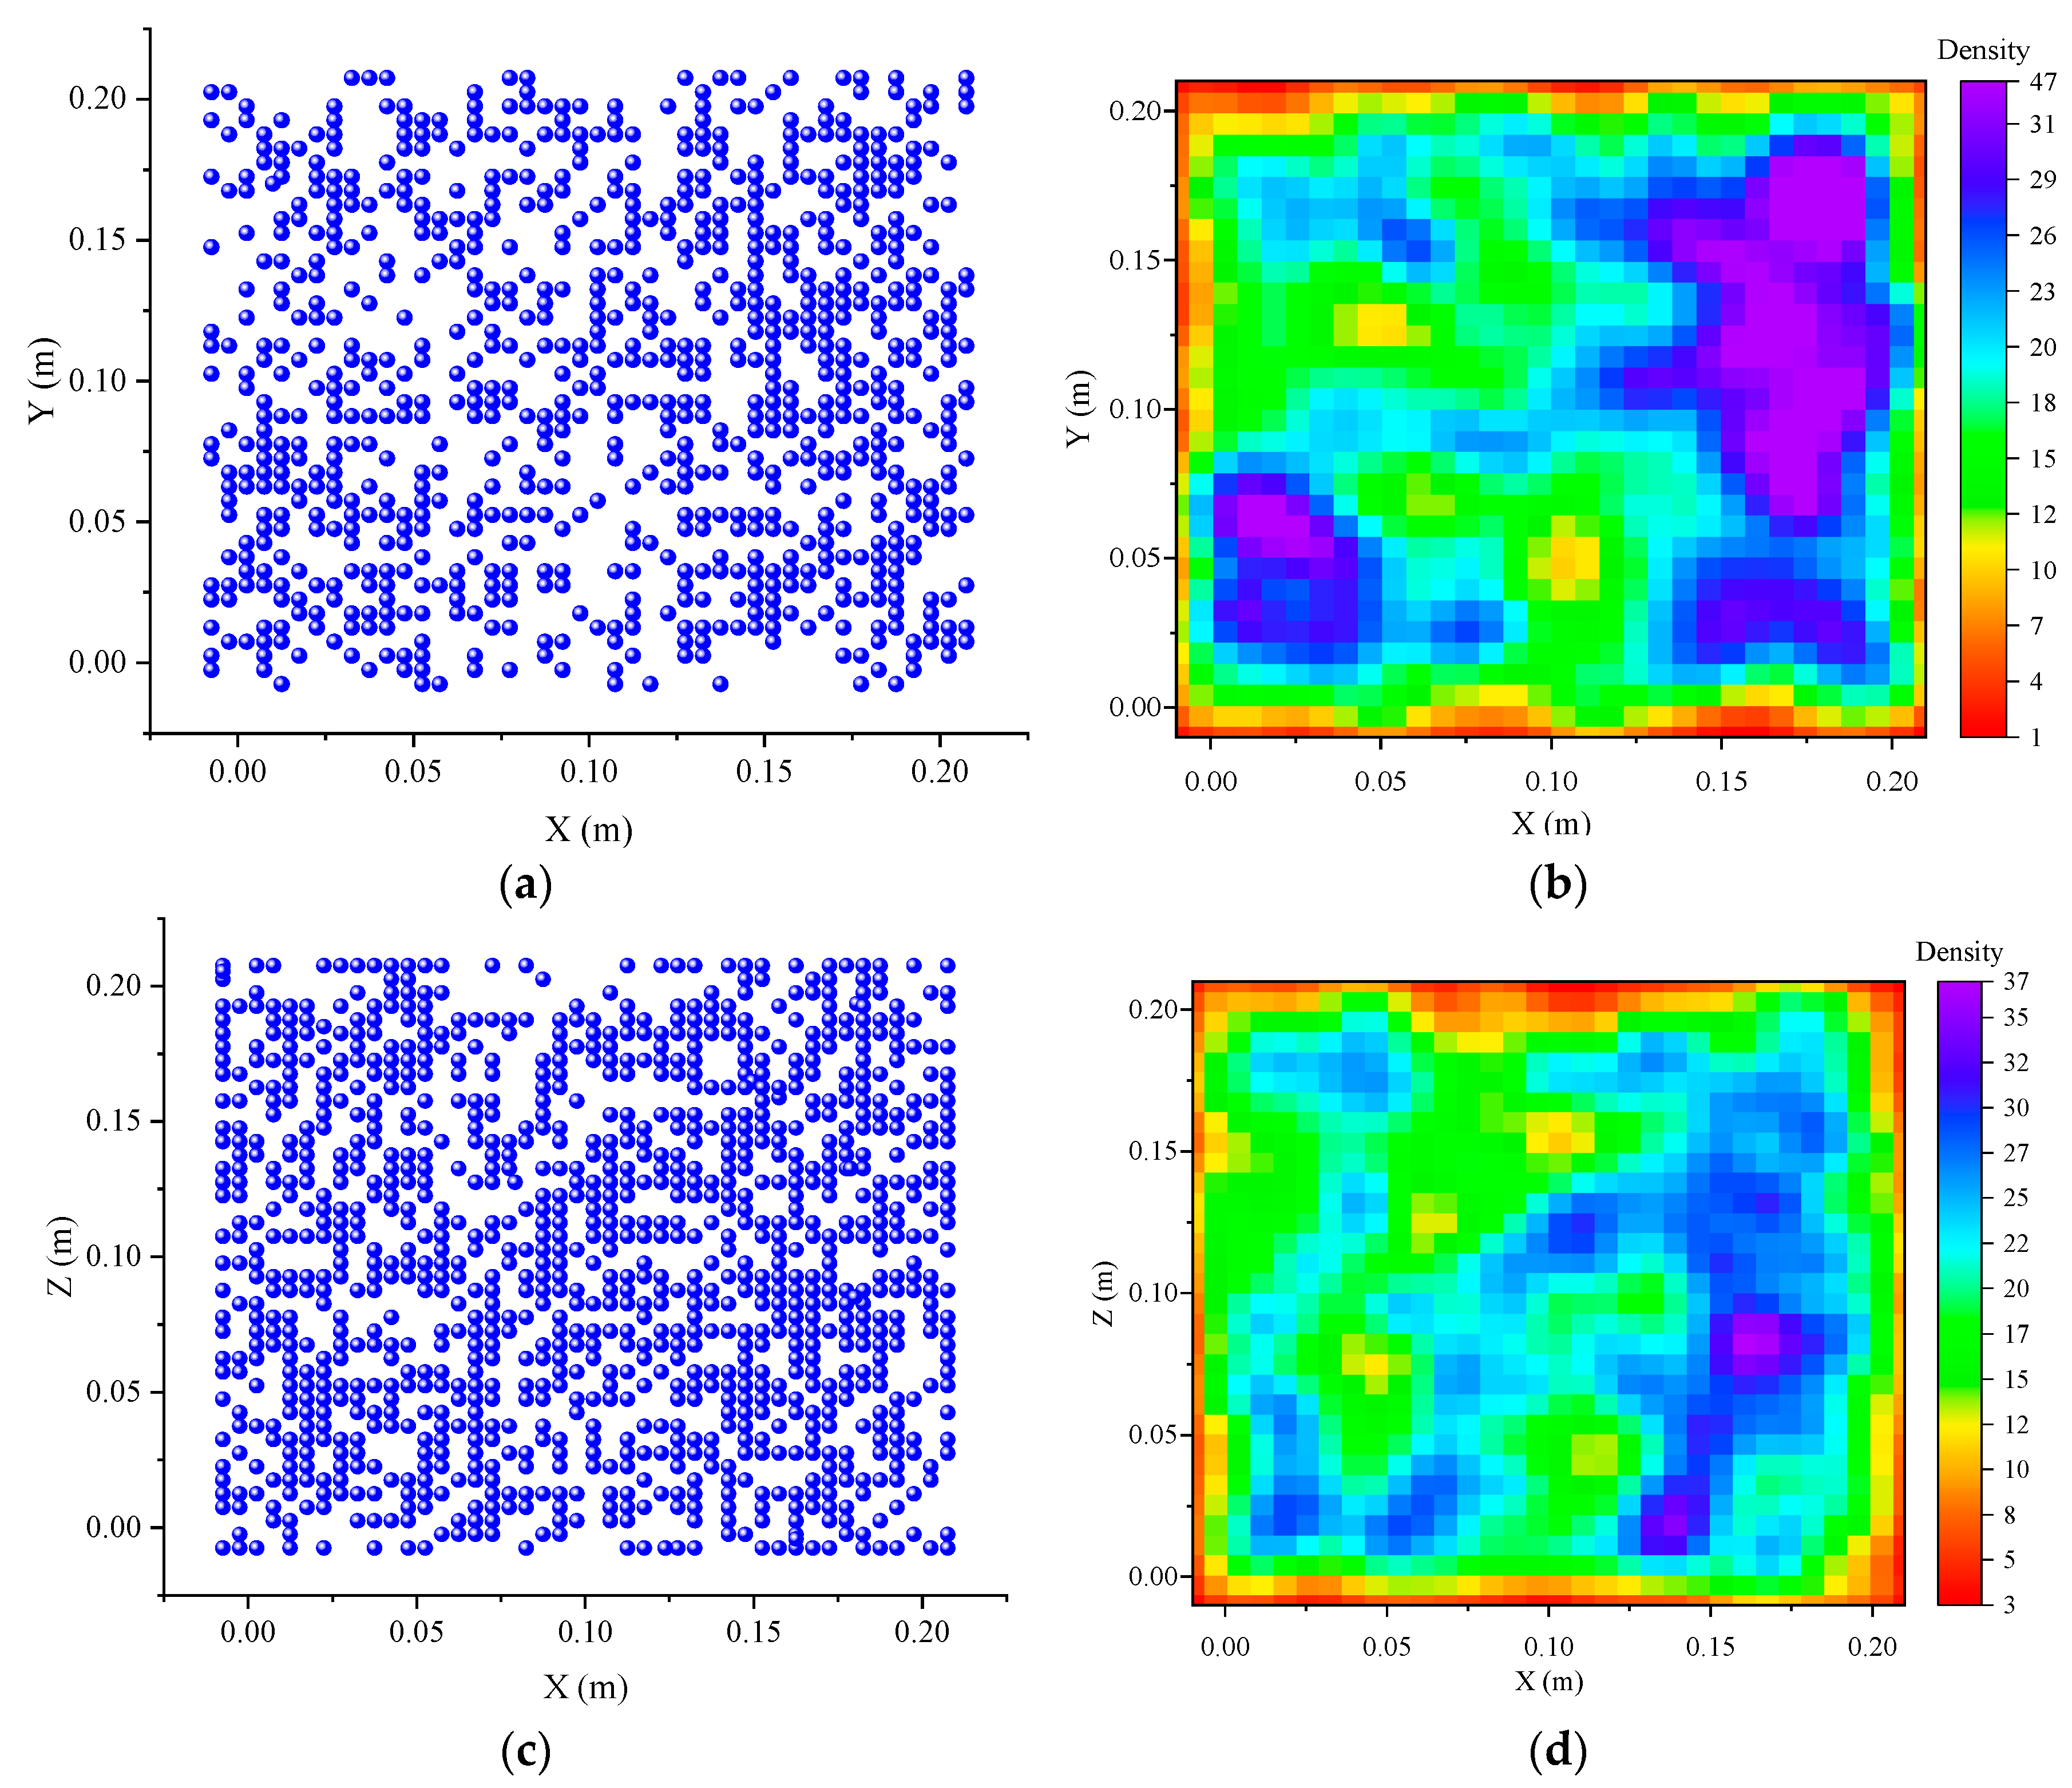
The study should focus on the failure distribution form in the XZ plane (perpendicular to the Y direction) during 1990~1995s, and the influence of boundary conditions should be removed as far as possible. Therefore, the statistical AE event scatter plot and heat map during 1990~1992s and 1993~1995s are stated in Figure 11. The number of AE events during 1990~1992s is less than that during 1993~1995s. The distribution pattern of event points is not obvious, but the heat map results can basically show the butterfly shape. The distribution of each butterfly leaf is not very regular in the heat map results, which may be caused by the heterogeneity of the sample or the influence of force transmission. The AE event scatter plot and heat map during the whole period of 1990~1995s are shown in Figure 12, which shows a more obvious butterfly shape, and is basically consistent with the results of theoretical calculation and numerical simulation. The formation of butterfly-shaped plastic zones not only reflects the morphology before failure, but also indicates that events are concentrated in certain specific areas (fractal characteristics) and may cause large-scale damage after reaching a certain level.
This study reveals the shape of butterfly-shaped plastic zone of the sample in a specific state, which is caused by a large ratio of the stress field (like the state described in [50,51], the influence of some large ratio of foundation ground stress or geological structure often results in deviatoric stress field, which increases the probability of rock bursts), and resulting in a large amount of concentrated energy release. Based on the initial stress state of the rock, the study considers that a small TSF may lead to a huge release under specific stress conditions, and gives the minimum TSF required to form disasters under different states. It considers that the probability of the occurrence of rock burst is the butterfly-shaped plastic zone shape caused by deviatoric stress field. This can also be demonstrated from the actual size of TSF; in fact, TSF is unlikely to become the dominant factor in most cases, which has been already demonstrated in [52]. In addition, this study also preliminarily discovered the fractal characteristics of acoustic emission events distribution before sample failure.
The results of this study are based on a calculation method of energy to obtain the energy value before and after the change in the rock mass mechanical state, and the specific expression of dangerous stress state is obtained; that is, when the ratio of maximum principal stress to minimum principal stress reaches the 2.5/2.75/2.93 critical point. In addition, an experimental test was used to preliminarily verify the shape of the butterfly-shaped plastic zone on the eve of sample failure. Although the form of uniaxial compression was used for the convenience of the test, this form also showed butterfly shape in numerical simulation and theoretical calculation, which proved to be basically effective, but the butterfly shape under triaxial loading should be obtained more in later experiments. In addition, it is necessary to try measuring vibration signals in more directions, such as three axes [53]. The experimental verification has been preliminarily completed, and the on-site verification should be carried out later, and a warning method using the three-dimensional stress field or butterfly plastic zone state can also be studied in future. Furthermore, more detailed three-dimensional stress states [54,55] and anisotropy [56], or particle breakage [57] should also be considered, and the effects of deformation and cracks [58,59] can also be comprehensively considered.
This study obtained the energy values before and after the occurrence of rock burst through the innovative energy calculation method proposed. By comparing them with the actual accident energy, the energy cloud maps of different mechanical states and the relationship between released energy were obtained. From an energy perspective, the formation factors of rock bursts were clarified, and the importance of deviatoric stress in PSSF was emphasized. The minimum triggering stress value required to reach the critical value under different PSSFs was obtained, and the butterfly-shaped plastic zone formed by a deviatoric stress field was preliminarily verified at the laboratory scale. This study provides a new approach for studying the mechanism of rock dynamic disasters and lays a certain foundation for monitoring and warning of butterfly-shaped plastic zones.

5. Conclusions

In this study, the released energy of rock burst accident is obtained by means of energy calculation, the formation factors of rock bursts are obtained by means of the calculation method, and the formation factors of butterfly-shaped plastic zone are obtained and verified by means of laboratory tests. It is easier to achieve quantification and accuracy from the perspective of energy, and the obtained factors of rock burst formations are clearer, which has certain scientific value. The main conclusions are as follows: (1) The energy conditions of rock burst accidents are obtained, which lays the foundation for determining the formation factors of rock bursts. (2) The formation factors of rock burst are the butterfly plastic zone caused by PSSF and appropriate TSF, and PSSF plays a leading role, which determines the possibility of rock burst accidents. The PSSF that leads to the butterfly-shaped plastic zone represents a dangerous state of deviatoric stress field, in which a small triggering stress can lead to large-scale energy release and rock failure. (3) The butterfly failure mode has been preliminarily verified at the laboratory scale through the location of AE events, and the rock sample shows a butterfly-shaped plastic zone before uniaxial loading failure. (4) This study also preliminarily discovered the fractal characteristics of acoustic emission events distribution before the sample failure.

Author Contributions

Conceptualization, W.Z.; methodology, J.M.; software, J.F.; validation, W.Z.; formal analysis, W.Z.; investigation, J.R.; resources, J.S.; data curation, J.R.; writing—original draft preparation, W.Z.; writing—review and editing, J.Z. All authors have read and agreed to the published version of the manuscript.

Funding

The authors gratefully acknowledge the financial support by Qingdao Huanghai University Doctoral Research Fund Project (2022boshi02) and National Natural Science Foundation of China (52174111).

Data Availability Statement

The data presented in this study are available on request from the corresponding author.

Conflicts of Interest

Author Junfeng Zhang was employed by Shandong Lansheng Mining Technology Co., Ltd. The remaining authors declare that the research was conducted in the absence of any commercial or financial relationships that could be construed as a potential conflict of interest.

References

  1. Yang, J.H.; Jiang, Q.H.; Zhang, Q.B.; Zhao, J. Dynamic stress adjustment and rock damage during blasting excavation in a deep-buried circular tunnel. Tunn. Undergr. Space Technol. 2018, 71, 591–604. [Google Scholar] [CrossRef]
  2. Feng, X.-T.; Liu, J.; Chen, B.; Xiao, Y.; Feng, G.; Zhang, F. Monitoring, Warning, and Control of Rockburst in Deep Metal Mines. Engineering 2017, 3, 538–545. [Google Scholar] [CrossRef]
  3. Mark, C. Coal bursts in the deep longwall mines of the United States. Int. J. Coal Sci. Technol. 2016, 3, 1–9. [Google Scholar] [CrossRef]
  4. Mark, C. Coal bursts that occur during development: A rock mechanics enigma. Int. J. Min. Sci. Technol. 2018, 28, 35–42. [Google Scholar] [CrossRef]
  5. Zhang, Q.B.; He, L.; Zhu, W.S. Displacement measurement techniques and numerical verification in 3D geomechanical model tests of an underground cavern group. Tunn. Undergr. Space Technol. 2016, 56, 54–64. [Google Scholar] [CrossRef]
  6. Zhang, W.; Qu, X.; Li, C.; Xu, X.; Zhang, S.; Jin, G.; Wang, Y. Fracture analysis of multi-hard roofs based on microseismic monitoring and control techniques for induced rock burst: A case study. Arab. J. Geosci. 2019, 12, 784. [Google Scholar] [CrossRef]
  7. Carri, A.; Valletta, A.; Cavalca, E.; Savi, R.; Segalini, A. Advantages of IoT-Based Geotechnical Monitoring Systems Integrating Automatic Procedures for Data Acquisition and Elaboration. Sensors 2021, 21, 2249. [Google Scholar] [CrossRef]
  8. Valletta, A.; Carri, A.; Savi, R.; Segalini, A. Algorithms for the Near-Real Time Identification and Classification of Landslide Events Detected by Automatic Monitoring Tools. In International Scientific Conference Environmental Challenges in Civil Engineering; Springer International Publishing: Cham, Switzerland, 2022; pp. 74–84. [Google Scholar]
  9. Drusa, M.; Kais, L.; Dubovan, J.; Markovic, M.; Bahleda, F.; Mecar, M. Measurement of Axial Strain of Geogrid by Optical Sensors. Sensors 2021, 21, 6404. [Google Scholar] [CrossRef]
  10. Rybak, J.; Khayrutdinov, M.M.; Kuziev, D.A.; Kongar-Syuryun, C.B.; Babyr, N.V. Prediction of the geomechanical state of the rock mass when mining salt deposits with stowing. J. Min. Inst. 2022, 253, 61–70. [Google Scholar] [CrossRef]
  11. Liu, J.K.; Luan, H.J.; Zhang, Y.C.; Sakaguchi, O.; Jiang, Y.J. Prediction of unconfined compressive strength ahead of tunnel face using measurement-while-drilling data based on hybrid genetic algorithm. Geomech. Eng. 2020, 22, 81–95. [Google Scholar] [CrossRef]
  12. Ren, J.; Zhang, W.; Wu, Z.; Li, J.; Shen, Y.; Zhang, G. Microseismic Signals in Heading Face of Tengdong Coal Mine and Their Application for Rock Burst Monitoring. Shock Vib. 2021, 2021, 6650446. [Google Scholar] [CrossRef]
  13. Zhang, W.; Huo, T.; Li, C.; Wang, C.; Qu, X.; Xin, C.; Berardengo, M. Characteristics of Valuable Microseismic Events in Heading Face of an Underground Coal Mine Using Microseismic System. Shock Vib. 2021, 2021, 6683238. [Google Scholar] [CrossRef]
  14. Shen, P.; Tang, H.; Zhang, B.; Ning, Y.; He, C. Investigation on the fracture and mechanical behaviors of simulated transversely isotropic rock made of two interbedded materials. Eng. Geol. 2021, 286, 106058. [Google Scholar] [CrossRef]
  15. Cook, N.G.W.; Hoek, E.; Pretorius, J.P.; Ortlepp, W.D.; Salamon, M.D.G. Rock mechanics applied to the study of rock burst. J. S. Afr. Inst. Min. Metall. 1966, 66, 435–528. [Google Scholar]
  16. Bieniawski, Z.T.; Denkhaus, H.G.; Vogler, U. Failure of fractured rock. Int. J. Rock Mech. Min. Sci. Geomech. Abstr. 1969, 6, 323–330. [Google Scholar] [CrossRef]
  17. Brady, B.H.G.; Bnown, E.T. Rock Mechonics for Underground Mining; Springer Science & Business Media: Berlin/Heidelberg, Germany, 1985. [Google Scholar]
  18. Bieniawski, Z.T. Mechanism of brittle of rocks. Part I, II and III. Int. J. Rock Mech. Min. Sci. Geomech. Abstr. 1967, 4, 395–406. [Google Scholar] [CrossRef]
  19. Pan, Y. Disturbance response instability theory of rockburst in coal mine. J. China Coal Soc. 2018, 43, 2091–2098. [Google Scholar]
  20. Gao, F.; Stead, D.; Kang, H. Simulation of roof shear failure in coal mine roadways using an innovative UDEC Trigon approach. Comput. Geotech. 2014, 61, 33–41. [Google Scholar] [CrossRef]
  21. Li, Y. Mechanism of rock burst and its preliminary application. J. China Inst. Min. 1985, 3, 37–43. [Google Scholar]
  22. Pan, J. Theory of rockburst start up and its complete technology system. J. China Coal Soc. 2019, 44, 173–182. [Google Scholar]
  23. Zhao, Z.; Ma, N.; Guo, X.; Zhao, X.; Xia, Y.; Ma, Z. Mechanism conjecture of butterfly rock burst in coal seam roadway. J. China Coal Soc. 2016, 11, 2689–2697. [Google Scholar]
  24. Ma, N.; Guo, X.; Zhao, Z.; Zhao, X.; Liu, H. Occurrence mechanisms and judging criterion on circular tunnel butterfly rock burst in homogeneous medium. J. China Coal Soc. 2016, 11, 2679–2688. [Google Scholar]
  25. Jiang, L.; Kong, P.; Zhang, P.; Shu, J.; Wang, Q.; Chen, L.; Wu, Q. Dynamic Analysis of the Rock Burst Potential of a Longwall Panel Intersecting with a Fault. Rock Mech. Rock Eng. 2019, 53, 1737–1754. [Google Scholar] [CrossRef]
  26. Wang, P.; Jiang, L.; Jiang, J.; Zheng, P.; Li, W. Strata Behaviors and Rock Burst–Inducing Mechanism under the Coupling Effect of a Hard, Thick Stratum and a Normal Fault. Int. J. Geomech. 2018, 18, 04017135. [Google Scholar] [CrossRef]
  27. He, H.; Dou, L.; Gong, S.; Zhou, P.; Xue, Z. Rock burst rules induced by cracking of overlying key stratum. Chin. J. Geotech. Eng. 2010, 32, 1260–1265. [Google Scholar]
  28. Lu, C.-P.; Liu, G.-J.; Liu, Y.; Zhang, N.; Xue, J.-H.; Zhang, L. Microseismic multi-parameter characteristics of rockburst hazard induced by hard roof fall and high stress concentration. Int. J. Rock Mech. Min. Sci. 2015, 76, 18–32. [Google Scholar] [CrossRef]
  29. Xie, J.; Xu, J.; Wang, F. Mining-induced stress distribution of the working face in a kilometer-deep coal mine—A case study in Tangshan coal mine. J. Geophys. Eng. 2018, 15, 2060–2070. [Google Scholar] [CrossRef]
  30. Cao, A.; Dou, L.; Cai, W.; Gong, S.; Liu, S.; Zhao, Y. Tomographic imaging of high seismic activities in underground island longwall face. Arab. J. Geosci. 2016, 9, 232. [Google Scholar] [CrossRef]
  31. Lu, C.-P.; Dou, L.-M.; Zhang, N.; Xue, J.-H.; Wang, X.-N.; Liu, H.; Zhang, J.-W. Microseismic frequency-spectrum evolutionary rule of rockburst triggered by roof fall. Int. J. Rock Mech. Min. Sci. 2013, 64, 6–16. [Google Scholar] [CrossRef]
  32. Xie, H.; Ju, Y.; Li, L. Criteria for strength and structural failure of rocks based on energy dissipation and energy release principles. Chin. J. Rock Mech. Eng. 2005, 24, 3003–3010. [Google Scholar]
  33. Kong, P.; Jiang, L.; Shu, J.; Sainoki, A.; Wang, Q. Effect of Fracture Heterogeneity on Rock Mass Stability in a Highly Heterogeneous Underground Roadway. Rock Mech. Rock Eng. 2019, 52, 4547–4564. [Google Scholar] [CrossRef]
  34. Zhu, S.; Jiang, F.; Wang, X.; Jiang, Y.; Ning, T.; Sun, S. Energy accumulation characteristics and rockburst mechanism of surrounding rock at heading face of extra-thick coal seam. Chin. J. Geotech. Eng. 2019, 41, 2071–2078. [Google Scholar]
  35. Hao, S.; Huilin, Z.; Guansheng, Q.; Wei, L.; Mingjun, W. Preparation and CO2 adsorption properties of TEPA-functionalized multi-level porous particles based on solid waste. Colloids Surf. A Physicochem. Eng. Asp. 2022, 653, 130004. [Google Scholar]
  36. Liu, H.; Guo, L.; Zhao, X. Expansionary Evolution Characteristics of Plastic Zone in Rock and Coal Mass Ahead of Excavation Face and the Mechanism of Coal and Gas Outburst. Energies 2020, 13, 984. [Google Scholar] [CrossRef]
  37. Guo, X.; Zhao, Z.; Gao, X.; Wu, X.; Ma, N. Analytical solutions for characteristic radii of circular roadway surrounding rock plastic zone and their application. Int. J. Min. Sci. Technol. 2019, 29, 263–272. [Google Scholar] [CrossRef]
  38. Gao, F.; Kang, H.; Yang, L. An Experimental Investigation into the Strainburst Process Under Quasi-static Loading. Rock Mech. Rock Eng. 2020, 53, 5617–5629. [Google Scholar] [CrossRef]
  39. Wu, Y.; Gao, F.; Chen, J.; He, J. Experimental Study on the Performance of Rock Bolts in Coal Burst-Prone Mines. Rock Mech. Rock Eng. 2019, 52, 3959–3970. [Google Scholar] [CrossRef]
  40. Gao, F.; Kaiser, P.K.; Stead, D.; Eberhardt, E.; Elmo, D. Strainburst phenomena and numerical simulation of self-initiated brittle rock failure. Int. J. Rock Mech. Min. Sci. 2019, 116, 52–63. [Google Scholar] [CrossRef]
  41. Gao, F.; Kang, H.; Li, J. Numerical simulation of fault-slip rockbursts using the distinct element method. Tunn. Undergr. Space Technol. 2021, 110, 103805. [Google Scholar] [CrossRef]
  42. Haitjema, H. Occam’s Razor. Ground Water 2019, 57, 349. [Google Scholar] [CrossRef]
  43. Hsiung, S.M.; Blake, W.; Chowdhury, A.H.; Williams, T.J. Effects of mining-induced seismic events on a deep underground mine. Pageoph 1994, 139, 741–762. [Google Scholar] [CrossRef]
  44. Xie, L.X.; Yang, S.Q.; Gu, J.C.; Zhang, Q.B.; Lu, W.B.; Jing, H.W.; Wang, Z.L. JHR constitutive model for rock under dynamic loads. Comput. Geotech. 2019, 108, 161–172. [Google Scholar] [CrossRef]
  45. Zhu, F.; Zhao, J. Peridynamic modelling of blasting induced rock fractures. J. Mech. Phys. Solids 2021, 153, 104469. [Google Scholar] [CrossRef]
  46. Gibowicz, S.J.; Kijko, A. An Introduction to Mining Seismology; Earthquake Publish House: San Diego, CA, USA, 1998. [Google Scholar]
  47. Xie, L.X.; Lu, W.B.; Zhang, Q.B.; Jiang, Q.H.; Chen, M.; Zhao, J. Analysis of damage mechanisms and optimization of cut blasting design under high in-situ stresses. Tunn. Undergr. Space Technol. 2017, 66, 19–33. [Google Scholar] [CrossRef]
  48. Wu, H.; Zhao, J.; Liang, W. Pattern transitions of localized deformation in high-porosity sandstones: Insights from multiscale analysis. Comput. Geotech. 2020, 126, 103733. [Google Scholar] [CrossRef]
  49. Li, X.; Li, X.-F.; Zhang, Q.-B.; Zhao, J. A numerical study of spalling and related rockburst under dynamic disturbance using a particle-based numerical manifold method (PNMM). Tunn. Undergr. Space Technol. 2018, 81, 438–449. [Google Scholar] [CrossRef]
  50. Zhao, T.-b.; Guo, W.-y.; Tan, Y.-l.; Lu, C.-p.; Wang, C.-w. Case histories of rock bursts under complicated geological conditions. Bull. Eng. Geol. Environ. 2017, 77, 1529–1545. [Google Scholar] [CrossRef]
  51. Guo, W.; Gu, Q.; Tan, Y.; Hu, S. Case Studies of Rock Bursts in Tectonic Areas with Facies Change. Energies 2019, 12, 1330. [Google Scholar] [CrossRef]
  52. Liu, B.; Zhang, H.; Zhang, B.; Lian, Z.; Yang, L.; Liu, T. Investigating the Characteristic of Weak Magnetic Stress Internal Detection Signals of Long-Distance Oil and Gas Pipeline Under Demagnetization Effect. IEEE Trans. Instrum. Meas. 2021, 70, 6011013. [Google Scholar] [CrossRef]
  53. Herbut, A.; Rybak, J.; Brząkała, W. On a Sensor Placement Methodology for Monitoring the Vibrations of Horizontally Excited Ground. Sensors 2020, 20, 1938. [Google Scholar] [CrossRef]
  54. He, S.H.; Goudarzy, M.; Ding, Z.; Sun, Y.F. Strength, Deformation, and Particle Breakage Behavior of Calcareous Sand: Role of Anisotropic Consolidation. J. Geotech. Geoenviron. Eng. 2023, 149, 17. [Google Scholar] [CrossRef]
  55. Sun, Y.F.; Sumelka, W.; He, S.H.; Gao, Y.F. Enhanced Fractional Model for Soil-Structure Interface Considering 3D Stress State and Fabric Effect. J. Eng. Mech. 2022, 148, 16. [Google Scholar] [CrossRef]
  56. Kong, B.; Dai, C.-X.; Hu, H.; Xia, J.; He, S.-H. The Fractal Characteristics of Soft Soil under Cyclic Loading Based on SEM. Fractal Fract. 2022, 6, 423. [Google Scholar] [CrossRef]
  57. He, S.-H.; Ding, Z.; Sun, Y.; Chen, W.-Y.; Xia, T.-D. Cumulative deformations and particle breakage in calcareous sand subjected to drained high-cyclic loading: Experimental investigation. Soil Dyn. Earthq. Eng. 2022, 161, 107417. [Google Scholar] [CrossRef]
  58. Ding, Z.; Zhang, M.-B.; Zhang, X.; Wei, X.-J. Theoretical analysis on the deformation of existing tunnel caused by under-crossing of large-diameter slurry shield considering construction factors. Tunn. Undergr. Space Technol. 2023, 133, 104913. [Google Scholar] [CrossRef]
  59. Wang, R.; Ding, Z.; Zhang, Y.; Xu, Y. Self-healing of high-performance engineered cementitious materials with crystalline admixture in the seawater environment. J. Build. Eng. 2023, 63, 105472. [Google Scholar] [CrossRef]
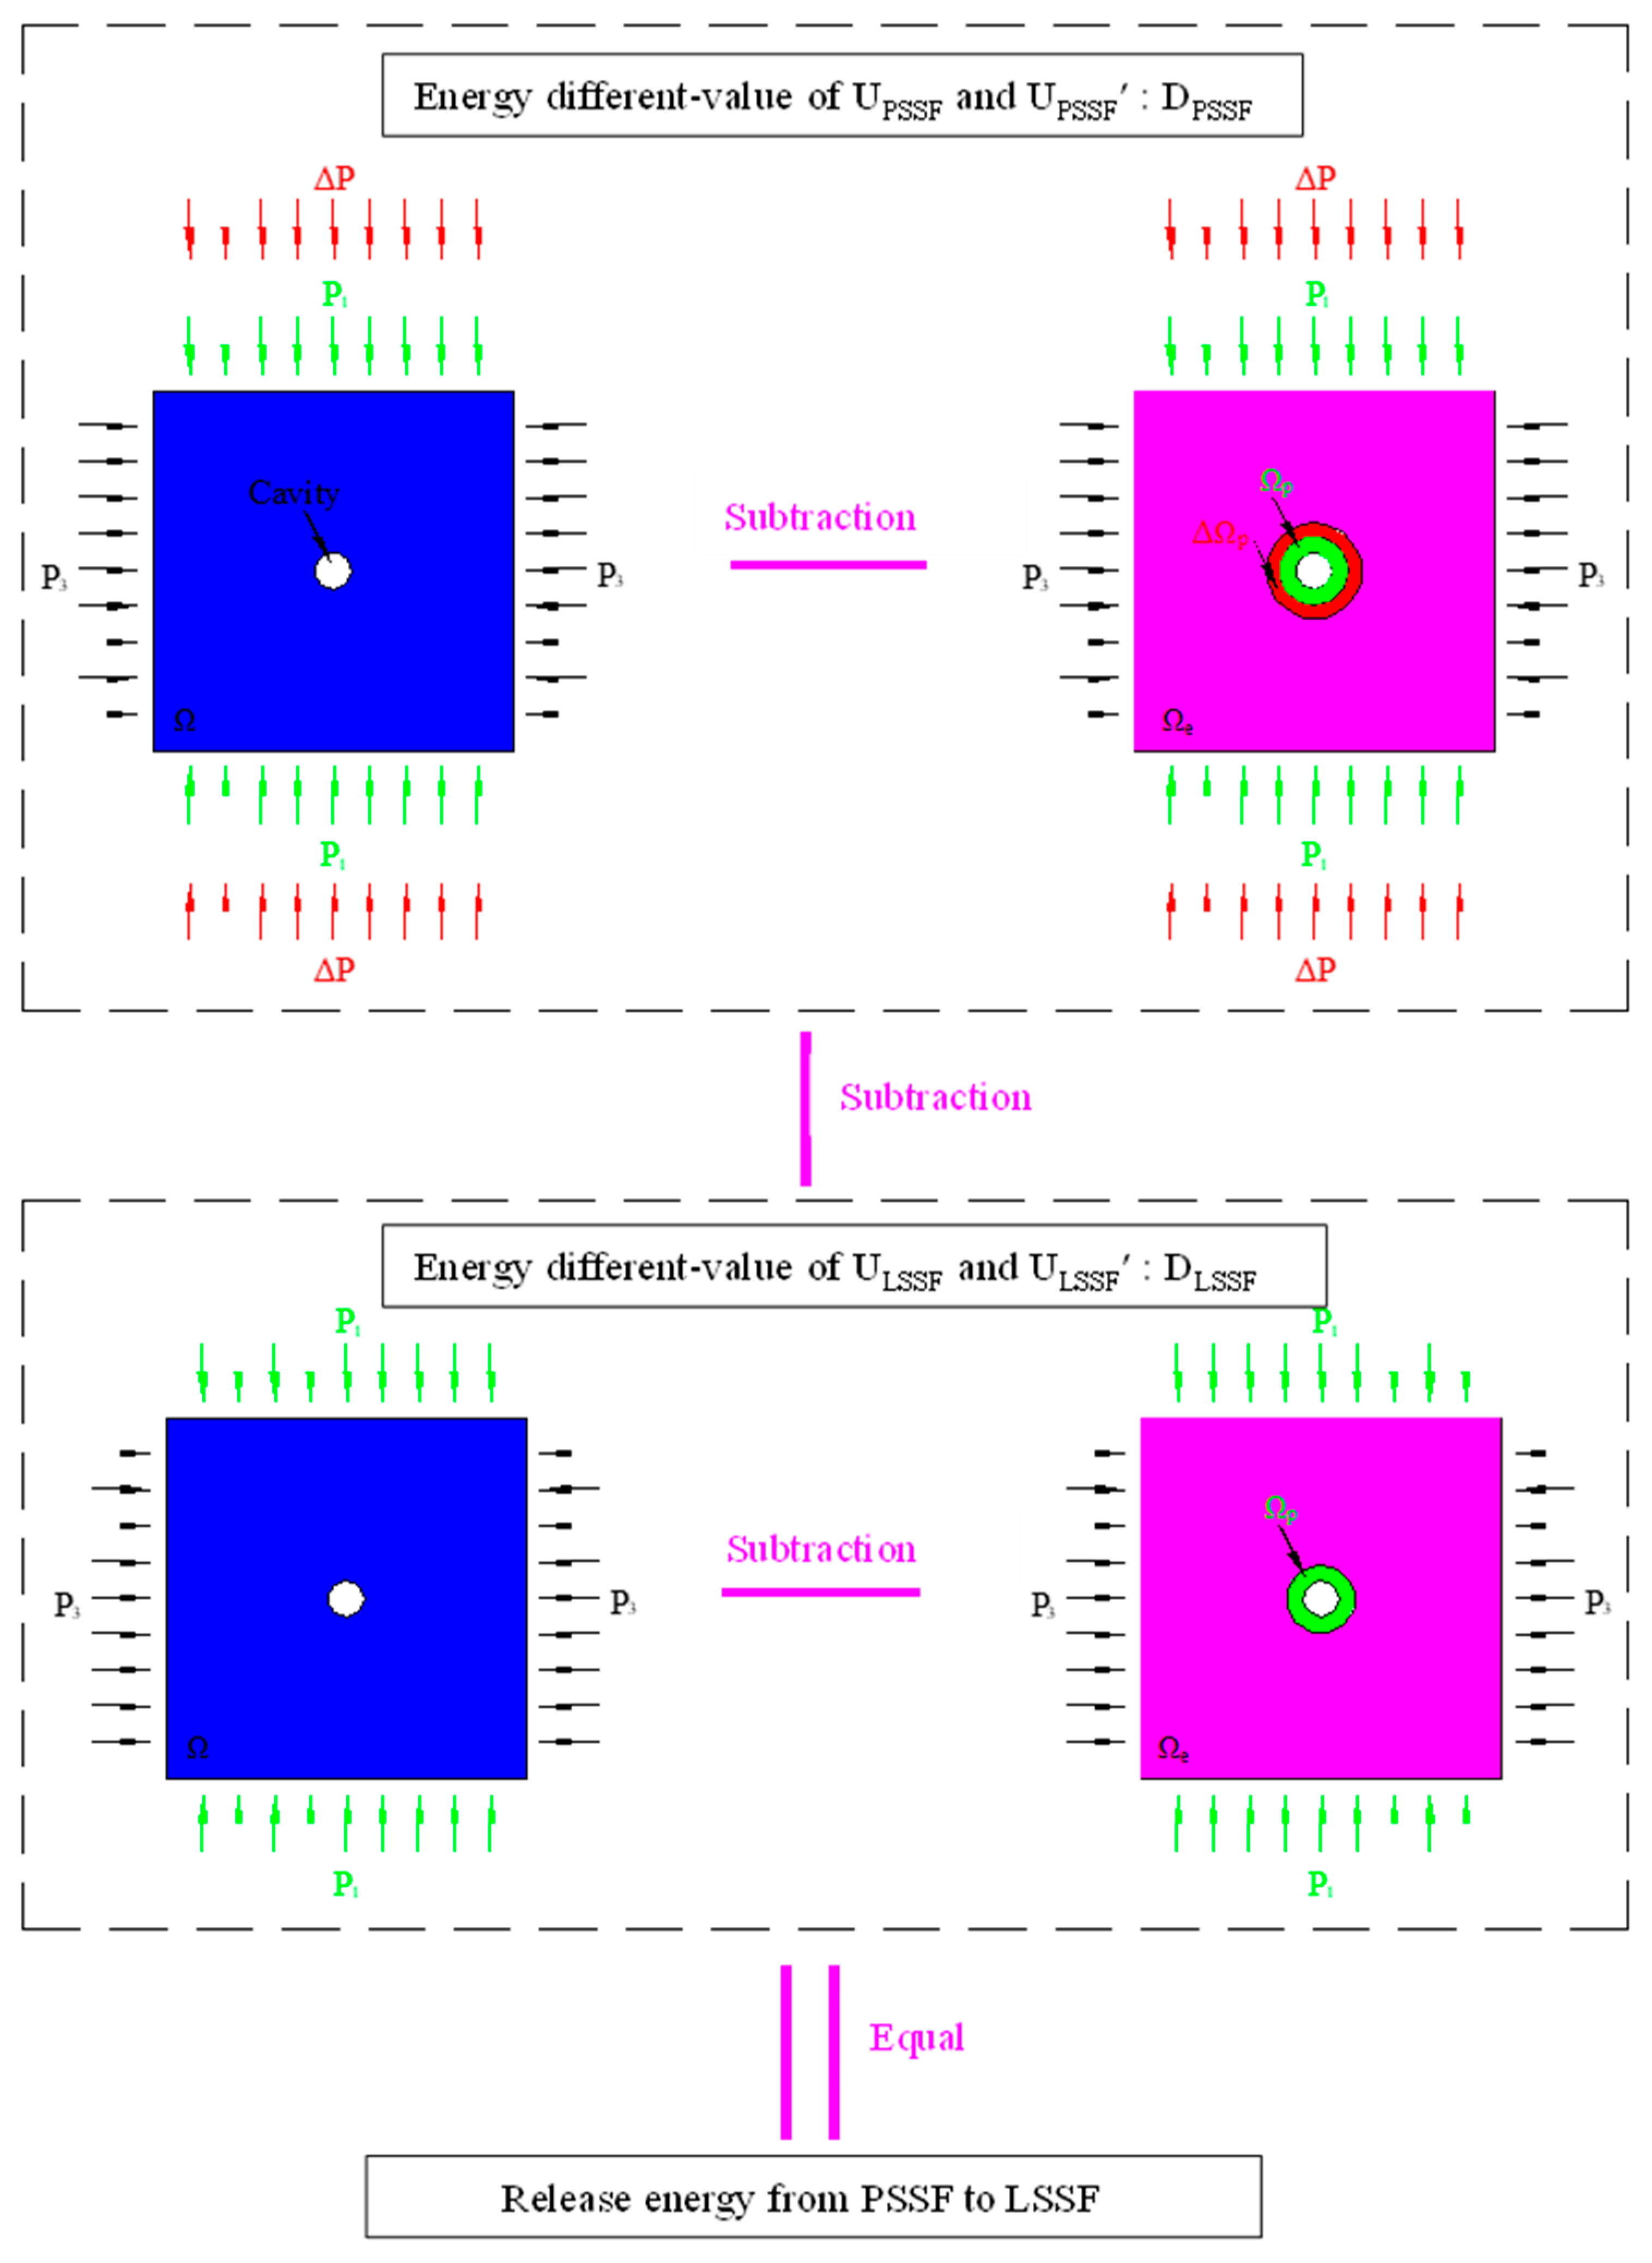
Figure 1. Calculation chart process of energy release during the mechanical state change process of rock mass from PSSF to LSSF.
Fractalfract 07 00829 g001
Figure 2. Example model and its external force state.
Fractalfract 07 00829 g002
Figure 3. DLSSF distribution when P1 = 40 MPa, 50 MPa, 55 MPa, 58.6 MPa (the horizontal and vertical coordinates represent the width and height of the model, corresponding to Figure 1).
Fractalfract 07 00829 g003
Figure 4. Change curve of storage and different-value of energy.
Fractalfract 07 00829 g004
Figure 5. Release energy density map of butterfly related mechanical states (the horizontal and vertical coordinates represent the width and height of the model, corresponding to Figure 1).
Fractalfract 07 00829 g005
Figure 6. Release energy variation curve with different P1 (LSSF).
Fractalfract 07 00829 g006
Figure 7. The formation factors of rock burst based on energy calculation.
Fractalfract 07 00829 g007
Figure 8. Required minimum TSF to reach the critical energy value under different stage.
Fractalfract 07 00829 g008
Figure 9. Variation curves of plastic zone Rmax, area S, and released energy with the increase in P1.
Fractalfract 07 00829 g009
Figure 10. Equipment used for experimental verification.
Fractalfract 07 00829 g010
Figure 11. Scatter plot and heat map of AE events occurred during the period of 1990~1992s and 1993~1995s. (a) Scatter plot of AE events occurred during the period of 1990~1992s. (b) Heat map of AE events occurred during the period of 1990~1992s. (c) Scatter plot of AE events occurred during the period of 1993~1995s. (d) Heat map of AE events occurred during the period of 1993~1995s.
Fractalfract 07 00829 g011
Figure 12. Scatter plot and heat map of AE events occurred during the whole period of 1990~1995s. (a) Scatter plot of AE events occurred during the whole period of 1990~1995s. (b) Heat map of AE events occurred during the whole period of 1990~1995s.
Fractalfract 07 00829 g012
Disclaimer/Publisher’s Note: The statements, opinions and data contained in all publications are solely those of the individual author(s) and contributor(s) and not of MDPI and/or the editor(s). MDPI and/or the editor(s) disclaim responsibility for any injury to people or property resulting from any ideas, methods, instructions or products referred to in the content.