Abstract
Shale gas is a prospective cleaner energy resource and the exploration and development of shale gas has made breakthroughs in many countries. Structure deformation is one of the main controlling factors of shale gas accumulation and enrichment in complex tectonic areas in southern China. In order to estimate the shale gas capacity of structurally deformed shale reservoirs, it is necessary to understand the systematic evolution of organic pores in the process of structural deformation. In particular, as the main storage space of high-over-mature marine shale reservoirs, the organic matter pore system directly affects the occurrence and migration of shale gas; however, there is a lack of systematic research on the fractal characteristics and deformation mechanism of organic pores under the background of different tectonic stresses. Therefore, to clarify the above issues, modular automated processing system (MAPS) scanning, low-pressure gas adsorption, quantitative evaluation of minerals by scanning (QEMSCAN), and focused ion beam scanning electron microscopy (FIB-SEM) were performed and interpreted with fractal and morphology analyses to investigate the deformation mechanisms and structure of organic pores from different tectonic units in Silurian Longmaxi shale. Results showed that in stress concentration areas such as around veins or high-angle fractures, the organic pore length-width ratio and the fractal dimension are higher, indicating that the pore is more obviously modified by stress. Under different tectonic backgrounds, the shale reservoir in Weiyuan suffered severe denudation and stronger tectonic compression during burial, which means that the organic pores are dominated by long strip pores and slit-shaped pores with high fractal dimension, while the pressure coefficient in Luzhou is high and the structural compression is weak, resulting in suborbicular pores and ink bottle pores with low fractal dimension. The porosity and permeability of different forms of organic pores are also obviously different; the connectivity of honeycomb pores with the smallest fractal dimension is the worst, that of suborbicular organic pores is medium, and that of long strip organic pores with the highest fractal dimension is the best. This study provides more mechanism discussion and case analysis for the microscopic heterogeneity of organic pores in shale reservoirs and also provides a new analysis perspective for the mechanism of shale gas productivity differences in different stress–strain environments.
1. Introduction
In recent years, with the success of the “shale gas revolution” in North America and the continuous growth of global energy demand, the exploration and development of shale gas resources have attracted increasing attention all over the world [1,2,3]. Shale gas is a large-scale, high-potential but difficult-to-exploit unconventional oil and gas system [4]. Organic matter in shale is not only the source of natural gas but also the storage space [5,6], of which, the widely developed organic pores make significant contributions to the shale reservoir space [7]. Well-developed organic pores can form interconnected pore networks that control shale gas content and methane adsorption capacity [8,9]. Therefore, the study of organic pores is of great significance for reservoir quality evaluation and shale gas resource exploration.
The sizes, morphologies, structures, and types of organic pores greatly influence the reservoir capacity and distribution pattern of shale gas [10]. When characterizing the complex pore network of shale reservoirs, FE-SEM imaging technology can qualitatively observe two-dimensional shale pores and quantitatively extract pore structure parameters such as surface porosity and pore diameter [11], while low-pressure N2 /CO2 adsorption experiments can quantitatively characterize pore size distribution, pore volume, and specific surface area [12]. These pore structure parameters can characterize the content estimation, transport dynamics, and occurrence state of shale gas [13]. Furthermore, SEM images combined with successive FIB milling of the rock surface can also reconstruct the three-dimensional digital pore network model [14], which can be used to quantify the pore throat distribution and coordination number to evaluate the connectivity and permeability of the shale pore system [15,16].
In view of the complexity and non-homogeneity of pores in shale reservoirs, fractal characteristics have been introduced as a new method for studying shale pore structures that cannot be addressed using Euclidean geometry theory [17,18,19]. Fractal dimension (D) can be used to quantitatively evaluate pore surface roughness and structural irregularity, and in general, a large fractal dimension value represents a more complex pore structure [20,21,22]. The fractal characteristics of shale are currently studied using image methods and low-pressure nitrogen adsorption, focusing on linking fractal characteristics to pore structure and rock components [23,24]. The fractal dimension is usually higher for smaller pore sizes and larger porosities, while the effect of mineral or TOC content remains inconclusive, even resulting in completely opposing conclusions in various studies [25,26,27]. Therefore, it is particularly important to identify the factors influencing pore fractal dimension in the geological background of the study area, which is also one of the focuses of this study.
Organic pore development is restricted by multiple factors such as TOC, organic matter types, maturity, mineral composition and rigid frame, pore fluid, and pressure [28,29,30,31], and its formation and evolution mechanism is very complex. The essence of organic pore formation is kerogen decomposition during hydrocarbon generation, but this is non-linear [32]. In the over-maturity stage (the Ro = 2.0–3.5%), the number of micropores increases and micropores will connect with each other to form meso-macropores with larger pore sizes as the thermal maturity increases [33,34]. The thermal evolution is also accompanied by a change in the overlying formation pressure and fluid properties [35,36]. Furthermore, dissolution will provide charging volumes for subsequent bitumen generation [37,38], and mineral recrystallization may also enhance the brittleness of shale, thereby protecting the pores from compression [39,40]. In recent years, there has been abundant progress in identifying the controlling mechanisms of organic pore generation and evolution such as sedimentary environment, mechanical compaction, and burial evolution [37,39,40,41], while work on identifying the restriction mechanism of stress, especially tectonic deformation, on pore development started relatively late. The influence of tectonic activities on the preservation conditions of shale gas is considered to be the key factor controlling the enrichment and high yield of shale gas [42,43]. Scholars have systematically investigated the pore structures and gas adsorption/desorption properties of shale reservoirs in tectonically complex areas and tried to reveal the influence of tectonic deformation in gas shales on the evolution of pore structures [44,45,46]. For example, the deformation strength gradually weakens from the center of the anticline to the two wings, so the pore characteristics are different in these areas [47]. From the perspective of pore-fracture configuration, the presence of organic pores in contact with the fractures will lead to formation pressure leakage, resulting in smaller and deformed pores [48]. In addition, the influence mechanisms of ductile folding and brittle sliding on pore structure are also different [49,50]. However, there are still insufficient studies on the morphological characteristics and distribution of organic pores under different tectonic evolution histories and tectonic stress backgrounds.
The southern Sichuan Basin has experienced complex multi-stage tectonic movements such as Caledonian, Hercynian, Indo-Chinese, and Himalayan, and the differences in shale reservoirs in the Basin are closely related to the tectonic deformation mechanism [51]. Therefore, this study focused on a typical Marine shale reservoir of the Silurian Longmaxi Formation in southern China. The Weiyuan block in the southwestern Sichuan depression and the Luzhou block in the southern Sichuan fold belt were selected because of their similar sedimentary environments, composition types, and organic matter abundance. Scanning electron microscopy (SEM) and focused ion beam scanning electron microscopy (FIB-SEM) were used to visually observe the morphology, size, and distribution of each pore, while liquid injection was used to quantitatively obtain pore size distribution, pore volume, and specific surface. Through analysis of the above pore characteristics and parameters combined with knowledge of the tectonic background of the late Mesozoic-Cenozoic differential extrusion, the genetic mechanism linked with storage and the permeability properties of organic pores with different morphologies were revealed, which provides a theoretical basis and case analysis for constructing the microscopic pore structure characteristics of organic-rich shale under complex tectonic backgrounds.
2. Geological Setting
The Sichuan Basin is located in the northwest portion of the Yangtze Plate and has experienced numerous complex tectonic movements including Caledonian, Hercynian, Indosinian, Yanshanian, and Himalayan [52] and undergone two complete geological evolution cycles of weak tensioning-weak compression-weak tensioning-weak compression since the Sinian Dengying period, accompanied by two stages of geoclastic tensioning and two stages of compression [53]. Taking the Huaying Mountain and Longquan Mountain anticlinal belts as boundaries, the Sichuan Basin can be divided into three tectonic zones and six sublevel tectonic units [54,55]. The Weiyuan Block located in the southwestern Sichuan low-steep fold belt and the Luzhou Block in the southern Sichuan low-steep fold belt were selected as the study area (Figure 1), both of which are located in the complex superposition of the south-north Daliang mountains-Wumeng mountains tectonic deformation belt on the eastern margin of Qinghai-Tibet Plateau and eastern Sichuan fold belt. Strong composite tectonic deformation since the Indosinian period has formed a complex tectonic framework and differential uplift denudation in the study area [56]. The comb anticline structure arranged in an echelon is developed from north to south in the Luzhou block, the syncline structure is wide and gentle, and the developed fault is small in scale [57]. Meanwhile, the Weiyuan is generally controlled and restricted by the Weiyuan large vault anticline [58].
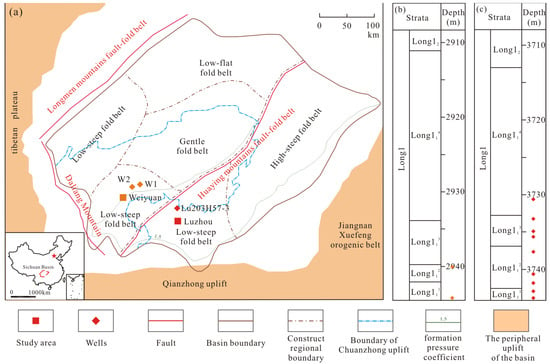
Figure 1.
Tectonic location of Sichuan Basin and stratigraphic column of Longmaxi Formation. (a) Structural regional map of Sichuan Basin [59,60]. (b) Weiyuan block sampling distribution. (c) Luzhou block sampling distribution.
At the end of the Ordovician and the beginning of the Silurian, two global transgressions and multi-stage large-scale volcanic activities caused extensive sedimentation of the Silurian Longmaxi Formation in the Sichuan Basin and its periphery with siliceous, calc, and clay shales as the main lithofacies [61,62]. The Longmaxi Formation shale in the study area has undergone a multi-stage tectonic and thermal evolution process of shallow burial, slow uplift, secondary deep burial, and rapid uplift since its deposition [63], and the thermal evolution is in the high mature-overmature stage, so it has generally experienced oil generation, oil cracking into gas, bitumen cracking into gas, and kerogen direct gas generation [64].
3. Materials and Methods
3.1. Samples
In this study, a total of 12 representative samples from Wells W1 and W2 in the Weiyuan Block and Well L203H57-3 in the Luzhou Block were selected for comparison, and the samples were all from 1–4 small layers of Long11 sub-member (Figure 1). In principle, the samples of each small layer in the Luzhou are involved, and they all represent the main lithology of the interval. For example, the sample of Long111 consists entirely of siliceous shales, which are the most common lithology in this layer, Long112 contains siliceous shales and calc-siliceous shales, and Long113 is dominated by clay siliceous shales (Table 1). For comparison, we selected well locations (closer to the center of the depositional water body) in the deep-water plain sedimentary microfacies of Weiyuan and selected the siliceous shale in the lower part of the Long11 sub-member. Thin sections were prepared by cutting 2~3 mm thick sections perpendicular to the direction of core bedding, and then the images in the visual field were determined to be consistent with the direction of formation deposition according to the direction of mineral laminae and fracture and orientation of clay minerals under scanning electron microscopy. All SEM experiments were accomplished in the Laboratory of Reservoir Microstructural Evolution and Digital Characterization of Yangtze University.

Table 1.
Minerals characteristic of Long11 sub-member.
3.2. MAPS
The morphology and distribution of organic pores were observed using MAPS (Modular Automated Processing System) scanning, which was used to automatically acquire high-resolution large-format mosaic images. The surface area of interest was divided into a grid format and a sequence of BSE/SE images were acquired in real-time [65]. Therefore, compared with ordinary SEM images, MAPS has a wider imaging range, an adjustable field of view, and is more representative. The equipment used for MAPS and FIB-SEM scanning was a HELIOS NanoLab650 dual beam FIB and SEM workstation, with voltage ranging from 1 to 30 KV and current ranging from 0.78 pA to 26 nA. MAPS with 500 nm resolution was first used for overall rough scanning of the sample to observe the fracture and veins in a large field of view. On the basis of this larger scope of vision, a representative region (400 μm × 400 μm) was selected under this field of view for local fine scanning with a higher resolution (4 nm). Then, Avizo software (https://www.thermofisher.cn/cn/zh/home/electron-microscopy/products/software-em-3d-vis/avizo-software.html (accessed on 22 September 2024)) was used to extract organic porosity and the specific parameters of each pore such as length, width, and equivalent radius based on the MAPS scanned images. The number of organic pores extracted from each sample ranged from 10,759 to 57,920, with an average of 28,314.
3.3. FIB-SEM
The two-dimensional microstructure, structural characteristics, and three-dimensional connectivity of the samples were studied using focused ion beam scanning electron microscopy (FIB-SEM) on a HELIOS NanoLab650 operating in high-vacuum scanning mode. The three-dimensional images (10 μm ×10 μm ×10 μm) scanned in this experiment were selected from MAPS fine scanning, and the objects selected in this study were mainly large organic matter with organic pores. The three-dimensional pore-throat model of organic pores was extracted by image analysis and processing, and parameters such as aperture and coordination number of the three-dimensional organic pores were quantified.
3.4. QEMSCAN
QEMSCAN (Quantitative Evaluation of Minerals by Scanning Electron Microscopy) mineral analysis scanning was carried out using a QEMSCAN 650F with a voltage of 1~30 KV, and a current of 0.78 pA~26 nA, following the Chinese National Standard GB/T 20726-2015 [66]. The field of view selected in this experiment corresponds to that of the MAPS scan used to obtain the mineral content and distribution in this area.
3.5. Low-Pressure N2/CO2 Adsorption-Desorption
We performed low-pressure N2/CO2 physisorption tests using a Micromeritics ASAP 2460 Surface Area and Porosity Analyzer, the experiment was completed in China University of Petroleum (East China). Low-pressure N2 adsorption was carried out at 77.35 K (−195.85 °C) with a relative pressure of N2 ranging from 0.002 to 0.993. Low-pressure CO2 adsorption was measured at 273 K (ice-water mixture) with a relative pressure of CO2 ranging from 0.006 to 0.029. The isothermal adsorption curve was generated according to the amount of N2 adsorbed under a certain pressure, then the surface area of shale samples was calculated by using the Brunauer–Emmett–Teller (BET) method, while the Barrett–Joyner–Halenda (BJH) method was used to obtain the pore volume and pore size distribution [67]. Based on the adsorbed quantity of CO2, a density functional theory (DFT) model was used to calculate the specific surface area and pore volume of the micropores [68].
3.6. Fractal Theory
3.6.1. Frenkel–Halsey–Hill (FHH) Model
Based on the data obtained from the low-pressure N2 adsorption-desorption experiments, the fractal dimension of the shale was calculated using the FHH model, which has been widely applied and is reported in detail in [27,69]. The FHH model can be simplified as:
where P is equilibrium pressure, Mpa; V is the volume of N2 adsorbed under equilibrium pressure, cm3/g; V0 is the volume of monomolecular adsorption gas, cm3/g; P0 is the saturation pressure, Mpa; C is a characteristic constant; and K is the slope of the fitted line from the plot of ln(ln(P/P0)) versus ln(V). In this study, the fractal dimension based on low-pressure N2 adsorption (D) is obtained by Equation (2).
3.6.2. Box Counting and Dilation Method
In the calculations of the MAPS fractal dimensions, we used the method of gray extraction and box-counting methods to calculate the fractal dimension of only the organic pores. The method involves regarding the SEM image as a three-dimensional surface, and dividing it into many boxes with side lengths of ε, making the number of divisions in each direction the same, and then calculating the number of boxes N(ε) covering the organic pore, when the box size is reduced to zero, the fractal dimension can be obtained, the number of boxes can be calculated as follows [70]:
where ε is the length of the box side; N(ε) is the number of boxes of size ε containing organic pores; c is the constant that describes the vertical intercept; and DL stands for length fractal dimension. Linear fractal dimension refers to the fractal dimension obtained by two-dimensional images, which meets 1 < DL < 2. On the basis of the assumption of isotropic structure, the fractal dimension of a surface (DS) in three-dimensional space is obtained by using DS = DL + 1 [71].
4. Results
4.1. Mineral Composition and Brittleness Index
The mineralogy composition based on QEMSCAN scanning of the shale of the Longmaxi Formation derived from three wells (W1, W2, L203H57-3) is presented in Table 1. In the same small layer, the mineral composition of the two study areas is relatively similar. Taking the Long111 and Long112 layers as an example, the clay mineral contents in Luzhou and Weiyuan vary from 1.8% to 5.8% (avg. 3.8) and 2.4% to 6.2% (avg. 4.2), respectively. But there are obvious differences between strata in a single well. For example, the clay mineral contents vary from 6.1% to 27.5% (avg. 17.5) in the Long111 and Long112 layers of one of the Luzhou wells. To clarify this difference, we introduced the brittleness index to characterize it.
The mineral composition of Marine shale in southern China is relatively complex and quartz, feldspar, calcite, and dolomite are all brittle minerals [72]. Therefore, the calculation method of the brittleness index in this manuscript adopts the mineral composition calculation method, which is expressed by the proportion of brittle minerals as follows:
The results show that the brittleness indexes of the Long111 and Long112 layers are higher, with averages of 94.8% and 96.3%, than those of the Long113 and Long114 layers, with averages of 81.4% and 70.6%, respectively.
4.2. SEM Observation and Statistics
The extraction of organic pore porosity based on the grayscale of the MAPS images is shown in Table 2. It was found that the porosity of organic pores of shale samples was positively correlated with the brittleness index. The organic porosity of the Long111 and Long112 layers with higher brittleness index is higher, with an average of 1.66% and 1.56%, while the small layers of Long113 and Long114 had a low brittleness index and an organic porosity of only 0.89% and 0.48% (Figure 2). It is speculated that the brittle mineral skeleton can improve the mechanical strength of shale such that the organic pores can be preserved under strong external force [73].
Table 2.
Shale reservoir parameters of Long11 sub-member from MAPS.
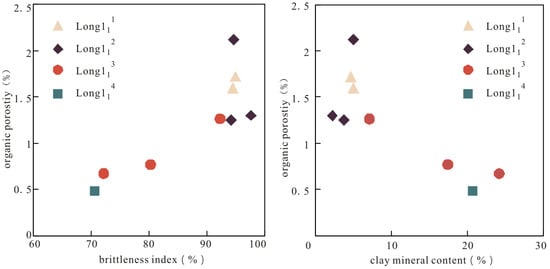
Figure 2.
The interrelationship between brittleness index, clay mineral content, and organic porosity of the Long11 sub-member of Well L203H57-3.
In the layer with a high brittleness index (>90%), the organic porosity of shale samples from Luzhou is different, ranging from 1.25% to 2.12%, even though the brittle mineral framework provides protection to the organic pores (Figure 2). At the same time, MAPS also showed that organic pores were distributed in various forms. Therefore, according to the data on pore diameter and length-width ratio of the organic pores, organic pores with a pore diameter greater than 50 nm and length-width ratio less than 2 were defined as suborbicular pores and the organic pores with a diameter greater than 50 nm and length-width ratio greater than 2 were defined as long strip pores. Meanwhile, the organic pores with a diameter of less than 50 nm were defined as honeycomb pores because the small diameter and the deformation under stress were not obvious. The proportion of pores of different morphologies for all samples with organic pore porosities of greater than 1% was calculated and the results are shown in Table 2. Samples with porosities lower than 1% were not counted due to the small amount and size of organic pores that could be observed under MAPS and because these were of little statistical significance.
4.3. Pore Structure Examined by Gas Adsorptions
The obtained N2 adsorption isotherms of the selected samples conformed to both type II and type IV(a) physical adsorption isotherms defined by IUPAC (Figure 3) [74], suggesting that the samples are dominated by micropores and mesopores with a heterogeneous surface. Adsorption in Longmaxi shale occurs mainly in the 0–0.1 and 0.9–1 regions in terms of relative pressure, and there is no plateau at high relative pressure, which indicates that the micropores and mesopores are well developed. The adsorption-desorption isotherms of all samples have obvious hysteresis loops, indicating that capillary condensation occurs in the mesopores [75]. Based on the IUPAC classification of hysteresis [74], the morphology of the hysteresis loops is H2(a), H3, and H4, that is, multiple [ hysteresis loops are superimposed, which reflects the fact that shale samples are disordered porous materials with an uneven pore network structure.
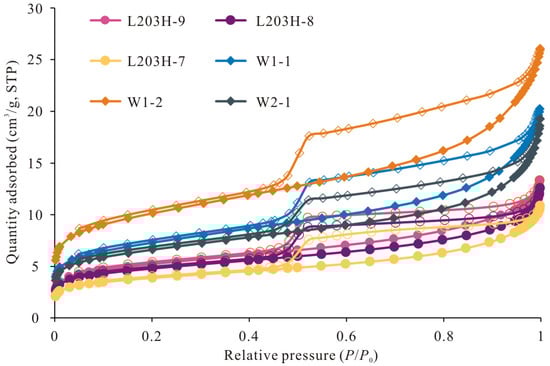
Figure 3.
Low-pressure N2 adsorption-desorption isotherms of shale samples in Luzhou and Weiyuan. The line connecting the filled points is the adsorption curve and the line connecting the hollow point is the desorption curve.
N2 adsorption isotherms and hysteresis loops can reflect pore shape [28], such as open cylindrical, layered slit, and ink bottle. Comparing the adsorption-desorption isotherms of shale samples between two study areas, the desorption curves of Weiyuan are steeper, and the hysteresis loops are similar to type H2(a), while the hysteresis loops of Luzhou are more inclined to type H2(b), which indicates that the size distribution of pore necks is narrow in Weiyuan shale, while the range of pore neck sizes in Luzhou is wider [74]. Meanwhile, based on the classification of Labani [76], hysteresis loops can be divided into six types (A–F). Our analysis shows that the hysteresis loops in Weiyuan are type B, while those of Luzhou are closer to type E [27]. The results indicate that the pore shapes of Weiyuan consist of slit-shaped pores, while Luzhou may be dominated by ink bottle pores.
Based on the N2 adsorption and desorption curves, a BJH model was used to calculate the specific surface area and pore volume of shale [77]. The specific surface area of the pores of the Weiyuan shale ranges from 22.64 m2/g to 34.76 m2/g (Table 3), with an average of 27.48 m2/g. The pore volume ranges from 0.0118 to 0.0176 cm3/g, with an average of 0.0143 cm3/g. The specific surface area of the pores of the Luzhou shale ranges from 13.36 m2/g to 18.12 m2/g, with an average of 16.44 m2/g. The pore volume ranges from 0.0066 to 0.0090 cm3/g, with an average of 0.0081 cm3/g. The specific surface area and volume of the pores of Weiyuan shale are higher than those of Luzhou shale, which is consistent with the higher porosity calculated by MAPS.
Table 3.
Pore parameters of Long11 sub-member from gas adsorption.
Meanwhile, the specific surface area and volume of shale micropores were calculated using a DFT model [78], The specific surface area of the micropores of the Weiyuan shale ranges from 3.02 m2/g to 4.47 m2/g, with an average of 3.77 m2/g. The micropore volume ranges from 0.0020 to 0.0027 cm3/g, with an average of 0.0023 cm3/g. The specific surface area of the micropores of the Luzhou shale ranges from 2.58 m2/g to 3.79 m2/g, with an average of 3.39 m2/g. The micropore volume ranges from 0.0011 to 0.0017 cm3/g, with an average of 0.0015 cm3/g. The specific surface area and volume of the micropores of Weiyuan shale are, thus, also higher than those of Luzhou shale.
4.4. Fractal Characterization
Based on the fractal FHH model and N2 adsorption data, the plots of ln(V) versus ln(ln(P0/P)) from the studied shale samples are shown in Figure 4. These show a significant linear relationship with a high correlation coefficient (R2 > 0.9), indicating that the Longmaxi Formation shale has obvious fractal features. Previous studies have commonly divided FHH plots into two regions, reflecting two different adsorption characteristics, corresponding to the fractal characteristics D1 and D2 [79,80]. Fractal dimension D1 corresponds to low-pressure region fractal characteristics (P/P0 < 0.45), reflecting the van der Waals forces of monolayer–multilayer adsorption in micropores. Fractal dimension D2 mainly represents mid- to high-pressure region fractal characteristics (P/P0 > 0.45), indicating capillary condensation based mainly on the spatial complexity and irregularity of mesopores and macropores [71,81].
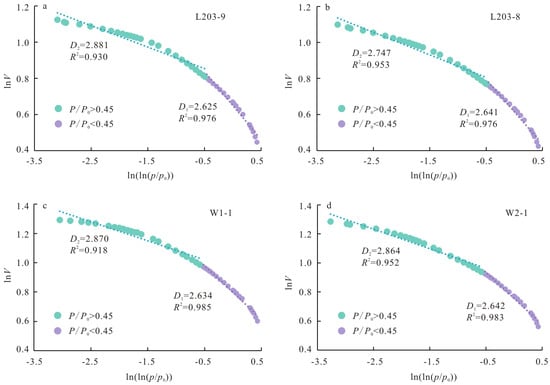
Figure 4.
Plots of ln(V) vs. ln(ln(P0/P)) from N2 adsorption-desorption experiments using FHH model. (a) Fractal dimensions of L203-9 shale. (b) Fractal dimensions of L203-8 shale. (c) Fractal dimensions of W1-1 shale. (d) Fractal dimensions of W2-1 shale.
The results of fractal analysis based on the N2 adsorption experiments are shown in Table 4. Although the fractal results of the N2 adsorption experiments are based on all the pores of the entire shale sample, they still represent the fractal characteristics of the organic pores to a certain extent. The results show that fractal dimension D1 of the shale samples in Weiyuan is observed to be higher than that of the samples in Luzhou, while the data with respect to fractal dimension D2 are more complicated. Due to the resolution limitation of a large amount of data collected in MAPS used in the comparison, the minimum pore diameter that can be identified is only 10 nm, and macropores are more affected by stress extrusion pore extrusion deformation [9,82], so D2 received more attention in this study. In the following discussion, samples from Luzhou were further divided according to whether veins or fractures developed. In general, the samples with developed veins or fractures (L203-8, L203-9) had the highest D2 values (mean of 2.877), the homogeneous Weiyuan samples had the second highest values (mean of 2.872), and the D2 values of the homogeneous samples from Luzhou (L203-5, L203-7) were the lowest (mean of 2.859).
Table 4.
Fractal dimensions calculated by the FHH model from N2 adsorption experiments.
Based on the box-counting and dilation method and SEM images of the organic pores, plots of ln(N(ε)) versus ln(ε) for the studied shale samples were generated and are shown in Figure 5. These show an excellent correlation coefficient. The fractal dimension obtained from the measurement of the area of the organic pores extracted based on MAPS is shown in Table 5. The results are similar to the fractal dimension calculated by the FHH model and again show that the fractal dimension of Weiyuan is larger than that of Luzhou in the homogeneous region.
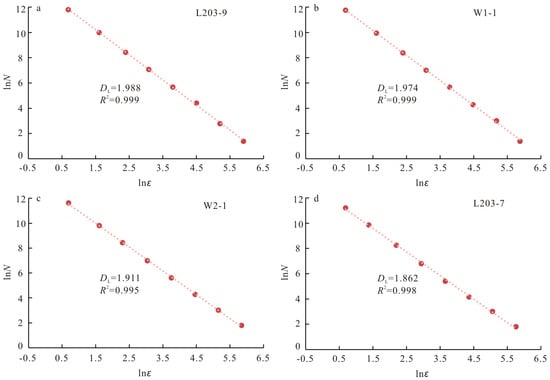
Figure 5.
Plots of ln(N) vs. ln(ε) from MAPS images using box-counting and dilation method. (a) Fractal dimensions of an image from L203-9. (b) Fractal dimensions of an image from W1-1. (c) Fractal dimensions of an image from W2-1. (d) Fractal dimensions of an image from L203-7.
Table 5.
Fractal dimensions calculated from MAPS images using box-counting and dilation method.
5. Discussion
5.1. Microscopic Deformation Characteristics
The relatively stable brittle mineral framework provides support and preservation for the pores in the organic matter to a certain extent, but under the action of intense tectonic compression, compaction, mineral recrystallization, and other stresses [49], rigid mineral particles will also locally squeeze adjacent organic matter components. As a result, the outline of organic matter components and internal organic pores are significantly deformed [83], and the originally round organic matter pores are deformed into ellipses by extrusion (Figure 6). SEM images showed the following evidence of deformation of organic pores under stress conditions: (1) The deformation of organic pores was directional, that is, the long axes of elliptical organic pores are arranged in the direction perpendicular to the extrusion of particles (Figure 6a). (2) The deformation of organic pores closer to the edge of organic matter is more obvious, and the roundness of organic pores away from the contact interface between mineral particles and organic matter is better (Figure 6b). (3) The images of 10 nm slices arranged in sequence on a three-dimensional scale (Figure 7a–e) show that long organic pores on both sides of the particles are gradually obvious as the edges of mineral particles become clearer inside the red frame. By reproducing the 3D image of the mineral framework in this scanning area, it can be observed that the mineral particles in the red frame range are obviously raised (Figure 7f), and it is inferred that the mineral particles have an extrusion effect on the nearby organic pores.

Figure 6.
Mineral particles changing shape of organic pores under stress, L203H-7. (a) SEM images; the yellow line indicates the line along the long axes of the organic pores, and the yellow arrow indicates the direction of the mineral particles squeezing the organic matter. (b) Schematic diagram; light gray indicates mineral particles, dark gray indicates organic matter, black indicates organic pores, and yellow arrows indicate the direction in which mineral particles squeeze the organic matter.
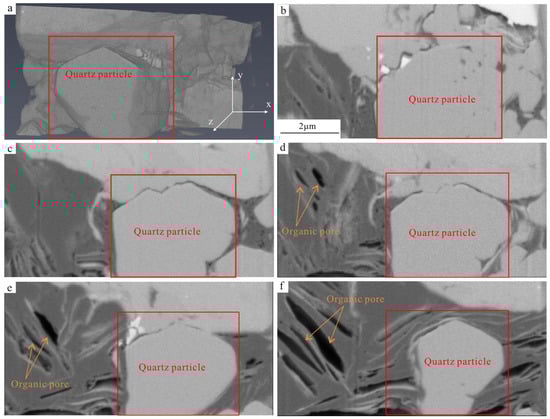
Figure 7.
FIB-SEM images, W1-2. (a) Three-dimensional mineral diorama reconstructed by Avizo; there are prominent raised minerals in the red frame. (b–f) Continuous SEM 2D slice images along the z-axis in the 3D mineral model in (a), i.e., the xy-axis slices shown successively, illustrating the change in organic pore morphology characteristics.
The above arrangement characteristics of organic pores are common in the shale reservoir of the Longmaxi Formation in southern Sichuan. It is believed that under the influence of tectonic compression and mineral recrystallization, mineral particles will squeeze the organic matter around them, resulting in the deformation of organic pores and thus, the pore morphology becomes a long strip with a higher length-width ratio.
5.2. Influence of Reservoir Internal Stress
Based on the deformation characteristics of local organic pores, the morphological differences between organic pores in different stress deformation regions are discussed. In this study, the regions of vein development (Figure 8a) and high-angle fracture development (Figure 8b) were selected as examples of stress concentration regions. The selected veins are calcite and quartz veins with a width of 0.5~1.5 mm. Calcite and quartz were deposited and cemented in the tectonic uplift stage [84]. During the formation and later opening of fractures, the two sides of the area are squeezed, and the compressive stress near the vein is stronger [85], so this represents a stress concentration region. Organic matter with undeveloped pores can be observed in the selected high-angle fracture. In the stage of tectonic uplift, the high-angle fracture continued to open and heal and was filled with fluid [86,87]. During the formation and later opening of the high-angle fracture, its two sides are squeezed, and the extrusion stress near the high-angle fracture becomes stronger, so this also represents a stress concentration region. Similarly, two areas with no large micro-fractures and good development of organic matter and brittle minerals were selected to represent non-stress-concentration regions (Figure 8c,d). The fine SEM scans showed that the organic pores in stress concentration regions such as veins and high-angle fractures were deformed significantly, had poor roundness, and were dominated by long organic pores (Figure 9), while the organic pores in non-stress-concentration regions maintained good shape and roundness, and were dominated by round and elliptical organic pores (Figure 10).
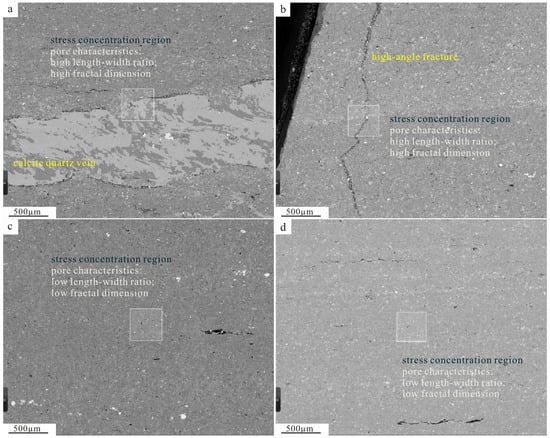
Figure 8.
MAPS images of 500 nm resolution. (a) Regions of vein development, L203H-8; (b) Regions of high-angle fracture development, L203H-9. (c) Non-stress-concentration regions, L203H-5. (d) Non-stress-concentration regions, L203H-7. The area in the white box is the selected fine scanning region with a size of 400 μm × 400 μm.
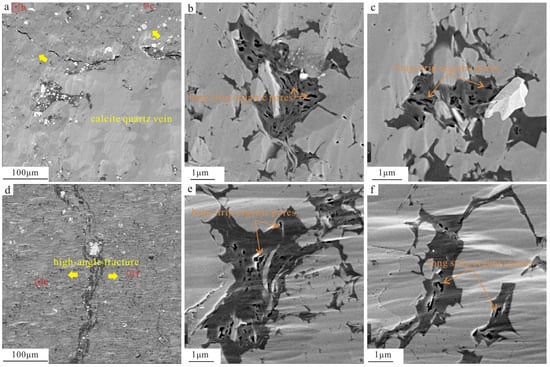
Figure 9.
MAPS images of stress concentration region (4 nm resolution). (a) Enlargement of the white box area (the region of vein development) in Figure 8a, L203-8. The yellow arrow indicates the direction of extrusion when the vein is consolidated or filled. (b,c) Partial enlargements of (a) showing long strip organic pores with DS = 2.962 and 2.989. (d) Enlargement of the white box area (the region of high-angle fracture development) in Figure 8b, L203-9. The yellow arrow indicates the direction of extrusion when the high-angle fracture opens and heals. (e,f) Partial enlargements of (d) showing long strip organic pores with DS = 2.986 and 2.991.

Figure 10.
MAPS images of non-stress-concentration region (4 nm resolution). (a) Enlargement of the white box area (non-stress-concentration region 1) in Figure 8c, L203H-5. (b,c) Partial enlargements of (a) showing suborbicular organic pores with DS = 2.911 and 2.912. (d) Enlargement of the white box area (non-stress-concentration region 2) in Figure 8d, L203H-7. (e,f) Partial enlargements of (d) showing suborbicular organic pores with DS = 2.883 and 2.917.
Since organic pores with small diameters generally have better roundness and less obvious deformation characteristics, they are of little reference significance in a discussion of the cause of stress modification [47,83]. Therefore, the long-axes and short-axes data of 138,437 organic pores with diameters greater than 50 nm were extracted from the four fine scanning areas, and the length-width ratios of organic pores in different regions were quantified (Figure 11a). The results showed that the length-width ratios of organic pores (the long-axes/short-axes of organic pores) are higher in the stress concentration region (near the high-angle fractures and the veins), the deformation of the organic pores is more obvious, and their shape is closer to that of a long strip. Meanwhile, the organic pores in the non-stress-concentration regions have a lower length-width ratio and are more rounded in shape.

Figure 11.
Comparison of deformation characteristics of organic pores in different stress-affected regions in the Long11 sub-member. (a) Length-width ratio of organic pores. (b) D2 calculated by FHH model and DS measured by box-counting method.
We also compared the differences in fractal characteristics between different stress regions. DS values derived from the SEM images using the box-counting and dilation method are given in the captions of Figure 9 and Figure 10. The results also show that the fractal dimensions (D2 and DS) of the samples in the stress concentration regions are higher (Figure 11b), which indicates that the pore structure of the organic pores around the high-angle fractures or veins is more complex. It is speculated that the compressive stress may lead to pore deformation and enhance pore heterogeneity in a single organic matter region.
Therefore, in the vertical variation of the Long11 sub-member shale in L203, high-angle fractures and veins are widely developed in samples (8, 9) at the bottom, resulting in obvious deformation of the organic pores and a complex pore structure, which are manifested as high length-width ratios, a high proportion of long strip pores (Table 2), and a high fractal dimension, while the samples in the middle (5–7) are generally less affected by internal reservoir stress, resulting in higher roundness of the organic pores and a lower fractal dimension. Meanwhile, the upper part of the samples (1–4) has higher clay mineral contents (Figure 2), resulting in weak compaction resistance and lower organic porosity.
5.3. Influence of Tectonic Stress
The morphologies and fractal dimensions of organic pores in different study areas are different (Table 2 and Table 4). In this section, we discuss the influence of tectonic stress on pore deformation in the reservoir. Therefore, we choose to compare samples of undeveloped veins and high-angle fractures in Luzhou (L203-5, 7) with shale samples from Weiyuan to exclude the influence of reservoir internal stress. The results show the following: (1) As pointed out above, strong stress will lead to the extrusion of suborbicular pores into long strip pores. The distribution frequency of long strip pores is higher (Figure 12a) and the ratio of suborbicular pores to long strip pores in Weiyuan is smaller than that of Luzhou (Table 2), indicating a higher proportion of long strip pores in Weiyuan. (2) Based on the type of hysteresis loop found by N2 adsorption, the porosity of Weiyuan shale consists mainly of slit-shaped pores, while that of Luzhou is closer to ink bottle pores (Figure 3), which is consistent with the results of organic pore length-width ratio calculations calculated by MAPS. (3) The fractal dimension D2 calculated by the FHH model and the fractal dimension DS measured by the box-counting method are both higher for Weiyuan (Figure 12b), indicating that the organic pores of Weiyuan are more heterogeneous and the pore structure is more complex. (4) According to the results of CO2 adsorption and N2 adsorption (Table 3), it is found that although the pore volume and specific surface area of micro-, meso-, and macropores of the Weiyuan shale samples are larger, the difference between the meso- and macropores obtained by N2 adsorption experiments is more obvious, while the difference between the micropores calculated by CO2 adsorption experiment is relatively unnoticeable. This means that there may be fewer micropores in shale samples from Weiyuan, which is consistent with the smaller proportion of honeycombed pores calculated by MAPS (Table 2). Previous studies have shown that brittle deformation in natural shale may cause micropores to connect with each other and become mesoporous, thus reducing the number of micropores [44,88]. All the above phenomena indicate that the pore structure of Weiyuan is more complex and the deformation is more obvious.
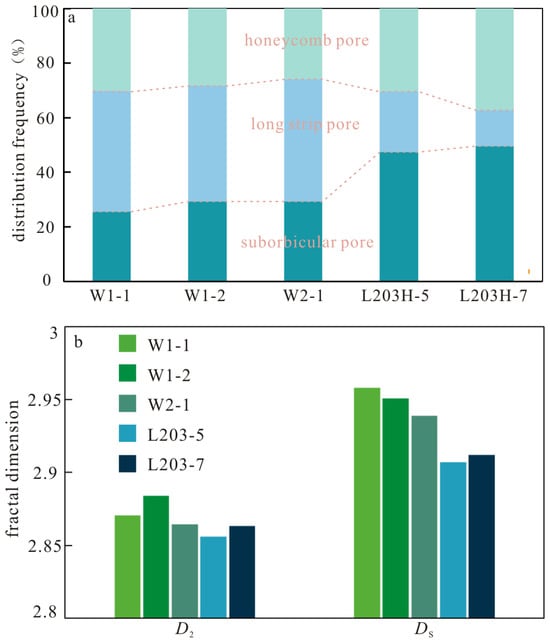
Figure 12.
Comparison of deformation characteristics of organic pores in the Long11 sub-member of Weiyuan and Luzhou shale. (a) The proportion of organic pores with different morphological characteristics. (b) D2 calculated by FHH model and DS measured by box-counting method.
In terms of geological background, the sedimentary environment of the two study areas is similar, both are deep-water plain sedimentary facies, and the lithofacies and mineral composition are roughly the same [89]. Therefore, according to the differences in organic pore morphology between the two study areas, the mechanism of the difference is analyzed in terms of the evolution background of Weiyuan in the southwestern Sichuan depression and Luzhou in the southern Sichuan fold belt.
Burial evolution curves for the Weiyuan and Luzhou blocks show (Figure 13) that after the Silurian Longmaxi Formation was deposited in southern Sichuan, the Chuanzhong uplift was uplifted and eroded as a whole at the end of the Silurian, and its movement intensity gradually weakened from the western, central, and southeast Sichuan regions [90]. Therefore, due to the influence of early uplift and denudation, oil generation in Weiyuan was late and the formation underwent pressure relief, resulting in a low formation pressure coefficient [91,92]. Against the background of late stress extrusion, organic pores in the Weiyuan block with a low-pressure coefficient were also more prone to deformation. Conversely, the Silurian Longmaxi Formation shale in Luzhou enters the oil generation window earlier after being quickly buried and stabilized, and the preservation condition of organic pores is more stable in the later period.
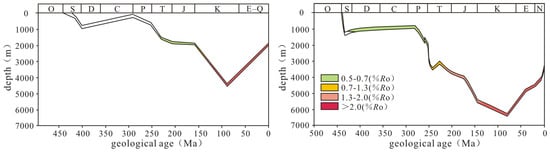
Figure 13.
Burial evolution diagram of Weiyuan and Luzhou blocks [56,91].
During the late Mesozoic to Cenozoic tectonic activities, during the early period of uplift and denudation, the Jiangnan Xuefeng orogenic belt in the Late Jurassic and Early Cretaceous was extruded from the southeastern margin of the basin to the basin, and the Late Cretaceous Qianzhong Uplift pushed northward. In the later period of uplift and denudation, the Daliang Mountain front area in the southwest margin of the Sichuan Basin was subjected to superimposed deformation under the influence of stress in the late Paleogene, and the Qinghai-Tibet Plateau continued to expand eastward from the Cenozoic onward. At this time, Weiyuan was significantly more subjected to stress transformation than Luzhou (Table 6) [53,93]. In the process of tectonic extrusion, the formation pressure coefficient gradually decreases with uplift and denudation, and the formation pressure coefficient is lower when the tectonic compressive stress is stronger in the Weiyuan block. Therefore, the transformation of organic pore morphology by reservoir stress is more obvious, which shows that the organic pores in Weiyuan are more prone to deformation.
Table 6.
Different tectonic backgrounds in Weiyuan and Luzhou blocks.
To sum up, the shale of the Weiyuan Silurian Longmaxi Formation has been more strongly reformed by tectonic activities since its deposition, the pore structure of shale changes more obviously, which is reflected in the fact that micropores in Weiyuan connected to each other to become mesopores or macropores, resulting in a reduction in the number of micropores, and, as macropores are susceptible to compressive deformation under stress, this results in a significant increase in the number of long strip pores. The pore structure in Weiyuan shale, modified by compressive stress, is more complex and shows strong anisotropy, which is expressed in the higher fractal dimension.
5.4. Factors Influencing Fractal Dimensions
Based on the differences in pore characteristics in different intervals and study areas, this study also investigated the relationship between shale composition, pore structure, and fractal dimension to explore pore complexity and the main factors influencing this under a stress modification environment.
A comparison of fractal dimension values for different mineral components in shale shows that the proportions of quartz, clay minerals, and pyrite are not correlated or weakly correlated with fractal dimension (Figure 14). This can be explained from two aspects. Previous studies have shown that organic pores are the most important reservoir space in the overmature shale in the study area [31,94]. Therefore, different minerals such as intergranular pores of quartz and interlayer fractures of clay minerals have little contribution to the pore structure, and thus, have little influence on the fractal characteristics of the pores in the samples. Secondly, the content of mineral components also indicates the sedimentary environment—strawberry pyrite reflects the degree of redox state, and, while clays are often indicative of terrigenous inputs [95,96,97], quartz is relatively complex, and its origin may be the coupling of various geological events [98,99,100]. As the purpose of this study was to explore pore deformation characteristics under different stress environments, samples with a relatively consistent depositional environment were specially selected for comparison to control variables. Therefore, the weak correlation between fractal and mineral composition was within expectation. It is worth mentioning that in the correlation between fractal and mineral content, the negative correlation with clay mineral contents is relatively more obvious, which may be related to the lower brittleness of clay mentioned above, making the pores more susceptible to extrusion deformation.
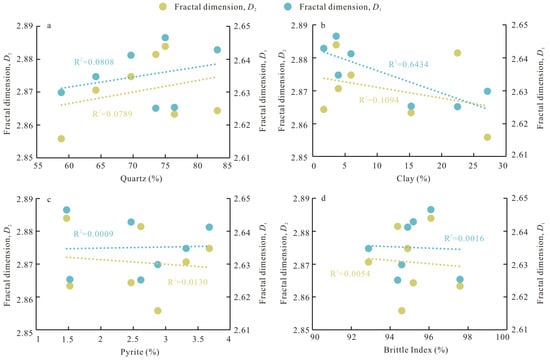
Figure 14.
Correlations between fractal dimension and mineral components. (a) Quartz. (b) Clay minerals. (c) Pyrite. (d) Brittle index.
The correlation between fractal dimension and pore structure parameters is further discussed. As presented in Figure 15, the fractal dimension shows good positive linear relationships with pore volume and specific surface area, thereby indicating that the pore structure becomes more complex and heterogeneous with increasing pore volume and specific surface area. The results are consistent with the results of previous studies on marine shales in South China and North America [27,101,102].
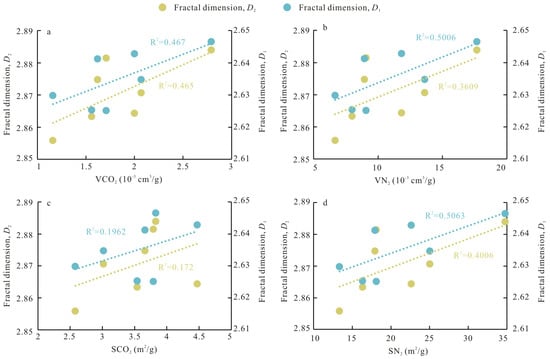
Figure 15.
Correlations between fractal dimension and pore structure parameters. (a) Pore volume calculated by CO2 adsorption. (b) Specific surface area calculated by CO2 adsorption. (c) Pore volume calculated by N2 adsorption. (d) Specific surface area calculated by N2 adsorption.
As illustrated in Figure 16, the correlation between the proportion of different pore types and the fractal dimension is completely different: the correlation between suborbicular pores and fractal dimension is negative, long strip pores are positively correlated, and the correlation between honeycomb pores and D2 is weak. It should be noted that since the abscissa in the graph shows the relative content of pores with different morphology features, which represents the proportion of such pores in the sample, the results of correlation do not reflect the long strip pores have better fractal characteristics than the suborbicular pores. According to the data, the fractal dimension of the suborbicular pores and long strip pores is highest when the proportion is close to 33%, which indicates that the fractal dimension of pores is higher when all kinds of pores in the sample are developed. This result can be interpreted as indicating that the development of different pore morphology types represents stronger heterogeneity [71]. From the point of extrusion stress, a sample with a higher proportion of long strip pores may be the result of stronger stress modification, and brittle or ductile deformation under stress will enhance the complexity of pore structure, resulting in an increase in fractal dimension [103]. The weak correlation between honeycomb pores and fractal dimension may be due to their limited contribution to pore structure. In addition, pores with a small diameter are not significantly affected by stress modification [49,103].
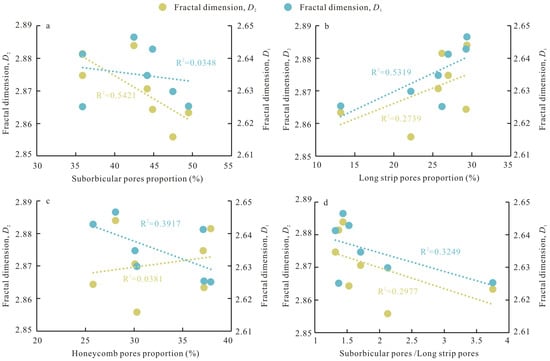
Figure 16.
Correlations between fractal dimension and proportion of different pore types. (a) Suborbicular pore. (b) Long strip pore. (c) Honeycomb pore. (d) The ratio of suborbicular pores and long strip pores.
5.5. Storage and Permeability Performance of Different Pores
The differences in the storage and permeability performance of various pores were further clarified by FIB-SEM. Honeycomb pores are formed when organic matter reaches a certain maturity and there is sufficient gas expansion force [104]. The aperture of the honeycomb pores is small and the distribution is concentrated, generally in the 2 to 30 nm range, with obvious peaks (Figure 17a,b). The fractal dimension of honeycomb pores calculated by the box-counting method based on SEM images is the lowest, with an average value of 2.922. The data show that low values of the coordination number of pore throat account for a high proportion, while high values are rare, so the connectivity of the honeycomb pores is poor. Moreover, by comparing the pore data in Figure 17a,b, it is found that the connectivity of honeycomb pores gradually becomes better with an increase in aperture size.
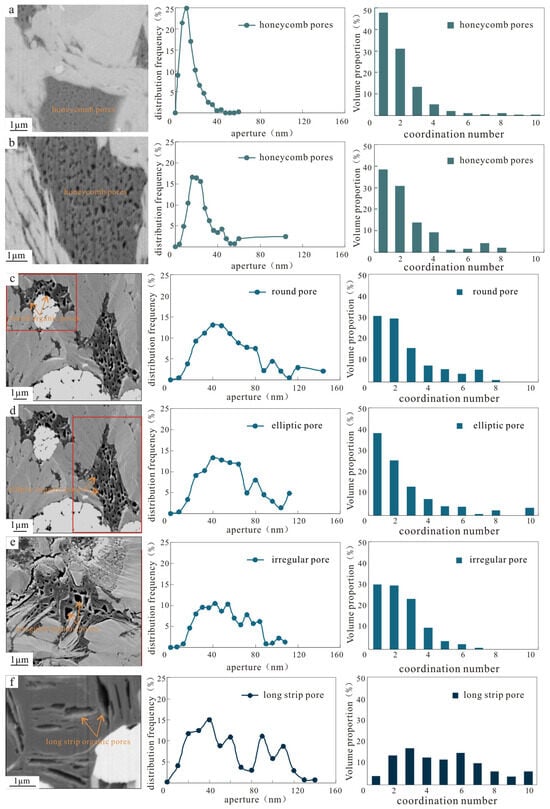
Figure 17.
Aperture size distribution and coordination number spread of organic pores with different morphological characteristics. (a) Honeycomb pores with small aperture size, W1-1. (b) Honeycomb pores with large aperture size, W1-2. (c) Round pores in the red box, L203H-7. (d) Elliptical pores in the red box, L203H-7. (e) Diamond (irregular) pores, L203H-7. (f) Long strip organic pores, W1-1.
Suborbicular pores include round pores with good preservation conditions and elliptical and diamond (irregular) pores that are not obvious in later reconstruction. Suborbicular pores are usually formed by the communication and aggregation of honeycomb pores [37,105] and are less affected by the internal stress of the reservoir, and thus, can maintain a good roundness and morphology. They are characterized by varying aperture sizes, distributed in the 20 to 80 nm range, no obvious peaks, and good overall roundness (Figure 17c–e). The fractal dimension of suborbicular pores calculated by the box-counting method based on SEM images is medium, with an average value of 2.949. The data show that the coordination number of round pores is obviously higher than that of honeycomb pores, and the proportions of low and high coordination numbers increase slightly when round pores are transformed into ellipses. When the round pores are transformed into angular and irregular pores, the overall connectivity is slightly reduced. In general, there was little difference between the connectivity of suborbicular pores of different shapes, and the overall connectivity was better than that of honeycomb pores.
The long strip pores are the result of organic pores experiencing large deformations under the influence of strong stress. The aperture size distribution range of long strip organic pores is large, and it is distributed in the 20 to 120 nm range without an obvious peak value. The fractal dimension of long strip pores calculated by the box-counting method based on SEM images is the highest, with an average value of 2.972. The data show that the pore throat coordination number of long strip pores was significantly higher than that of pores of other morphologies, so their connectivity was the best (Figure 17f). It is speculated that with an increase in extrusion, the deformation of organic matter is accompanied by partial shrinkage fractures [106], and, therefore, more organic pores become connected leading to an increase in coordination number.
In conclusion, the honeycomb pore is a type of pore that is in the early stage of thermal evolution or has not undergone significant stress modification and has a small aperture size, low fractal dimension, and poor connectivity and storage-permeability performance. With the evolution process of hydrocarbon generation and tectonic extrusion, the honeycomb pores are gradually connected into suborbicular pores with complex fractal characteristics, and the larger the pore aperture, the better the connectivity and storage-permeability performance. To a certain extent with an increase in aperture size, the fluid pressure decreases and the transformation effect of strong reservoir extrusion on organic pores gradually becomes obvious. In areas with strong local stress, the organic pores with high roundness and large pore diameter are transformed into long strips by stress, and long strip pores have the highest fractal dimension, a complex pore structure, and the best connectivity.
6. Conclusions
In this study, the fractal dimension and deformation characteristics of organic pores under the influence of different stress concentrations were studied in the Weiyuan block in the southwestern Sichuan depression and the Luzhou block in the southern Sichuan fold belt, and the storage and permeability of organic pores with different morphologies were further discussed. The main conclusions of this study are as follows:
(1) In the vertical variation of Long11 sub-member shale in L203, the brittle mineral framework has a positive impact on the preservation of organic pores. The upper interval of the core samples has a low brittleness index and low organic porosity. The veins or high-angle fractures in the lower interval are more developed, and the local stress extrusion is stronger. The organic pores deformed under the protection of a rigid mineral framework, which manifested as the development of long strip pores and a high fractal dimension. The middle research interval was less affected by the internal stress of the reservoir, resulting in the higher roundness of the organic pores and a lower fractal dimension.
(2) The morphological characteristics of organic pores in the Weiyuan and Luzhou blocks are noticeably different. The N2 adsorption hysteresis loop of Weiyuan shale is close to type B, indicating that slit-shaped pores are dominant, the proportion of- micropores is relatively low, the macropores are mostly long strip pores, and the fractal dimension is higher. However, the N2 adsorption hysteresis loop of Luzhou shale is close to type F, showing the development of ink bottle pores with a relatively high proportion of micropores, and the morphology of macropores is mostly pores with a low fractal dimension.
(3) The factors influencing the fractal and morphology characteristics of the organic pores in the two study areas have been clarified. The formation pressure coefficient of Weiyuan is low, and the tectonic stress has been strong since the Cenozoic. Therefore, the deformation of organic pores is obvious, mostly long strip organic pores have developed and the pore structure is complex. The pressure coefficient of the Luzhou block is high, the compressive stress is weak in the later stage, and suborbicular organic pores have developed.
(4) There are differences in the storage and permeability properties of different forms of organic pores. The morphology and distribution of honeycomb pores are uniform, the fractal dimension is the lowest, and the connectivity is the worst; suborbicular pores have larger pore diameters and medium fractal dimension and connectivity; and long strip pores formed by stress transformation have a large pore aperture size distribution range, strong pore heterogeneity, the highest fractal dimensions, and the best connectivity.
Author Contributions
Conceptualization, D.H. and Y.J.; methodology, J.Z.; software, C.W.; validation, Y.J. and B.M.; formal analysis, Y.W.; investigation, Y.W.; resources, W.L.; data curation, D.H. and Y.J.; writing—original draft preparation, Y.W.; writing—review and editing, Y.W.; visualization, Y.W.; supervision, D.H.; project administration, D.H.; funding acquisition, W.L. All authors have read and agreed to the published version of the manuscript.
Funding
This research was funded by the National Natural Science Foundation of China, grant number 42072121, and 42302175.
Data Availability Statement
The original contributions presented in the study are included in the article, further inquiries can be directed to the corresponding authors.
Conflicts of Interest
The authors declare no conflicts of interest.
References
- Vengosh, A.; Jackson, R.B.; Warner, N.; Darrah, T.H.; Kondash, A. A Critical Review of the Risks to Water Resources from Unconventional Shale Gas Development and Hydraulic Fracturing in the United States. Environ. Sci. Technol. 2014, 48, 8334–8348. [Google Scholar] [CrossRef] [PubMed]
- Zou, C.N.; Yang, Z.; Cui, J.W.; Zhu, R.K.; Hou, L.H.; Tao, S.Z.; Yuan, X.J.; Wu, S.T.; Lin, S.H.; Wang, L.; et al. Formation mechanism, geological characteristics and development strategy of nonmarine shale oil in China. Pet. Explor. Dev. 2013, 40, 15–27. [Google Scholar] [CrossRef]
- Wang, H.; Chen, L.; Qu, Z.; Yin, Y.; Kang, Q.; Yu, B.; Tao, W.-Q. Modeling of multi-scale transport phenomena in shale gas production—A critical review. Appl. Energy 2020, 262, 114575. [Google Scholar] [CrossRef]
- Hu, Q.; Ewing, R.P.; Rowe, H.D. Low nanopore connectivity limits gas production in Barnett formation. J. Geophys. Res. Solid Earth 2015, 120, 8073–8087. [Google Scholar] [CrossRef]
- Cardott, B.J.; Landis, C.R.; Curtis, M.E. Post-oil solid bitumen network in the Woodford Shale, USA—A potential primary migration pathway. Int. J. Coal Geol. 2015, 139, 106–113. [Google Scholar] [CrossRef]
- Gou, Q.; Xu, S. Quantitative evaluation of free gas and adsorbed gas content of Wufeng-Longmaxi shales in the Jiaoshiba area, Sichuan Basin, China. Adv. Geo-Energy Res. 2019, 3, 258–267. [Google Scholar] [CrossRef]
- Jia, Y.Q.; Han, D.L.; Zhang, J.Z.; Wang, C.C.; Lin, W.; Ren, X.H.; Yang, C.Y.; Chang, L.C. Differences in Pore-forming Efficiency among Organic Macerals and Its Restriction against Reservoir Quality: A Case Study Based on the Marine Shale Reservoir in the Longmaxi Formation, Southern Sichuan Basin, China. Lithosphere 2021, 2021, 2700912. [Google Scholar] [CrossRef]
- Tian, H.; Pan, L.; Zhang, T.; Xiao, X.; Meng, Z.; Huang, B. Pore characterization of organic-rich Lower Cambrian shales in Qiannan Depression of Guizhou Province, Southwestern China. Mar. Pet. Geol. 2015, 62, 28–43. [Google Scholar] [CrossRef]
- Loucks, R.G.; Reed, R.M.; Ruppel, S.C.; Jarvie, D.M. Morphology, Genesis, and Distribution of Nanometer-Scale Pores in Siliceous Mudstones of the Mississippian Barnett Shale. J. Sediment. Res. 2009, 79, 848–861. [Google Scholar] [CrossRef]
- Cao, T.; Song, Z.; Wang, S.; Cao, X.; Li, Y.; Xia, J. Characterizing the pore structure in the Silurian and Permian shales of the Sichuan Basin, China. Mar. Pet. Geol. 2015, 61, 140–150. [Google Scholar] [CrossRef]
- Curtis, M.E.; Cardott, B.J.; Sondergeld, C.H.; Rai, C.S. Development of organic porosity in the Woodford Shale with increasing thermal maturity. Int. J. Coal Geol. 2012, 103, 26–31. [Google Scholar] [CrossRef]
- Loucks, R.G.; Reed, R.M.; Ruppel, S.C.; Hammes, U. Spectrum of pore types and networks in mudrocks and a descriptive classification for matrix-related mudrock pores. AAPG Bull. 2012, 96, 1071–1098. [Google Scholar] [CrossRef]
- Ross, D.J.K.; Marc Bustin, R. The importance of shale composition and pore structure upon gas storage potential of shale gas reservoirs. Mar. Pet. Geol. 2009, 26, 916–927. [Google Scholar] [CrossRef]
- Dewers, T.A.; Heath, J.; Ewy, R.; Duranti, L. Three-dimensional pore networks and transport properties of a shale gas formation determined from focused ion beam serial imaging. Int. J. Oil Gas Coal Technol. 2012, 5, 229–248. [Google Scholar] [CrossRef]
- Jiang, T.; Jin, Z.; Hu, Z.; Du, W.; Liu, Z.; Zhao, J.; Zhang, K. Three-Dimensional Morphology and Connectivity of Organic Pores in Shale from the Wufeng and Longmaxi Formations at the Southeast Sichuan Basin in China. Geofluids 2021, 2021, 5579169. [Google Scholar] [CrossRef]
- Jiang, X.; Deng, S.; Li, H.; Zuo, H. Characterization of 3D pore nanostructure and stress-dependent permeability of organic-rich shales in northern Guizhou Depression, China. J. Rock Mech. Geotech. Eng. 2022, 14, 407–422. [Google Scholar] [CrossRef]
- Mandelbrot, B.B. Stochastic models for the Earth’s relief, the shape and the fractal dimension of the coastlines, and the number-area rule for islands. Proc. Natl. Acad. Sci. USA 1975, 72, 3825–3828. [Google Scholar] [CrossRef]
- Sakhaee-Pour, A.; Li, W. Fractal dimensions of shale. J. Nat. Gas Sci. Eng. 2016, 30, 578–582. [Google Scholar] [CrossRef]
- Katz, A.J.; Thompson, A.H. Fractal sandstone pores: Implications for conductivity and pore formation. Phys. Rev. Lett. 1985, 54, 1325–1328. [Google Scholar] [CrossRef]
- Yuan, W.; Pan, Z.; Li, X.; Yang, Y.; Zhao, C.; Connell, L.D.; Li, S.; He, J. Experimental study and modelling of methane adsorption and diffusion in shale. Fuel 2014, 117, 509–519. [Google Scholar] [CrossRef]
- Zhan, H.M.; Li, X.Z.; Hu, Z.M.; Duan, X.G.; Wu, W.; Guo, W.; Lin, W. Fractal Characteristics of Deep Shales in Southern China by Small-Angle Neutron Scattering and Low-Pressure Nitrogen Adsorption. Fractal Fract. 2022, 6, 484. [Google Scholar] [CrossRef]
- Yang, R.; He, S.; Yi, J.; Hu, Q. Nano-scale pore structure and fractal dimension of organic-rich Wufeng-Longmaxi shale from Jiaoshiba area, Sichuan Basin: Investigations using FE-SEM, gas adsorption and helium pycnometry. Mar. Pet. Geol. 2016, 70, 27–45. [Google Scholar] [CrossRef]
- Yao, Y.; Liu, D.; Tang, D.; Tang, S.; Huang, W. Fractal characterization of adsorption-pores of coals from North China: An investigation on CH4 adsorption capacity of coals. Int. J. Coal Geol. 2008, 73, 27–42. [Google Scholar] [CrossRef]
- Shao, X.; Pang, X.; Li, Q.; Wang, P.; Chen, D.; Shen, W.; Zhao, Z. Pore structure and fractal characteristics of organic-rich shales: A case study of the lower Silurian Longmaxi shales in the Sichuan Basin, SW China. Mar. Pet. Geol. 2017, 80, 192–202. [Google Scholar] [CrossRef]
- Tang, X.; Zheng, F.; Liang, G.; Ma, Z.; Zhang, J.; Wang, Y.; Zhang, T. Fractal characterization of pore structure in Cambrian Niutitang shale in northern Guizhou, southwestern China. Earth Sci. Front. 2023, 30, 110–123. [Google Scholar] [CrossRef]
- Zhang, Q.; Dong, Y.H.; Tong, S.Q. Pore-Type-Dependent Fractal Features of Shales and Implications on Permeability. Fractal Fract. 2023, 7, 803. [Google Scholar] [CrossRef]
- Zhang, J.; Li, X.; Xie, Z.; Li, J.; Zhang, X.; Sun, K.; Wang, F. Characterization of microscopic pore types and structures in marine shale: Examples from the Upper Permian Dalong formation, Northern Sichuan Basin, South China. J. Nat. Gas Sci. Eng. 2018, 59, 326–342. [Google Scholar] [CrossRef]
- Guan, Q.Z.; Dong, D.Z.; Wang, S.F.; Huang, J.L.; Wang, Y.M.; Lu, H.; Zhang, C.C. Preliminary study on shale gas microreservoir characteristics of the Lower Silurian Longmaxi Formation in the southern Sichuan Basin, China. J. Nat. Gas Sci. Eng. 2016, 31, 382–395. [Google Scholar] [CrossRef]
- Wang, Y.L.; Jia, Y.Q.; Wang, C.C.; Lin, W.; Zhang, J.Z.; Han, D.L.; Ma, B.Y.; Wang, H.C. Characteristics and Geological Significance of Organic Matter Veins in Shale Reservoir: A Case Study of the Silurian Longmaxi Formation in Luzhou Area, Sichuan Basin. Minerals 2023, 13, 1080. [Google Scholar] [CrossRef]
- Jia, Y.; Liu, Z.; Ren, X.; Zhou, Y.; Zheng, A.; Zhang, J.; Han, D. Organic Matter Type Differentiation Process and Main Control Mechanism: Case study of the Silurian Longmaxi Formation shale reservoir in Weiyuan area. Acta Sedimentol. Sin. 2021, 39, 341–352. [Google Scholar] [CrossRef]
- Teng, G.; Lu, L.; Yu, L.; Zhang, W.; Pan, A.; Shen, B.; Wang, Y.; Yang, Y.; Gao, Z. Formation, preservation and connectivity control of organic pores in shale. Pet. Explor. Dev. 2021, 48, 687–699. [Google Scholar] [CrossRef]
- Chen, J.; Xiao, X. Evolution of nanoporosity in organic-rich shales during thermal maturation. Fuel 2014, 129, 173–181. [Google Scholar] [CrossRef]
- Gai, H.; Tian, H.; Cheng, P.; He, C.; Wu, Z.; Ji, S.; Xiao, X. Characteristics of molecular nitrogen generation from overmature black shales in South China: Preliminary implications from pyrolysis experiments. Mar. Pet. Geol. 2020, 120, 104527. [Google Scholar] [CrossRef]
- Shi, X.; Wu, W.; Xu, L.; Yin, Y.; Yang, Y.; Liu, J.; Yang, X.; Li, Y.; Wu, Q.; Zhong, K.; et al. Thermal Maturity Constraint Effect and Development Model of Shale Pore Structure: A Case Study of Longmaxi Formation Shale in Southern Sichuan Basin, China. Minerals 2024, 14, 163. [Google Scholar] [CrossRef]
- Yuan, G.; Jin, Z.; Cao, Y.; Schulz, H.M.; Gluyas, J.; Liu, K.; He, X.; Wang, Y. Microdroplets initiate organic-inorganic interactions and mass transfer in thermal hydrous geosystems. Nat. Commun. 2024, 15, 4960. [Google Scholar] [CrossRef] [PubMed]
- Gao, Z.; Fan, Y.; Xuan, Q.; Zheng, G. A review of shale pore structure evolution characteristics with increasing thermal maturities. Adv. Geo-Energy Res. 2020, 4, 247–259. [Google Scholar] [CrossRef]
- Liu, B.; Mastalerz, M.; Schieber, J. SEM petrography of dispersed organic matter in black shales: A review. Earth-Sci. Rev. 2022, 224, 103874. [Google Scholar] [CrossRef]
- Shan, C.a.; Shi, Y.; Liang, X.; Zhang, L.; Wang, G.; Jiang, L.; Zou, C.; He, F.; Mei, J. Diagenetic characteristics and microscopic pore evolution of deep shale gas reservoirs in Longmaxi Formation, Southeastern Sichuan basin, China. Unconv. Resour. 2024, 4, 100090. [Google Scholar] [CrossRef]
- Khitab, U.; Umar, M.; Jamil, M. Microfacies, diagenesis and hydrocarbon potential of Eocene carbonate strata in Pakistan. Carbonates Evaporites 2020, 35, 70. [Google Scholar] [CrossRef]
- Wang, R.Y.; Gu, Y.; Ding, W.L.; Gong, D.J.; Yin, S.; Wang, X.H.; Zhou, X.H.; Li, A.; Xiao, Z.K.; Cui, Z.X. Characteristics and dominant controlling factors of organic-rich marine shales with high thermal maturity: A case study of the Lower Cambrian Niutitang Formation in the Cen’gong block, southern China. J. Nat. Gas Sci. Eng. 2016, 33, 81–96. [Google Scholar] [CrossRef]
- Nie, H.; Jin, Z.; Zhang, J. Characteristics of three organic matter pore types in the Wufeng-Longmaxi Shale of the Sichuan Basin, Southwest China. Sci. Rep. 2018, 8, 7014. [Google Scholar] [CrossRef] [PubMed]
- Guo, T. Evaluation of Highly Thermally Mature Shale-Gas Reservoirs in Complex Structural Parts of the Sichuan Basin. J. Earth Sci. 2013, 24, 863–873. [Google Scholar] [CrossRef]
- Guo, X.; Hu, D.; Li, Y.; Wei, Z.; Wei, X.; Liu, Z. Geological factors controlling shale gas enrichment and high production in Fuling shale gas field. Pet. Explor. Dev. 2017, 44, 513–523. [Google Scholar] [CrossRef]
- Li, X.; Zhu, H.; Zhang, K.; Li, Z.; Yu, Y.; Feng, X.; Wang, Z. Pore characteristics and pore structure deformation evolution of ductile deformed shales in the Wufeng-Longmaxi Formation, southern China. Mar. Pet. Geol. 2021, 127, 104992. [Google Scholar] [CrossRef]
- Liang, M.; Wang, Z.; Gao, L.; Li, C.; Li, H. Evolution of pore structure in gas shale related to structural deformation. Fuel 2017, 197, 310–319. [Google Scholar] [CrossRef]
- Ma, Y.; Zhong, N.; Li, D.; Pan, Z.; Cheng, L.; Liu, K. Organic matter/clay mineral intergranular pores in the Lower Cambrian Lujiaping Shale in the north-eastern part of the upper Yangtze area, China: A possible microscopic mechanism for gas preservation. Int. J. Coal Geol. 2015, 137, 38–54. [Google Scholar] [CrossRef]
- Zhu, H.; Ju, Y.; Huang, C.; Han, K.; Qi, Y.; Shi, M.; Yu, K.; Feng, H.; Li, W.; Ju, L.; et al. Pore structure variations across structural deformation of Silurian Longmaxi Shale: An example from the Chuandong Thrust-Fold Belt. Fuel 2019, 241, 914–932. [Google Scholar] [CrossRef]
- Fu, Y.; Jiang, Y.; Dong, D.; Hu, Q.; Lei, Z.; Peng, H.; Gu, Y.; Ma, S.; Wang, Z.; Yin, X.; et al. Microscopic pore-fracture configuration and gas-filled mechanism of shale reservoirs in the western Chongqing area, Sichuan Basin, China. Pet. Explor. Dev. 2021, 48, 916–927. [Google Scholar] [CrossRef]
- Cheng, G.; Jiang, B.; Li, F.; Li, M.; Wu, C. Evolution Mechanism of Pore Structures of Organic-Rich Shale Under Tectonic Deformation: A Comparative Study between Whole Rock and Kerogen Samples. Nat. Resour. Res. 2023, 33, 263–297. [Google Scholar] [CrossRef]
- Shang, F.; Zhu, Y.; Gao, H.; Wang, Y.; Liu, R. Relationship between Tectonism and Composition and Pore Characteristics of Shale Reservoirs. Geofluids 2020, 2020, 9426586. [Google Scholar] [CrossRef]
- Liu, S.G.; Deng, B.; Li, Z.W.; Sun, W. Architecture of basin-mountain systems and their influences on gas distribution: A case study from the Sichuan basin, South China. J. Asian Earth Sci. 2012, 47, 204–215. [Google Scholar] [CrossRef]
- Zhang, G.; Guo, A.; Wang, Y.; Li, S.; Dong, Y.; Liu, S.; He, D.; Cheng, S.; Lu, R.; Yao, A. Tectonics of South China continent and its implications. Sci. China Earth Sci. 2013, 56, 1804–1828. [Google Scholar] [CrossRef]
- Liang, X.; Xu, J.; Wang, Y.; Fang, X.; Zhao, L.; Wu, Y.; Deng, B. The shale gas enrichment factors of Longmaxi Formation under gradient basin-mountain boundary in South Sichuan Basin: Tectono-depositional differentiation and discrepant evolution. Chin. J. Geol. 2021, 56, 60–81. [Google Scholar]
- Yang, R.; He, S.; Wang, X.; Hu, Q.; Hu, D.; Yi, J. Paleo-ocean redox environments of the Upper Ordovician Wufeng and the first member in lower Silurian Longmaxi formations in the Jiaoshiba area, Sichuan Basin. Can. J. Earth Sci. 2016, 53, 426–440. [Google Scholar] [CrossRef]
- Nie, H.K.; He, Z.L.; Wang, R.Y.; Zhang, G.R.; Chen, Q.; Li, D.H.; Lu, Z.Y.; Sun, C.X. Temperature and origin of fluid inclusions in shale veins of Wufeng?Longmaxi Formations, Sichuan Basin, south China: Implications for shale gas preservation and enrichment. J. Pet. Sci. Eng. 2020, 193, 18. [Google Scholar] [CrossRef]
- Wu, J.; Chen, X.; Liu, W.; Wu, W.; Gao, Y.; Luo, C.; Deng, B.; Zhou, Z. Fluid activity and pressure evolution process of Wufeng-Longmaxi shales, southern Sichuan Basin. Earth Sci. J. China Univ. Geosci. 2022, 47, 518–531. [Google Scholar] [CrossRef]
- Dong, M.; Guo, W.; Zhang, L.; Wu, Z.; Ma, L.; Dong, H.; Feng, X.; Yang, Y. Characteristics of paleotectonic stress field and fractures of Wufeng-Longmaxi formations in Luzhou area, southern Sichuan Basin. Lithol. Reserv. 2022, 34, 43–51. [Google Scholar] [CrossRef]
- Huang, H.Y.; He, D.F.; Li, Y.Q.; Li, J.; Zhang, L. Silurian tectonic-sedimentary setting and basin evolution in the Sichuan area, southwest China: Implications for palaeogeographic reconstructions. Mar. Pet. Geol. 2018, 92, 403–423. [Google Scholar] [CrossRef]
- Yan, H.; Peng, X.; Xia, Q.; Xu, W.; Luo, W.; Li, X.; Zhang, L.; Zhu, Q.; Zhu, X.; Liu, X. Distribution features of ancient karst landform in the fourth Member of the Dengying Formation in the Gaoshiti-Moxi region and its guiding significance for gas reservoir development. Acta Pet. Sin. 2020, 41, 658–670+752. [Google Scholar] [CrossRef]
- Ma, X.H.; Xie, J.; Yong, R.; Zhu, Y.Q. Geological characteristics and high production control factors of shale gas reservoirs in Silurian Longmaxi Formation, southern Sichuan Basin, SW China. Pet. Explor. Dev. 2020, 47, 901–915. [Google Scholar] [CrossRef]
- Qiu, Z.; Tao, H.; Lu, B.; Chen, Z.; Wu, S.; Liu, H.; Qiu, J. Controlling Factors on Organic Matter Accumulation of Marine Shale across the Ordovician-Silurian Transition in South China: Constraints from Trace-Element Geochemistry. J. Earth Sci. 2021, 32, 887–900. [Google Scholar] [CrossRef]
- Yang, X.R.; Yan, D.T.; Zhang, B.; Zhang, L.W.; Wei, X.S.; Li, T.; Zhang, J.F.; She, X.H. The impact of volcanic activity on the deposition of organic-rich shales: Evidence from carbon isotope and geochemical compositions. Mar. Pet. Geol. 2021, 128, 14. [Google Scholar] [CrossRef]
- Nie, H.; Bao, S.; Gao, B.; Bian, R.; Zhang, P.; Wu, X.; Ye, X.; Chen, X. A study of shale gas preservation conditiongs for the Lower Paleozoic in Sichuan Basin and its periphery. Earth Sci. Front. 2012, 19, 280–294. [Google Scholar]
- Ma, Y.; Cai, X.; Zhao, P. China’s shale gas exploration and development: Understanding and practice. Pet. Explor. Dev. 2018, 45, 589–603. [Google Scholar] [CrossRef]
- Saif, T.; Lin, Q.; Butcher, A.R.; Bijeljic, B.; Blunt, M.J. Multi-scale multi-dimensional microstructure imaging of oil shale pyrolysis using X-ray micro-tomography, automated ultra-high resolution SEM, MAPS Mineralogy and FIB-SEM. Appl. Energy 2017, 202, 628–647. [Google Scholar] [CrossRef]
- GB/T 20726-2015; Microbeam Analysis—Selected Instrumental Performance Parameters for the Specification and Checking of Energy Dispersive X-ray Spectrometers for Use in Electron Probe Microanalysis. Standardization Administration of China: Beijing, China, 2015.
- Ma, B.; Hu, Q.; Yang, S.; Zhang, T.; Qiao, H.; Meng, M.; Zhu, X.; Sun, X. Pore structure typing and fractal characteristics of lacustrine shale from Kongdian Formation in East China. J. Nat. Gas Sci. Eng. 2021, 85, 103709. [Google Scholar] [CrossRef]
- Zhang, J.; Li, X.; Wei, Q.; Sun, K.; Zhang, G.; Wang, F. Characterization of Full-Sized Pore Structure and Fractal Characteristics of Marine–Continental Transitional Longtan Formation Shale of Sichuan Basin, South China. Energy Fuels 2017, 31, 10490–10504. [Google Scholar] [CrossRef]
- Lin, W.; Zhao, X.; Li, M.; Zhuang, Y. Pore Structure Characterization and Fractal Characteristics of Tight Limestone Based on Low-Temperature Nitrogen Adsorption and Nuclear Magnetic Resonance. Fractal Fract. 2024, 8, 371. [Google Scholar] [CrossRef]
- Dathe, A.; Eins, S.; Niemeyer, J.; Gerold, G. The surface fractal dimension of the soil–pore interface as measured by image analysis. Geoderma 2001, 103, 203–229. [Google Scholar] [CrossRef]
- Peng, N.; He, S.; Hu, Q.; Zhang, B.; He, X.; Zhai, G.; He, C.; Yang, R. Organic nanopore structure and fractal characteristics of Wufeng and lower member of Longmaxi shales in southeastern Sichuan, China. Mar. Pet. Geol. 2019, 103, 456–472. [Google Scholar] [CrossRef]
- Zou, X.; Li, X.; Wang, Y.; Zhang, J.; Zhao, P. Reservoir characteristics and gas content of Wufeng-Longmaxi Formations deep shale in southern Sichuan Basin. Nat. Gas Geosci. 2022, 33, 654–665. [Google Scholar] [CrossRef]
- Wang, R.; Hu, Z.; Zhou, T.; Bao, H.; Wu, J.; Du, W.; He, J.; Wang, P.; Chen, Q. Characteristics of fractures and their significance for reservoirs in Wufeng-Longmaxi shale, Sichuan Basin and its periphery. Oil Gas Geol. 2021, 42, 1295–1306. [Google Scholar] [CrossRef]
- Thommes, M.; Kaneko, K.; Neimark, A.V.; Olivier, J.P.; Rodriguez-Reinoso, F.; Rouquerol, J.; Sing, K.S.W. Physisorption of gases, with special reference to the evaluation of surface area and pore size distribution (IUPAC Technical Report). Pure Appl. Chem. 2015, 87, 1051–1069. [Google Scholar] [CrossRef]
- Sing, K.S.W. Reporting physisorption data for gas/solid systems with special reference to the determination of surface area and porosity (Recommendations 1984). Pure Appl. Chem. 1985, 57, 603–619. [Google Scholar] [CrossRef]
- Labani, M.M.; Rezaee, R.; Saeedi, A.; Hinai, A.A. Evaluation of pore size spectrum of gas shale reservoirs using low pressure nitrogen adsorption, gas expansion and mercury porosimetry: A case study from the Perth and Canning Basins, Western Australia. J. Pet. Sci. Eng. 2013, 112, 7–16. [Google Scholar] [CrossRef]
- Barrett, E.P.; Joyner, L.G.; Halenda, P.P. The Determination of Pore Volume and Area Distributions in Porous Substances. I. Computations from Nitrogen Isotherms. J. Am. Chem. Soc. 1951, 73, 373–380. [Google Scholar] [CrossRef]
- Klimakow, M.; Klobes, P.; Rademann, K.; Emmerling, F. Characterization of mechanochemically synthesized MOFs. Microporous Mesoporous Mater. 2012, 154, 113–118. [Google Scholar] [CrossRef]
- Hazra, B.; Wood, D.A.; Vishal, V.; Varma, A.K.; Sakha, D.; Singh, A.K. Porosity controls and fractal disposition of organic-rich Permian shales using low-pressure adsorption techniques. Fuel 2018, 220, 837–848. [Google Scholar] [CrossRef]
- Ning, S.; Xia, P.; Hao, F.; Tian, J.; Fu, Y.; Wang, K. Pore Fractal Characteristics between Marine and Marine–Continental Transitional Black Shales: A Case Study of Niutitang Formation and Longtan Formation. Fractal Fract. 2024, 8, 288. [Google Scholar] [CrossRef]
- Zou, J.; Chen, W.; Yang, D.; Yuan, J.; Jiao, Y.-Y. Fractal characteristics of the anisotropic microstructure and pore distribution of low-rank coal. AAPG Bull. 2019, 103, 1297–1320. [Google Scholar] [CrossRef]
- Milliken, K.L.; Curtis, M.E. Imaging pores in sedimentary rocks: Foundation of porosity prediction. Mar. Pet. Geol. 2016, 73, 590–608. [Google Scholar] [CrossRef]
- Wang, G. Deformation of organic matter and its effect on pores in mud rocks. AAPG Bull. 2020, 104, 21–36. [Google Scholar] [CrossRef]
- Yao, C.; Fu, H.; Ma, Y.; Yan, D.; Wang, H.; Li, Y.; Wang, J. Development characteristics of deep shale fractured veins and vein forming fluid activities in Luzhou block. Earth Sci. 2022, 47, 1684–1693. [Google Scholar]
- Shovkun, I.; Espinoza, D.N. Geomechanical implications of dissolution of mineralized natural fractures in shale formations. J. Pet. Sci. Eng. 2018, 160, 555–564. [Google Scholar] [CrossRef]
- Wu, Q.; Han, D.; Zhang, J.; Wang, C.; Ren, X.; Lin, Z.; Su, M.; Zhu, Y.; Zhang, J. Influence of particle size effect on microfracture development in shale reservoir: A case study of the Silurian Longmaxi Formation shale reservoir in Weiyuan area. J. Cent. South Univ. (Sci. Technol.) 2022, 53, 3603–3614. [Google Scholar]
- Pan, Z.; Liu, D.; Huang, Y.; Zhenxue, J.; Song, Y.; Guo, J.; Li, C. Paleotemperature and paleopressure of methane inclusions in fracture cements from the Wufeng-Longmaxi shales in the Luzhou area, southern Sichuan Basin. Pet. Sci. Bull. 2019, 4, 242–253. [Google Scholar]
- Ju, Y.; Sun, Y.; Tan, J.; Bu, H.; Han, K.; Li, X.; Fang, L. The composition, pore structure characterization and deformation mechanism of coal-bearing shales from tectonically altered coalfields in eastern China. Fuel 2018, 234, 626–642. [Google Scholar] [CrossRef]
- Wang, H.; Shi, Z.; Sun, S.; Zhao, Q.; Zhou, T.; Cheng, F.; Bai, W. Microfacies types and distribution of epicontinental shale: A case study of the Wufeng-Longmaxi shale in southern Sichuan Basin, China. Pet. Explor. Dev. 2023, 50, 57–71. [Google Scholar] [CrossRef]
- Hu, D.; Zhang, H.; Ni, K.; Yu, G. Main controlling factors for gas preservation conditions of marine shales in southeastern margins of the Sichuan Basin. Nat. Gas Ind. 2014, 34, 17–23. [Google Scholar]
- Zhang, K. Preservation Mechanism and Evaluation Method of Marine Shale Gas with Complex Tectonic Background. Ph.D. Dissertation, China University of Petroleum (Beijing), Beijing, China, 2019. [Google Scholar]
- Liu, S.; Deng, B.; Zhong, Y.; Ran, B.; Yong, Z.; Sun, W.; Yang, D.; Jiang, L.; Ye, Y. Unique geological featrures of burial and superimposition of the Lower Paleozoic shale gas across the Sichuan Basin and its periphery. Earth Sci. Front. 2016, 23, 11–28. [Google Scholar] [CrossRef]
- Yang, Y. An unrecognized major collision of the Okhotomorsk Block with East Asia during the Late Cretaceous, constraints on the plate reorganization of the Northwest Pacific. Earth-Sci. Rev. 2013, 126, 96–115. [Google Scholar] [CrossRef]
- Zhang, Y.; He, Z.; Lu, S.; Jiang, S.; Xiao, D.; Long, S.; Gao, B.; Du, W.; Zhao, J.; Chen, G.; et al. Characteristics of microorganisms and origin of organic matter in Wufeng Formation and Longmaxi Formation in Sichuan Basin, South China. Mar. Pet. Geol. 2020, 111, 363–374. [Google Scholar] [CrossRef]
- Chang, X.; Huang, Y.; Chen, Z.; Hou, M. The Microscopic Analysis of Pyrite Framboids and Application in Paleo⁃oceanography. Acta Sedimentol. Sin. 2020, 38, 150–165. [Google Scholar] [CrossRef]
- Shi, Z.; Yuan, Y.; Zhao, Q.; Sun, S.; Zhou, T.; Cheng, F. Paleogeomorphology and oil-bearing shale characteristics of the Wufeng-Longmaxi shale in southern Sichuan Basin, China. Nat. Gas Geosci. 2022, 33, 1969–1985. [Google Scholar]
- Shi, Z.; Zhao, S.; Zhou, T.; Ding, L.; Sun, S.; Cheng, F. Mineralogy and Geochemistry of the Upper Ordovician and Lower Silurian Wufeng-Longmaxi Shale on the Yangtze Platform, South China: Implications for Provenance Analysis and Shale Gas Sweet-Spot Interval. Minerals 2022, 12, 1190. [Google Scholar] [CrossRef]
- Qiu, Z.; Liu, B.; Dong, D.; Lu, B.; Yawar, Z.; Chen, Z.; Schieber, J. Silica diagenesis in the Lower Paleozoic Wufeng and Longmaxi Formations in the Sichuan Basin, South China: Implications for reservoir properties and paleoproductivity. Mar. Pet. Geol. 2020, 121, 104594. [Google Scholar] [CrossRef]
- Xiang-Rong, Y.; De-Tian, Y.; Xiao-Song, W.; Li-Wei, Z.; Bao, Z.; Han-Wen, X.; Yin, G.; Jie, H. Different formation mechanism of quartz in siliceous and argillaceous shales: A case study of Longmaxi Formation in South China. Mar. Pet. Geol. 2018, 94, 80–94. [Google Scholar] [CrossRef]
- Dong, T.; He, Q.; He, S.; Zhai, G.; Zhang, Y.; Wei, S.; Wei, C.; Hou, Y.; Guo, X. Quartz types, origins and organic matter-hosted pore systems in the lower cambrian Niutitang Formation, middle yangtze platform, China. Mar. Pet. Geol. 2021, 123, 104739. [Google Scholar] [CrossRef]
- Cao, T.; Song, Z.; Wang, S.; Xia, J. Characterization of pore structure and fractal dimension of Paleozoic shales from the northeastern Sichuan Basin, China. J. Nat. Gas Sci. Eng. 2016, 35, 882–895. [Google Scholar] [CrossRef]
- Xie, X.; Deng, H.; Li, Y.; Hu, L.; Mao, J.; Li, R. Investigation of the Oriented Structure Characteristics of Shale Using Fractal and Structural Entropy Theory. Fractal Fract. 2022, 6, 734. [Google Scholar] [CrossRef]
- Ju, Y.-W.; Hou, X.-G.; Han, K.; Song, Y.; Xiao, L.; Huang, C.; Zhu, H.-J.; Tao, L.-R. Experimental deformation of shales at elevated temperature and pressure: Pore-crack system evolution and its effects on shale gas reservoirs. Pet. Sci. 2024, in press. [CrossRef]
- Ko, L.T.; Ruppel, S.C.; Loucks, R.G.; Hackley, P.C.; Zhang, T.; Shao, D. Pore-types and pore-network evolution in Upper Devonian-Lower Mississippian Woodford and Mississippian Barnett mudstones: Insights from laboratory thermal maturation and organic petrology. Int. J. Coal Geol. 2018, 190, 3–28. [Google Scholar] [CrossRef]
- Zeng, L.; Zhu, H.; Hao, Y.; Shi, E.; Lu, Y.; Qi, Y. Microstructures and Pore Structures of Naturally Deformed Shales: Significance for Shale Gas Exploration in the Complex Tectonic Areas of the Margin of the Sichuan Basin, South China. Energy Fuels 2023, 37, 10414–10425. [Google Scholar] [CrossRef]
- Ko, L.T.; Loucks, R.G.; Zhang, T.; Ruppel, S.C.; Shao, D. Pore and pore network evolution of Upper Cretaceous Boquillas (Eagle Ford-equivalent) mudrocks: Results from gold tube pyrolysis experiments. AAPG Bull. 2016, 100, 1693–1722. [Google Scholar] [CrossRef]
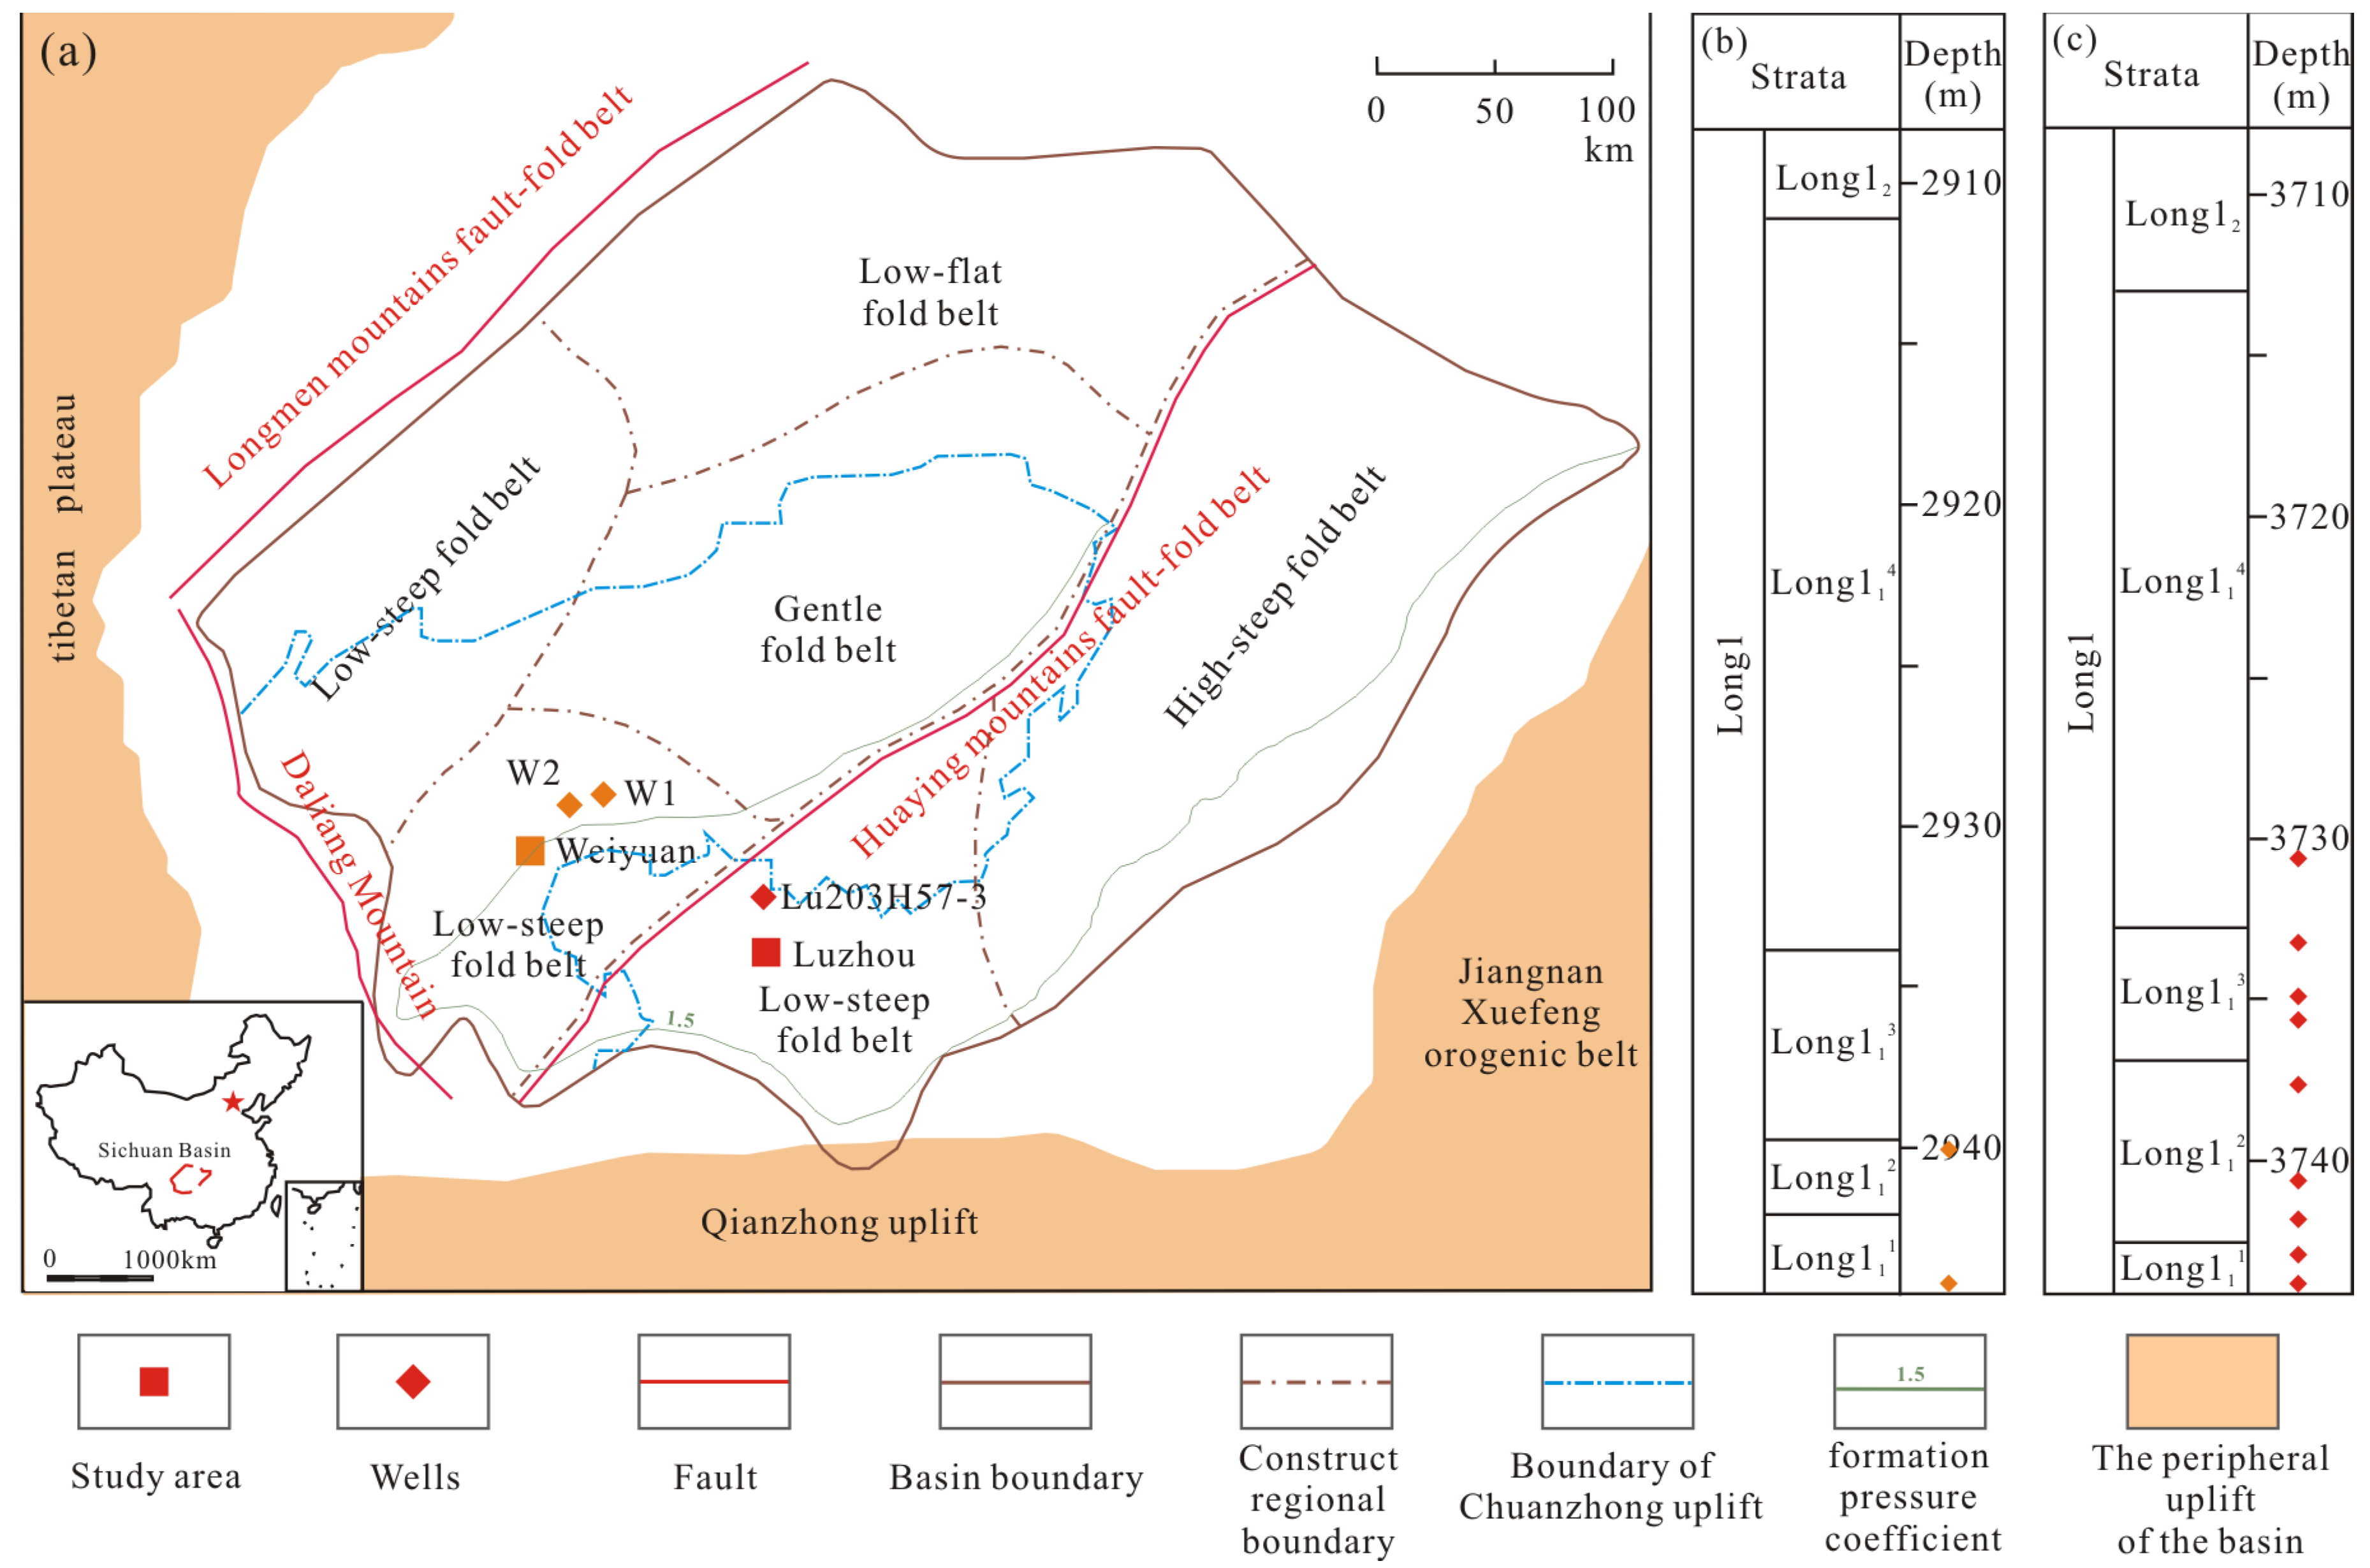
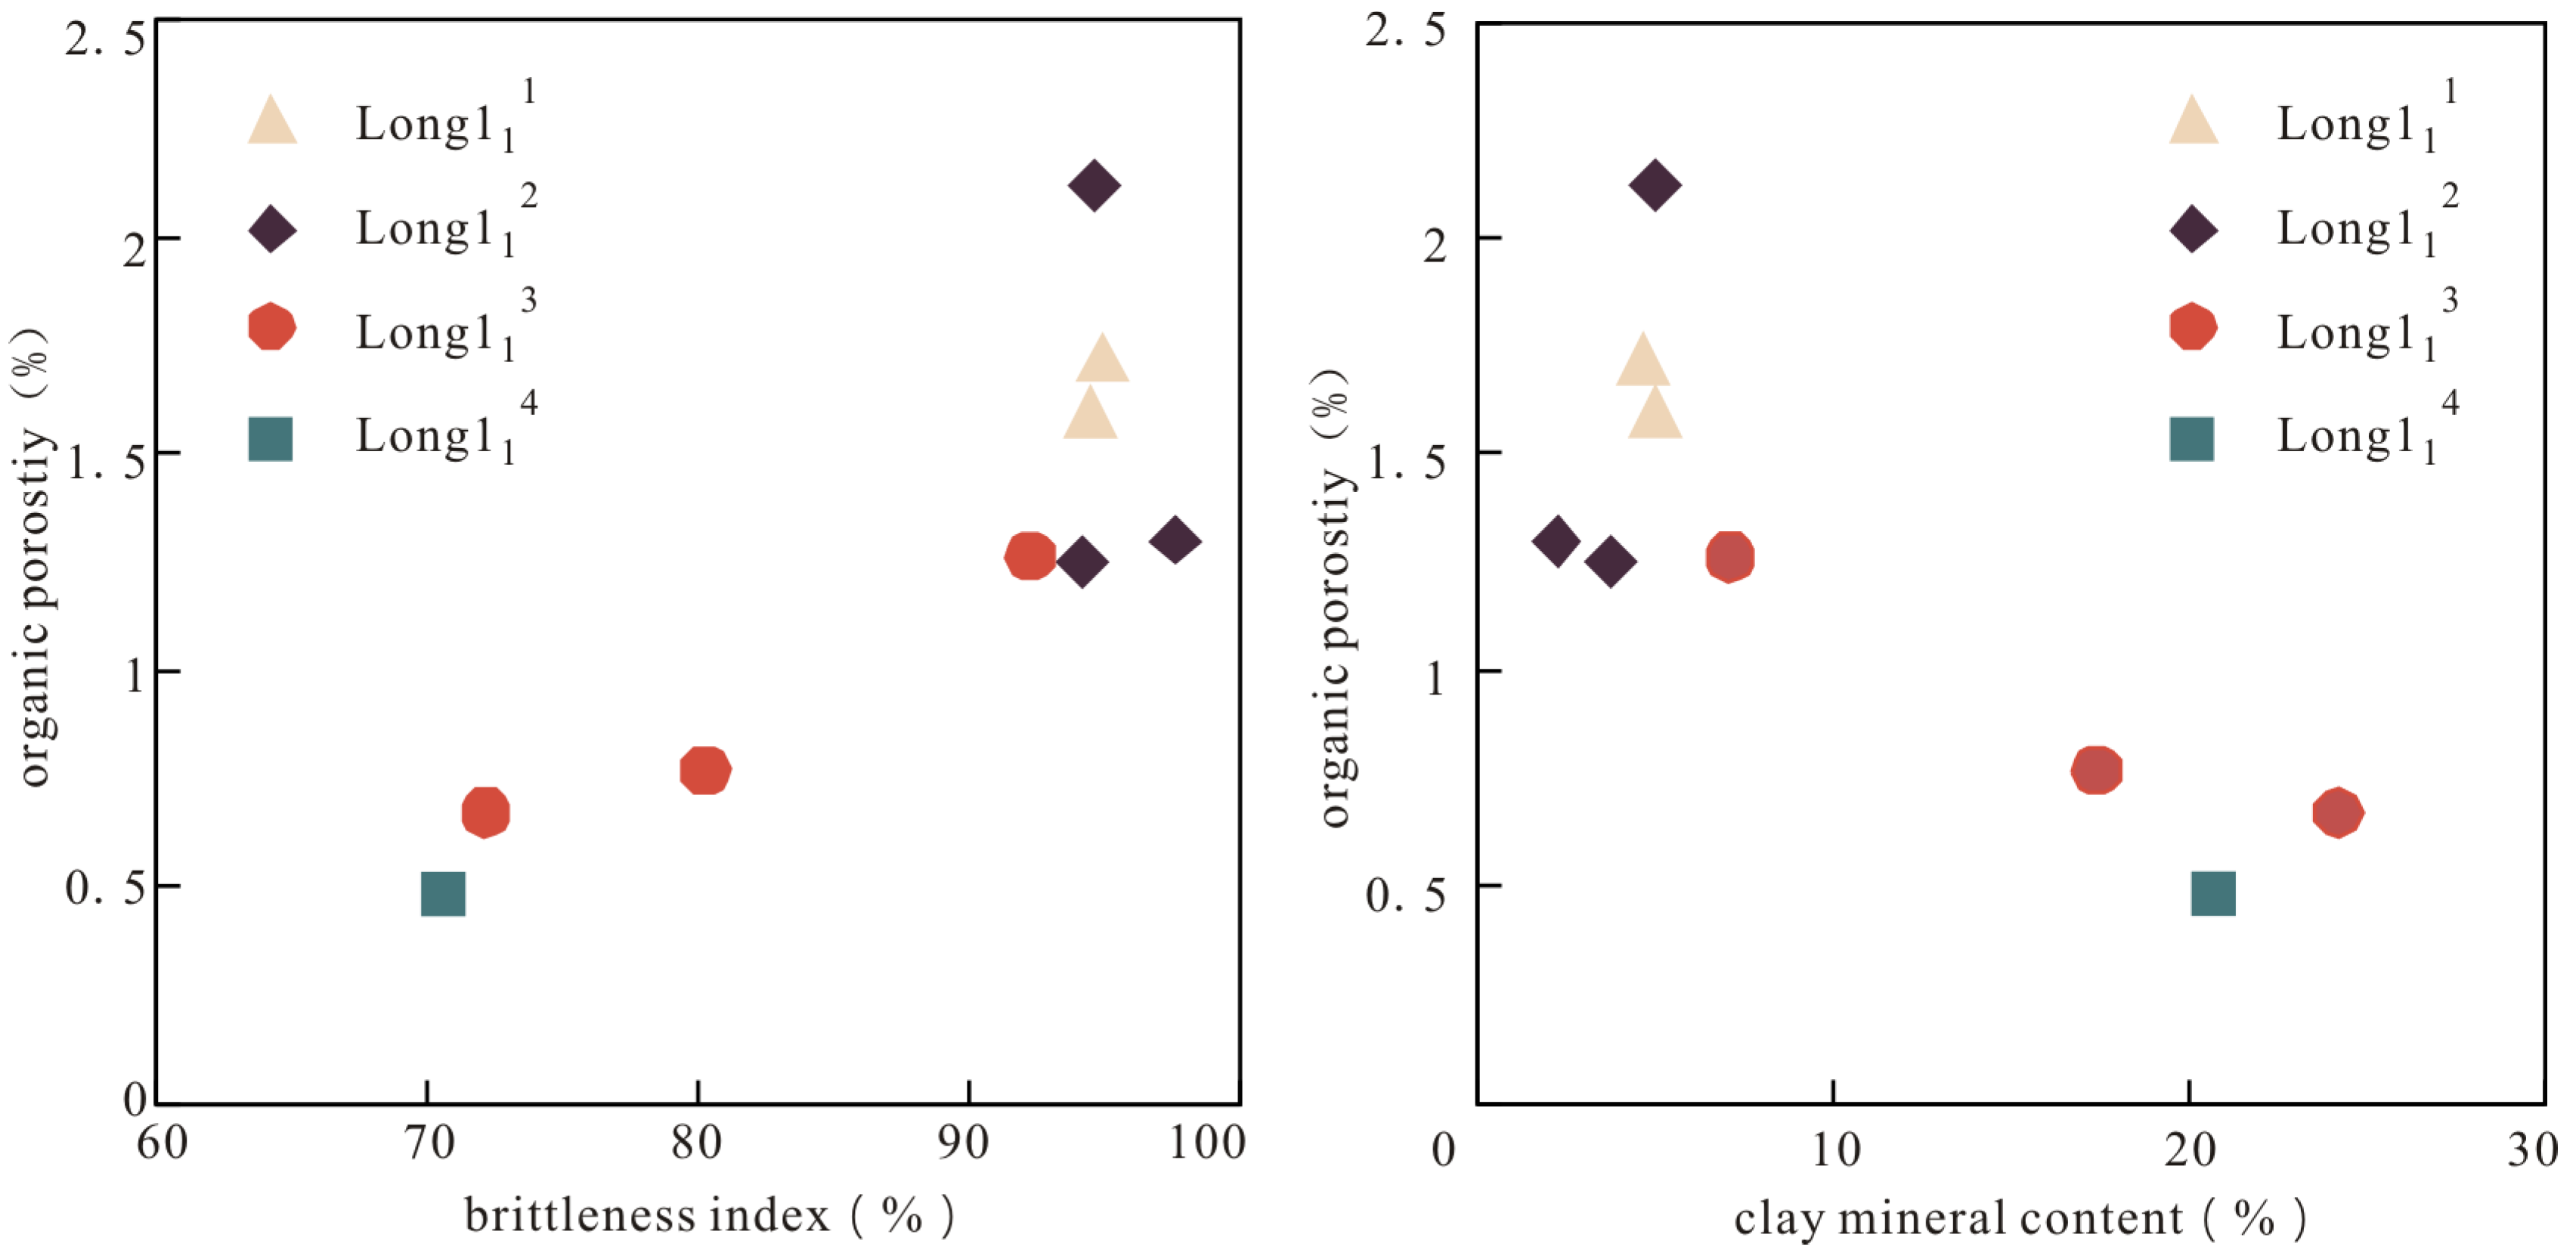
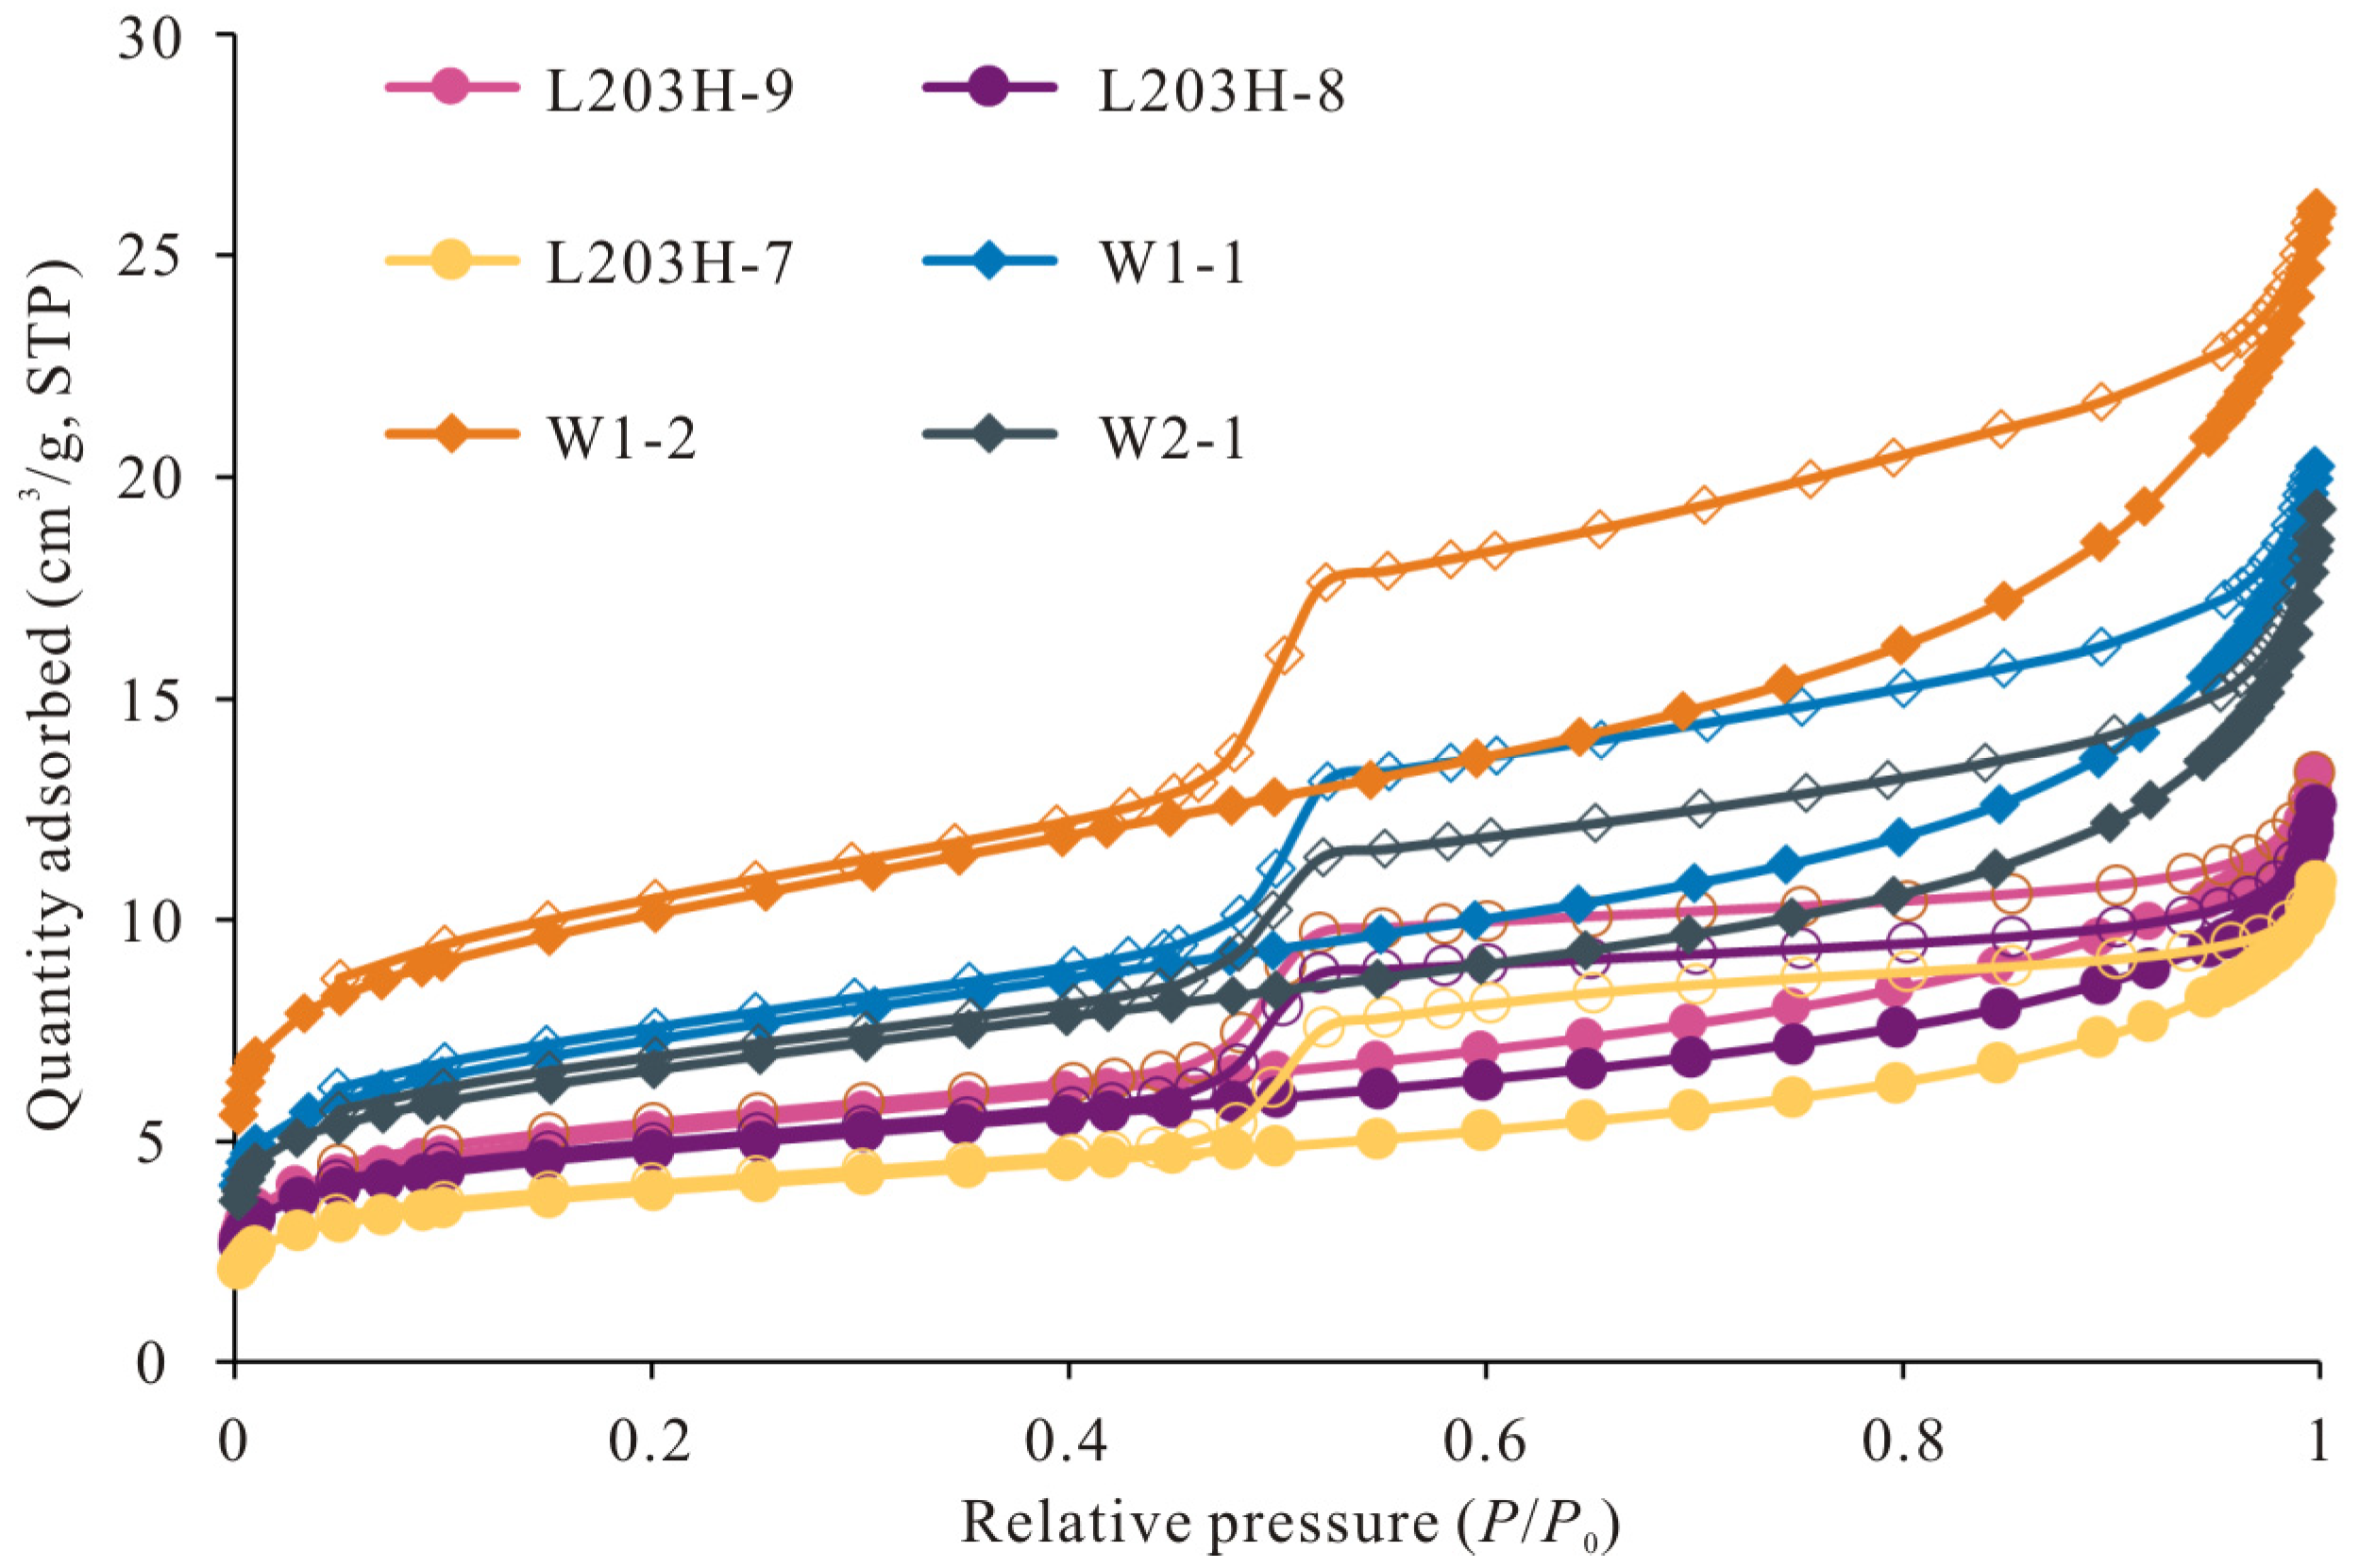
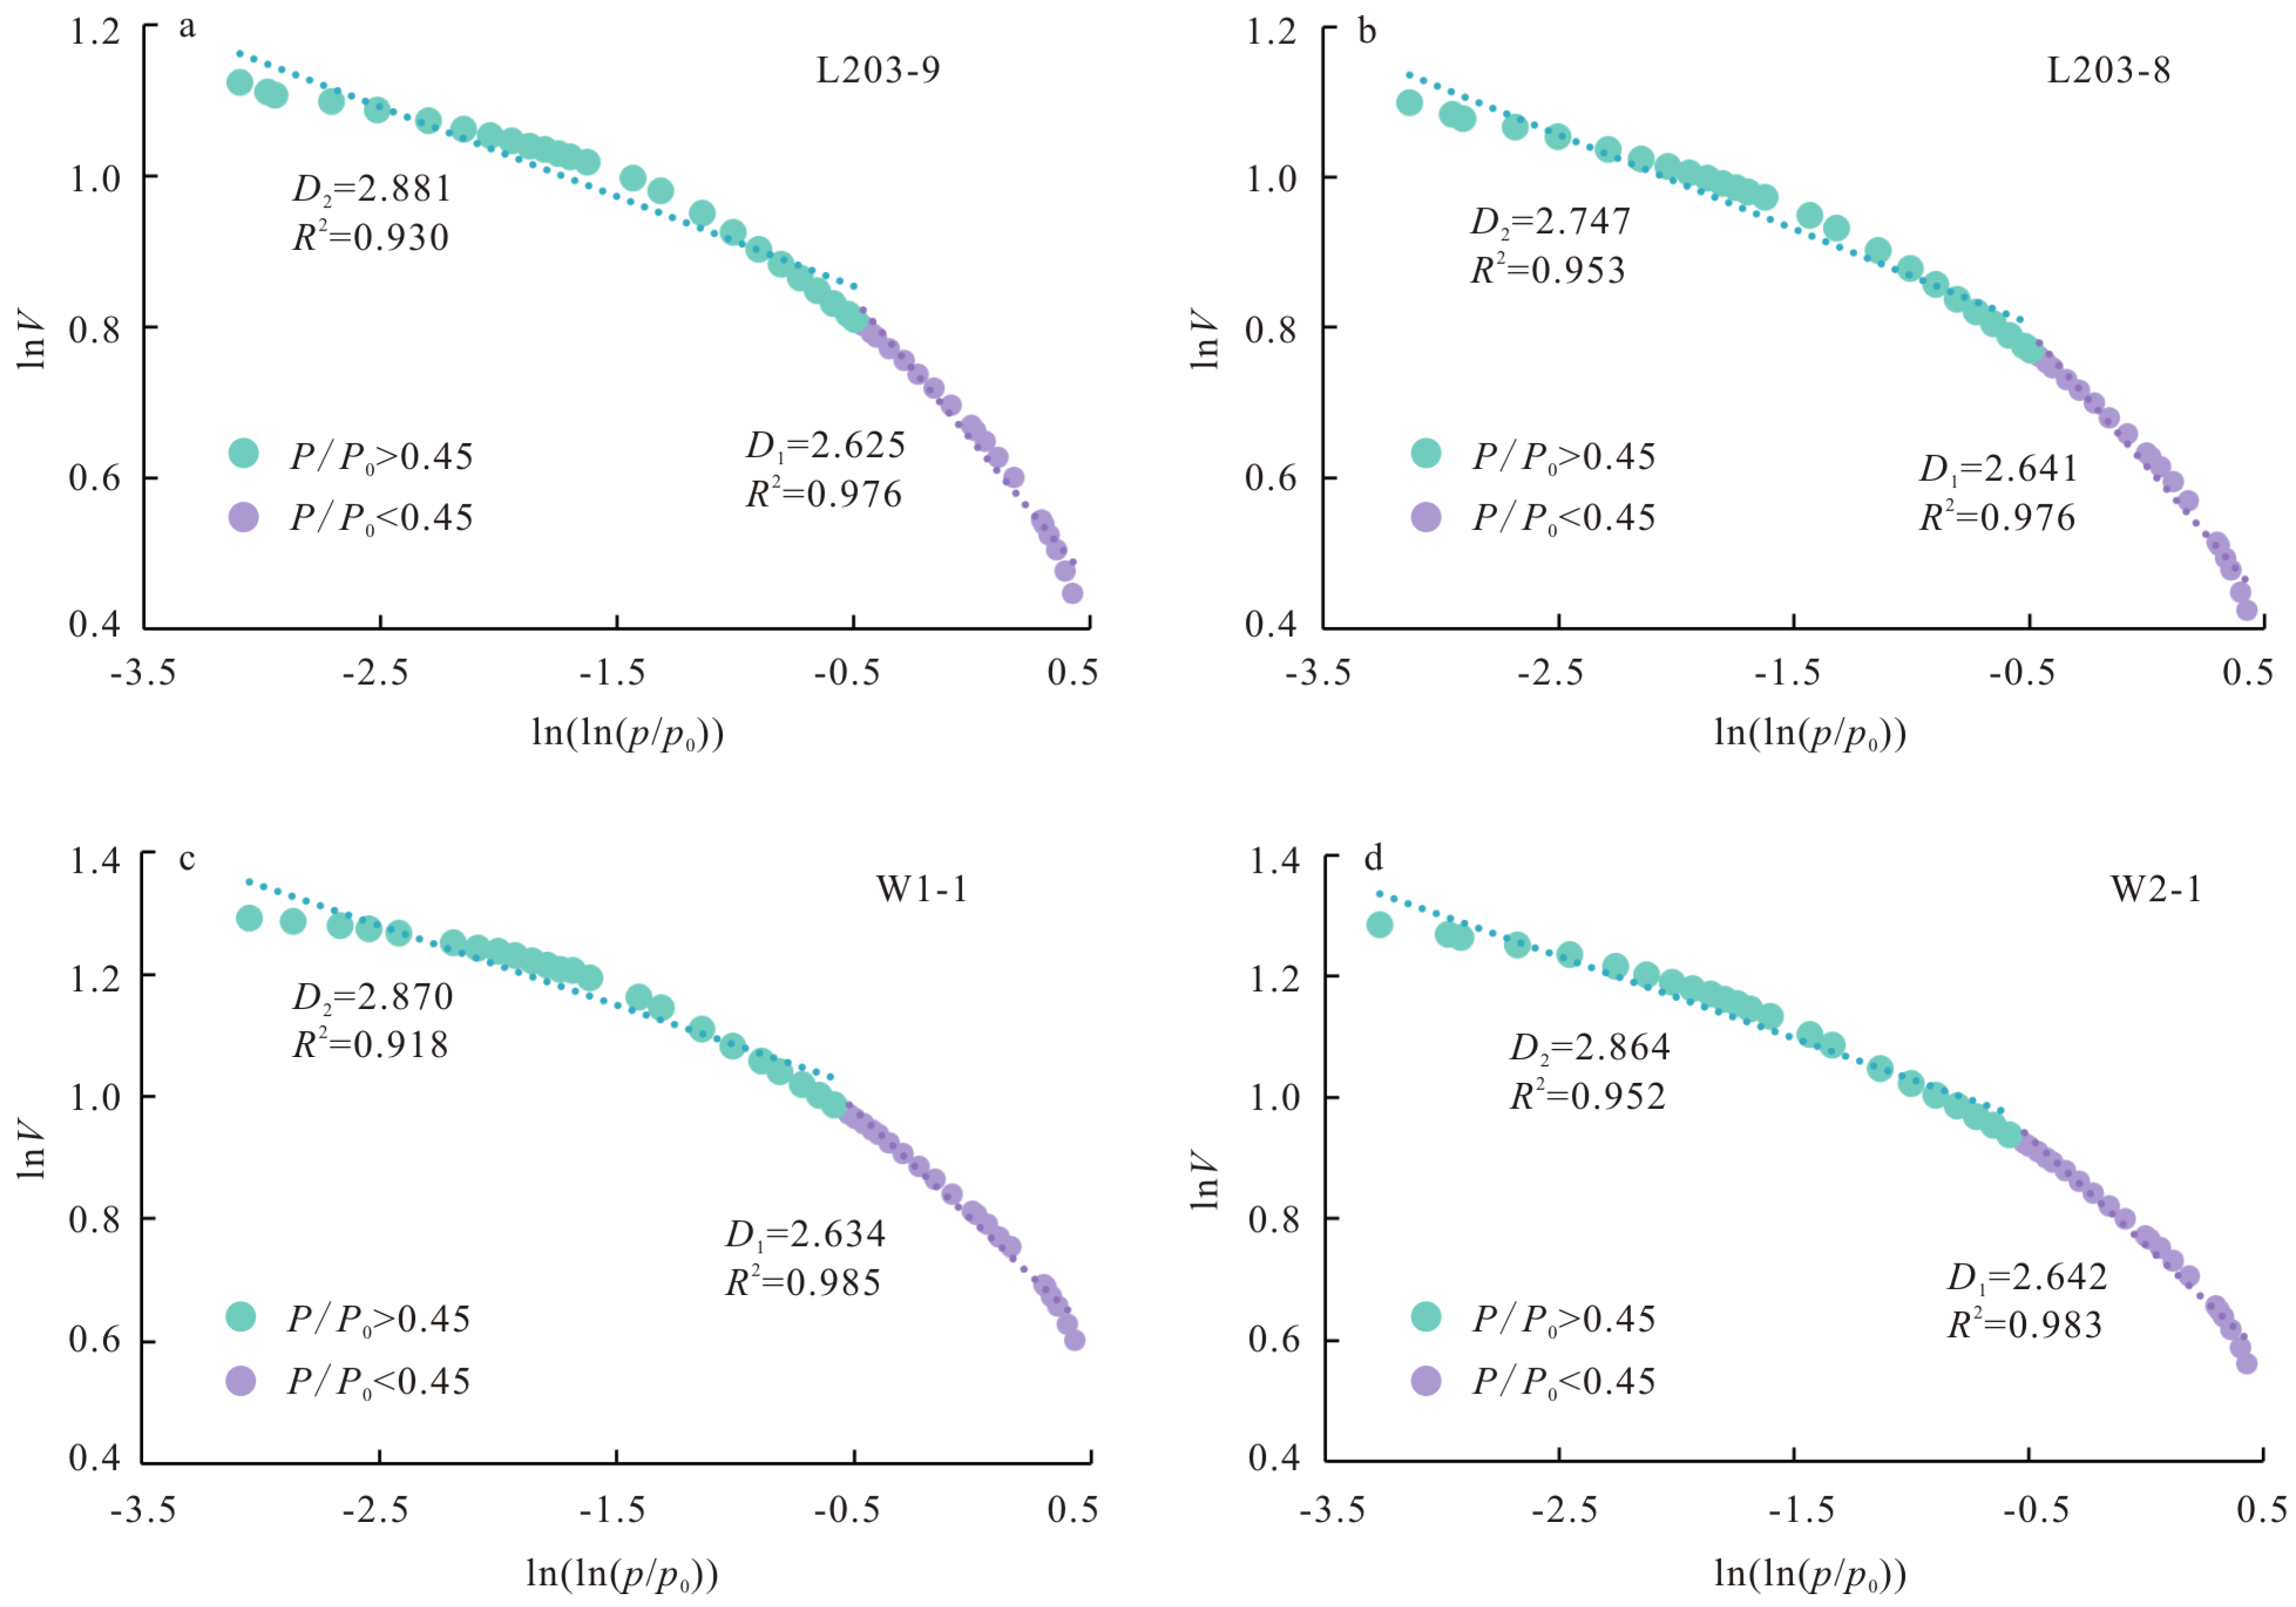
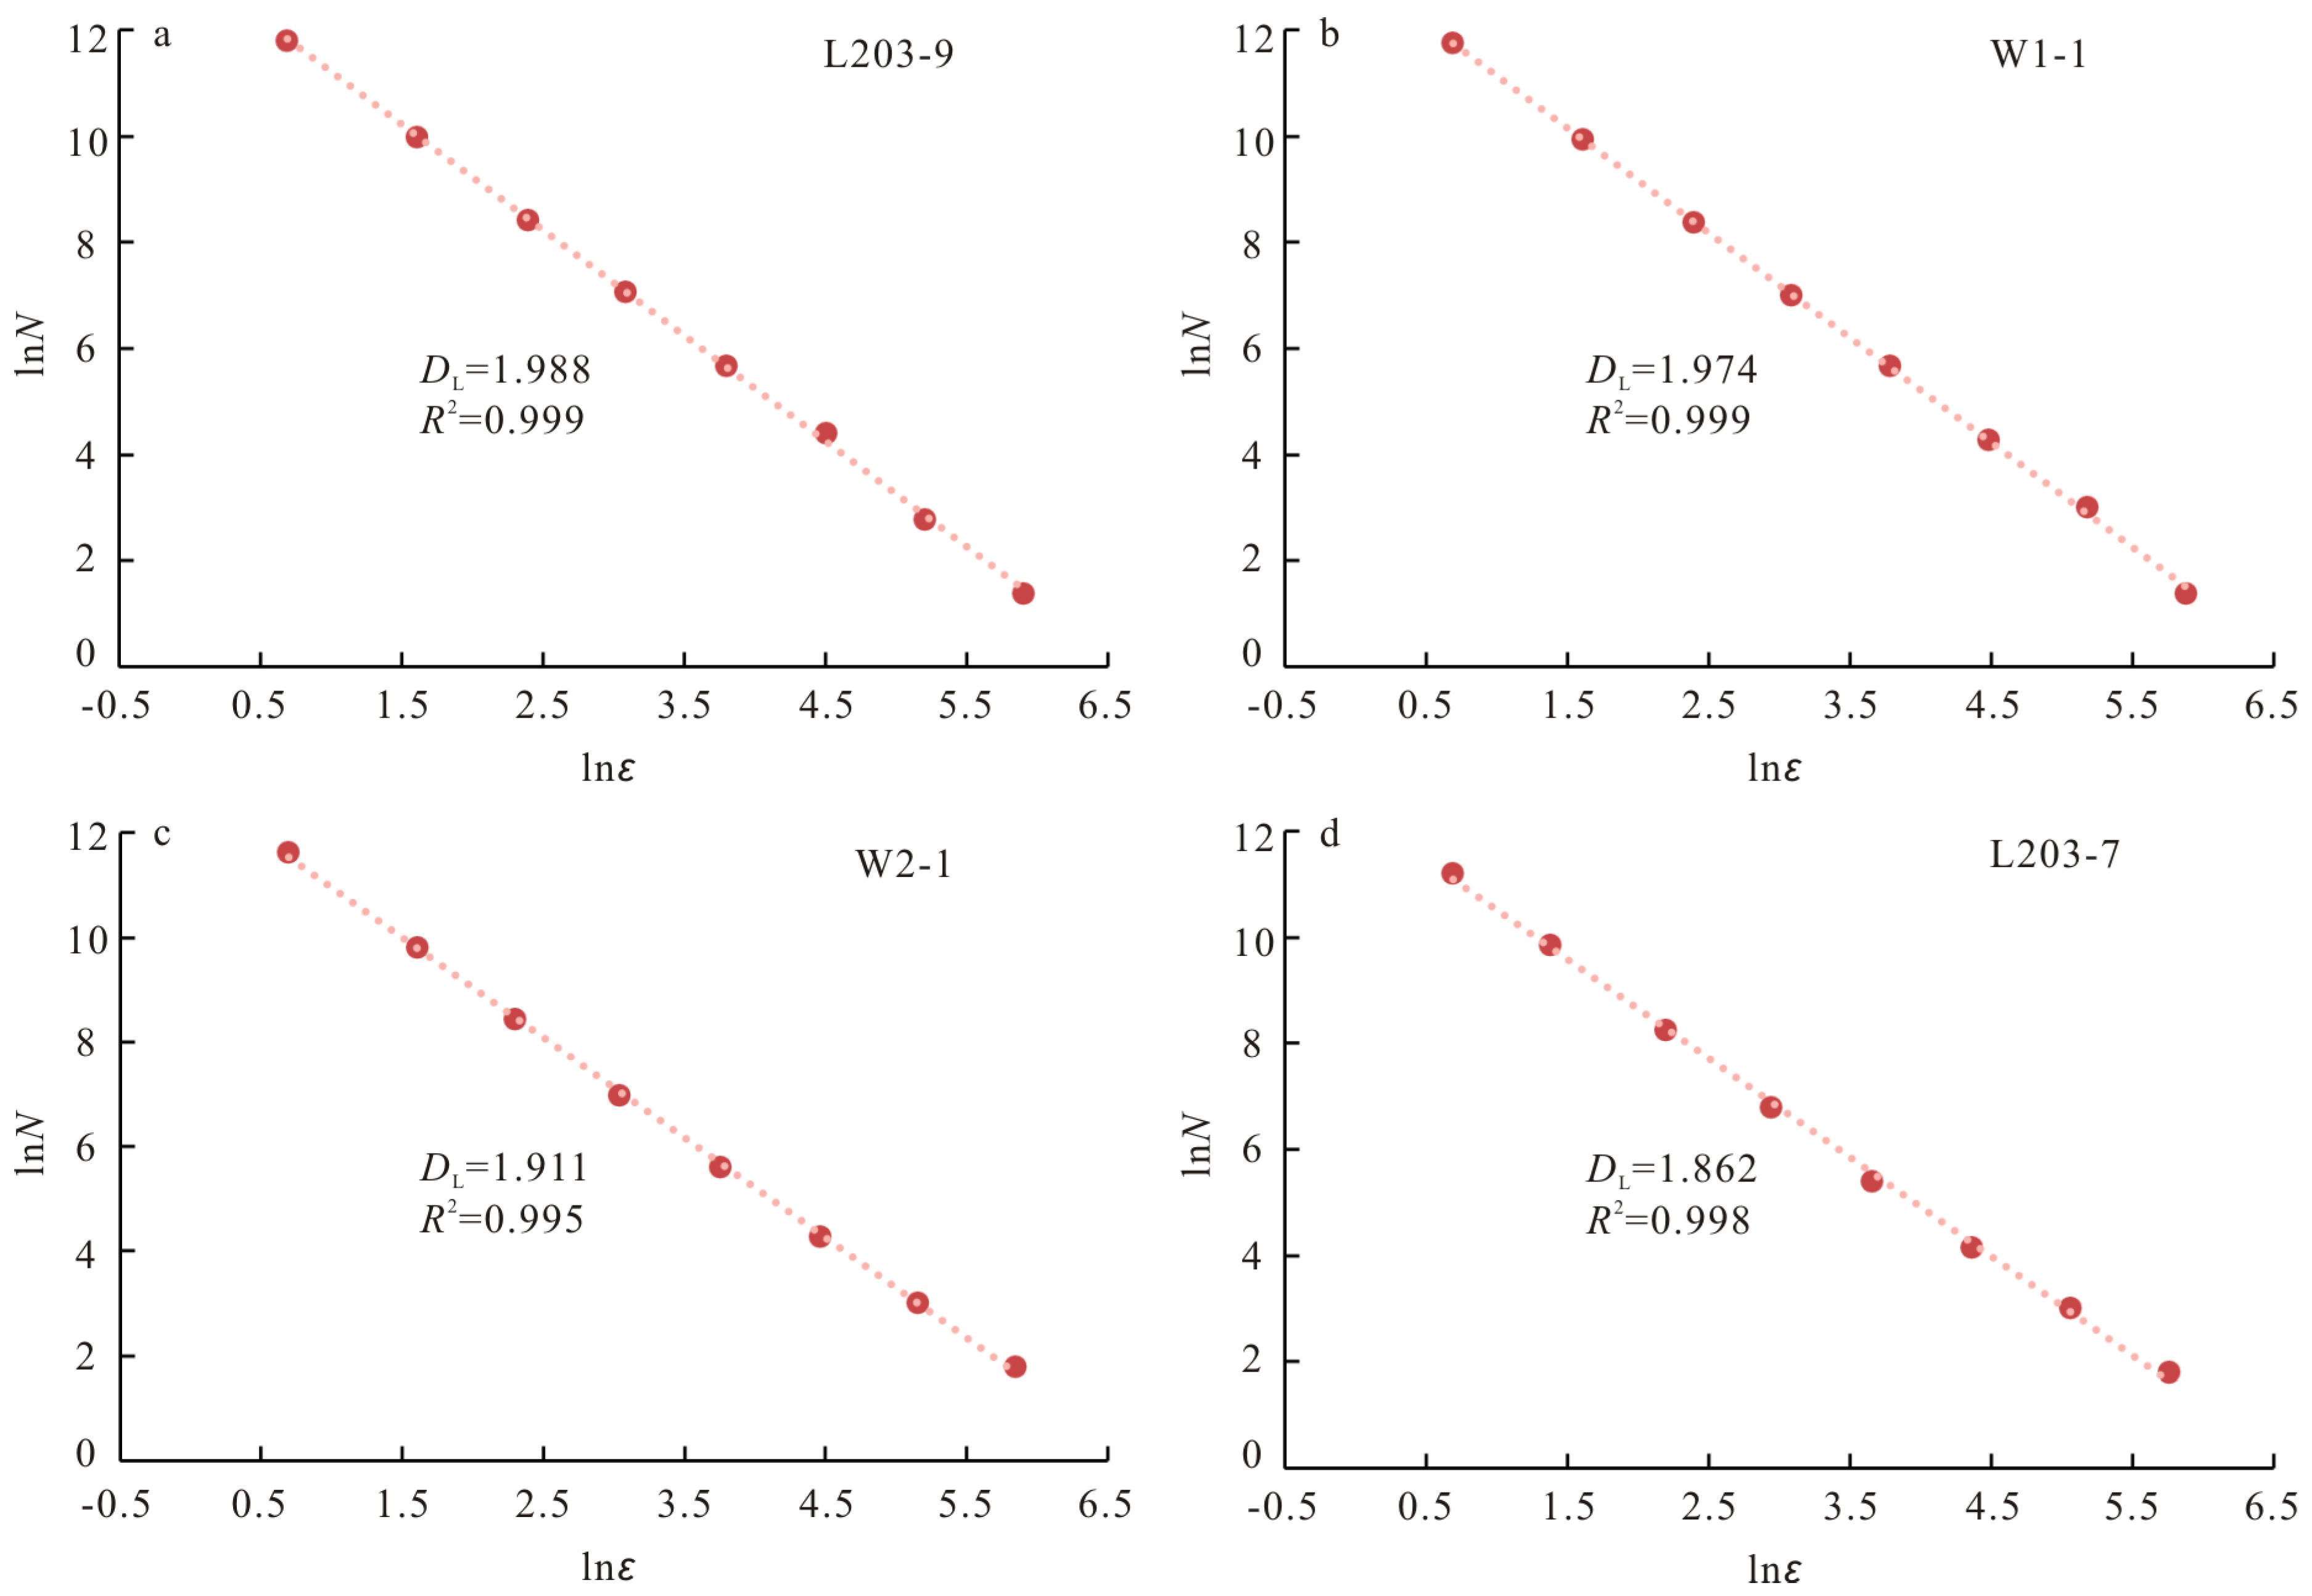

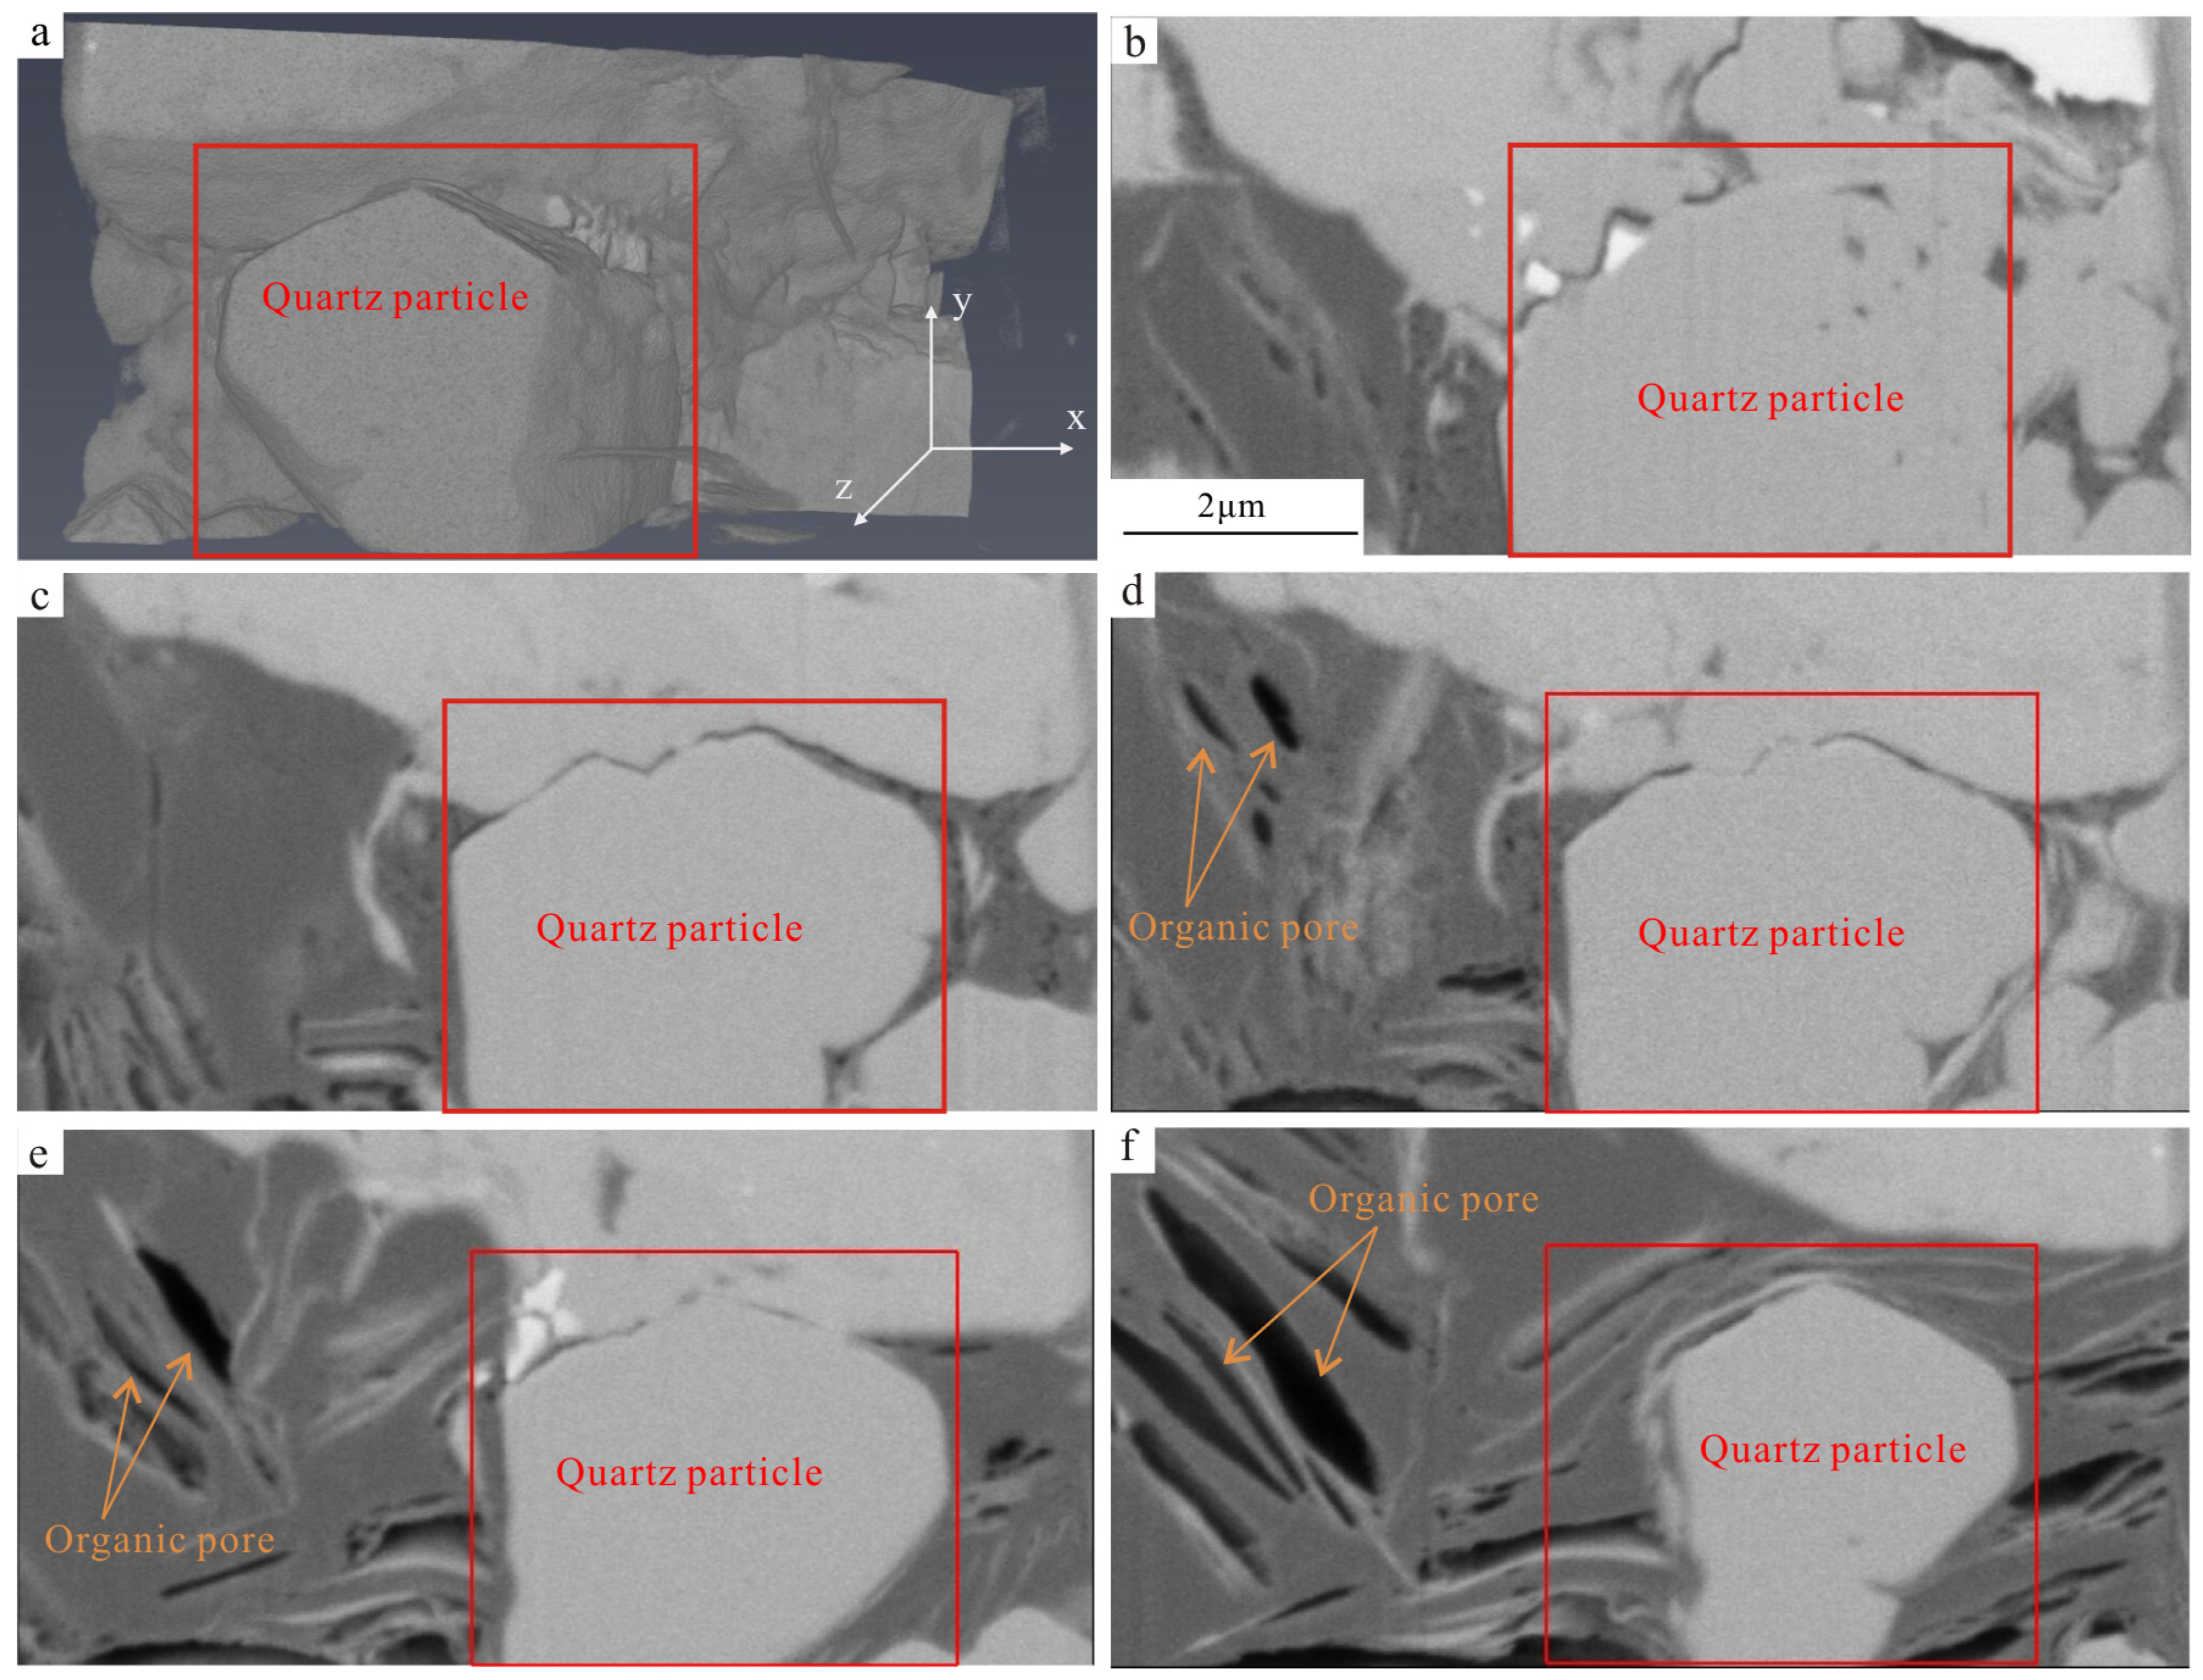
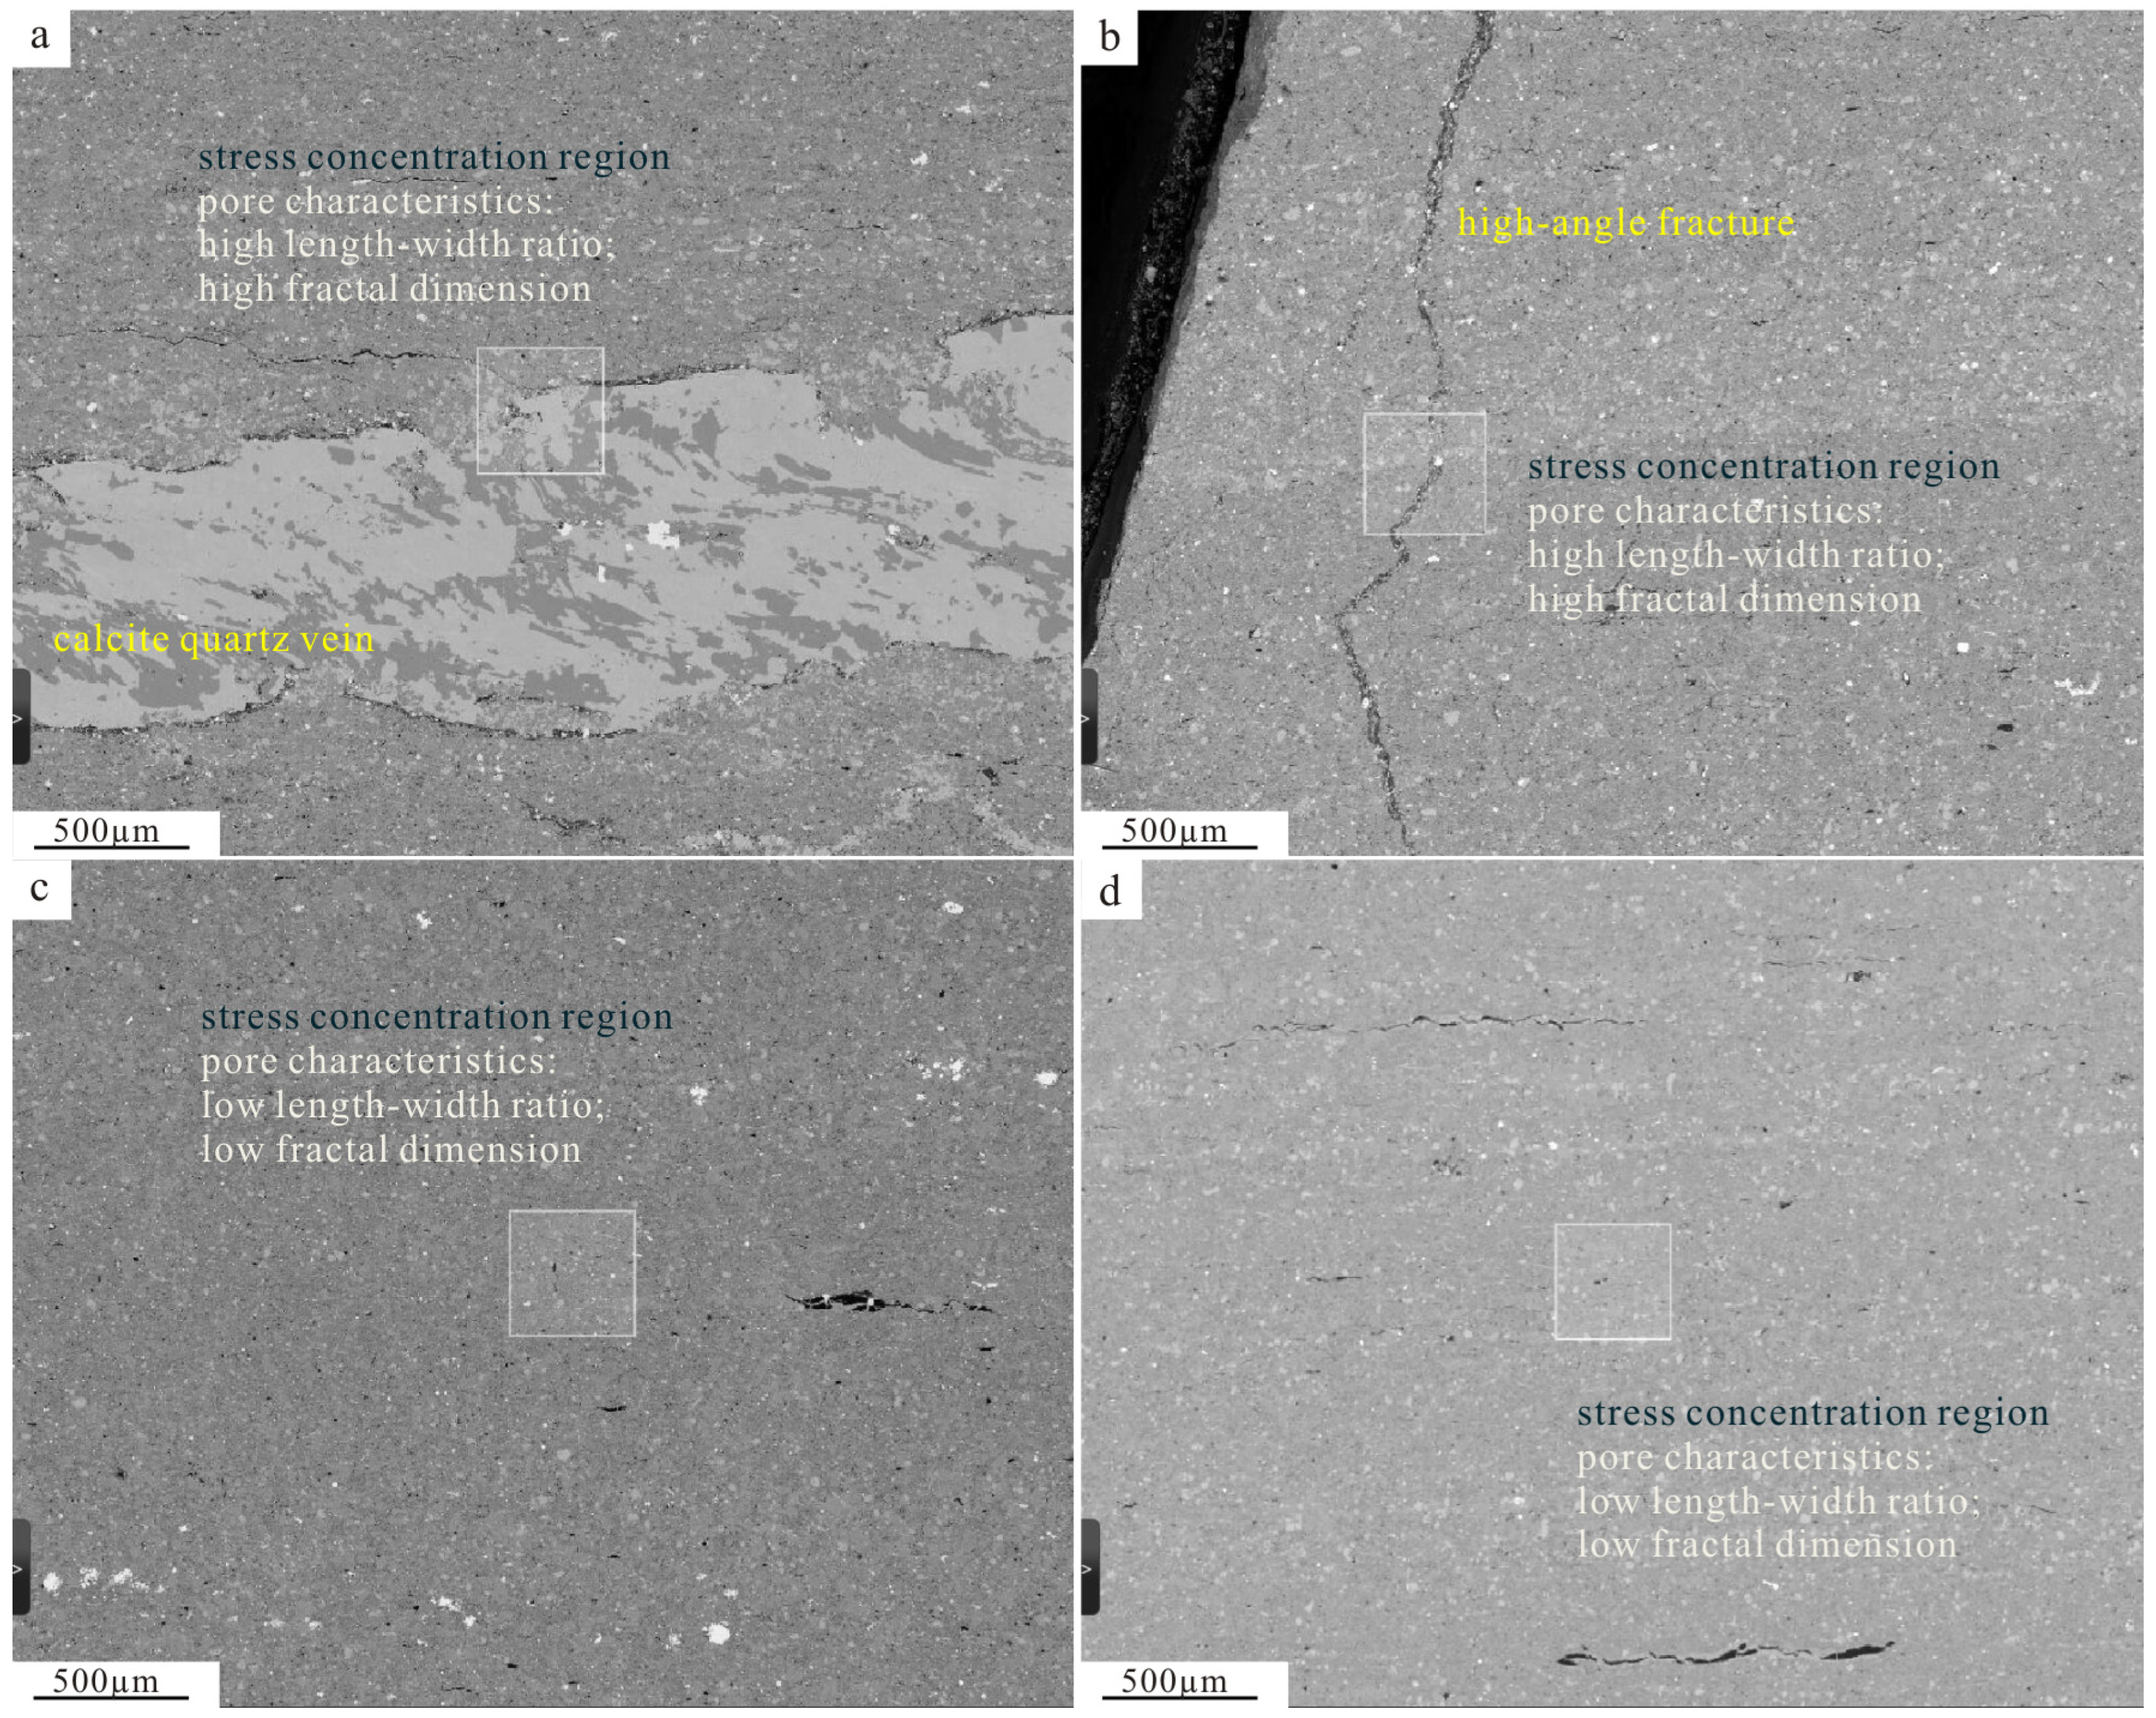

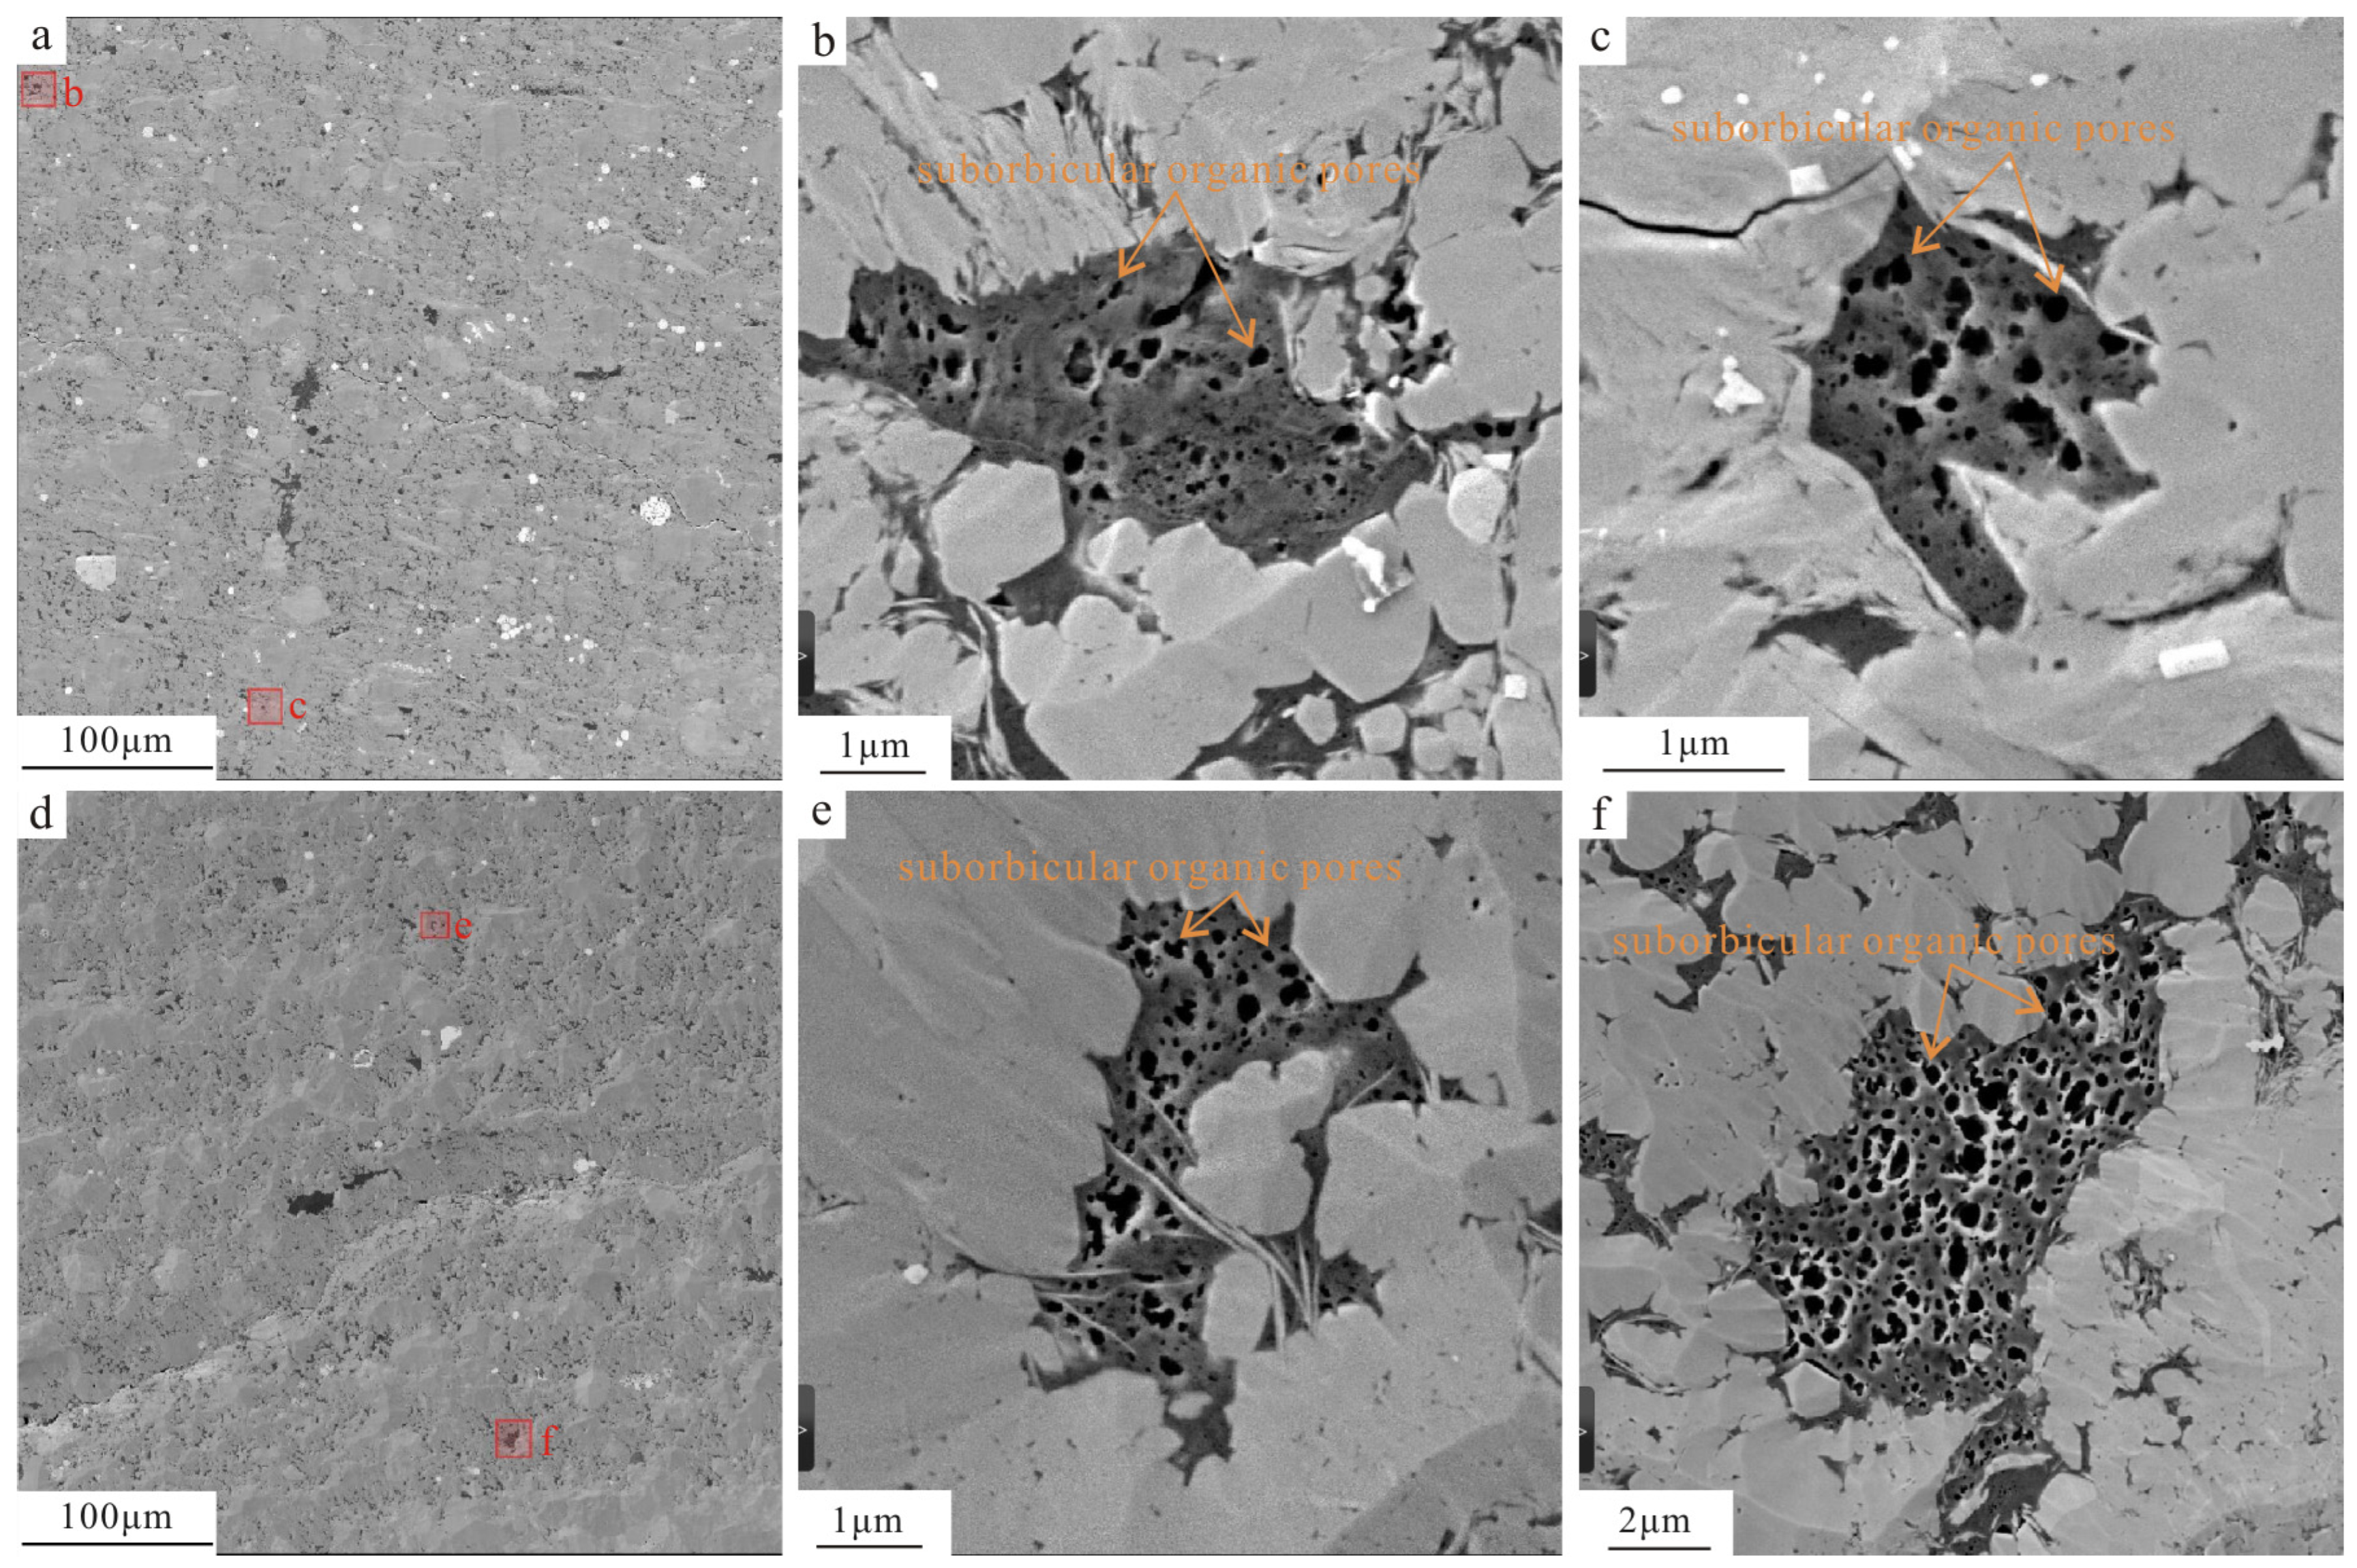
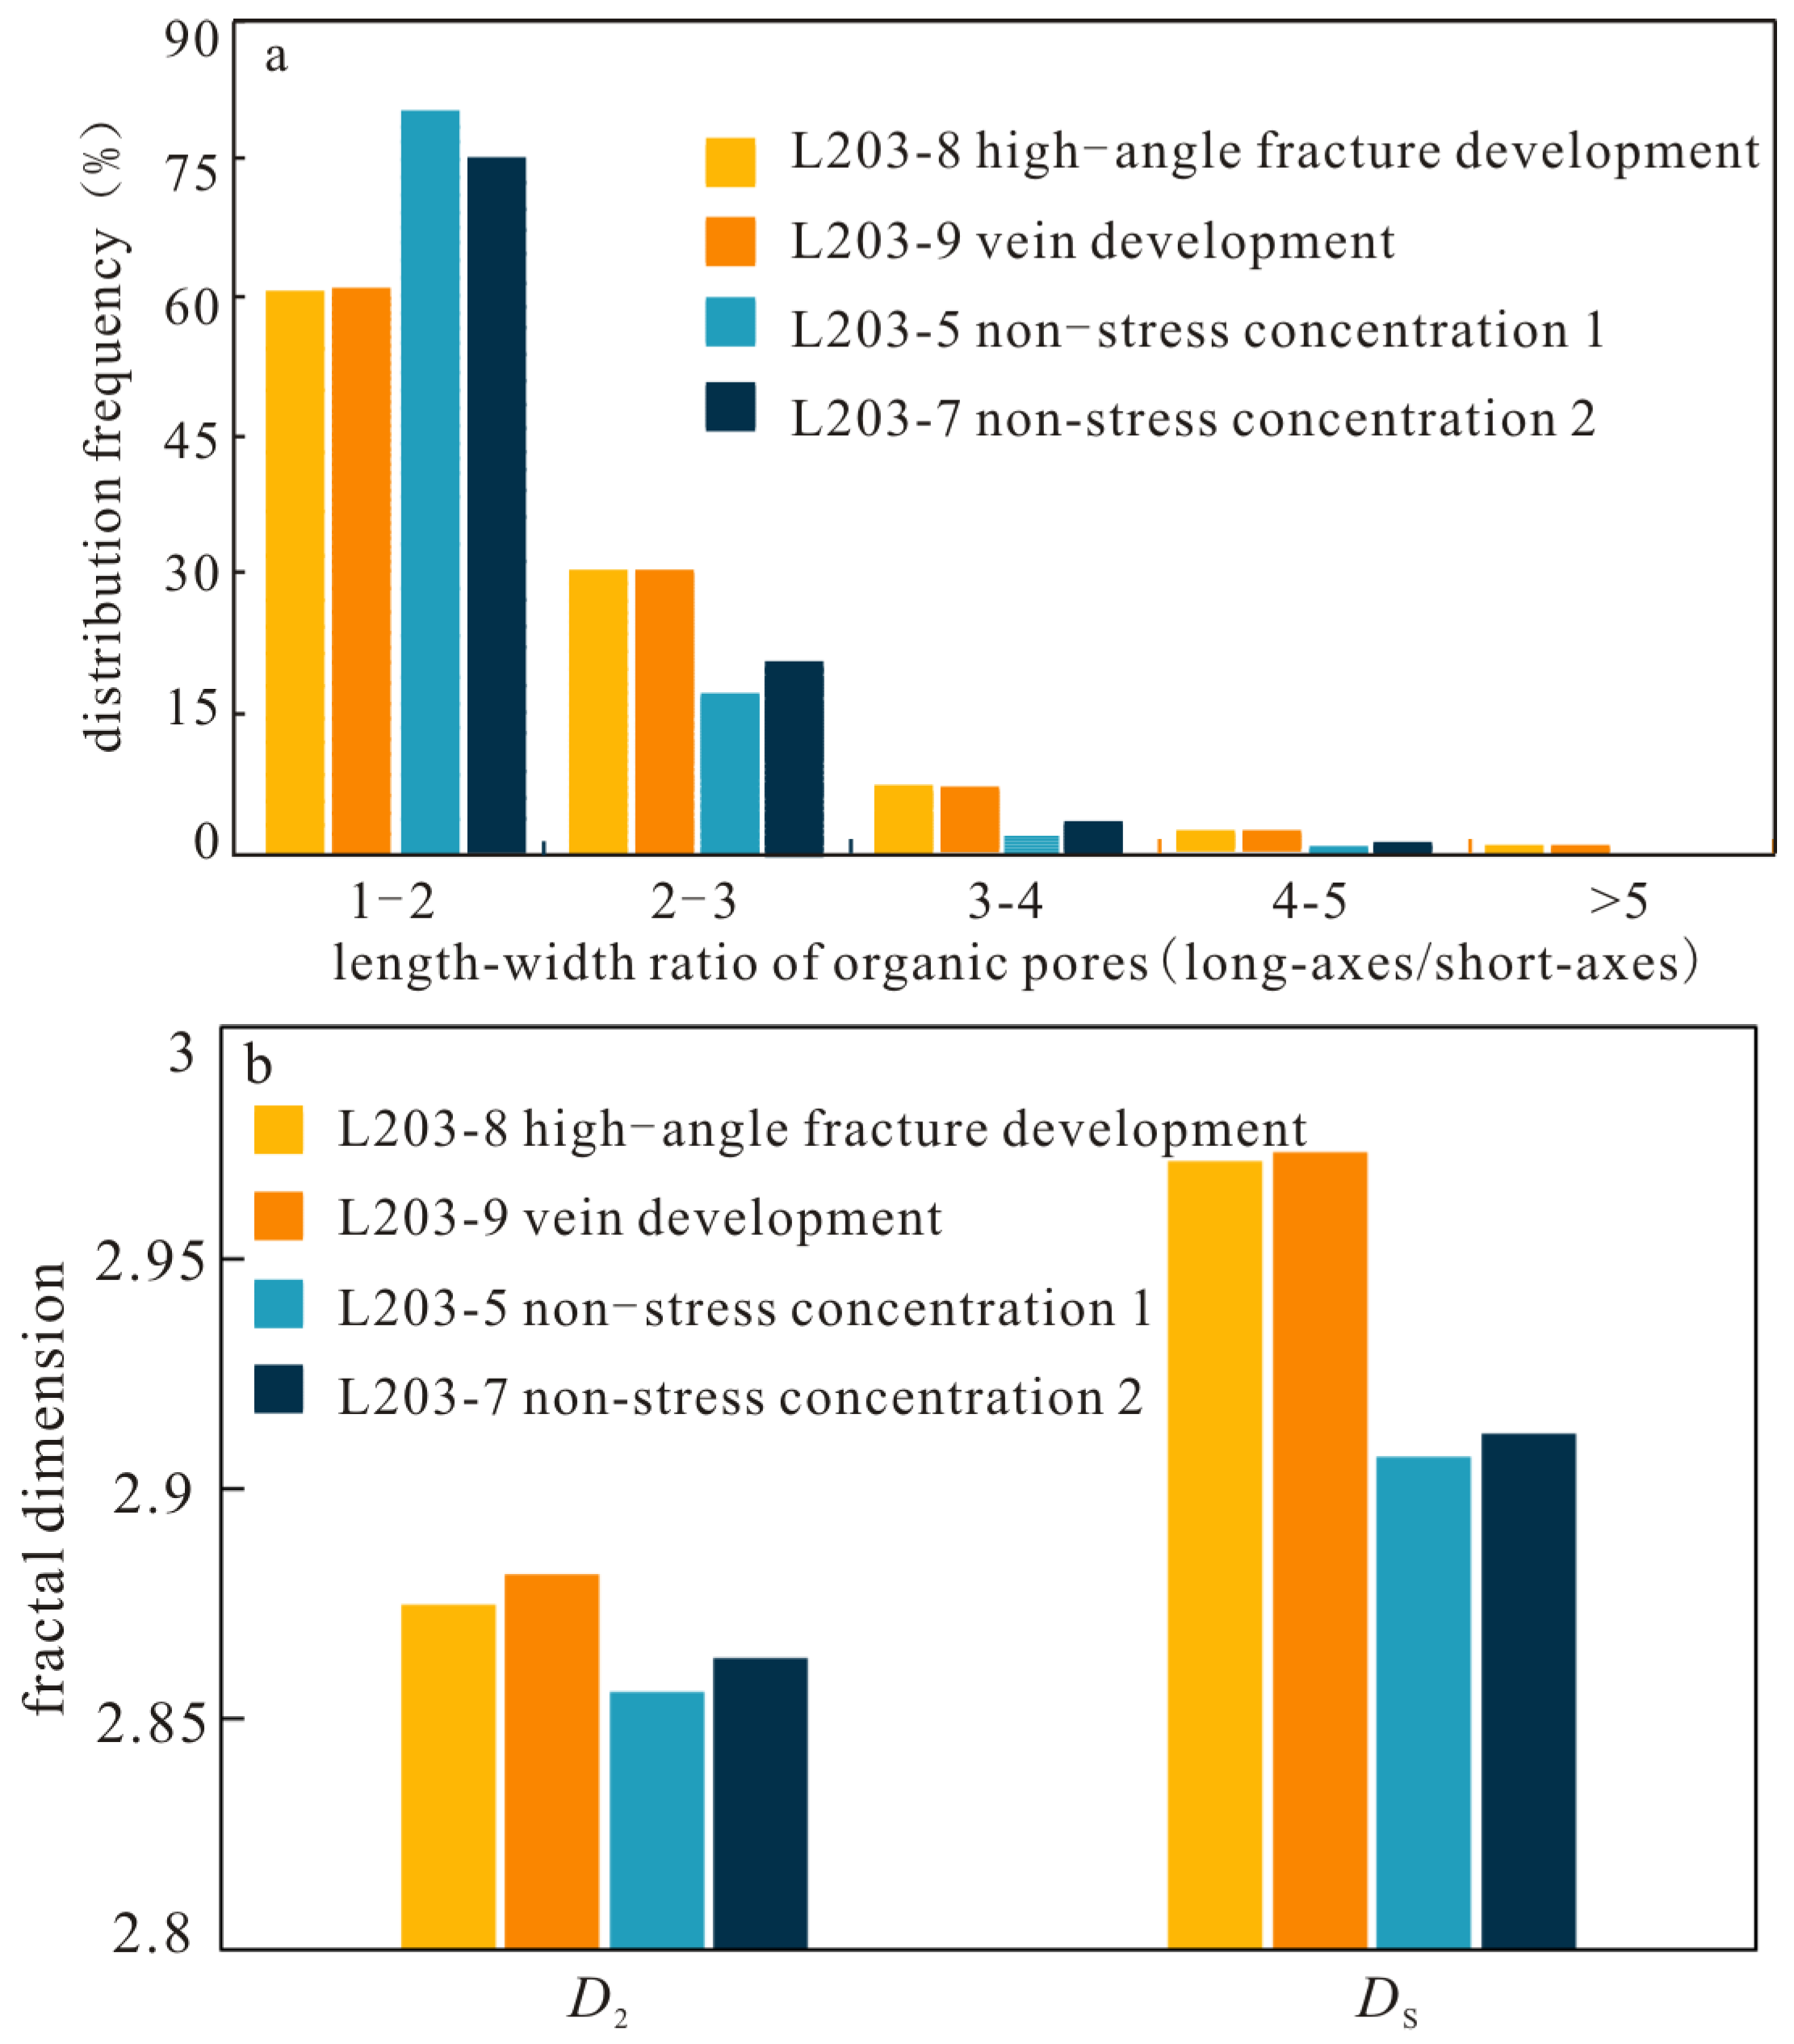
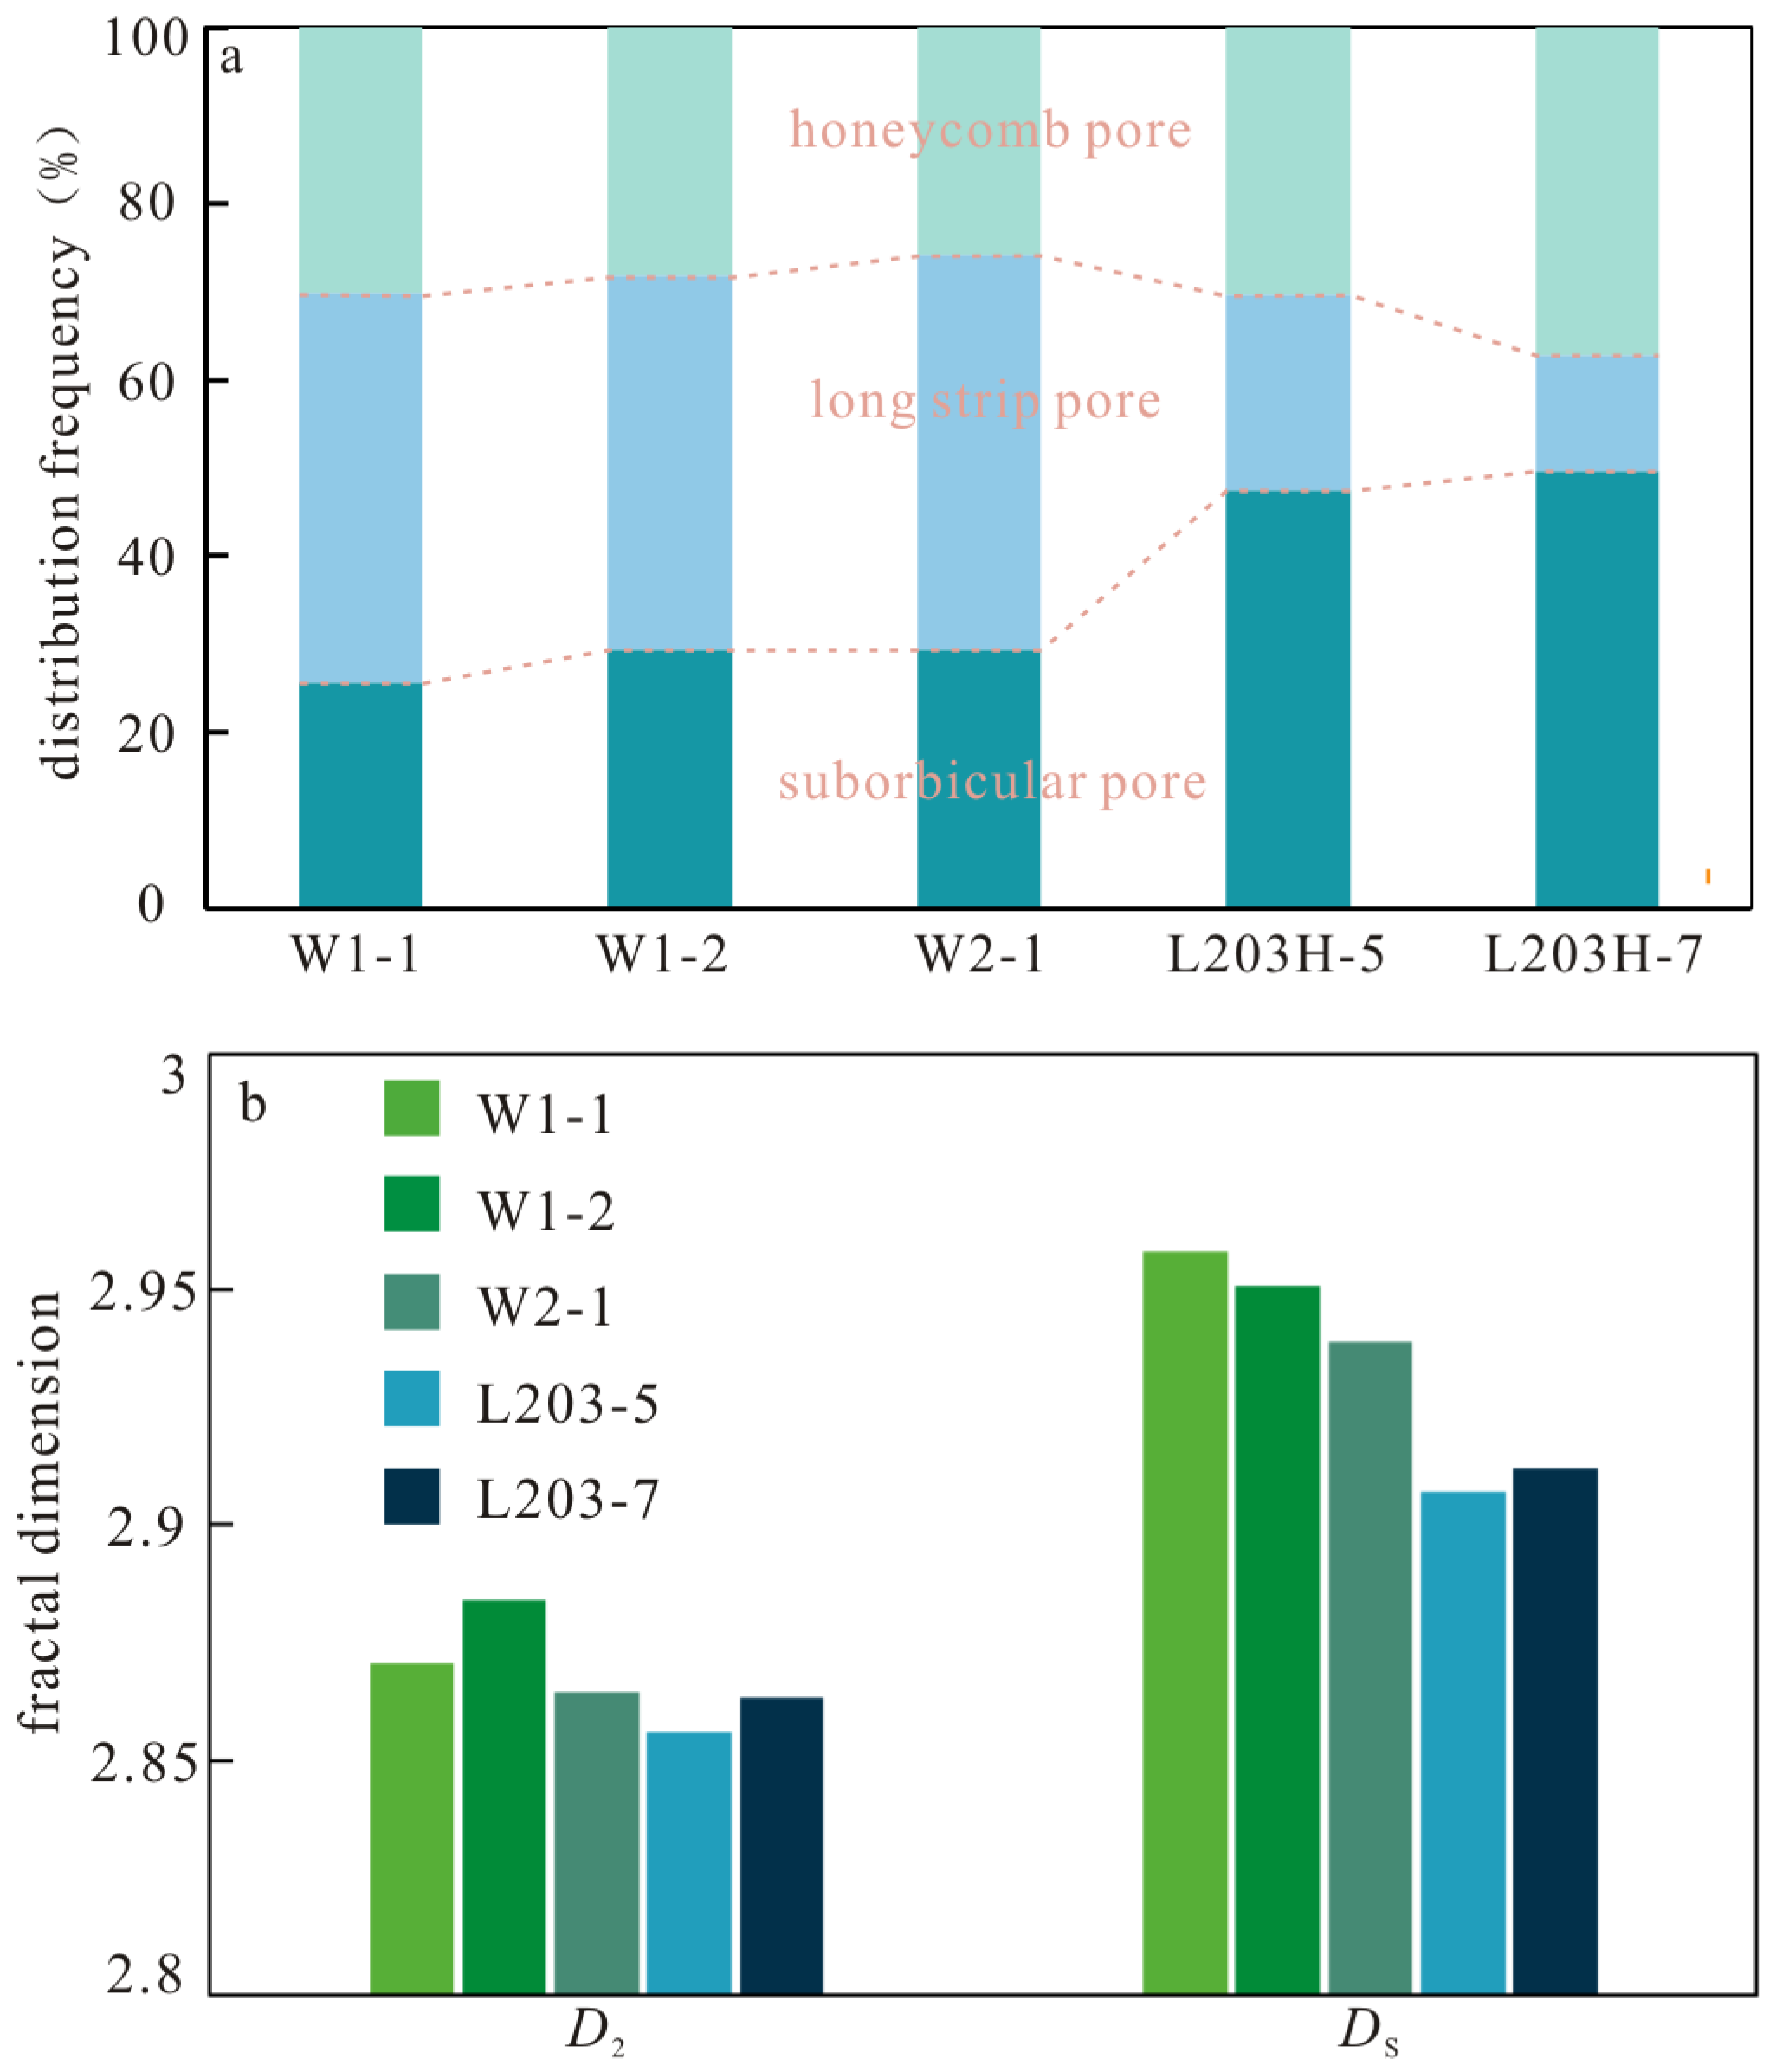
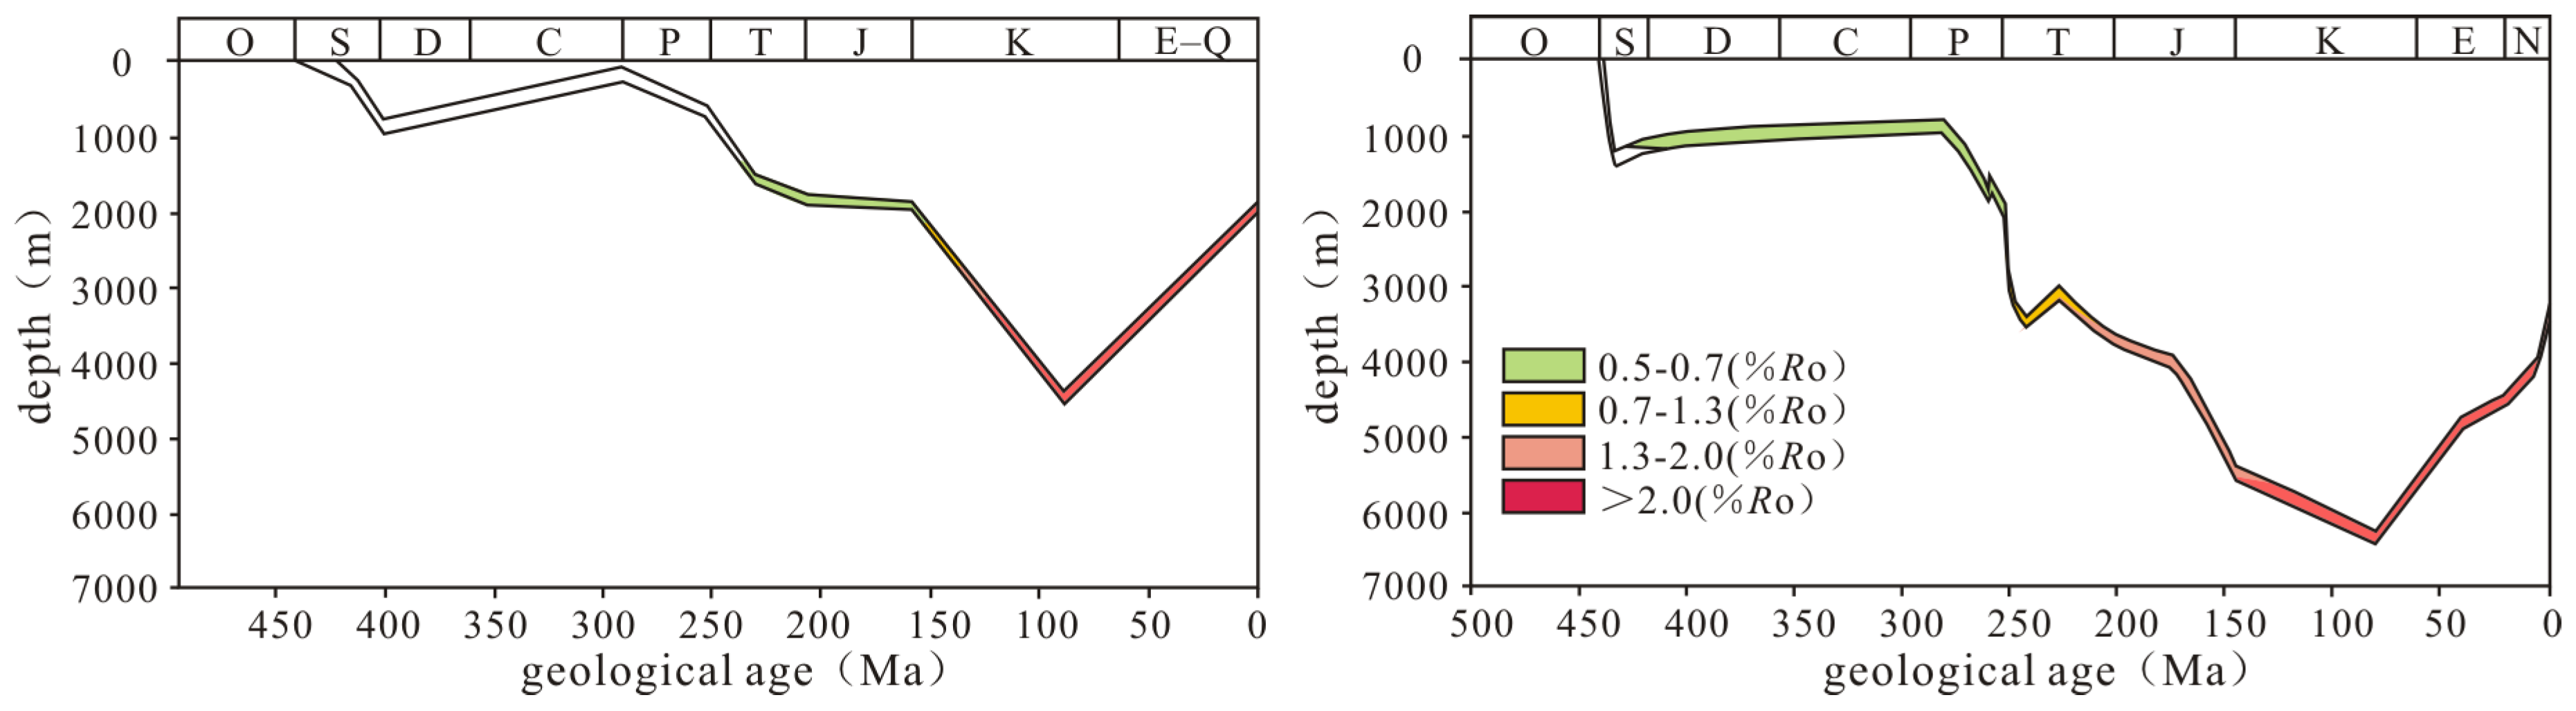
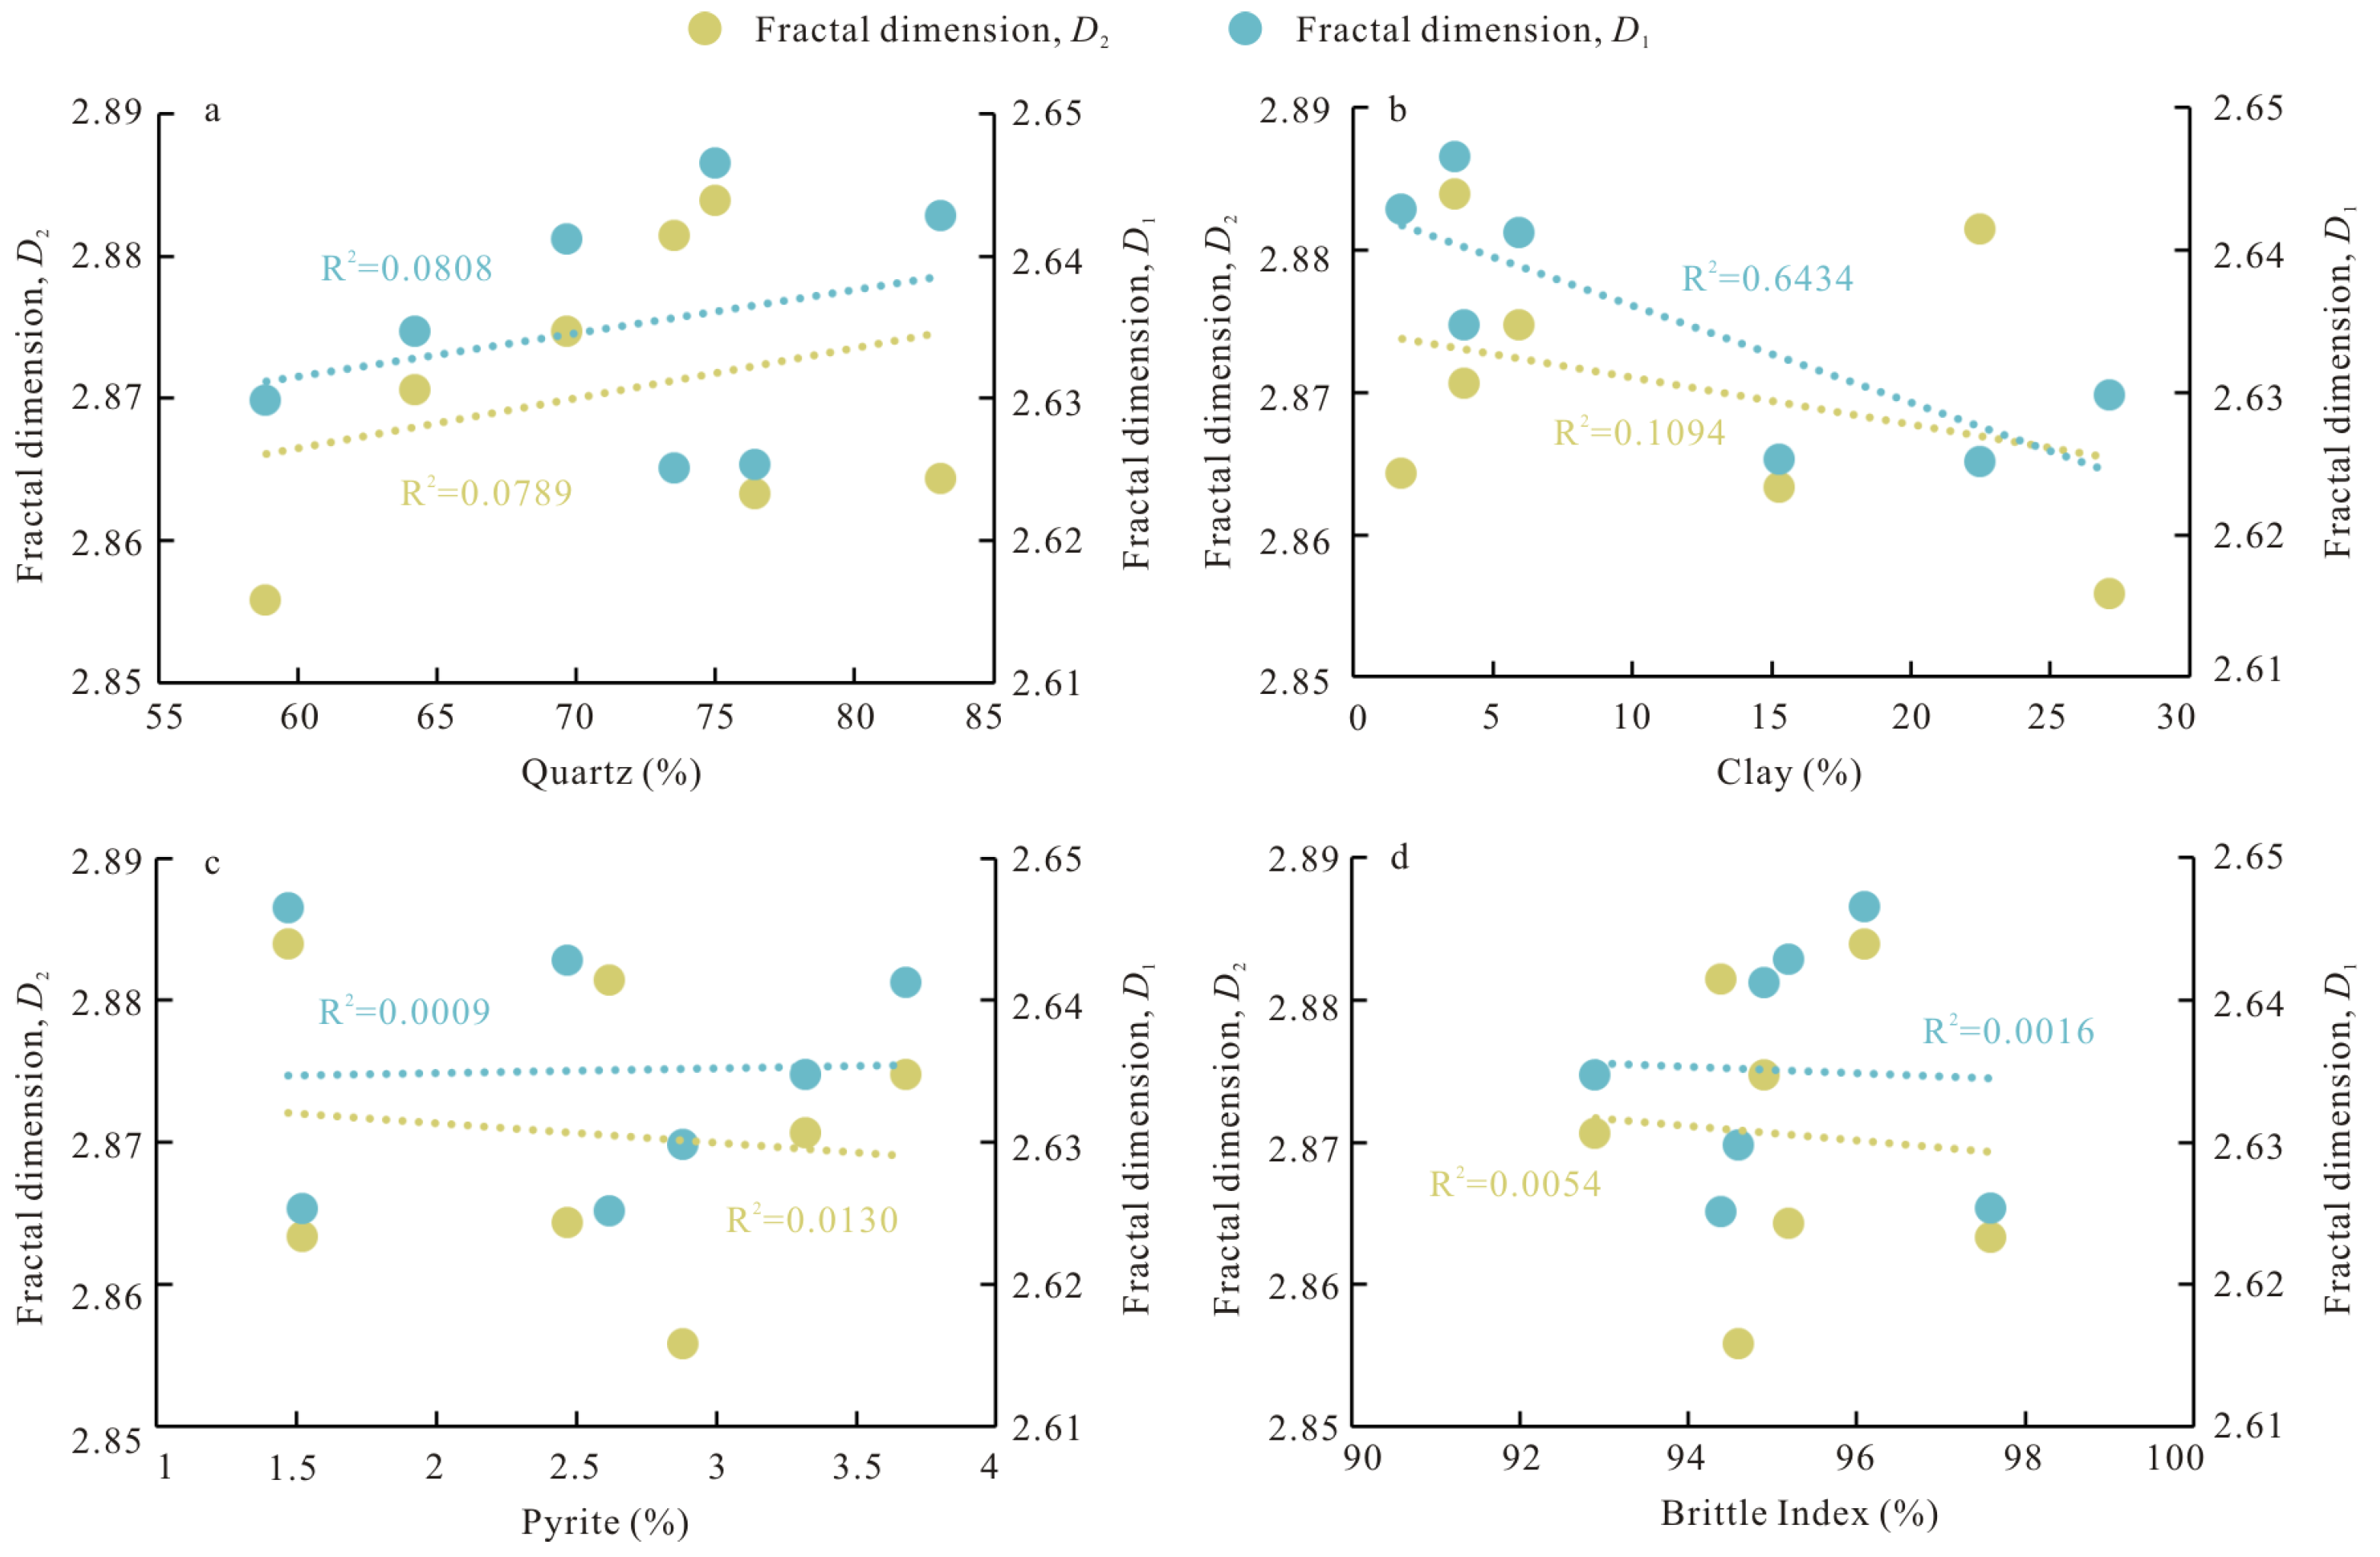
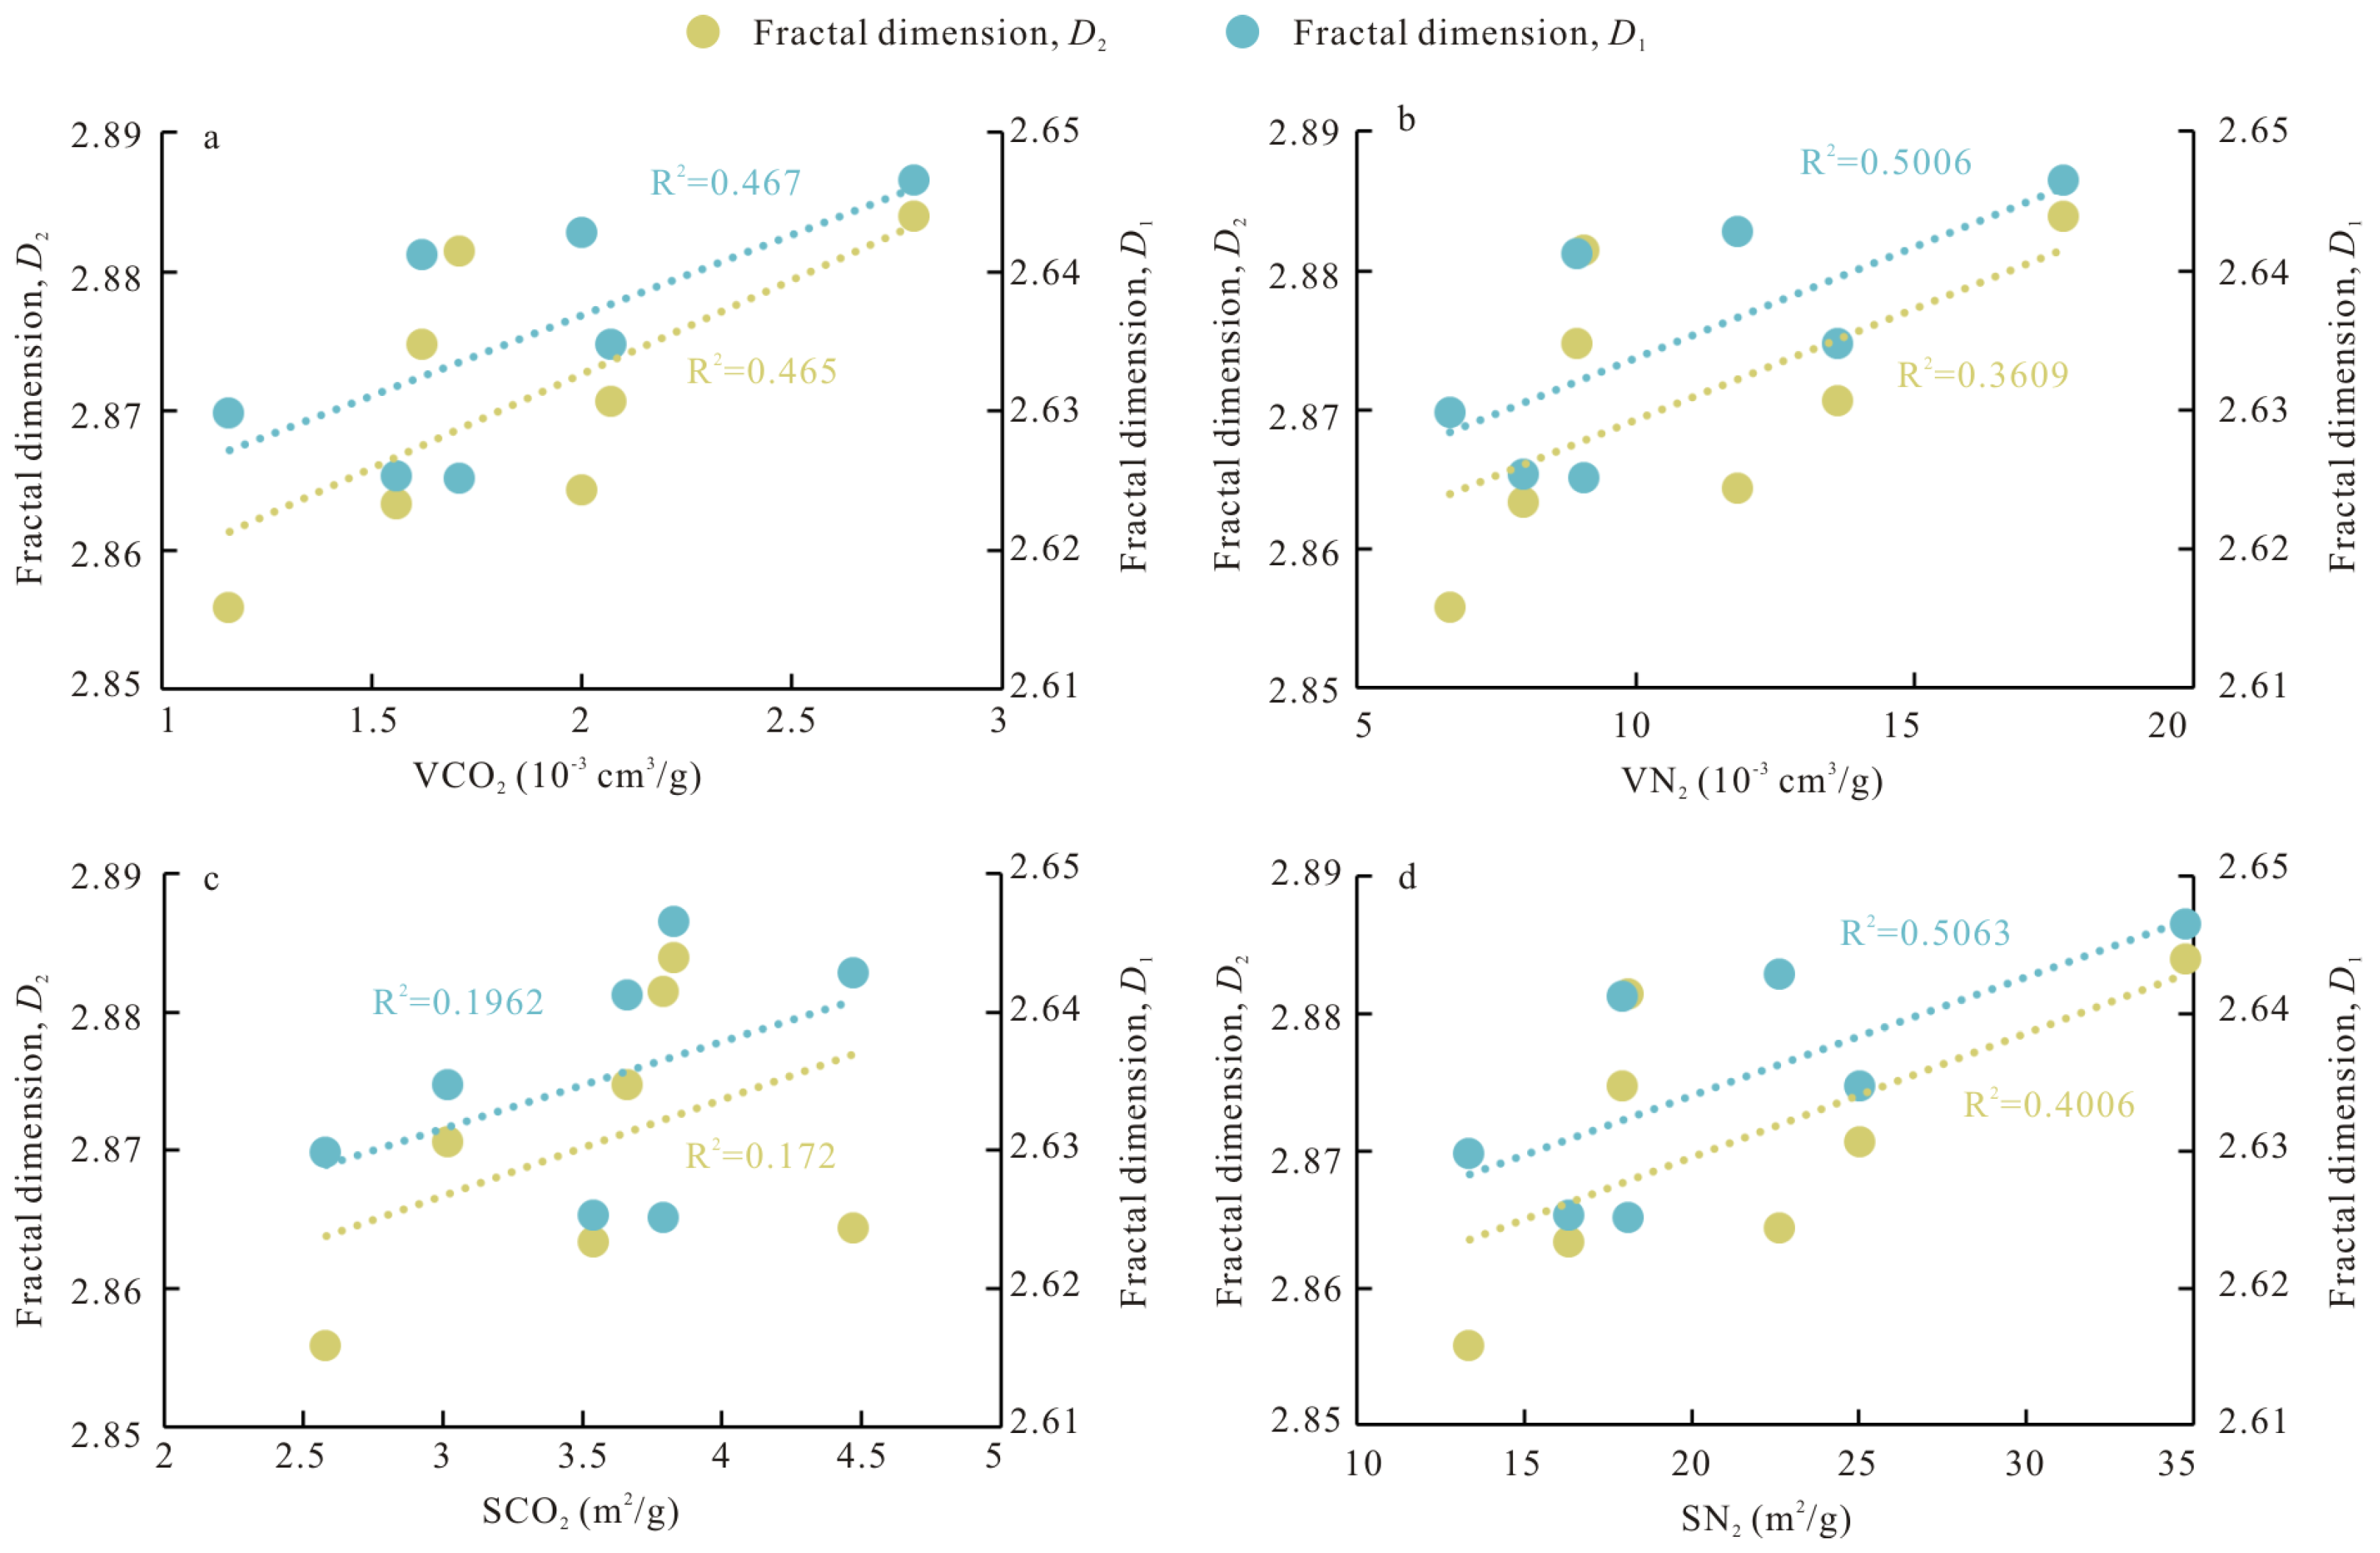

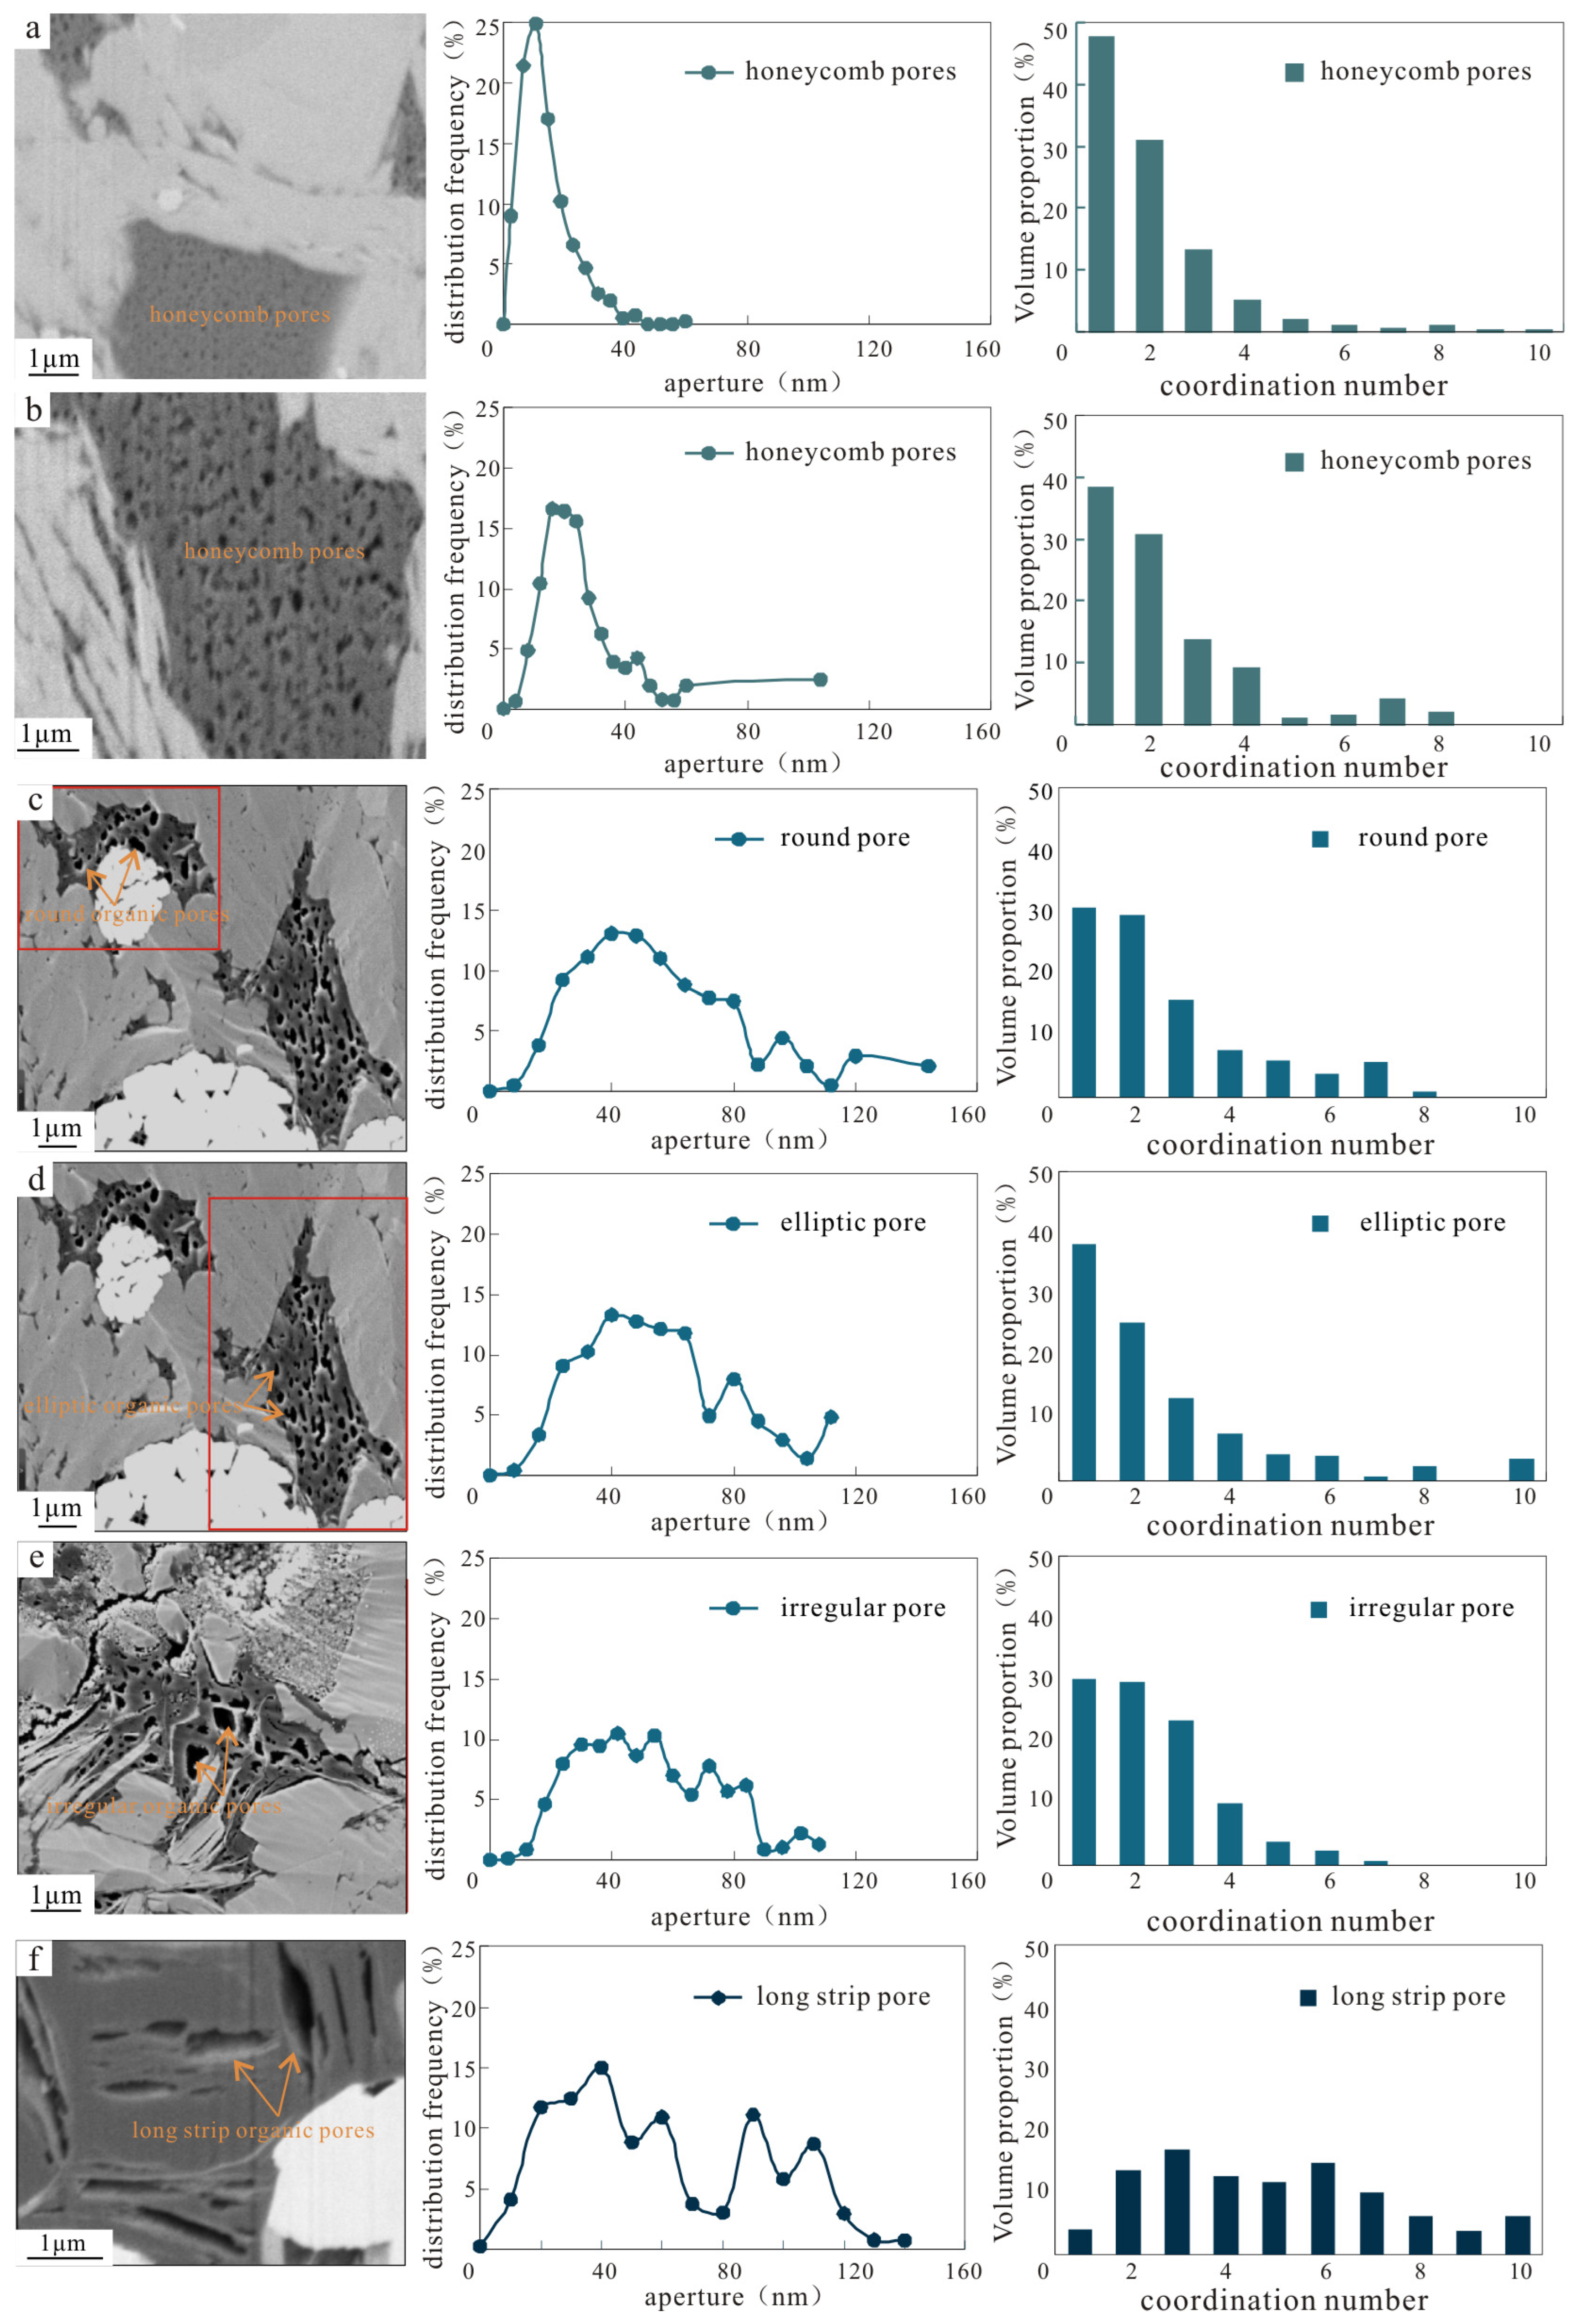
Disclaimer/Publisher’s Note: The statements, opinions and data contained in all publications are solely those of the individual author(s) and contributor(s) and not of MDPI and/or the editor(s). MDPI and/or the editor(s) disclaim responsibility for any injury to people or property resulting from any ideas, methods, instructions or products referred to in the content. |
© 2024 by the authors. Licensee MDPI, Basel, Switzerland. This article is an open access article distributed under the terms and conditions of the Creative Commons Attribution (CC BY) license (https://creativecommons.org/licenses/by/4.0/).