Article

Fractal Characterization on Three-Dimensional Tortuosity of Fault Tectonic

by
Runsheng Lv
1,2,
Xinya Han
1,
Gaofeng Liu
1,2,*,
Zhen Zhang
1,3,
Jia Lin
3,
George Barakos
3 and
Ping Chang
3,*
1
School of Resources and Environment, Henan Polytechnic University, Jiaozuo 454003, China
2
Collaborative Innovation Center of Coal Work Safety and Clean High Efficiency Utilization, Henan Polytechnic University, Jiaozuo 454003, China
3
WA School of Mines: Minerals, Energy and Chemical Engineering, Curtin University, Kalgoorlie, WA 6430, Australia
*
Authors to whom correspondence should be addressed.
Fractal Fract. 2024, 8(10), 572; https://doi.org/10.3390/fractalfract8100572
Submission received: 24 August 2024 / Revised: 25 September 2024 / Accepted: 28 September 2024 / Published: 29 September 2024
(This article belongs to the Special Issue Fractal Analysis and Its Applications in Rock Engineering)

Abstract

:
Faults, as a kind of fracture tectonics, play a role in reservoir closure or provide oil and gas transportation channels. The accurate understanding of the distribution characteristics of faults is significant for oil and gas exploration. The traditional fractal dimension for fault number (Df3) cannot comprehensively characterize the complexity and heterogeneity of fault network distribution. In this paper, a fractal characterization method on three-dimensional (3D) tortuosity of fault tectonics is proposed based on 3D seismic exploration. The methodology is described in detail to establish the model on the fractal dimension for the 3D tortuosity of fault tectonics. The results show the proposed method of estimation of the DT3 displaying high accuracy and rationality. Compared with the traditional fractal dimension Df3, the proposed DT3 can comprehensively characterize the fractal characteristics of faults network systems in the 3D space. This study achieves a breakthrough in the fractal characterization of the 3D tortuosity of fault tectonics. It is worth further study for establishing an analytical fractal equation based on the DT3 and oil or gas transfer, which can provide the theoretical foundation and technical support for oil and gas exploration.

1. Introduction

Geological tectonics are crucial in the generation and distribution of hydrocarbons in oil and gas basins [1]. Faults, as classical fracture tectonics [2], can promote the gathering of hydrocarbons in their vicinity to form oil and gas reservoirs [3]. The strike–slip faults can connect the source rock with the oil recovery layer [4], providing paths for the aggregation of hydrocarbons in a wider range [5]. Therefore, an accurate understanding of the fault distribution characteristics is significant for the exploration of fracture zones in oil and gas basins [6,7].
Recently, mathematical analysis methods have facilitated the progress of fracture network systems from qualitative analysis to quantitative description [8,9]. As a tool for assessing measures of spatial occupation and irregularity of complex forms, the fractal theory has been widely used in the fields of geophysics, geology [10,11], minerals [12], etc. Scholars adopted fractal theory to explore the fault network system [13], a self-similar fractal system consisting of faults with different levels [14]. The complexity of the fault network system can be quantitatively characterized by extracting the fault parameters, specifying its fractal structure, and calculating the fractal dimension. Li et al. analyzed the mechanical properties of fissured coal under different gas pressures using crack length–quantity fractal dimensions [15]. Delphine Roubinet et al., combining fracture density and fractal dimension, created an inversion method that enables the deduction of the statistical characteristics of fracture networks from cross-borehole thermal experiments (CBTEs) [16]. Zhang et al. carried out quantitative statistical analyses of parameters such as the number of pores, pore throats, and coordination numbers and used fractal dimensions to analyze in depth the characteristics of microporous connectivity and the degree of development of coal [17]. Oynakov E and his team explored the distribution of these faults by analyzing earthquakes and their activity in the Balkans [18]. Xu et al. developed an analytical model of the pore and capillary structure of porous media based on fractal theory [19]. However, most previous studies have used the fractal dimension for fracture numbers to characterize the complexity of faults. Actually, faults not only have length, width, and openness in 3D space [20] but also form a series of curved channel networks as the tortuosity changes, as shown in Figure 1 [21]. Due to the high degree of opening of fracture activity, the equilibrium state of primary oil and gas reservoirs is often destroyed, and the fault becomes a channel for oil and gas transport [22,23]. Therefore, it is worth exploring a fractal characterization method on three-dimensional tortuosity of fault tectonics to accurately and comprehensively capture the complexity of their internal tortuosity.
In this study, the 3D seismic exploration technique is employed to derive the three-dimensional structure parameters of fault tectonics, by which the model on the fractal dimension for the 3D tortuosity of fault tectonics (DT3) is established, proposing a fractal characterization method on three-dimensional (3D) tortuosity of fault tectonics. The accuracy and rationality of the proposed method on estimation of the DT3 are verified. A comparative analysis of the proposed DT3 with the traditional fractal dimension Df3 is discussed. This study achieves a breakthrough in the fractal characterization of the 3D tortuosity of fault tectonics, which can provide the theoretical foundation and technical support for oil and gas exploration.

2. Objects and Methodology of Research

2.1. Methodology

The tortuosity τ is the ratio of the seepage channel’s distance to the porous medium’s length in which it is located [24]. It depicts the actual path the mass point follows within the opening while the seepage fluid moves a one-unit distance through the medium [25]. As shown in Figure 2, tortuosity is one of the key parameters for studying the fracture structure of rocks, and it can also be applied to fault fracture channels [26]. It is usually defined as Equation (1).
τ = L t / L
The porosity ϕ of a two-dimensional fault can be determined by comparing the total area (Afracture) of the fault to the mining zone’s area (Amedia), as shown in Equation (2) [27,28].
ϕ = A f r a c t u r e A m e d i a
In 3D space, fault porosity ϕ can be determined by comparing the volume of the fault (Vfault) to the total volume of the zone it occupies (Vtotal), based on the definition of the 3D fracture porosity [29,30]. This means that the porosity of a fault in 3D space can be represented as the proportion of the fault’s overall volume to the volume of the geological unit, as illustrated in Equation (3). Both Vfault and Vtotal can be obtained through the geological data of the 3D seismic exploration.
ϕ = V f a u l t V t o t a l
The average fault tortuosity τav is a key parameter reflecting the tortuosity of 3D faults, which can be used to estimate by ϕ in Equation (3), based on the definition of the average fault tortuosity of the fracture [31].
τ av = 1 2 1 + 1 2 1 ϕ + 1 ϕ ( 1 1 ϕ 1 ) 2 + 1 4 1 1 ϕ
where ϕ is the fault fissure degree; Afracture and Amedia are the areas of the fault and the area of the mining area in 2D space, respectively; Vfault and Vtotal are the volume of the fault and the volume of the mass unit where the fault is located in 3D space. In addition, the four parameters can be derived from the 3D seismic exploration data [32,33].
The faults’ length in each unit (l) is measured and the count of faults is equal to or larger than l, represented by N(l). The fault network has a certain regularity [34,35]. The probability density function’s range of the fracture network f(l) can be represented by Equation (5) [36].
f ( l ) = D f l m i n D f l ( D f + 1 )
The relationship between l and N(l) is shown in Equation (6) [37].
N ( l ) l D f
Taking the logarithm on both sides gives Equation (7).
log N ( l ) = D f log l + C
where N(l) represents the faults’ lengths that are equal to or greater than l; l indicates the fault length; Df is the fractal dimension of the fault count, while C is a constant. The values of l and N(l) can be obtained from the geological exploration data of the 3D seismic exploration.
Fracture channels in faults can be characterized by the tortuosity fractal dimension DT3, as shown in Equation (8).
τ ( l ) = L t ( l ) L = L l D T 1
The average fault tortuosity in three dimensions can be calculated by Equation (9) [38].
τ av = l min l max τ ( l ) f ( l ) d l = D f 3 D f 3 + D T 3 1 ( L l min ) D T 3 1
As shown in Equation (9), τav is a function of Df3, DT3, and lmin. Thus, taking the logarithm of Equation (9) yields an implicit expression for computing DT3, as shown in Equation (10). Equation (10) can be transformed into Equation (11).
D T 3 = 1 + ln τ av ( D f 3 + D T 3 1 ) D f 3 ln L l min
1 + ln τ av D f 3 + D T 3 1 D f 3 ln L l min D T 3 = 0
where τav can be derived from Equation (4); Df3 can be fitted by Equation (7); L and l can be measured by the geological exploration data of the 3D seismic exploration.
For the calculation of DT3 for each geological unit, we divided it into the following three steps: (a) Basic data were measured by a 3D seismic exploration. Basic data include the length (l) and dip (θ) of each fault, the number of faults with a length longer than or equal to l, and the minimum length (lmin) and maximum length (lmax) of each fault, which were derived by comparison; (b) The key parameters are calculated from the derived model. Key parameters include fault volume (Vfault), geological unit volume (Vtotal), fault porosity (ϕ), average fault tortuosity (τav), and fractal dimension of the number of faults (Df3). We drew Figure 3 for easy understanding of the calculation process of DT3.

2.2. Research Object

The research object is from Tianchi Coal Mine in Shanxi Province of China, and its geographic coordinates are 113°28′14″~113°29′14″ East and 37°14′45″~37°15′53″ North. The whole mine is circled by 26 coordinate points, with a length of 7.5 km, a width of 3.5 km, and an area of 17.9103 km2.
Tianchi Coal Mine is in the eastern part of Qingshui Basin, east of Taihangshan Fracture and Taihangshan Uplift Zone. Since the beginning of the Indo-Chinese movement at the end of the Triassic period, the region entered a period of tectonic activity and subjected the Paleozoic coal seams to relatively strong modification. However, there are some differences in the characteristics of tectonic action and the nature of tectonic movement during different periods of tectonic movement. Thereby, tectonics of different nature, direction, and period have also been formed within the well field, which tends to complicate the faults in each geological unit. The result is that the porosity of faults varies within different geological units.

2.3. Geological Prospecting by the 3D Seismic Exploration

Three-dimensional seismic exploration is a high-density area exploration technique, which uses the flexible combination of gun points and wave detectors to obtain a grid of evenly distributed CDP points. This time, our exploration work was divided into the following three main parts: (a) Exploration and acquisition of field seismic data: The data were acquired using a seismic exploration data collector, and the target layer for acquisition was near the coal seam. Data collection requires staff to carefully plan and manage the location, depth, and quantity of explosives for each borehole. Explosives were placed in pre-planned locations while each location was recorded; (b) Processing of data exploration information: Data processing in the region was carried out in our team’s computing center, using the seismic data processing software in version 7.1 of CGG’s Geovecteur Plus. To ensure the high resolution and fidelity of the seismic results, it is important to focus on the following steps: Establishment of spatial properties, surface coherence, amplitude compensation, speed analysis, etc; (c) explanation of data and information: Interpretation of 3D data is based on 3D stereoscopic data bodies, and the interpretation process is realized on workstations. The known geological information and logging information are combined for a comprehensive interpretation. Figure 4 displays the arrangement of the gun checkpoints for this 3D seismic exploration.
During 3D seismic exploration, the receiver line distance affects the number of explorations covered and the density of data. In complex near-surface conditions, the selection of an appropriate receiver line distance is particularly important for improving imaging quality. The size of the shot interval affects the imaging accuracy of the subsurface target body. Smaller shot intervals improve the lateral resolution of the data and help to delineate subsurface structures more finely. Imaging accuracy has a direct impact on the accuracy of exploration data acquisition and processing, which in turn has an impact on the accuracy of DT3 calculations. Table 1 presents the specific parameters of the system. The 408 UL digital seismometer is used, and the instrument parameters are set as follows: Sampling interval: 0.5 ms, recording length: 1.5 s, pre-amplification gain: 18 db, recording band: full-band reception. The whole area is stimulated by a single well with a depth of 10 m and a dosage of 1.5 kg/well. Four 100 Hz geophones are used for the receiving device, and a total of 3749 physical points of seismic production are designed for this exploration. The seismic data were processed by the GEOVECTEURPLUS software package [3].

3. Results and Discussion

3.1. Analysis of Faults by 3D Seismic Exploration

According to the geological exploration data of the 3D seismic exploration, the total number of faults is 37 in the mine. Among them, there are 12 faults with a drop of less than 5 m, 9 faults with a drop of 5–10 m, and 16 faults with a drop of more than 10 m. The section strike is mainly NE direction, partly NNE direction, NS direction, and rarely NW direction. The tendency is variable, but mainly NW or SE. The length of the faults with drops greater than 10 m ranges from 140 to 940 m with an average of 405 m, and the drop ranges from 10 to 25 m with an average of 13.9 m.
As shown in Figure 4, we divided three mining area ranges as the study objects, which are recorded as geological units Ⅰ, Ⅱ, and Ⅲ, respectively. The whole mining field range is recorded as geological unit Ⅳ. Using the length l, drop H, and dip θ of each fault measured by geological exploration, the horizontal break is obtained by using the relationship between dip and drop. The steps for deriving the volume of the faults are as follows: (a) The horizontal break of the fault is obtained by using the relationship between drop and dip; (b) the volume of the faults is obtained by multiplying the drop, the horizontal break, and the length of the interval; (c) the measured volume of the faults within each geological unit is added up, and the total volume of the faults within geological units I, II, III, and IV is 779,193.9221, 281,160.8316, 42,179.90738, and 1,102,534.66108 m3, respectively. Then we can obtain that the volumes of the units in which the faults are located are 14,430,150, 10,612,800, 2,324,118, and 27,367,068 m3 by using the maximum difference between the area of the geological unit and the elevation of the fault. Finally, the values of fault porosity ϕ can be calculated by Equation (8).
The tectonic distribution of the mine is generally in the form of monoclinic tectonics with a northeast direction and northwestward inclination with little undulation, on which there are small folds, faults, and trap columns developed, as shown in Figure 5.

3.2. Key Parameters of Faults Derived by 3D Seismic Exploration

The geological exploration data were used to derive the key parameters for calculating the fractal dimension DT3 of the 3D fault tortuosity in the mine. The lmin and lmax of the geological units can be derived from the measurements. As shown in Table 2, the minimum fault lengths lmin of geological units Ⅰ, Ⅱ, Ⅲ, and Ⅳ are 55, 35, 59, and 35 m, respectively. The value of lmin of geological unit Ⅲ is the largest, followed by that of the geological units Ⅰ, Ⅱ, and Ⅳ, where those of geological units Ⅱ and Ⅳ are equal. Similarly, the maximum fault lengths lmax are 940, 670, 598, and 940 m, respectively. The values of lmax of geological units Ⅰ and Ⅳ are equal and largest, followed by that of geological units Ⅱ and Ⅲ. The ϕ is calculated from Equation (3) to obtain the 3D fault porosity of geological units Ⅰ, Ⅱ, Ⅲ, and Ⅳ. As shown in Table 2, the values of the 3D fault porosity (ϕ) of geological units Ⅰ, Ⅱ, Ⅲ, and Ⅳ are 0.05399, 0.02649, 0.01815, and 0.04029, respectively. The value of ϕ of geological unit Ⅰ is the largest, followed by that of the geological units Ⅳ, Ⅱ, and Ⅲ in that order. The average fracture torsion (τav) of each geological unit can be calculated from Equations (1) and (4). As shown as Table 2, the values of τav of geological units Ⅰ, Ⅱ, Ⅲ, and Ⅳ are 9.64131, 19.25248, 27.91459, and 12.79030, respectively. The value of the average fracture torsion (τav) of geological unit Ⅲ is the largest, followed by that of geological units Ⅱ, Ⅳ, and Ⅰ.

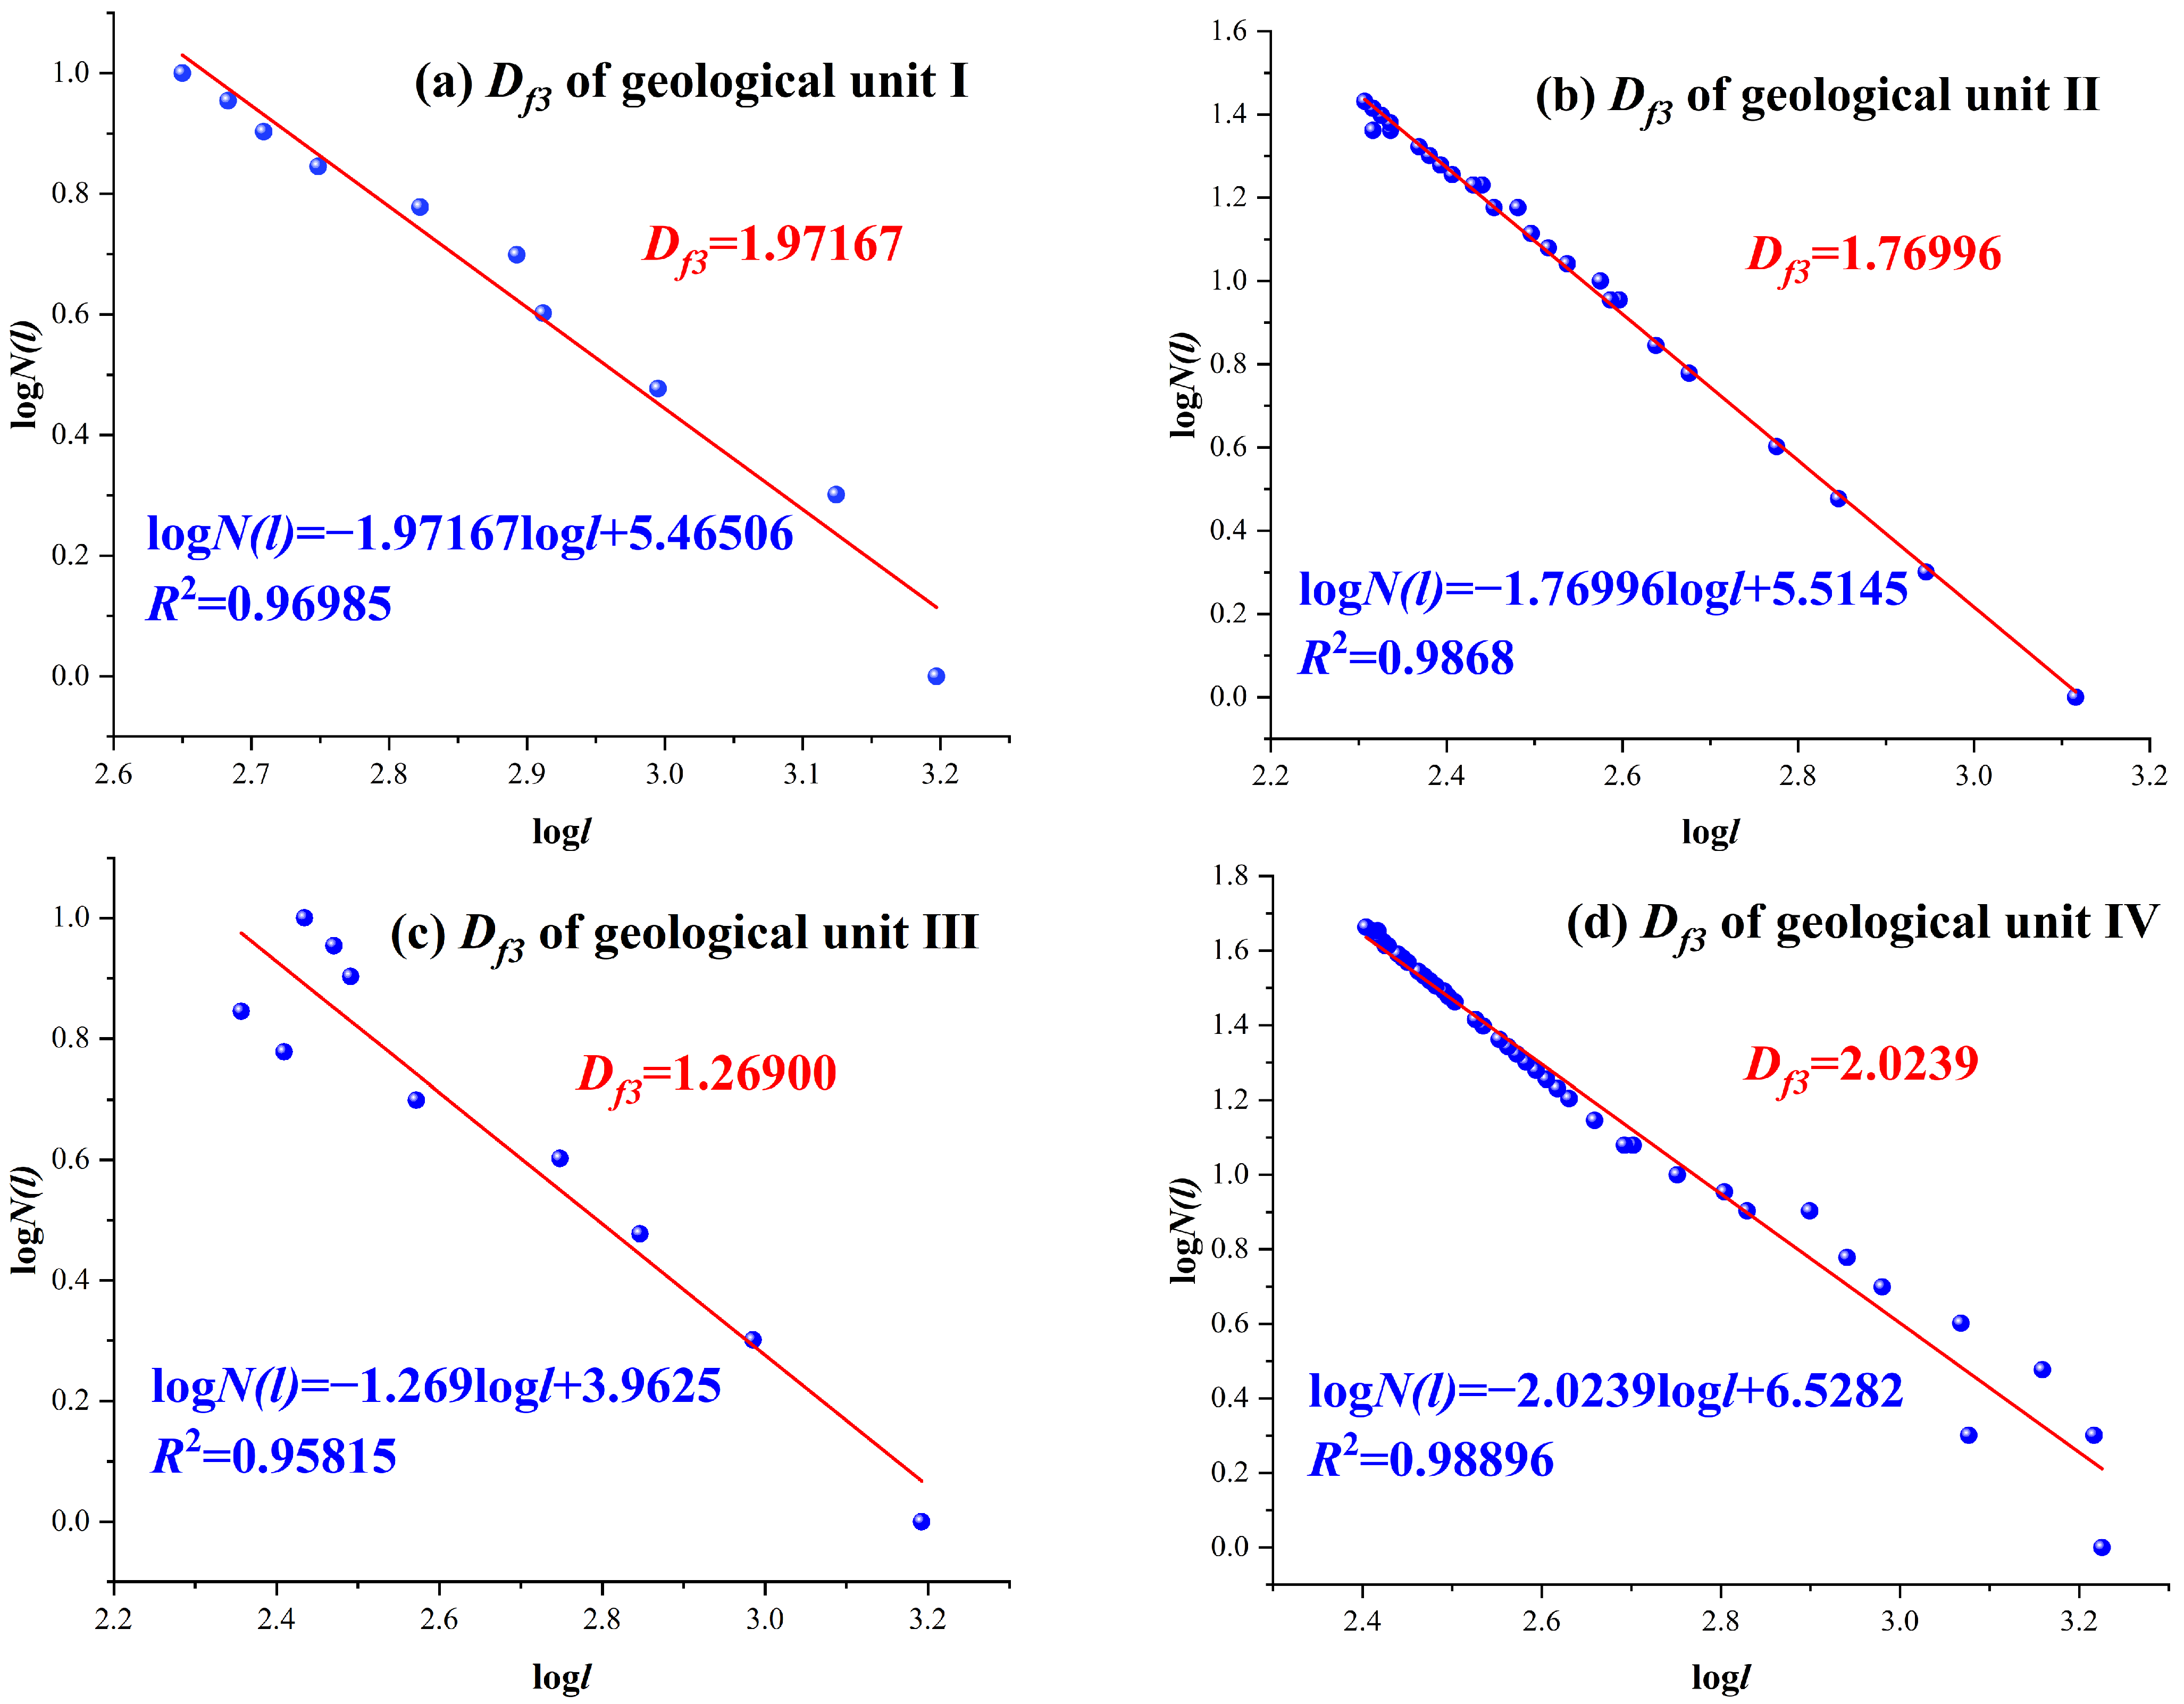
3.3. Estimation on Df3

According to Equation (7), Df3 of each geological unit can be fitted. As shown in Figure 6, the Df3 of geologic unit Ⅰ, geologic unit Ⅱ, geologic unit Ⅲ, and geologic unit Ⅳ are 1.97167, 1.76996, 1.26900, and 2.02397, respectively. This indicates that geological unit IV has the most complex distribution of faults, while geological unit III has the simplest distribution of faults, from the perspective of the number of faults developed.

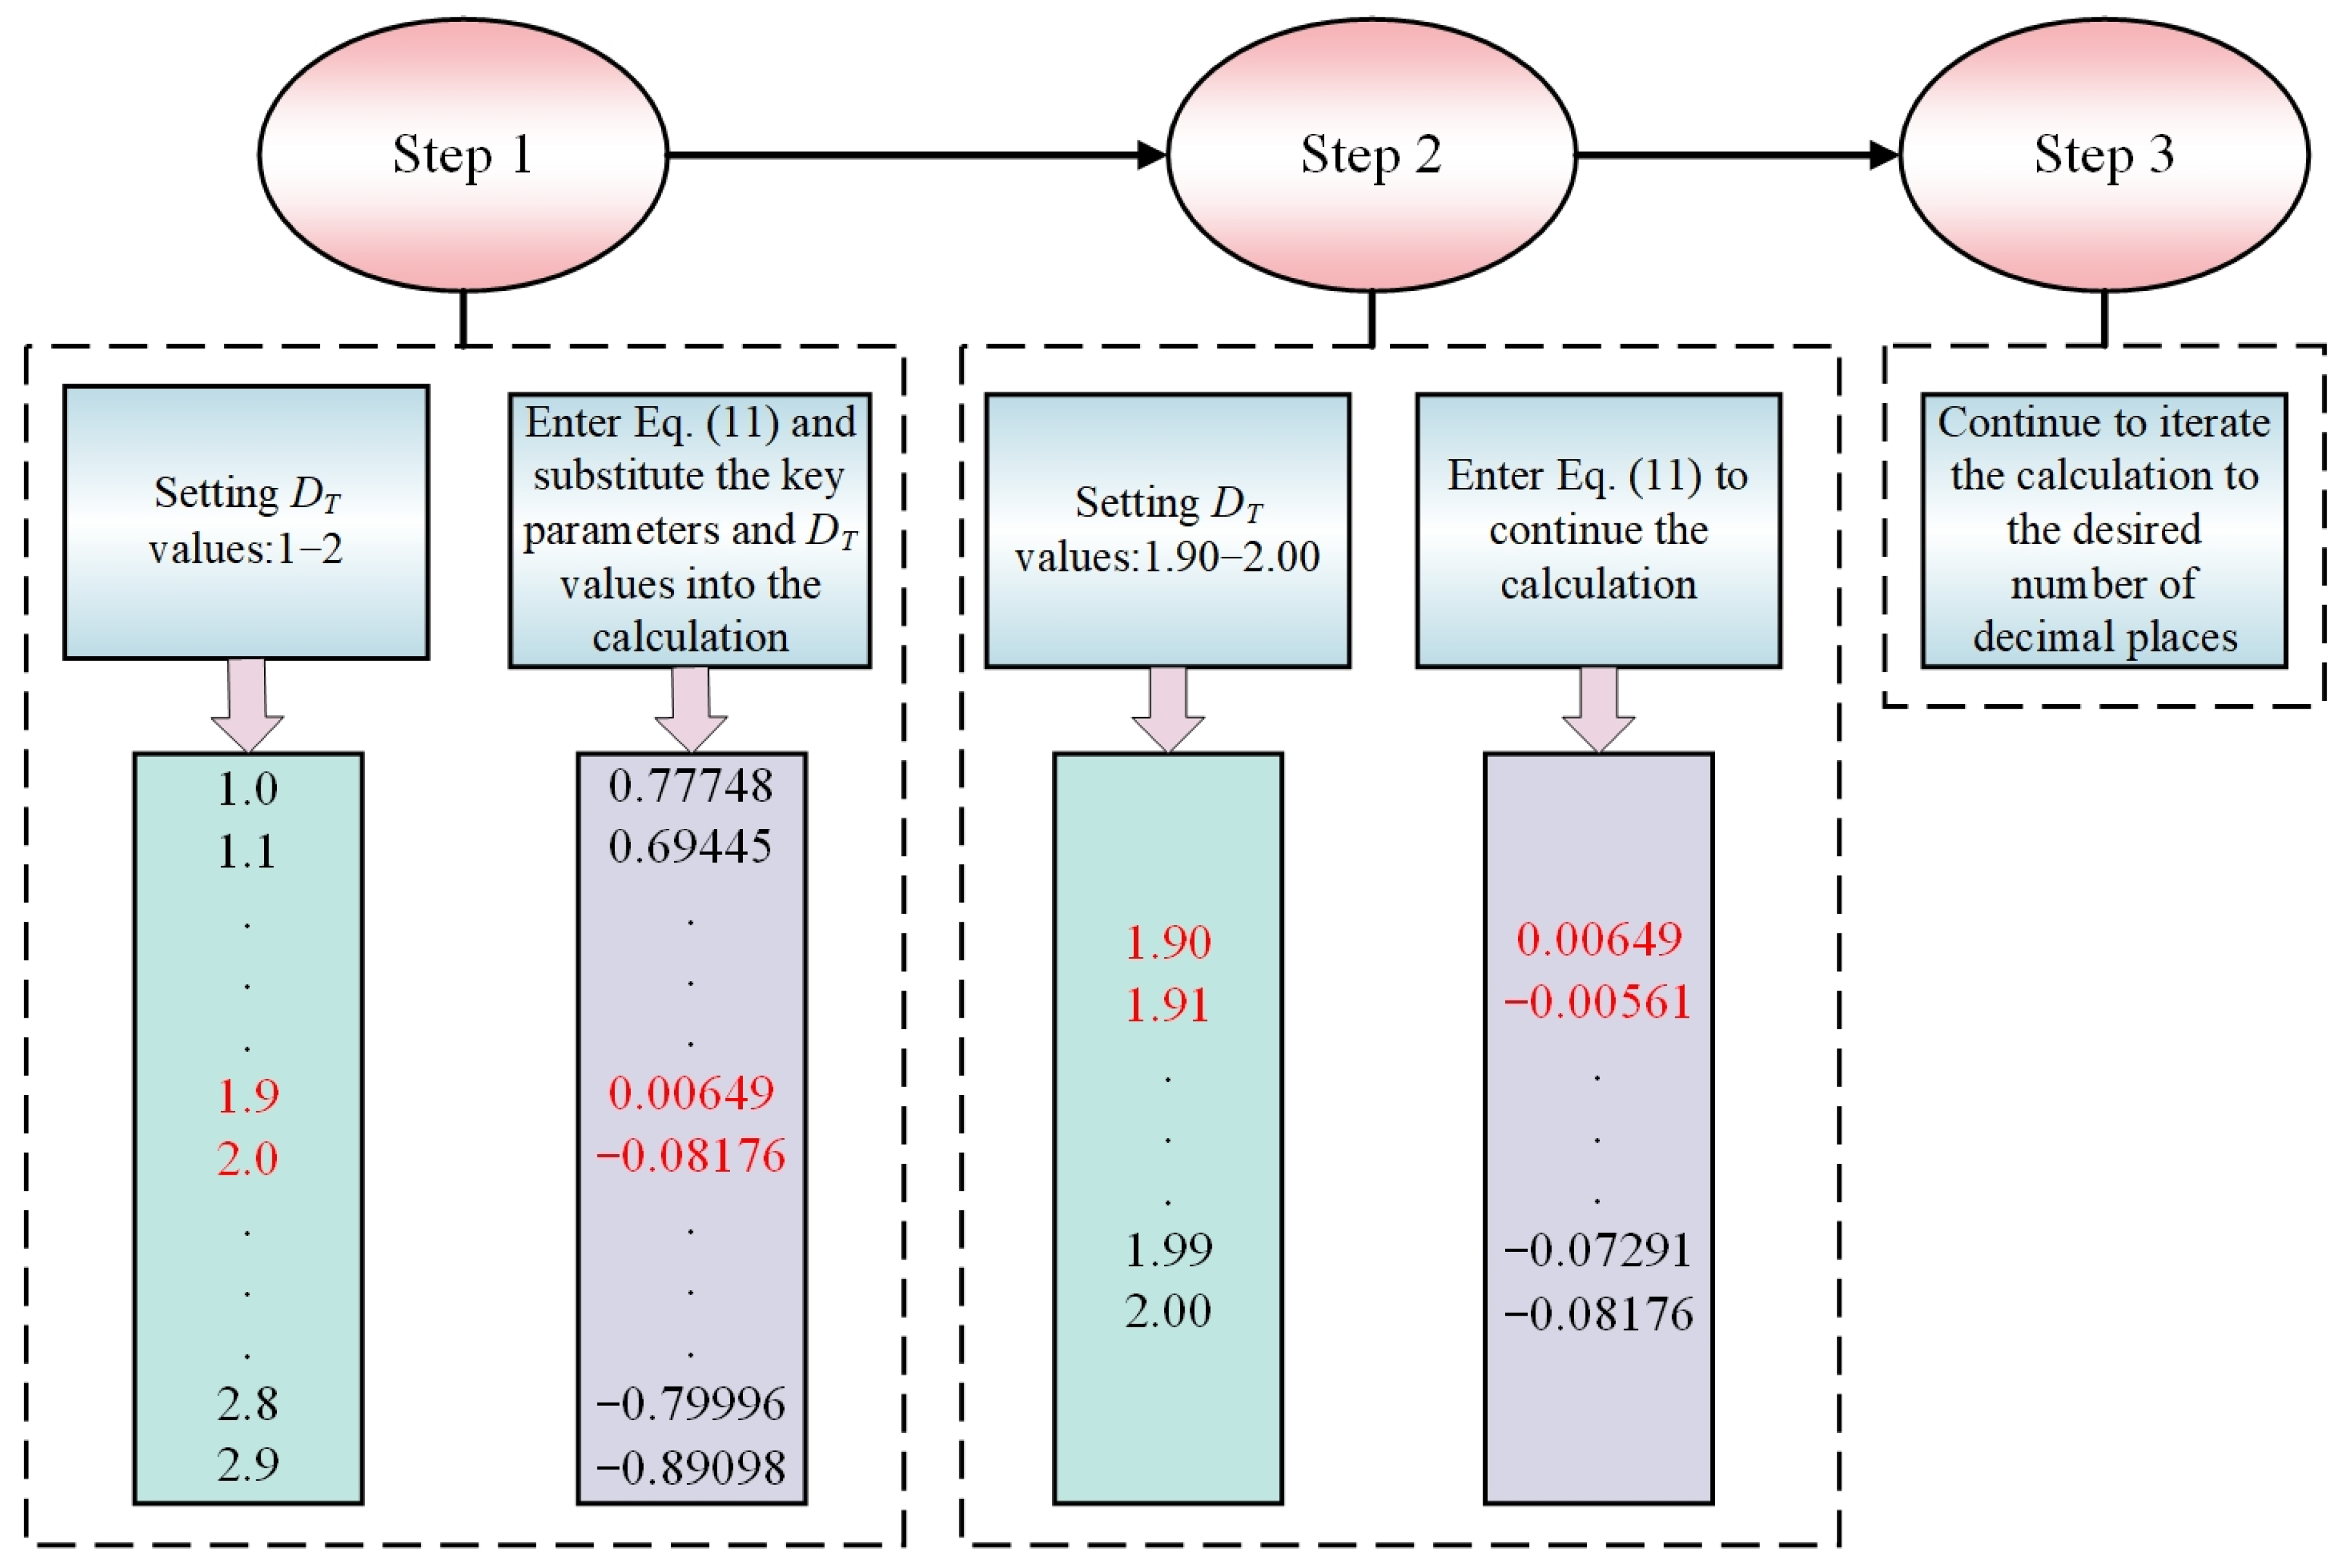
3.4. Estimation on DT3

According to the basic parameters of faults, we can determine the fractal dimension for 3D fault tortuosity (DT3) in the geological units by Equations (10) and (11). The detailed calculating process for the values of DT3 in the geological units is shown in Figure 7: (a) The first column is set with a series of DT values, which are 1, 1.1, 1.2, …, 2.8, 2.9, and the second column edits Equation (11) to bring in the known parameters from Table 1, leaving only the DT for the variables, and then edits the DT from the first column into Equation (11). There must be two DT3 values such that the equation has a value between one positive and one negative, and then the solution to DT3 must lie between the two DT3 values; (b) find the two DT values, e.g., between 1.9 and 2.0, and set up a series of columns of data from 1.90, 1.91, 1.92, …, 1.99, 2.00, and again find the two DT values that make the above formula between positive and negative, e.g., between 1.90 and 1.91, and then set up another series of data columns from 1.350, 1.351, 1.352, …,1.359, 1. 360, and again find the two DT values; (c) make the above equation between positive and negative, and then repeat the iteration until the required number of decimal places have been calculated to obtain the value of DT3. By iterating the calculation, the DT3 for geological units I, II, III, and IV are 1.90737, 1.96026, 2.10998, and 1.69579, respectively.

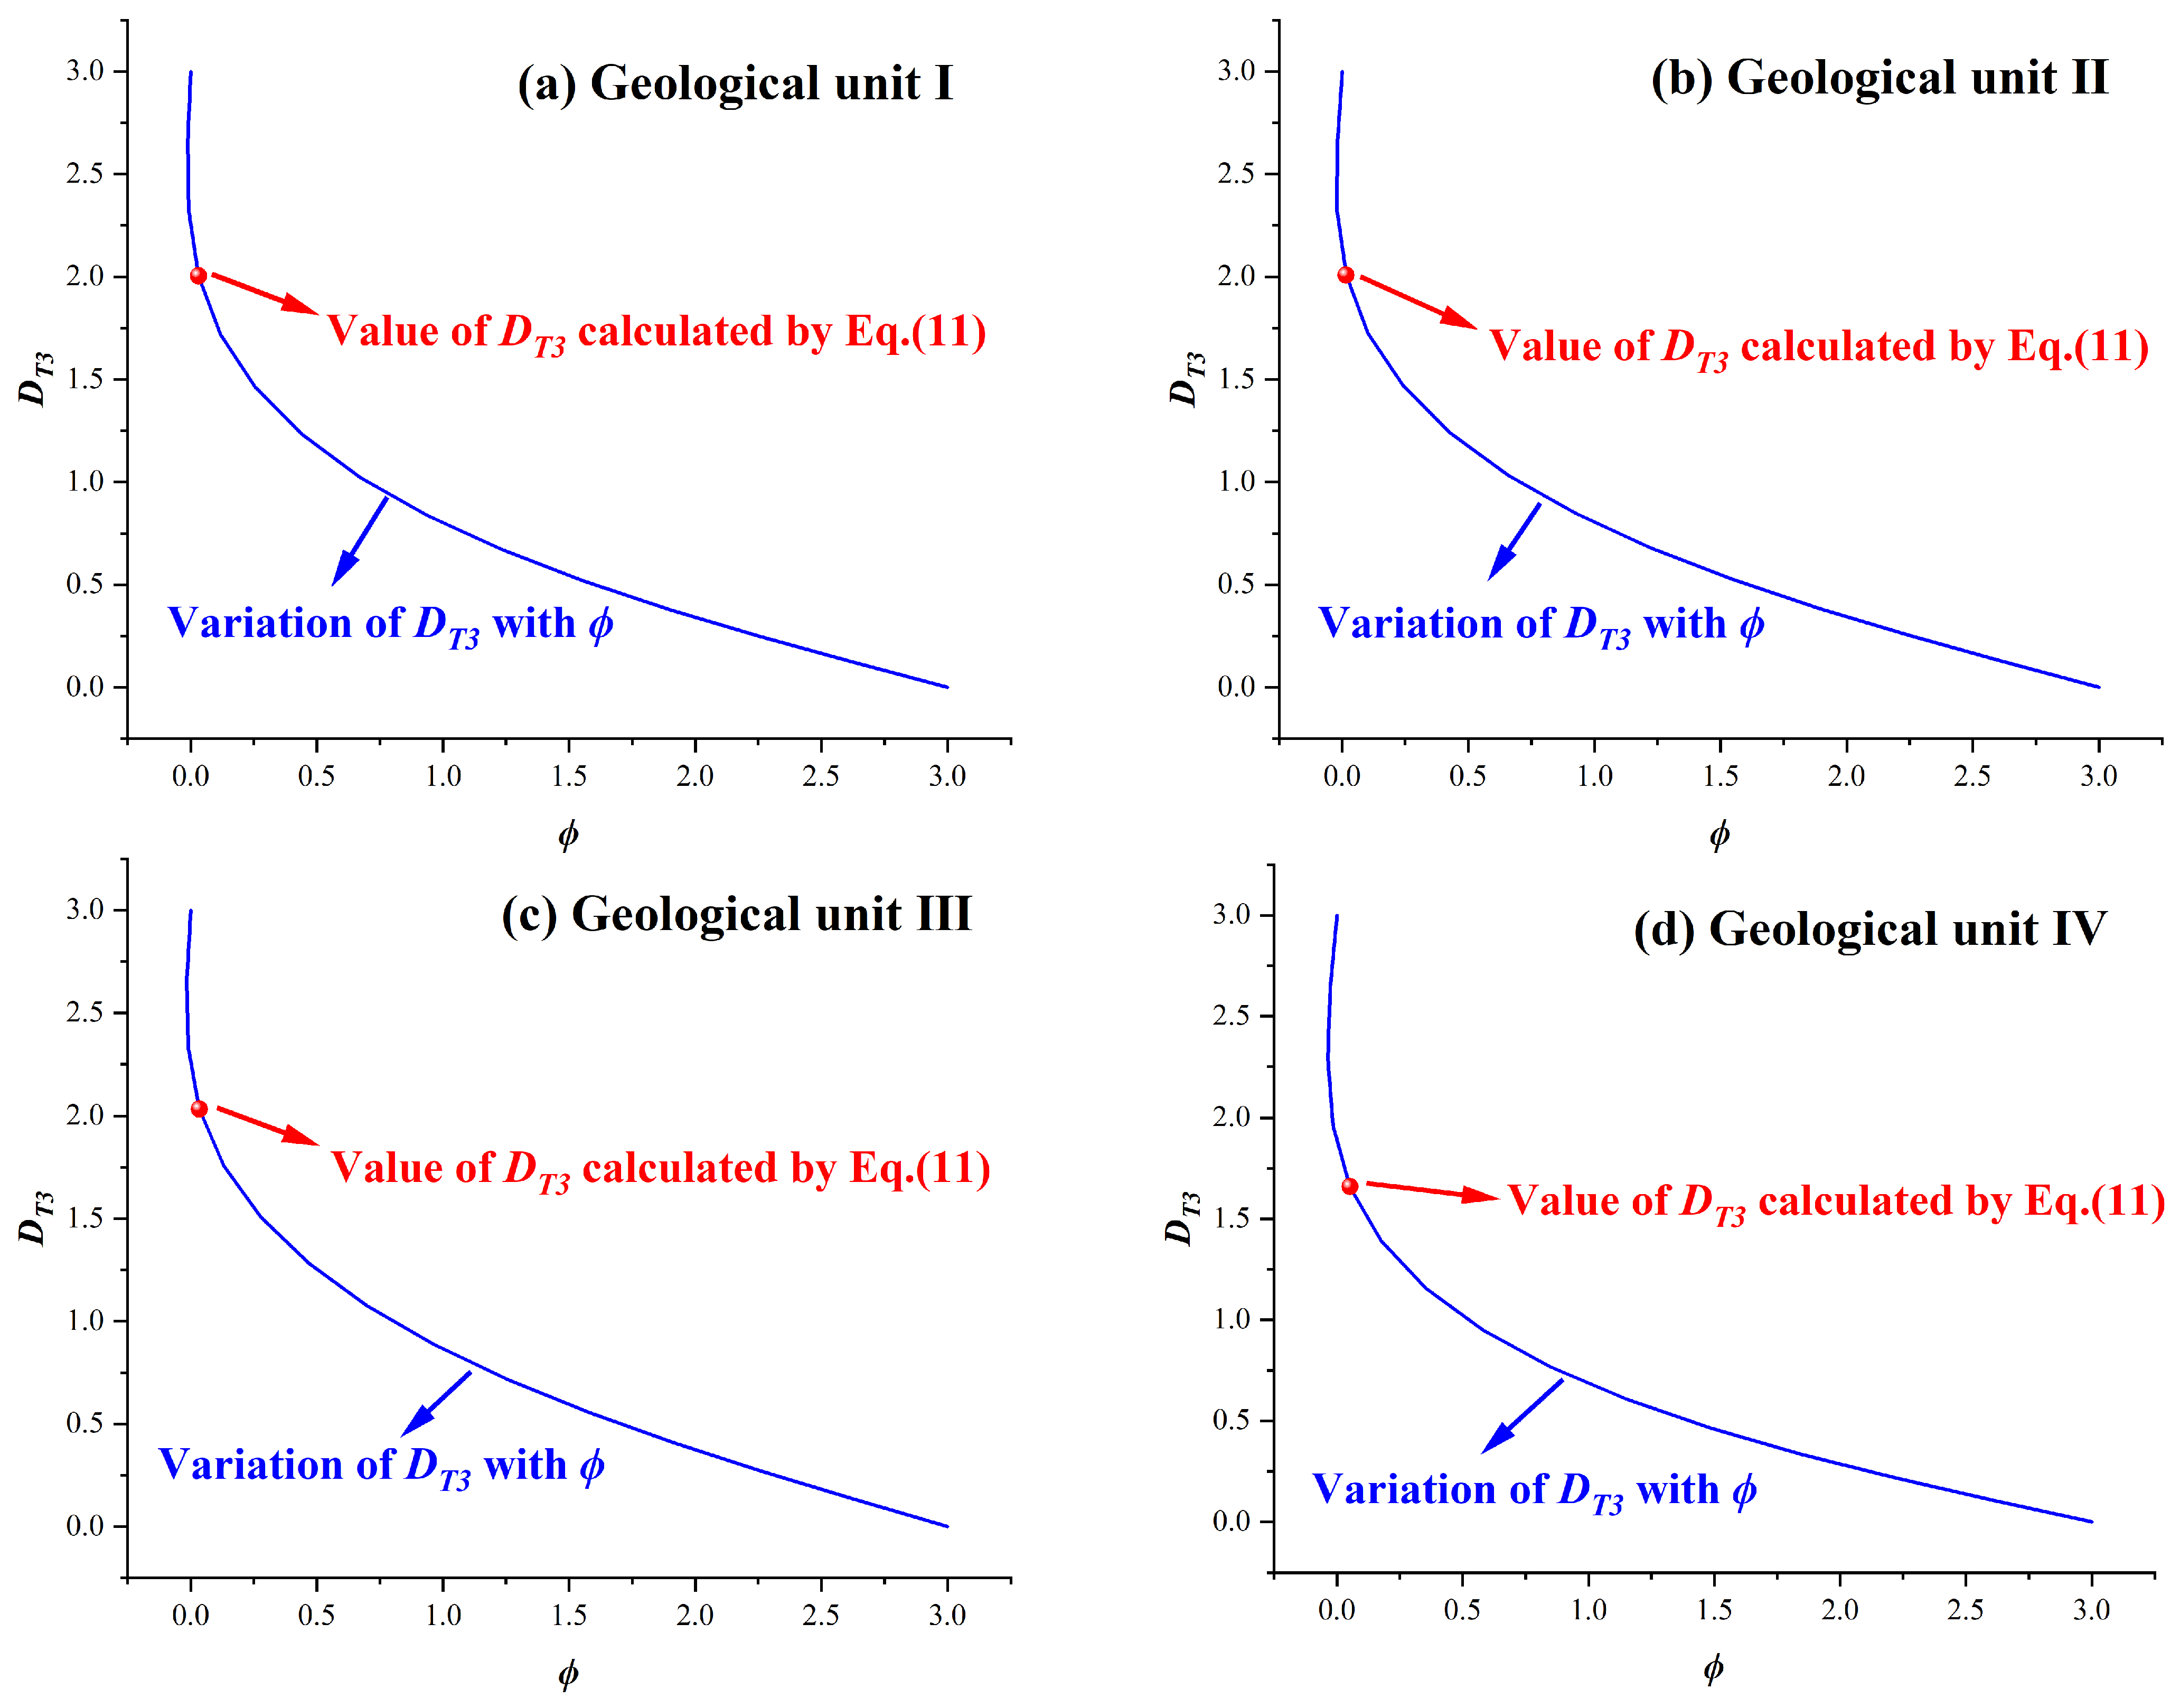
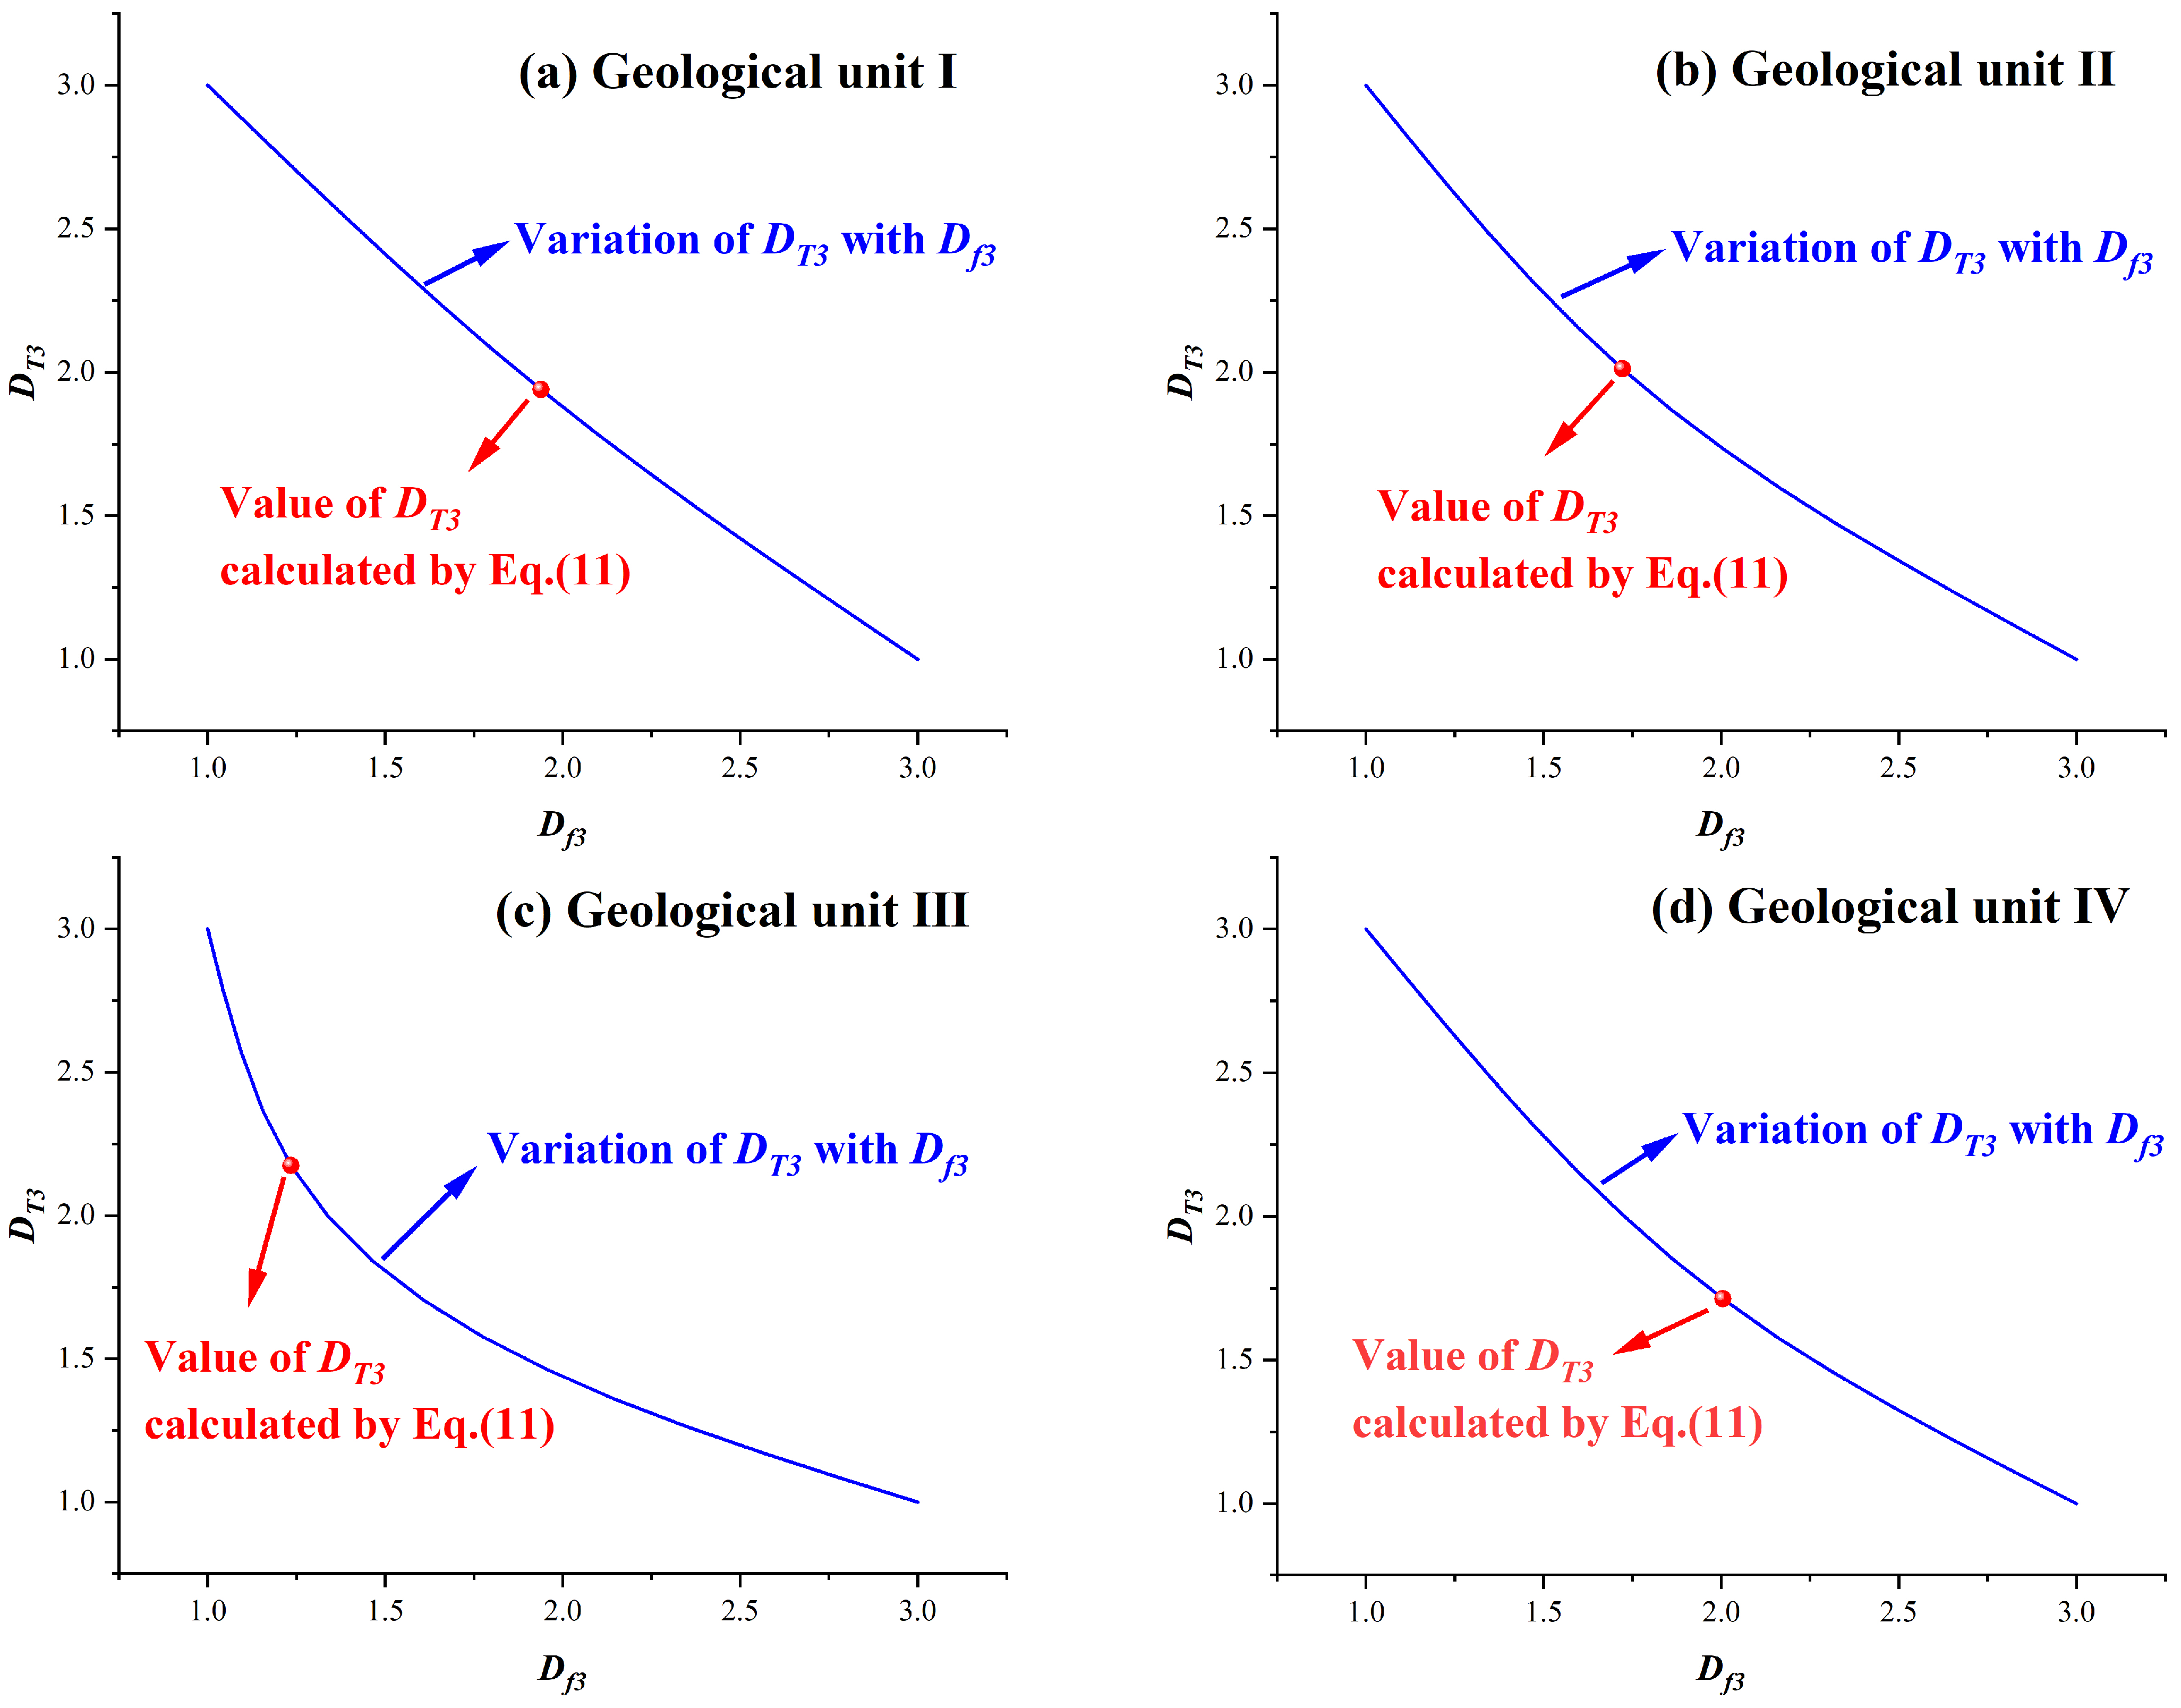
3.5. Validation of the Calculation Method on DT3

Previous studies have demonstrated the classical correlation between fractal dimension for fracture tortuosity and fracture porosity [39]. Inspired by them, we plotted the variation curves of the fractal dimension for fault tortuosity (DT3) versus the fault porosity (ϕ). As shown in Figure 8, DT3 decreases with ϕ increasing, and the values of DT3 marked with red dots coincide with the classical correlation between fractal dimension for fracture tortuosity and fracture porosity from the previous studies. Therefore, the above analysis supports the evidence on the validity of the proposed estimating method on DT3.
In addition, a previous study illustrated the relationship between the fractal dimension for the 3D fracture tortuosity and the fractal dimension for the 3D fracture number [40]. Inspired by the studies, we proceeded to compare the DT3 and Df3 of the fault by: (a) Deriving fault parameters (lmin, lmax, L) through 3D seismic explorations, calculating the fault volume, and determining the fractal dimension of the number of faults Df3; (b) Using Equation (3) to compute porosity and obtaining τav through the established relationship between porosity and average tortuosity in Equation (4); (c) Calculating DT3 by inputting the derived parameters (Df, lmin, L, τav) into Equation (11); (d) Employing fitting techniques to establish the correlation between DT3 and Df3 as illustrated in Figure 9.
In the process of building the DT3 model, we have taken Df3 as one of the important parameters. However, the characteristics of tectonic action and the nature of tectonic movement in different tectonic periods are different, making the tectonic nature, direction, and degree of meandering of each geological unit also different [41]. Df3 reflects the complexity of faults in the number of faults in each geological unit, and the larger Df3 is, the more complex the fault system is and the worse the rift connectivity is; DT3 reflects the complexity of fault tortuosity, the smaller DT3 is, the less tortuosity the fault system has, and the more favorable it is for oil and gas exploitation [42,43].
Figure 9 displaying DT3 shows a negative correlation with Df3. When the value of Df3 is close to 3.0, the value of DT3 will reach 1.0. The relationship between DT3 and Df3 is marked with red dots in Figure 9, which further proves the validity of the DT3 estimated. The values of DT3 with the red dot fit the relation of the DT3 versus the Df3 marked with the blue line in Figure 9, further indicating the rationality of the DT3.

3.6. Implication

The previous studies mainly focused on employing the Df3 for characterizing the complexity and heterogeneity of the fault network system from the perspective of the number of faults developed [44,45]. Compared with the above conventional fractal characterization method, the proposed fractal characterization method on the 3D tortuosity of fault tectonics can more accurately and comprehensively characterize the complexity and heterogeneity of the fault network system by considering the irregular shape and tortuosity of faults in the 3D space, which achieves a breakthrough in the fractal characterization on the fault network system. But, undoubtedly, Df3 is still an important parameter to characterize the complexity of the fault network system. Therefore, given the significant impact of fault complexity on the reservoir permeability [46,47] and gas transport [48,49], future studies can further explore the impacts on the transportation and occurrence of oil and gas exploration by using DT3 in combination with Df3, which can provide the theoretical foundation and technical support for oil and gas exploration. It should be noted that the proposed model on DT3 just considers the impact of fault tortuosity, not covering other factors such as the fault type, fault connectivity, fault throw, etc. Therefore, this is worth exploring with further studies.

4. Conclusions

In this study, a fractal characterization method on three-dimensional tortuosity of fault tectonics is proposed based on the 3D seismic exploration. The following conclusions can be summarized.
  • We proposed a fractal characterization method on the 3D fault tortuosity (DT3), and the calculation model on DT3 is a function of Lmin, Lmax, τav, and Df3. The key parameters for calculating DT3 can be obtained through this seismic exploration technique.
  • Through the proposed method, the calculated DT3 values for the four different geological units are determined to be 1.90737, 1.96026, 2.10998, and 1.69579, respectively. The rationality of the proposed model on DT3 was examined by the classical analytic relationships on the tortuosity and porosity of the fault (fracture) and DT3 vs. Df3.
  • Compared with the conventional fractal characterization method by Df3, the proposed fractal characterization method on DT3 can more accurately and comprehensively symbolize the complexity and heterogeneity of the fault network system in the 3D space, which achieves a breakthrough in the fractal characterization of the fault network system.
  • It is worth carrying out further study to explore the impacts on the transportation and occurrence of oil and gas exploration by using DT3 in combination with Df3, which can provide the theoretical foundation and technical support for oil and gas exploration.
  • Among the first three geological units, the DT3 of geological unit Ⅰ is the smallest, which indicates that the tortuosity of the fissures in geological unit Ⅰ is the smallest, which is the most favorable for oil and gas collection.

Author Contributions

Conceptualization, R.L. and G.L.; Data curation, X.H., Z.Z., J.L., G.B. and P.C.; Formal analysis, X.H., Z.Z., J.L., G.B. and P.C; Funding acquisition, R.L. and G.L.; Methodology, X.H. and Z.Z.; Supervision, R.L. and G.L.; Visualization, X.H.; Writing—original draft, X.H., R.L. and G.L.; Writing—review and editing, G.L. and P.C. All authors have read and agreed to the published version of the manuscript.

Funding

This research was supported by the National Natural Science Foundation of China (No. 42230814, No. 42372204, and No. 42472240), the China Scholarship Council (No. 202308410549), the Natural Science Foundation of Henan Province (No. 242300421362), the Henan Province International Science and Technology Cooperation Project (No. 242102520034), the Henan Province Science and Technology Research Project (No. 242102320365), and the Key Research Project of Higher Education Institutions in Henan Province (No. 24B170005).

Data Availability Statement

The data presented in this study are available from the corresponding author upon request.

Conflicts of Interest

The authors declare no conflicts of interest.

References

  1. Ahmed, K.S.; Liu, K.; Harouna, M.; Liu, J.; Twinomujuni, L.; Abdoul Aziz, H.B.; Kun, J.; Ahmed, H.A. Integrated 3D Geological Analysis of Hydrocarbon Maturation and Migration in Rift Basins: Insights from the Niger Chad Basin. J. Afr. Earth Sci. 2024, 210, 105157. [Google Scholar] [CrossRef]
  2. Fan, C.; Xie, H.; Li, H.; Zhao, S.; Shi, X.; Liu, J.; Meng, L.; Hu, J.; Lian, C. Complicated Fault Characterization and Its Influence on Shale Gas Preservation in the Southern Margin of the Sichuan Basin, China. Lithosphere 2022, 2022, 8035106. [Google Scholar] [CrossRef]
  3. Ma, Y.; Cai, X.; Yun, L.; Li, Z.; Li, H.; Deng, S.; Zhao, P. Practice and Theoretical and Technical Progress in Exploration and Development of Shunbei Ultra-Deep Carbonate Oil and Gas Field, Tarim Basin, NW China. Pet. Explor. Dev. 2022, 49, 1–20. [Google Scholar] [CrossRef]
  4. Wang, X.; Zhou, X.; Li, S.; Zhang, N.; Ji, L.; Lu, H. Mechanism Study of Hydrocarbon Differential Distribution Controlled by the Activity of Growing Faults in Faulted Basins: Case Study of Paleogene in the Wang Guantun Area, Bohai Bay Basin, China. Lithosphere 2022, 2021, 7115985. [Google Scholar] [CrossRef]
  5. Fang, R.; Jiang, Y.; Luo, Y.; Wang, Z.; Jiang, C.; Li, S.; Qi, L.; Yan, X. Hydrocarbon Geological Characteristics and Factors Controlling Hydrocarbon Accumulation of Jurassic Da’anzhai Continental Shale. Minerals 2023, 14, 11. [Google Scholar] [CrossRef]
  6. Zhou, Q.; Liu, D.; Lin, X. Pre-Evaluation of Fault Stability for Underground Mining Based on Geomechanical Fault-Slip Analysis. Geomat. Nat. Hazards Risk 2022, 13, 400–413. [Google Scholar] [CrossRef]
  7. Dong, Y.; Zeng, J.; Dong, X.; Li, C.; Liu, Y. The Control Effect of Normal Faults and Caprocks on Hydrocarbon Accumulation: A Case Study from the Binhai Fault Nose of the Huanghua Depression, Bohai Bay Basin, China. J. Pet. Sci. Eng. 2022, 218, 110918. [Google Scholar] [CrossRef]
  8. Zhao, X.; Yang, B.; Yuan, S.; Shen, Z.; Feng, D. Seepage–Fractal Model of Embankment Soil and Its Application. Fractal Fract. 2022, 6, 277. [Google Scholar] [CrossRef]
  9. Peng, Y.; Tang, S.; Huang, J.; Tang, C.; Wang, L.; Liu, Y. Fractal Analysis on Pore Structure and Modeling of Hydration of Magnesium Phosphate Cement Paste. Fractal Fract. 2022, 6, 337. [Google Scholar] [CrossRef]
  10. Wang, A.; Wang, L. A Fractal-Based Quantitative Method for the Study of Fracture Evolution of Coal under Different Confining Pressures. Fractal Fract. 2024, 8, 159. [Google Scholar] [CrossRef]
  11. Pang, M.; Pan, H.; Zhu, S.; Zhang, Y.; Zhang, T. Experimental Investigation of the Fractal-Permeability Properties of Locally Fractured Coal Bodies around Gas Extraction Boreholes. Fractal Fract. 2023, 7, 574. [Google Scholar] [CrossRef]
  12. Yuan, B.; Li, Z.; Chen, W.; Zhao, J.; Lv, J.; Song, J.; Cao, X. Influence of Groundwater Depth on Pile–Soil Mechanical Properties and Fractal Characteristics under Cyclic Loading. Fractal Fract. 2022, 6, 198. [Google Scholar] [CrossRef]
  13. Zhu, W.; Yalcin, B.; Khirevich, S.; Patzek, T.W. Fault Traces: Generation of Fault Segments and Estimation of Their Fractal Dimension. Lithosphere 2021, 2021, 4991604. [Google Scholar] [CrossRef]
  14. Cui, Z.; Zhou, J.; Luo, K.; Lu, M. Fractal Structure Characteristics and Prospecting Direction of Dispersed Metals in the Eastern Guizhou Pb–Zn Metallogenic Belt, SW China. Minerals 2022, 12, 1567. [Google Scholar] [CrossRef]
  15. Li, F.; Hao, T.; Wang, G.; Tang, Y.; Yuan, M.; Zhao, L. Mechanical Properties and Fractal Characteristics of Fractured Coal under Different Gas Pressures. Nat. Resour. Res. 2024, 33, 793–812. [Google Scholar] [CrossRef]
  16. Zhou, Z.; Roubinet, D.; Tartakovsky, D.M. Thermal Experiments for Fractured Rock Characterization: Theoretical Analysis and Inverse Modeling. Water Resour. Res. 2021, 57, e2021WR030608. [Google Scholar] [CrossRef]
  17. Zhang, W.; Zhou, G.; Zhang, G.; Duan, J.; Kong, Y.; Jiang, T. Study on 3D Spatial Characterization Analysis and Water Injection Seepage Numerical Simulation of Coal Micro-Pore/Fracture. Energy Sources Part A Recovery Utilization Environ. Effects 2020, 1–15. [Google Scholar] [CrossRef]
  18. Oynakov, E.; Botev, E. Fractal Properties of Seismicity and Active Faults in Balkans. J. Volcanol. Seismol. 2021, 15, 483–490. [Google Scholar] [CrossRef]
  19. Xu, P.; Chen, Z.; Qiu, S.; Yang, M.; Liu, Y. An Analytical Model for Pore and Tortuosity Fractal Dimensions of Porous Media. Fractals 2021, 29, 2150156. [Google Scholar] [CrossRef]
  20. Ross, Z.E.; Cochran, E.S.; Trugman, D.T.; Smith, J.D. 3D Fault Architecture Controls the Dynamism of Earthquake Swarms. Science 2020, 368, 1357–1361. [Google Scholar] [CrossRef]
  21. Lotfi, M.; Javaherian, A.; Varnousfaderani, S.R.; Amindavar, H.R. Mapping Channel Boundaries in Seismic Data Based on an Improved Partial Area Effect. J. Pet. Sci. Eng. 2022, 212, 110263. [Google Scholar] [CrossRef]
  22. Zhao, L.; Cai, M.; Ding, R.; Zhang, Y.; Zhao, S.; Zhang, J.; Yang, J. A 3D Organized Point Cloud Clustering Algorithm for Seismic Fault Data Based on Region Growth. Comput. Geosci. 2023, 27, 1165–1181. [Google Scholar] [CrossRef]
  23. Zhang, Z.; Liu, G.; Wang, X.; Li, B.; Liu, H. Fractal Characterization on Fracture Volume in Coal Based on Ct Scanning: Principle, Methodology, and Implication. Fractals 2022, 30, 2250124. [Google Scholar] [CrossRef]
  24. Ji, J.; Song, X.; Li, S.; Xu, F.; Song, G.; Shi, Y.; Yi, J. Study on the Effect of Fracture Morphology on Fracture Deformation Based on the Thermal-Hydraulic-Chemical-Deformation Coupling Model. Energy 2023, 282, 128628. [Google Scholar] [CrossRef]
  25. McBeck, J.; Renard, F. Deriving Three-dimensional Properties of Fracture Networks from Two-dimensional Observations in Rocks Approaching Failure under Triaxial Compression: Implications for Fluid Flow. Water Resour. Res. 2022, 58, e2022WR032783. [Google Scholar] [CrossRef]
  26. Ma, D.; Li, Q.; Cai, K.; Zhang, J.; Li, Z.; Hou, W.; Sun, Q.; Li, M.; Du, F. Understanding Water Inrush Hazard of Weak Geological Structure in Deep Mine Engineering: A Seepage-Induced Erosion Model Considering Tortuosity. J. Cent. South Univ. 2023, 30, 517–529. [Google Scholar] [CrossRef]
  27. Luo, L.; Jin, J.; Wei, W.; Cai, J. An Analysis of Fractal Dimension and Tortuosity Based on 2D Numerical Reconstruction Model of Reservoir Rocks. Interpretation 2019, 7, SJ1–SJ6. [Google Scholar] [CrossRef]
  28. Thanh, L.D.; Jougnot, D.; Van Do, P.; Van Nghia A, N.; Tuyen, V.P.; Ca, N.X.; Hien, N.T. A Physically Based Model for the Electrical Conductivity of Partially Saturated Porous Media. Geophys. J. Int. 2020, 223, 993–1006. [Google Scholar] [CrossRef]
  29. Zhang, B.; Tong, Y.; Du, J.; Hussain, S.; Jiang, Z.; Ali, S.; Ali, I.; Khan, M.; Khan, U. Three-Dimensional Structural Modeling (3D SM) and Joint Geophysical Characterization (JGC) of Hydrocarbon Reservoir. Minerals 2022, 12, 363. [Google Scholar] [CrossRef]
  30. Dutilleul, J.; Bourlange, S.; Géraud, Y. Porosity and Compaction State at the Active Pāpaku Thrust Fault in the Frontal Accretionary Wedge of the North Hikurangi Margin. Geochem. Geophys. Geosyst. 2021, 22, e2020GC009325. [Google Scholar] [CrossRef]
  31. Sun, S.; Huang, S.; Gomez-Rivas, E.; Griera, A.; Liu, B.; Xu, L.; Wen, Y.; Dong, D.; Shi, Z.; Chang, Y.; et al. Characterization of Natural Fractures in Deep-Marine Shales: A Case Study of the Wufeng and Longmaxi Shale in the Luzhou Block Sichuan Basin, China. Front. Earth Sci. 2023, 17, 337–350. [Google Scholar] [CrossRef]
  32. Pei, X. Signal Acquisition Method for 3D Seismic Exploration in High-Density Coal Mining Area. Arab. J. Geosci. 2020, 13, 712. [Google Scholar] [CrossRef]
  33. Da Col, F.; Papadopoulou, M.; Koivisto, E.; Sito, Ł.; Savolainen, M.; Socco, L.V. Application of Surface-wave Tomography to Mineral Exploration: A Case Study from Siilinjärvi, Finland. Geophys. Prospect. 2020, 68, 254–269. [Google Scholar] [CrossRef]
  34. Zou, G.; Liu, H.; Ren, K.; Deng, B.; Xue, J. Automatic Recognition of Faults in Mining Areas Based on Convolutional Neural Network. Energies 2022, 15, 3758. [Google Scholar] [CrossRef]
  35. Wang, F.; Cheng, H. A Fractal Permeability Model for 2D Complex Tortuous Fractured Porous Media. J. Pet. Sci. Eng. 2020, 188, 106938. [Google Scholar] [CrossRef]
  36. Chen, A.; Miao, T.; Li, Z.; Zhang, H.; Jiang, L.; Liu, J.; Yan, C.; Yu, B. Fractal Monte Carlo Simulations of the Effective Permeability for a Fracture Network. Fractals 2022, 30, 2250074. [Google Scholar] [CrossRef]
  37. Liu, H.; Li, W.; Gu, S.; Cheng, L.; Wang, Y.; Xu, J. Three-Dimensional Modeling of Fault Geological Structure Using Generalized Triangular Prism Element Reconstruction. Bull. Eng. Geol. Environ. 2023, 82, 118. [Google Scholar] [CrossRef]
  38. Zhang, Z.; Liu, G.; Chang, P.; Wang, X.; Lin, J. Fractal Characteristics for Coal Chemical Structure: Principle, Methodology and Implication. Chaos Solitons Fractals 2023, 173, 113699. [Google Scholar] [CrossRef]
  39. Kou, J.-L.; Tang, X.-M.; Zhang, H.-Y.; Lu, H.-J.; Wu, F.-M.; Xu, Y.-S.; Dong, Y.-S. Tortuosity for Streamlines in Porous Media. Chin. Phys. B 2012, 21, 44701. [Google Scholar] [CrossRef]
  40. Liu, G.; Zhang, Z.; Cao, Y.; Wang, X.; Liu, H.; Li, B.; Si, N.; Guan, W. An Analogical Method on Fractal Dimension for Three-Dimensional Fracture Tortuosity in Coal Based on Ct Scanning. Fractals 2023, 31, 2350072. [Google Scholar] [CrossRef]
  41. Wang, F.; Cheng, H. Effect of tortuosity on the stress-dependent permeability of tight sandstones: Analytical modelling and experimentation. Mar. Pet. Geol. 2020, 120, 104524. [Google Scholar] [CrossRef]
  42. Hu, Y.; Wang, Q.; Zhao, J.; Xie, S.; Jiang, H. A Novel Porous Media Permeability Model Based on Fractal Theory and Ideal Particle Pore-Space Geometry Assumption. Energies 2020, 13, 510. [Google Scholar] [CrossRef]
  43. Su, H.; Zhang, Y.; Xiao, B.; Huang, X.; Yu, B. A Fractal-Monte Carlo Approach to Model Oil and Water Two-Phase Seepage in Low-Permeability Reservoirs with Rough Surfaces. Fractals 2021, 29, 2150003. [Google Scholar] [CrossRef]
  44. Zhang, G.; Guo, J.; Xu, B.; Xu, L.; Dai, Z.; Yin, S.; Soltanian, M.R. Quantitative Analysis and Evaluation of Coal Mine Geological Structures Based on Fractal Theory. Energies 2021, 14, 1925. [Google Scholar] [CrossRef]
  45. Shmela, A.K.; Paton, D.A.; Collier, R.E.; Bell, R.E. Normal Fault Growth in Continental Rifting: Insights from Changes in Displacement and Length Fault Populations Due to Increasing Extension in the Central Kenya Rift. Tectonophysics 2021, 814, 228964. [Google Scholar] [CrossRef]
  46. Ma, D.; Duan, H.; Zhang, J. Solid Grain Migration on Hydraulic Properties of Fault Rocks in Underground Mining Tunnel: Radial Seepage Experiments and Verification of Permeability Prediction. Tunn. Undergr. Space Technol. 2022, 126, 104525. [Google Scholar] [CrossRef]
  47. Ma, D.; Duan, H.; Zhang, J.; Liu, X.; Li, Z. Numerical Simulation of Water–Silt Inrush Hazard of Fault Rock: A Three-Phase Flow Model. Rock Mech. Rock Eng. 2022, 55, 5163–5182. [Google Scholar] [CrossRef]
  48. Wang, W.; Pang, X.; Chen, Z.; Chen, D.; Wang, Y.; Yang, X.; Luo, B.; Zhang, W.; Zhang, X.; Li, C.; et al. Quantitative Evaluation of Transport Efficiency of Fault-Reservoir Composite Migration Pathway Systems in Carbonate Petroliferous Basins. Energy 2021, 222, 119983. [Google Scholar] [CrossRef]
  49. Zhang, Z.; Liu, G.; Wang, X.; Lv, R.; Liu, H.; Lin, J.; Barakos, G.; Chang, P. A Fractal Langmuir Adsorption Equation on Coal: Principle, Methodology and Implication. Chem. Eng. J. 2024, 488, 150869. [Google Scholar] [CrossRef]
Figure 1. Schematic diagram of fault with tortuosity: (a) Plan diagram of the tortuous fault, the upper and lower plates of the faults are indicated by red lines; (b) Profile diagram of fault effect on oil and gas transportation, and the red tortuous line represents fault.
Fractalfract 08 00572 g001
Figure 2. Diagram of faults with tortuosity: (a) Diagram of tortuous faults in three-dimensional space, and the red tortuous lines represent faults; (b) Geometric model diagram of a fault unit with tortuosity; where τ is the tortuosity of fault; the Lt is the actual length of the flow channel in fault; a is the geological fault opening; and θ is the dip of the fault plane relative to the direction of fluid flow.
Fractalfract 08 00572 g002
Figure 3. Flow chart of calculation model on DT3.
Fractalfract 08 00572 g003
Figure 4. Schematics of 3D seismic exploration site and plan: (a) 3D seismic exploration site, use of seismic wave propagation properties in subsurface media to infer subsurface structures; (b) Schematic plan view of the 3D seismic exploration.
Fractalfract 08 00572 g004
Figure 5. Distribution map of the faults in research area.
Fractalfract 08 00572 g005
Figure 6. Estimation on fractal dimension Df3 for the number of faults: (a) Df3 of geological unit I; (b) Df3 of geological unit II; (c) Df3 of geological unit III; (d) Df3 of geological unit IV.
Fractalfract 08 00572 g006
Figure 7. Flow chart of DT3 calculation.
Fractalfract 08 00572 g007
Figure 8. Variation curves of DT3 with ϕ.
Fractalfract 08 00572 g008
Figure 9. Variation curves of DT3 with Df3.
Fractalfract 08 00572 g009
Table 1. Main parameters of the observing system in the 3D seismic exploration.
ItemParameter
Type of observing system8-wire, 8-gun, harnessed
Receiving channels/channel384 (8 × 48 = 384)
Number of receiving wires (bar)8
Motivation methodMidpoint excitation
Receiver line distance (m)40
Receiver channel distance (m)20
Excitation line distance (m)20
Shot interval (m)80
CDP grid10 m × 10 m
Fold (time)24 (vertical 6 × horizontal 4)
Offsetmax (m)523
Offsetmin (m)0
Table 2. Basic analysis of the geological unit.
Geological Unitlmin (m)lmax (m)ϕτav
559400.053999.64131
356700.0264919.25248
595980.0181527.91459
359400.0402912.7903
Disclaimer/Publisher’s Note: The statements, opinions and data contained in all publications are solely those of the individual author(s) and contributor(s) and not of MDPI and/or the editor(s). MDPI and/or the editor(s) disclaim responsibility for any injury to people or property resulting from any ideas, methods, instructions or products referred to in the content.

