Article

Matrix Compression and Pore Heterogeneity in the Coal-Measure Shale Reservoirs of the Qinshui Basin: A Multifractal Analysis

1
Key Laboratory of Coalbed Methane Resources and Reservoir Formation Process of the Ministry of Education, China University of Mining and Technology, Xuzhou 221008, China
2
School of Resources and Geoscience, China University of Mining and Technology, Xuzhou 221116, China
*
Authors to whom correspondence should be addressed.
Fractal Fract. 2024, 8(10), 580; https://doi.org/10.3390/fractalfract8100580
Submission received: 26 August 2024 / Revised: 26 September 2024 / Accepted: 29 September 2024 / Published: 30 September 2024

Abstract

:
The application of high-pressure fluid induces the closure of isolated pores inside the matrix and promotes the generation of new fractures, resulting in a compressive effect on the matrix. To examine the compressibility of coal-measure shale samples, the compression of the coal–shale matrix in the high-pressure stage was analyzed by a low-pressure nitrogen gas adsorption and mercury intrusion porosimetry experiment. The quantitative parameters describing the heterogeneity of the pore-size distribution of coal-measure shale are obtained using multifractal theory. The results indicate that the samples exhibit compressibility values ranging from 0.154 × 10⁻⁵ MPa−1 to 4.74 × 10⁻⁵ MPa−1 across a pressure range of 12–413 MPa. The presence of pliable clay minerals enhances the matrix compressibility, whereas inflexible brittle minerals exhibit resistance to matrix compression. There is a reduction in local fluctuations of pore volume across different pore sizes, an improvement in the autocorrelation of PSD, and a mitigation of nonuniformity after correction. Singular and dimension spectra have advantages in multifractal characterization. The left and right spectral width parameters of the singular spectrum emphasize the local differences between the high- and low-value pore volume areas, respectively, whereas the dimensional spectrum width is more suitable for reflecting the overall heterogeneity of the PSD.

1. Introduction

Shale gas resources have garnered significant attention from scholars worldwide due to their immense potential as a viable energy source. Primarily stored in the adsorbed and free states within the heterogeneous pore space of shale formations, understanding the mechanisms of shale gas formation and reservoir evaluation necessitates a comprehensive examination of the morphological characteristics, pore-size distribution (PSD), and inhomogeneity within these pore spaces [1,2,3,4,5,6,7,8,9,10]. Recent advancements in characterization techniques have facilitated a deeper insight into shale pore structures.
Focused ion beam scanning electron microscopy and micro-/nano-X-ray computed tomography (μCT/nCT) have emerged as powerful tools for the qualitative and semi-quantitative assessment of shale PSD [11,12,13]. Meanwhile, a quantitative PSD analysis is achieved through techniques such as nuclear magnetic resonance (NMR), low-pressure carbon dioxide/nitrogen gas adsorption (LP-CO2/N2-GA), mercury intrusion porosimetry (MIP), and small-angle neutron scattering, enabling the characterization of material structures spanning the nanometer to micron scales [4,7,12,14,15,16,17]. Among these, LP-CO2/N2-GA and MIP are widely utilized for characterizing pore volume, PSD, and specific surface area, with LP-CO2-GA excelling in micropore analysis below 2 nm, and LP-N2-GA complementing this by characterizing mesopores and macropores within 1–100 nm [18,19]. However, MIP, while offering a broader range of pore sizes (6–10,000 nm), has been subject to scrutiny regarding its results in the high-pressure section (>10 MPa), particularly regarding matrix compressibility [20,21,22,23]. The MIP data of low-rank coal in Western Canada have been analyzed by Waldemar et al. [20] from the perspective of fractal geometry, revealing that at higher pressures, the compressibility of coal replaces pore filling as the primary factor affecting the mercury measurement volume of mercury. The compressibility of coals decreases exponentially as their rank increases [21,22]. Moreover, Feng et al. [23] employed a correction methodology on the mercury injection experimental data of shale in the Ordos Basin, yielding outcomes that demonstrate a close concurrence between porosity measurements obtained from corrected shale samples using MIP and those acquired using helium gas. The aforementioned statement further validates the heightened reliability of modified MIP data. Nevertheless, limited exploration has been conducted on matrix compressibility and its controlling factors.
The complexity of shale pore structures poses challenges for conventional pore size testing methods, which often fail to fully capture the heterogeneity in pore sizes [24]. Mandelbrot [25] firstly described the fractal theory and defined the fractal dimension D, as a fractal parameter, to quantitatively characterize the spatial heterogeneity of physical properties. The proposed fractal theory plays a crucial role in the quantitative analysis of PSD heterogeneity [26]. Numerous researchers have investigated the heterogeneity of pores and their influencing factors using fractal models by the Menger sponge model, Frenkel–Halsey–Hill (FHH), the box-counting method, the Sierpinski model, and the thermodynamic model [27,28,29,30]. The fractal dimension has gained recognition and extensive utilization for characterizing the heterogeneity of the PSD in shale porous media [31,32,33,34]. The FHH method was employed by Yang et al. [32] to compute the fractal dimension of LT-N2-GA data, revealing a positive correlation between total organic carbon (TOC) content and fractal dimension. Notably, an increase in fractal dimension was found to enhance methane adsorption capacity.
However, monofractals, while capturing the overall heterogeneity or an average value, struggle to account for local heterogeneous characteristics, diversity, and irregular variations in PSD [7]. A single-scale fractal cannot explain the unstable distribution and nonlinear change of pore size in porous media [35,36]. The multifractal approach, as a natural extension of monofractals, offers a more nuanced understanding of pore structures by characterizing distinct types of irregularities and self-similarity across different pore aperture intervals [37,38,39]. It is a singular set with a nonuniform fractal dimension distribution composed of the superposition of a limited number or an extensive number of subsets with distinct fractal behaviors [18,38,39]. The use of multifractals allows us to hierarchically comprehend the intricate internal structures within the pores. This approach has proven effective in characterizing PSD fluctuations in various materials, including shale [33,36,40,41,42]. The limitation imposed by matrix compression hinders the segmentation of fractal dimension curves in both the Menger and Sierpinski models, leading to a consistent level of heterogeneity in PSD across various pore sizes and a clear impact on multifractal value variations [43]. The real heterogeneity of PSD will be affected by the occurrence of microcracks during mercury injection. Despite these advancements, limited research has been conducted on the matrix compressibility of shale samples and its impact on PSD characterization, particularly in the context of MIP experiments. Furthermore, the physical significance and geological interpretation of multifractal parameters in shale heterogeneity remain unclear.
Thus, this study aims to address these gaps by analyzing and correcting coal-measure shale sample compressibility in the Qinshui Basin using LP-N2-GA and MIP methods. We investigate the relationship between compression effects and rock composition, and employ the multifractal theory to elucidate the heterogeneity characteristics of pores spanning 6 to 105 nm. Through statistical analysis, we propose the applicability of different multifractal spectra in characterizing pore structures and identify the key factors influencing PSD heterogeneity. Our findings contribute to a more comprehensive understanding of pore connectivity and the fracturing properties of coal-measure shale reservoirs, informing future assessments and developments in the field.

2. Samples and Methodology

2.1. Geological Setting and Sample Collection

The Qinshui Basin, located in the southeastern part of Shanxi Province, is a mountain rift basin that emerged as a result of fault blocks owing to differential uplift following coal formation in North China during the late Paleozoic [44]. During the Jurassic–Cretaceous Yanshan orogeny in the Qinshui Basin, a series of NNE–SSW faults and folds were formed by the NW–SE extensional stress. The Taiyuan and the Shanxi Formations are the main development strata of coal-measure shale in the Qinshui Basin [45]. The Shanxi Formation in the basin predominantly exhibits deltaic facies, whereas the Taiyuan Formation is characterized by barrier coastal facies and carbonate platform facies (Figure 1). In this study, nine samples are gathered (Ro,max = 1.2–2.4%), originating from the Carboniferous–Permian Taiyuan–Shanxi Formation in the Eastern Qinshui Basin (Figure 1). All of them have matured enough to produce gas and are partially into the high maturity stage. The selected coal-measure shale samples are tested for TOC content and mineral components, MIP and LT-N2-GA. Table 1 presents the test results of the basic parameters of the samples.

2.2. Experiments

In this study, petrophysical experiments, MIP and LG-N2-GA were adopted to characterize the structural features of the pores and throats, respectively. TOC content was measured using fine powders within the 60–80 mesh range, processed in a CS-230 carbon–sulfur analyzer, adhering to the China National Standard (GB/T 19145-2022) [46]. To ensure precision and eliminate inorganic carbon interferences, the powders underwent pretreatment with boiling hydrochloric acid. The mineral composition of the coal-measure shale samples was quantitatively analyzed using the Ultima IV X-ray diffractometer (Rigaku, Tokyo, Japan) under controlled conditions of approximately 25 °C and 35% humidity. The XRD (X-ray diffraction) spectra were utilized to determine the chemical composition and crystal structures of various mineral components, thereby facilitating the further calculation of specific mineral compositions and relative contents. For the MIP experiments, an AutoPore IV 9500 mercury porosimeter (Norcross, GA, USA) was utilized, adhering to the industry standard (GB/T 35210.1-2023) [47]. Shale samples were crushed into granular chunks (with dimensions not exceeding 1 cm3) and dried at 150 °C for 12 h to eliminate residual gases and moisture within the samples. The LT-N2-GA experiments were conducted using an Autosorb-Ⅰ specific surface area and pore-size distribution analyzer manufactured by Quantachrome, Beach, FL, USA. The samples were ground into fine powders with a particle size range of 40–60 mesh and subsequently degassed at 150 °C for 12 h to remove bound water adsorbed by clay minerals. The dried and degassed samples were then exposed to nitrogen gas at approximately 77 K. Within the range of 0.009 to 0.998, the relative pressures (p/p0) were incrementally elevated, whereupon the quantity of adsorbed gas was systematically documented at each pressure increment. Subsequently, the desorption process was observed to occur in a reverse manner.

2.3. Methods

2.3.1. Matrix Compression and MIP-Corrected Method

As the environmental pressure of the mercury compression experiment is high, the coal matrix pores were compressed when the pressure reached a certain value, which significantly affected the results of the mercury compression experiment [22,48]. At present, the calculation method of matrix compressibility has been using MIP and LT-N2/CO2-GA [22,36,49]. The compressibility of mercury itself has been disregarded, which is particularly noteworthy. Shale compressibility can be defined as follows [50]:
ω s = d V s V s d P
where ω s is the matrix compression coefficient, MPa−1; d V s / d P is the volumetric response of the shale matrix under various pressure functions, cm3·g−1 MPa−1; and V s is the shale matrix volume, cm3/g.
As a porous medium, the mercury injection volume ( Δ V obs ) can be described as follows:
Δ V obs = Δ V p + Δ V s
where Δ V p is the volume of fluid filling pores and Δ V s is the volume of hale matrix compression.
According to the increased piezoelectric mercury and the pressure change, the Δ V s / Δ P can be obtained within the pressure range of 10–413 MPa (equivalent to 3–100 nm):
Δ V s Δ P Δ V obs Δ P 3 nm 100 nm Δ V p Δ P
where the volume of shale pores can be calculated by the LT-N2-GA data of the Barret–Joyner–Halenda (BJH) model.
Among them, the Δ V s / Δ P can be expressed by fitting a linear slope (k), as in the following equation:
k = d V c d P = Δ V c Δ P
From this, the shale compression factor can be calculated by combining the above equations:
ω s = 1 V s Δ V obs Δ P 3 n m 100 n m Δ V p Δ P
Thus, the compression volume of matrix ( V s p i ) under a specific pressure p i in the pressure range of 12–314 MPa can be further calculated. The calculation formula is as follows:
Δ V P i = V P i V P 0 = V obs p i V obs p 0 ω s × V c p i × P i P 0
V s p i = V s d V s d P × P i P 0
where V P i is the corrected cumulative pore volume corresponding to p i pressure; V obs p i is the corresponding observed mercury volume at p i pressure. The compressibility of different shale samples greatly varied.

2.3.2. Multifractal Model

In this study, the box-counting method is used to analyze the self-similarity of shale PSD. There are mainly two equivalent mathematical expressions in separately conducted multifractal analyses: multifractal singularity spectra ( α q ~   f α q ) and the generalized fractal dimension spectrum ( q ~ D q ) [51]. During the multifractal analysis, the pore size corrected by the matrix compression coefficient is employed. Macropore (>105 nm) volumes obtained using mercury injection testing are generally considered pores formed by the pileup of particles. Owing to the volume of mercury on its own, it is challenging to accurately test the volume data of ultra-small aperture pores (<6 nm) by MIP. Combining the above factors, the multifractal analysis is performed using the corrected results of MIP from 6 nm to 100 μm. The full-size porosity is divided into N small boxes with cell scales of ε [40,52]. The quantities of boxes (N) and the scale ( ε ) are calculated as follows:
N ε = 2 β
ε = L × 2 β
where L is the length of the aperture interval taken logarithmically; β , as dimensionless, is no more than 5 in order to ensure that each interval contains a pore volume. For each subinterval, the quality probability function P 𝒾 ε can be defined as follows:
P 𝒾 ε = N 𝒾 ε N t
where N 𝒾 ε is the corrected mercury increment of an 𝒾 th interval on the ε scale and N t is the corrected total mercury gain (total pore volume) [53]. Matrix relations of the probability functions of boxes then allow us to obtain the partition function 𝒳 q ,   ε to analyze the multifractal behavior of the pores [54]. In addition, 𝒳 q ,   ε is calculated as follows:
𝒳 q ,   ε = i = 1 N ε P i q ε
where the real integer q is an integer order in the statistical moment, which can be seen as a “microscope” for exploring various regions of the pore structure. The value of q ranges from −10 to 10 with a step size of 1. As q ≫ 1, regions of high probability values of the shale PSD are emphasized; similarly, as q ≪ −1, information on small probability regions is highlighted [36].
The quality probability function P 𝒾 ε and the partition function 𝒳 q   ,   ε relationship can be represented by the probability measures family 𝒰 𝒾 q ,   ε , as follows:
𝒰 𝒾 q   , ε = P i q ε 𝒳 q ,     ε
In addition, the multifractal behavior characterization function, namely the singular index α q and dimension distribution function f α q , can be defined as follows:
α q 𝒾 = 1 N ε 𝒰 𝒾 q ,     ε lg P 𝒾 ε lg ε
f α q 𝒾 = 1 N ε 𝒰 𝒾 q ,     ε lg 𝒰 𝒾 q ,     ε lg ε
Characterizing multifractal behavior, there is also a feature function:
𝒳 q ,   ε ε τ q
where τ q is a mass indicator. Moreover, q ~ D q is further multifractal language that is equivalent to the mathematical function of α q ~   f α q . Dq can be defined as follows:
D q = τ q q 1 = lim ε 0 1 q 1 lg 𝒳 q   ,   ε lg ε
For q = 0 , D0 is the capacity dimension. For q = 1 , use L’Hospital’s rule to obtain the one-dimensional generalized fractal dimension (D1), as follows:
D 1 = lim ε 0 i = 1 N ε p 𝒾 1 ,     ε lg p 𝒾 1 ,     ε lg ε
D2 is the related dimension, which can be expressed by the Hurst index (H).
H = D 2 + 1 2
where H is the Hurst exponent, which is normally in the range of 0.5–1.

3. Results

3.1. TOC and Mineral Compositions

Table 1 presents the total organic content and mineral composition of the shale samples. Shale gas primarily exists in organic matter (OM) nanopores in free and adsorbed states. The TOC content can more accurately reflect the abundance of shale OM [55]. The TOC content of the tested samples ranges from 0.58% to 3.18%, with an average value of 1.98%. Based on the criteria employed for classifying and evaluating OM present in the source rocks, half of the shale samples can be judged as organic-rich shale (TOC > 2%). The XRD method was employed for the comprehensive mineralogical analysis of the shale. The presence of clay, quartz, feldspar and siderite, along with minor amounts of calcite, dolomite and pyrite, is revealed. The clay content in the shale samples ranges from 38.3% to 71.4%, with an average of 57.4%. The quartz, comprising 29.1–41.2% (with an average of 34.3%), exhibits widespread distribution throughout the samples. Moreover, feldspar and siderite, with a content of 0–12% and 0–9.2%, respectively, have a small percentage of volume. Among the samples studied, the QS-4 has the highest siderite content of 9.2%, whereas the others do not exceed 2.7%. Calcite, dolomite and pyrite are relatively rare in whole-rock component testing and analysis.

3.2. Nanopore Type Characteristics

The primary compositions of the pores in shale are OM pores and inorganic mineral pores [56]. The LT-N2-GA experiment is one of the typical methods to test the size and type of shale nanopores. The hysteresis loops observed in the adsorption and desorption curves of various pore geometries display dissimilarities [57]. Figure 2 presents that the liquid nitrogen adsorption–desorption curves of all the samples exhibit hysteresis loop characteristics. The results indicate that, except for the sample QS-2 hysteresis loop showing the H3 type (representing slit-type pores), the other samples all exhibit the H2 type (representing ink bottle-like pores) according to the International Union of Pure and Applied Chemistry (IUPAC) hysteresis loop classification scheme. Commonly, the slit-type pores with open ends have good permeability and a relatively high pore connectivity. The ink bottle-shaped pores show the characteristics of “large abdomen and small neck”, corresponding to a large hysteresis loop area and poor connectivity.

3.3. Matrix Compressibility Coefficients

The compressibility of shale significantly affects MIP results when the mercury injection pressure exceeds 10–12.4 MPa, as indicated by previous studies using single fractal characteristics [23,36,43]. Hence, an initial pressure value of 12 MPa is selected for calculating the matrix compression effect correction for the MIP data in this study. The matrix compression coefficient ω s is calculated using Equation (5), incorporating the results of LP-N2-GA.
As shown in Table 2, the ω s results of all the samples were in the range of 0.154 × 10⁻⁵ MPa−1–4.711 × 10⁻⁵ MPa−1, with an average of 1.497 × 10⁻⁵ MPa−1. In addition, raw and corrected total mercury volumes of 6–105 nm were accumulated. The compression ratio varied from 1.21% to 57.74%, with an average of 24.02%. Figure 3 presents the raw and corrected mercury intrusion data of the four representative samples with different compression ratios. The compression-induced deviation results indicate that sample QS-5 exhibited the most pronounced matrix compression effect under high pressure, whereas sample QS-2 exhibited the least.

3.4. Multifractal Parameter Calculations

The results of the LP-N2-GA experiments and corrected pressed mercury experiments are used to calculate the multifractal behavior of the samples, to characterize a wider range of PSD in the samples. To guarantee that every box contains pore volume, the values of ε in this study are 5, 2.5, 1, 0.5 and 0.25. The partition function χ(q, ε) is calculated using Equation (11). Figure 4 presents a double logarithmic plot illustrating the correlation between box size ε and partition function.
Previous studies have indicated a notable linear correlation for the partition function of PSD in porous media, indicating its adherence to the multifractal distribution [36,58]. Figure 4 presents the partition function plots for the shale samples with the worst (Figure 4a) and the best (Figure 4b) fitting strengths. In addition, the partition function spectra of nine shale samples exhibited a well-fitting linear relationship (R2 > 0.85). Moreover, the logarithm of χ(q, ε) exhibited a significant linear relationship with the logarithm of ε, indicating that the PSD in shale samples follows a multifractal distribution. Thus, it is shown that the PSDs of the samples have multifractal characteristics, and multifractal parameters can serve as indicators of the nanopore size variation within shale formations.
Table 3 lists the parameters of the multifractal singular exponential spectrum and generalized dimension spectrum calculated using Equations (12)–(18) for different shales. In addition, as shown in Table 3, the singularity index α0, the spectral width α−10α10, the left spectral width α0α10, the right spectral width α−10 − α0, and the width difference Rd are the normal characteristic parameters of the singularity spectrum. The singular index, α0, ranges from 1.051 to 1.174, with an average of 1.105. The absolute value of the asymmetry index, Rd, is between 0.027 and 0.395. Among them, the Rd value of sample QS-8 is closest to zero and negative.
A generalized dimensional spectrum is another set of parameters for multifractal characterization. The Hurst exponent (H), the width (D−10D10) on the Dq spectrum, the right-side width (D0D10) on the Dq spectrum and the left-side width (D−10D0) on the Dq spectrum are the main characteristic parameters for PSD. In addition, the left spectrum width, D−10D0, ranges from 0.353 to 0.828 (0.462 on average), whereas the right spectrum width, D0D10, varies from 0.278 to 0.519 (0.444 on average). Further calculations show that the spectrum width, D−10D10, ranges from 0.631 to 1.293 (1.074 on average). The Hurst exponent (H), which serves as a crucial parameter for characterizing pore connectivity, exhibits a range of 0.791 to 0.889 with an average value of 0.831. Although all of the H values are generally high, there are still some differences between different shale samples.

4. Discussions

4.1. Influencing Factors of Matrix Compression

TOC and mineral composition are important factors affecting shale matrix compression. Figure 5 presents the linear fitting relationship between the shale matrix compressibility coefficient and different material components. There is a variability in the effect of brittle and ductile components on the development of shale pore structure [56]. Quartz and feldspar have obvious negative correlations with the compression coefficient, and the fitting coefficients are 0.7482 and 0.7026, respectively (Figure 5a,b). As can be seen from the confidence ellipse in Figure 5c, the matrix compression coefficient exhibits a positive correlation with increasing TOC content, whereas this relationship lacks significant statistical significance. It is reasonable for OM, as a plastic component, to be more easily deformed and compressed under high pressure. In fact, the proportion of OM in shale components is usually less than 5%, and the relationship is very weak when analyzed as a single influencing factor. The relationship between the matrix compression coefficient and TOC content needs to be comprehensively considered and studied in combination with the influence of other components. Clay minerals and the compression coefficient demonstrate an increasing exponential relationship (Figure 5d). When the clay mineral content is below 55%, the compressibility coefficient slightly changes with increasing clay mineral content. However, when the clay mineral content exceeds 55%, the compressibility coefficient significantly increases with the increasing clay mineral content.
The relationship between different material components and the matrix compression coefficient is largely determined by their own mechanical properties. Brittle minerals, such as quartz and feldspar, usually have a high compressive capacity and play a key role as “skeleton support” in the shale pore structure, which is not favorable to matrix compression. However, clay minerals and OM are highly plastic ductile components, thus favoring matrix compression. This finding is consistent with the results of Feng et al. [23], suggesting that the presence of pliable clay minerals enhances matrix compressibility, whereas inflexible brittle minerals exhibit resistance to matrix compression. The compression ratio results indicate a significant matrix compression effect in the selected shale samples under high-pressure conditions, especially for samples QS-5 and QS-6 (compression ratio > 50%). Therefore, the aforementioned results indicate that when subjected to mercury injection, the measured pore volume gradually deviates from its true value as the pressure exceeds 10 MPa. In addition, considering the sample matrix compressibility is essential when using the mercury injection data results of the high-pressure section. Moreover, the utilization of corrected MIP data allows a more precise depiction of the authentic PSD within the porous medium.

4.2. Effect of Matrix Compressibility on Multifractal Characterization

Figure 6 presents notable variations in the multifractal curve properties of the examined samples after rectifying the mercury intrusion data. After correcting the mercury injection data, both α0 and Rd parameter values decreased, and the degree of decrease varied with the change in compression coefficient (Figure 6a). Compared with the data before correction, D1 and H have increased, whereas the calculation results of α−10α10 and D−10D10 have remained basically unchanged (Figure 6b–e). The findings indicate a reduction in local pore volume fluctuations across different pore sizes, an enhancement in the autocorrelation of PSD, and a mitigation of nonuniformity after correction. The values of Rd decrease, indicating that the PSD heterogeneity in the higher pore volume measurement area is weakened, and the PSD heterogeneity in the lower pore volume measurement area is enhanced. This result aligns with the outcomes reported by Zhang et al. [43]. In addition, different parameters have different sensitivities to the matrix compression effect. Hence, the compression of the matrix alters the physical configuration of shale pores, resulting in heterogeneity transformation. Moreover, the utilization of corrected mercury injection data improves the accuracy of the multifractal analysis characterization results.

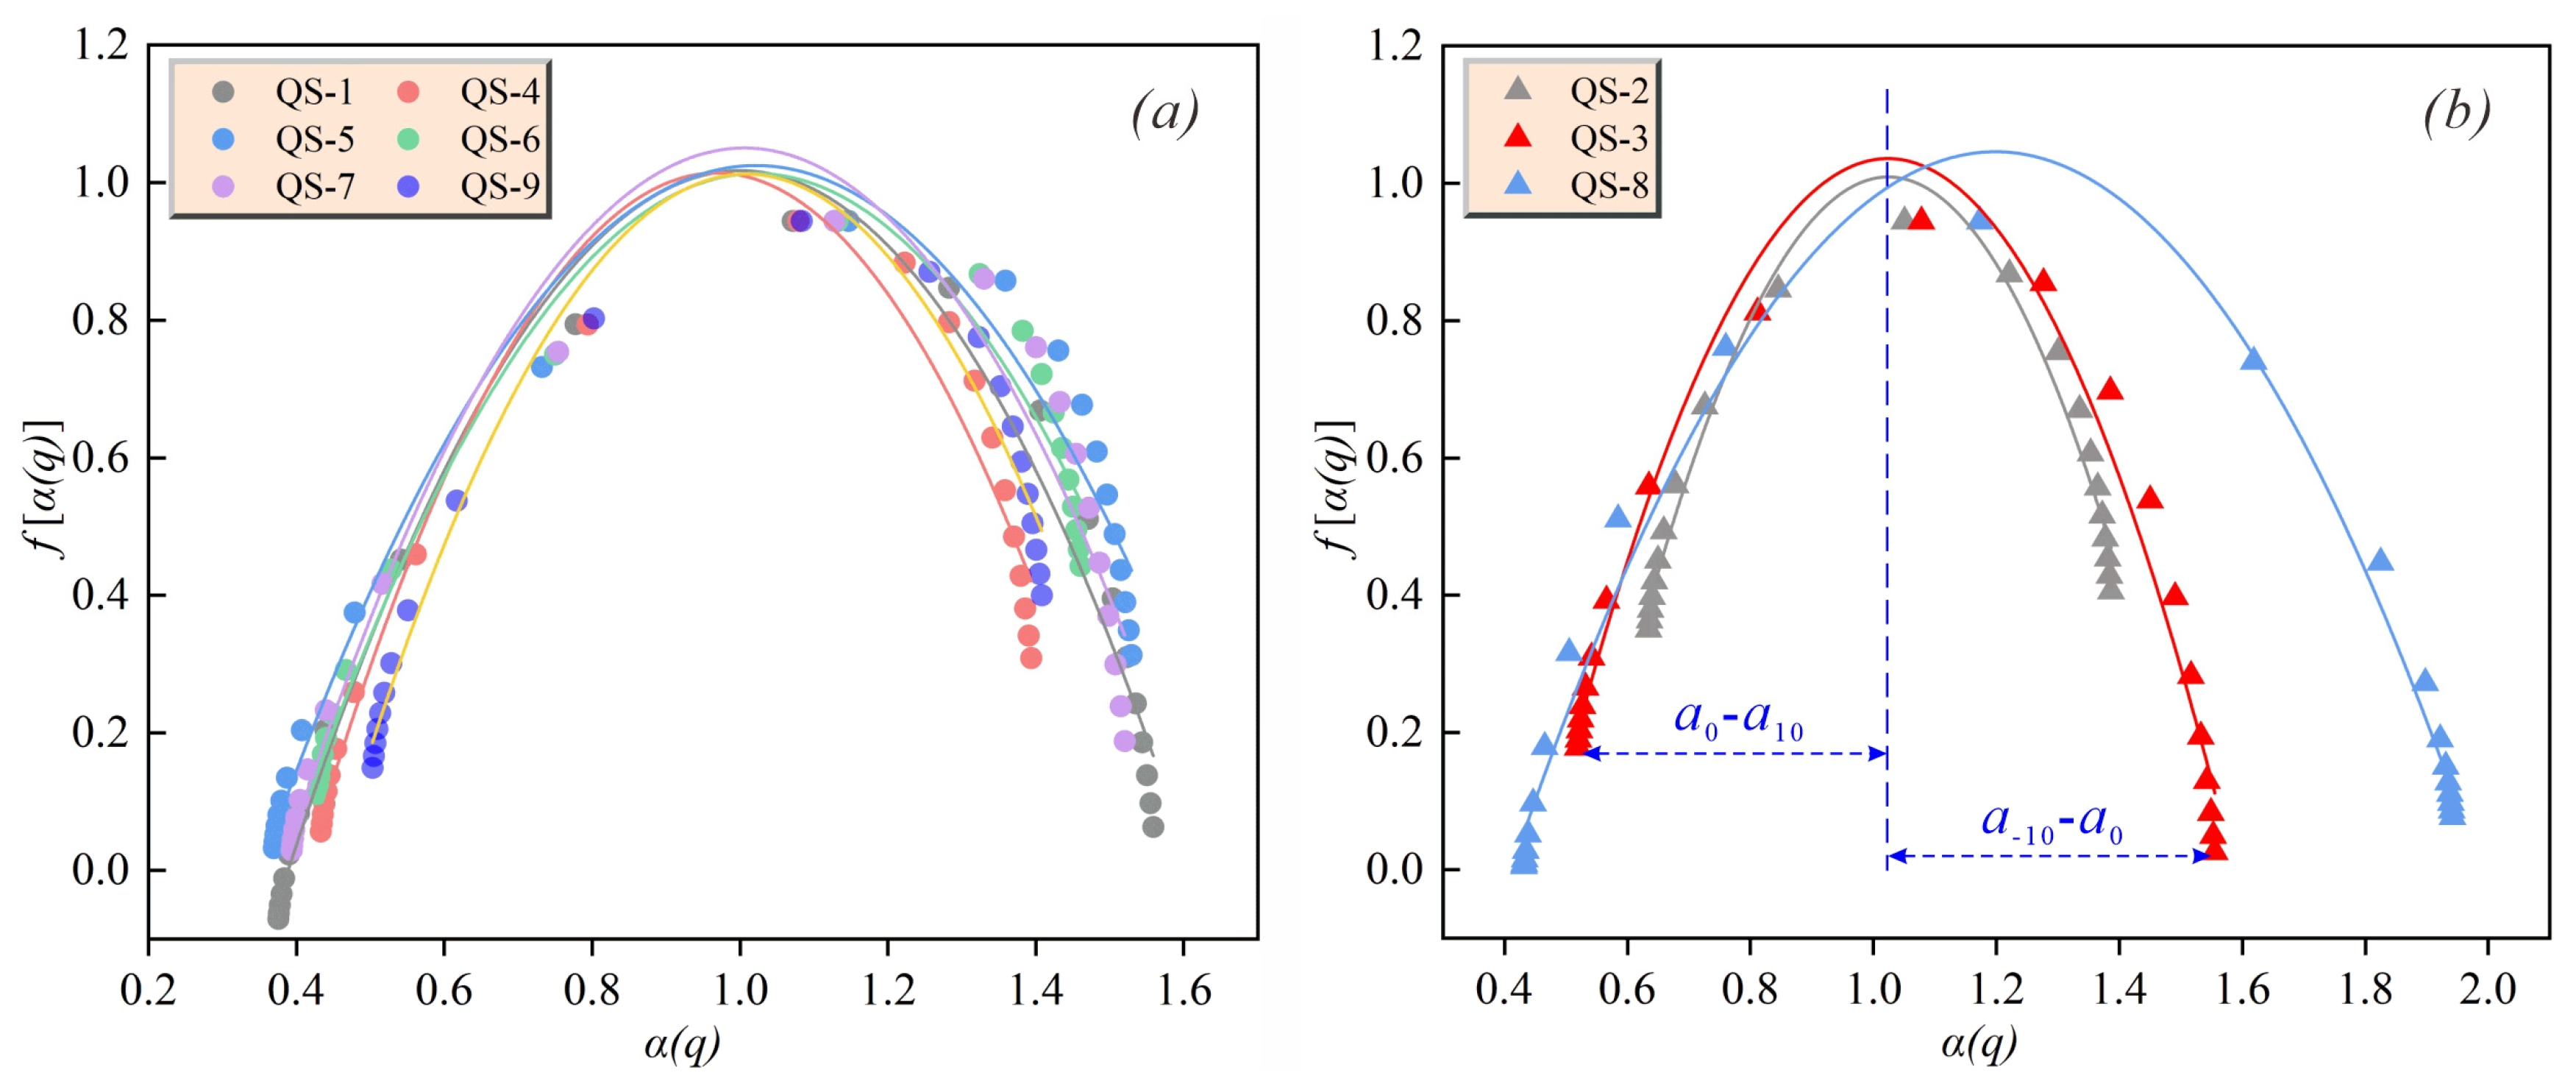
4.3. Heterogeneity Analysis by Multifractal Singular Spectrum

The left spectral width (α0α10) and right spectral width (α−10α0) of the singular spectrum can reflect different PSD information. The α0α10 is the difference between the maximum positive distance and the zero-order distance, emphasizing the pore distribution characteristics of the high probability–density area. The α−10α0 is the difference between the maximum negative order distance and the zero-order distance, reflecting the pore distribution characteristics in the low probability–density area. The difference in spectrum width Rd between the left and right sides indicates the degree of deviation in the central distribution of the singular spectrum. Rd > 0 suggests that f[α(q)] shifts to the left, and the high probability–density area has a significantly affects the PSD [49]. The opposite is true for Rd < 0. The closer Rd is to zero, the better the symmetry of a singular spectrum, indicating that there is no obvious difference in PSD between the high and low probability–density regions, the PSD tends to be uniform, and the fractal feature is single [53]. In this study, only three of the tested shale samples have an absolute value of Rd less than 0.1, and the singular spectrum images are approximately symmetrically distributed (Figure 7). The Rd values of the other samples are all greater than zero, and the f[α(q)]α(q) curve is right hook-shaped, indicating that the PSD is primarily influenced by the subset with a high probability. The larger α−10 − α10, the greater the complexity and heterogeneity of the pore structure [23]. Sample QS-2 and sample QS-8 have the lowest and highest α−10α10 values, respectively, indicating that they exhibit the weakest and strongest multifractality and inhomogeneity, respectively.

4.4. Heterogeneity Analysis by Multifractal Dimension Spectrum

From an information theory perspective, q and Dq are another set of parameters that describe multifractal behavior, where Dq is the qth generalized fractal dimension. τ(q) and Dq are the main variable functions in the generalized multifractal dimension analysis. τ(q) is a mass scaling function and an intermediate quantity that connects the partition function and Dq. Differing from single-fractal theory, the relationship between τ(q) and q in multifractals is usually nonlinear. The slopes of the τ(q) curves within q > 0 and q < 0 are obviously inconsistent, indicating that the pore system is nonuniform and has local differences. In this study, the τ(q)q curves of all the shale samples exhibit a nonlinear relationship and are upward convex curves (Figure 8), indicating that the PSD of the samples satisfies the properties of the multifractal self-similarity measure. This observation neatly aligns with the double logarithmic correlation that exists between logχ(q, ε) and logε.
Generally, Dq increases with increasing pore structure complexity [24,59]. For q = 0, 1 and 2, D0, D1 and D2 are the capacity dimension, information dimension and correlation dimension, respectively. All samples had the same value of 0.944 for the capacity dimension D0. The disparity between the capacity dimension D0 and the information dimension D1 is used to quantify the local concentration of PSD and the aperture spacing. The proximity of D1 to D0 reflects the uniformity of PSD over the entire aperture range [7,49,60,61]. The smaller the D1, the greater the difference with D0, the lower the uniformity of the PSD. Shale samples with smaller D1 values exhibit a higher degree of local pore volume distribution fluctuation, a narrower PSD range, and greater pore concentration [53,62]. As shown in Table 3, the sample QS-2 exhibited the highest D1 value of 0.845, suggesting a remarkably uniform porosity dispersion. In contrast, the lower D1 values of samples QS-5 to QS-8 vary from 0.732 to 0.760, indicating a concentrated porosity within a narrow range of equivalent diameter sizes and an increased level of heterogeneity in the inner PSD. This finding is consistent with the previous singular spectrum parameter analysis.
The Hurst exponent, H, is a commonly used expression of the correlation dimension D2, which characterizes the autocorrelation of the PSD across various pore sizes. In this paper, the Hurst exponent values of all the samples are larger than 0.8, indicating a positive autocorrelation for changes in porosity in different pore-size intervals. In addition, the parameter H can be considered crucial for estimating the evolution of pore connections among varying pore sizes. Sample QS-2 demonstrates excellent connectivity owing to its relatively high value of H, which is greater than 0.85. This can be attributed to the predominantly developed pore types in the shale. For instance, sample QS-2, obtained through liquid nitrogen adsorption and desorption experiments, is dominated by the development of flat plate-type pores, usually indicating better connectivity. On the contrary, samples such as QS-5, which predominantly develop ink-bottle pores, have a relatively low H and poor connectivity. The change in the H, as a crucial tool for fractal analysis, effectively reflects the level of randomness or persistence exhibited by time series, which is closely associated with the connectivity of the pore structure. In the study of the pore structure of coal-measure shale, although the connectivity is not directly characterized by H, a change in the H can indicate the complexity of the pore structure and a change in connectivity.

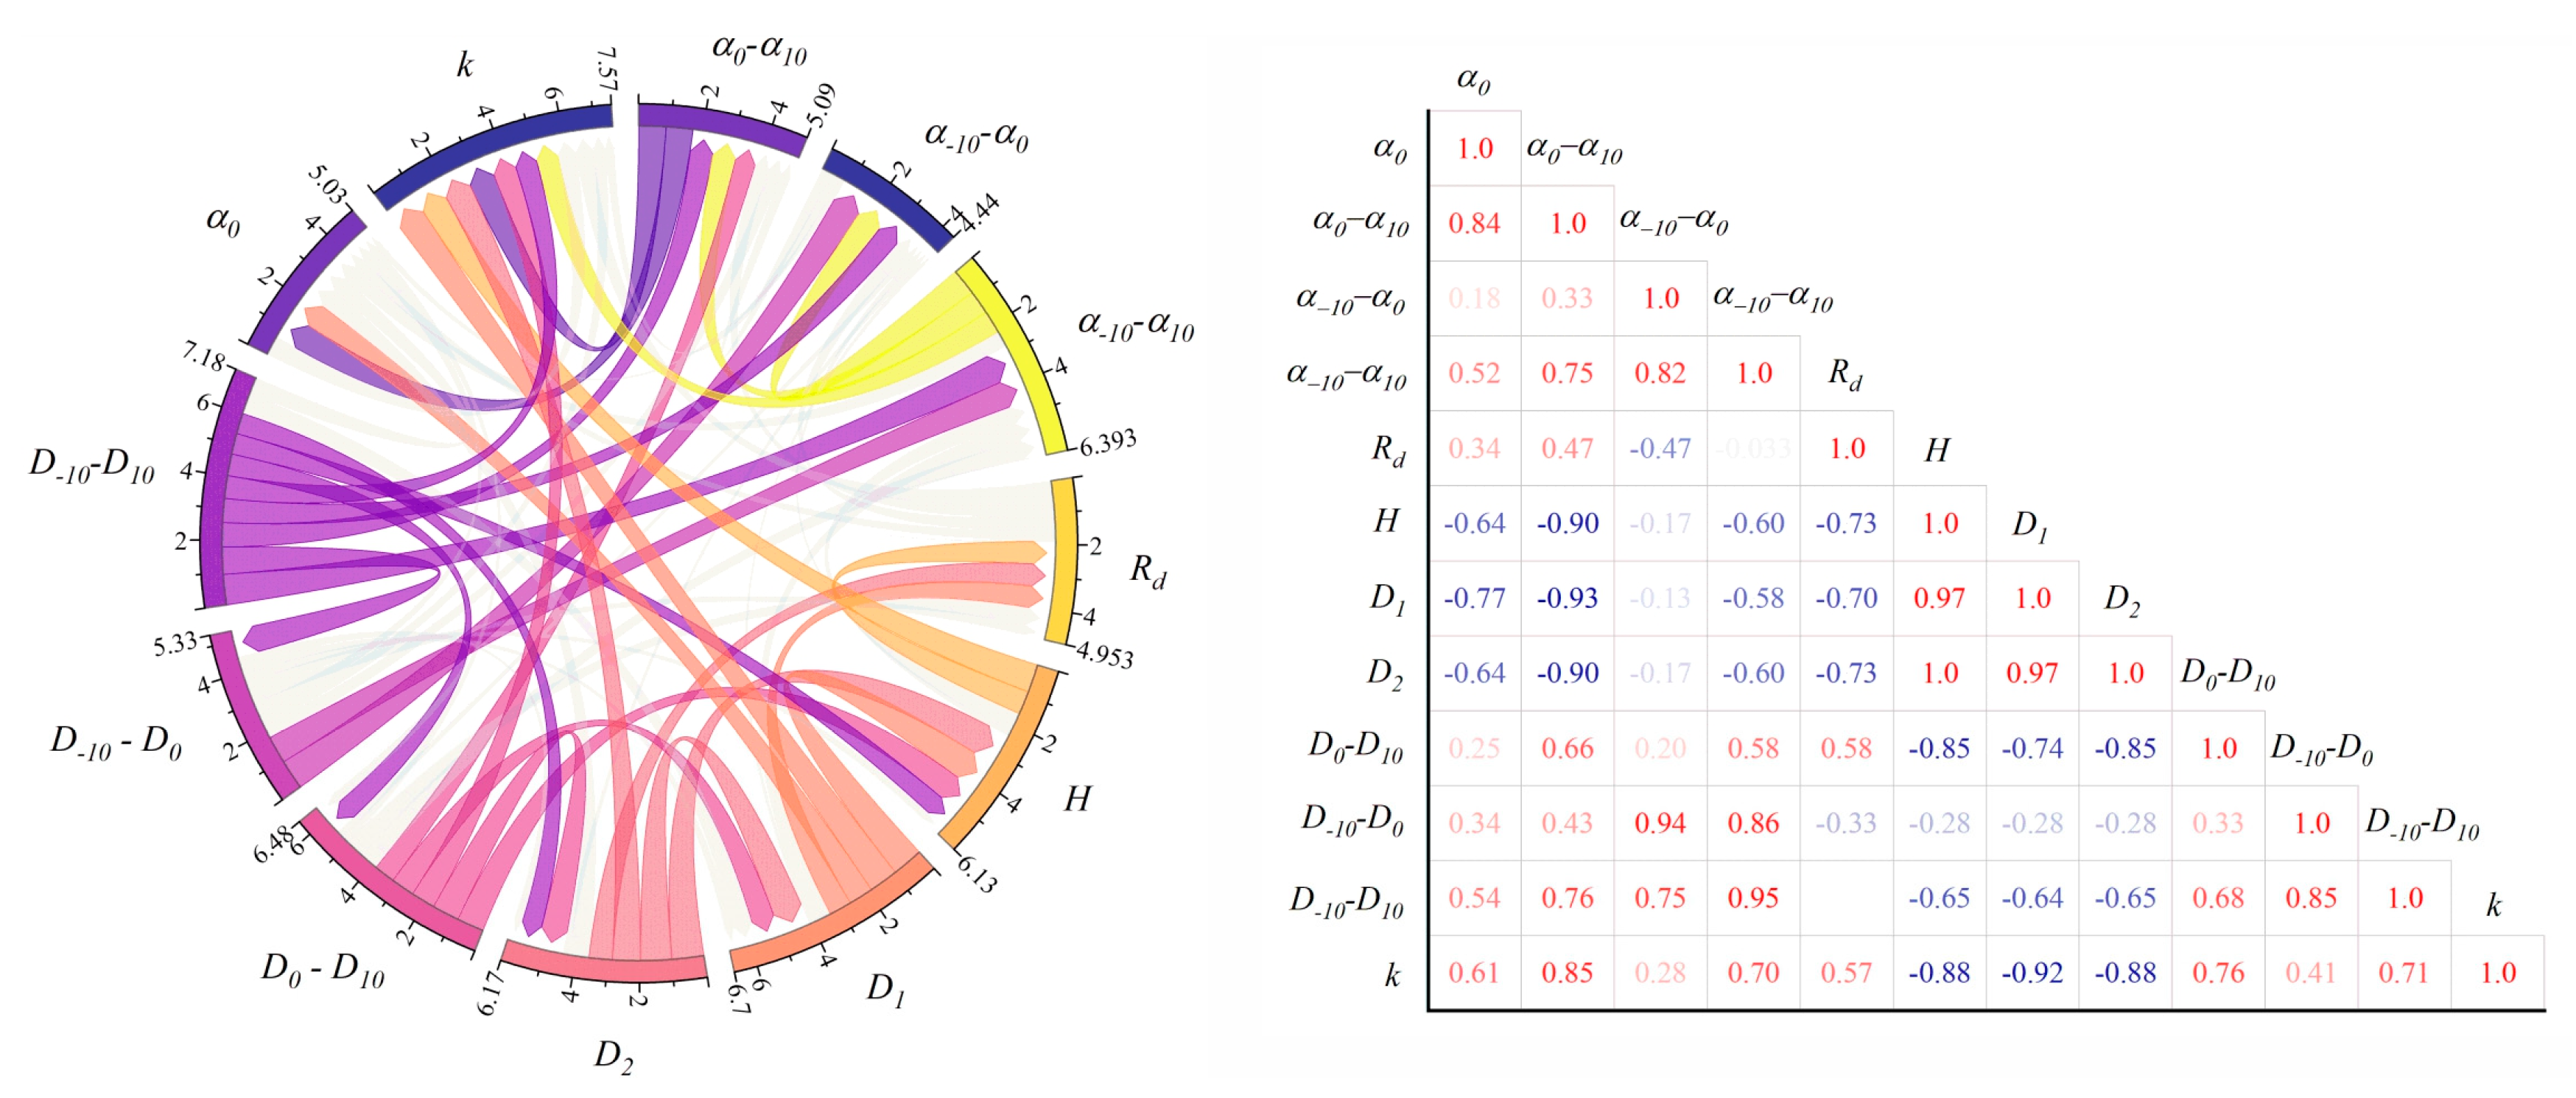
4.5. Influencing Factors of Pore Heterogeneity

Heat maps and chord diagrams are used to characterize the correlation between the 12 parameters (Figure 9). The connecting chord shown in Figure 9 more intuitively represents the correlation between the two parameters, with wider chord endpoints representing higher correlation coefficients. The light gray chords have a Spearman correlation coefficient of less than 0.6. The parameters D−10D0 and α−10–α0, D0–D10 and α0α10, and D−10D10 and α−10α10 have high correlations, indicating that these parameters are equivalent in characterizing PSD heterogeneity. In addition, this can be mathematically verified from their calculation formulas. The relationship between D−10D0 and the total spectral width exhibit a stronger correlation than that of D0D10 and the total spectral width. This finding indicates that the low-value pore volume region controls the overall heterogeneity of the PSD. The dimensionality spectrum is manifest more clearly than the singularity spectrum in this respect. However, the difference between the left and right spectra of the singular spectrum is more obvious than that of the dimensional spectrum. Therefore, evidently, the left and right spectral width parameters of the singular spectrum emphasize the local differences between the high- and low-value pore volume areas, whereas the dimensional spectrum width is more suitable for reflecting the overall heterogeneity of the PSD.
From the correlation structure between matrix compression and multifractal parameters, D0D10, α0α10, D−10D10, and α−10α10 have a high correlation with the compression coefficient. This suggests that the stronger the dominant role of the high-probability subset of shale pore sizes, the stronger the matrix compression effect under high pressure. The information dimension D1 and H were remarkably negatively correlated with matrix compression, suggesting that pore structure inhomogeneity and connectivity have major influences on shale compressibility. The matrix compression effect is the alteration or destruction of existing pores under very high pressure [63], accompanied by the connection of new microfractures to the closed pores (Figure 10). The closure of isolated pores in the matrix causes the surrounding primary pores and cracks to expand, which is also a mechanism of matrix compression. However, regardless of the method used, the pore expansion and microcrack formation caused by the matrix compression effect under high-pressure conditions essentially promote the connectivity of shale pores. This is consistent with the principle of increasing shale gas production capacity by shale gas reservoir fracturing. Therefore, it is reasonable that shales with poor connectivity (low H) exhibit high compressibility.
Pore connectivity is a key parameter indicating oil and gas migration in shale reservoirs [55]. Figure 11 presents the H of the selected shale samples with mineral composition and TOC. Quartz and feldspar mineral content exhibit a linear positive correlation with the H (Figure 11a,b). TOC and clay content indicate a negative linear correlation with the H (Figure 11c,d). The findings indicate that the autocorrelation of the PSD of the shale samples is significantly controlled by the rock components. In the process of shale formation, quartz and feldspar rock, with its high compressive strength and brittle properties, forms for the primary pore space a good “skeleton” protection and, considering its strength, generates a better connectivity of microcracks. Nonetheless, clay minerals and OM partially fill the pore throats under compaction, blocking the connectivity between pores. Hence, brittle minerals contribute to the connectivity of nanopore structures in shale reservoirs, whereas TOC and clay minerals with strong plasticity are not conducive to pore size autocorrelation.

5. Conclusions

In this study, the matrix compression effect of coal-measure shale and the multifractal characteristics of its pore structure were indicated by combining MIP and LP-N2-GA experiments. The research holds immense significance in comprehending the occurrence, flow matrix and fracturability of shale gas. The main conclusions can be succinctly summarized as follows:
(1) The matrix compression has a substantial influence on the MIP test results. The majority of shale samples exhibit obvious compressibility at the high injection pressure stage (>12 MPa), with compression coefficients ranging from 0.154 × 10⁻⁵ to 4.740 × 10⁻⁵ MPa−1. The compression ratio varies from 1.21% to 57.74%, with an average of 24.02%. The compressibility of coal-measure shale varies closely with the rock fraction. The presence of ductile clay minerals enhances matrix compressibility, whereas inflexible brittle minerals (such as quartz and feldspar) exhibit resistance to matrix compression. The consideration of sample matrix compressibility is essential when using the mercury injection data results of the high-pressure section.
(2) The PSD of all shale samples follows a multifractal distribution. Multiple fractal parameters can be utilized as a quantitative indicator of PSD in coal-measure shale reservoirs. Comparing the results of multifractal parameter calculations before and after correction yielded conspicuous differences. The compression of the matrix alters the physical configuration of shale pores, resulting in a transformation of heterogeneity. Moreover, there is a reduction in local fluctuations of pore volume across different pore sizes, an an improvement in the autocorrelation of PSD and a mitigation of nonuniformity after correction.
(3) Singular and dimension spectra have their own merits in multifractal characterization. The left and right spectral width parameters of the singular spectrum emphasize the local differences between the high- and low-value pore volume areas, respectively, whereas the dimensional spectrum width is more suitable for reflecting the overall heterogeneity of the PSD. Autocorrelation of the PSD of shale samples is significantly controlled by the rock components. Brittle minerals enhance nanopore connectivity in shale reservoirs, whereas TOC and clay minerals with high plasticity hinder pore-size autocorrelation.

Author Contributions

B.Z.: Methodology, Writing—original draft. Y.Z.: Conceptualization, Writing—review and editing. G.F.: Conceptualization, Writing—review and editing, Funding acquisition. J.X.: Software, Data curation. Y.W.: Investigation, Formal analysis. All authors have read and agreed to the published version of the manuscript.

Funding

This work was jointly supported by the National Natural Science Foundation of China (No. 42172156 and 42202190) and the Natural Science Foundation of Jiangsu Province, China (No. BK20221147).

Data Availability Statement

All of the data and models generated or used in this study are available from the corresponding author upon request.

Conflicts of Interest

The authors declare that they have no known competing financial interests or personal relationships that could have appeared to influence the work reported in this paper.

References

  1. Loucks, R.G.; Reed, R.M.; Ruppel, S.C.; Hammes, U. Spectrum of pore types and networks in mudrocks and a descriptive classification for matrix-related mudrock pores. AAPG Bull. 2012, 96, 1071–1098. [Google Scholar] [CrossRef]
  2. Pan, Y.; Hui, D.; Luo, P.; Zhang, Y.; Sun, L.; Wang, K. Experimental investigation of the geochemical interactions between supercritical CO2 and shale: Implications for CO2 storage in gas-bearing shale formations. Energy Fuels 2018, 32, 1963–1978. [Google Scholar] [CrossRef]
  3. Chen, L.; Jiang, Z.; Liu, Q.; Jiang, S.; Liu, K.; Tan, J.; Gao, F. Mechanism of shale gas occurrence: Insights from comparative study on pore structures of marine and lacustrine shales. Mar. Pet. Geol. 2019, 104, 200–216. [Google Scholar] [CrossRef]
  4. Wang, Y.; Liu, L.; Zheng, S.; Luo, Z.; Sheng, Y.; Wang, X. Full-scale pore structure and its controlling factors of the Wufeng–Longmaxi shale, southern Sichuan Basin, China: Implications for pore evolution of highly overmature marine shale. J. Nat. Gas Sci. Eng. 2019, 67, 134–146. [Google Scholar] [CrossRef]
  5. Feng, G.; Zhu, Y.; Chen, S.; Wang, Y.; Ju, W.; Hu, Y.; You, Z.; Wang, G. Supercritical methane adsorption on shale over wide pressure and temperature ranges: Implications for Gas-in-Place estimation. Energy Fuels 2020, 34, 3121–3134. [Google Scholar] [CrossRef]
  6. Liu, D.; Tian, T.; Liang, R.; Yang, F.; Ye, F. Characterization of shale pore structure by multitechnique combination and multifractal analysis and its significance. Geofluids 2020, 2020, 8896940. [Google Scholar] [CrossRef]
  7. Wang, Y.; Liu, L.; Cheng, H. Gas adsorption characterization of pore structure of organic-rich shale: Insights into contribution of organic matter to shale pore network. Nat. Resour. Res. 2021, 30, 2377–2395. [Google Scholar] [CrossRef]
  8. Inan, S.; Al Badairy, H.; Inan, T.; Al Zahrani, A. Formation and occurrence of organic matter-hosted porosity in shales. Int. J. Coal Geol. 2018, 199, 39–51. [Google Scholar] [CrossRef]
  9. Huang, H.; Li, R.; Jiang, Z.; Li, J.; Chen, L. Investigation of variation in shale gas adsorption capacity with burial depth: Insights from the adsorption potential theory. J. Nat. Gas Sci. Eng. 2020, 73, 103043. [Google Scholar] [CrossRef]
  10. Sun, M.; Zhang, L.; Hu, Q.; Pan, Z.; Yu, B.; Sun, L.; Bai, L.; Fu, H.; Zhang, Y.; Zhang, C. Multiscale connectivity characterization of marine shales in southern China by fluid intrusion, small-angle neutron scattering (SANS), and FIB-SEM. Mar. Pet. Geol. 2020, 112, 104101. [Google Scholar] [CrossRef]
  11. Jiang, F.; Chen, J.; Xu, Z.; Wang, Z.; Hu, T.; Chen, D.; Li, Q.; Li, Y. Organic matter pore characterization in lacustrine shales with variable maturity using nanometer-scale resolution X-ray computed tomography. Energy Fuels 2017, 31, 2669–2680. [Google Scholar] [CrossRef]
  12. Liu, K.; Ostadhassan, M.; Zhou, J.; Gentzis, T.; Rezaee, R. Nanoscale pore structure characterization of the Bakken shale in the USA. Fuel 2017, 209, 567–578. [Google Scholar] [CrossRef]
  13. Gou, Q.; Xu, S.; Hao, F.; Yang, F.; Zhang, B.; Shu, Z.; Zhang, A.; Wang, Y.; Lu, Y.; Cheng, X. Full-scale pores and micro-fractures characterization using FE-SEM, gas adsorption, nano-CT and micro-CT: A case study of the Silurian Longmaxi Formation shale in the Fuling area, Sichuan Basin, China. Fuel 2019, 253, 167–179. [Google Scholar] [CrossRef]
  14. Sun, M.; Yu, B.; Hu, Q.; Zhang, Y.; Li, B.; Yang, R.; Melnichenko, Y.B.; Cheng, G. Pore characteristics of Longmaxi shale gas reservoir in the Northwest of Guizhou, China: Investigations using small-angle neutron scattering (SANS), helium pycnometry, and gas sorption isotherm. Int. J. Coal Geol. 2017, 171, 61–68. [Google Scholar] [CrossRef]
  15. Chen, L.; Zuo, L.; Jiang, Z.; Jiang, S.; Liu, K.; Tan, J.; Zhang, L. Mechanisms of shale gas adsorption: Evidence from thermodynamics and kinetics study of methane adsorption on shale. Chem. Eng. J. 2019, 361, 559–570. [Google Scholar] [CrossRef]
  16. Liu, K.; Ostadhassan, M.; Sun, L.; Zou, J.; Yuan, Y.; Gentzis, T.; Zhang, Y.; Carvajal-Ortiz, H.; Rezaee, R. A comprehensive pore structure study of the Bakken Shale with SANS, N2 adsorption and mercury intrusion. Fuel 2019, 245, 274–285. [Google Scholar] [CrossRef]
  17. Wang, Y.; Liu, L.; Cheng, H. Pore structure of Triassic Yanchang mudstone, Ordos Basin: Insights into the impact of solvent extraction on porosity in lacustrine mudstone within the oil window. J. Pet. Sci. Eng. 2020, 195, 107944. [Google Scholar] [CrossRef]
  18. Feng, C.; Li, X.; Xu, E.; Sui, H.; Xue, F.; Xie, H. Microstructure characteristics of tectonic coal and primary coal: A case study of Guizhou, China. Nat. Resour. Res. 2023, 32, 2901–2926. [Google Scholar] [CrossRef]
  19. Ritter, H.L. Pore-size distribution in porous materials. Pressure porosimeter and determination of complete macropore size distributions. Ind. Eng. Chem. Anal. Ed. 1945, 17, 782–786. [Google Scholar] [CrossRef]
  20. Friesen, W.; Mikula, R. Mercury porosimetry of coals: Pore volume distribution and compressibility. Fuel 1988, 67, 1516–1520. [Google Scholar] [CrossRef]
  21. Cai, Y.; Li, Q.; Liu, D.; Zhou, Y.; Lv, D. Insights into matrix compressibility of coals by mercury intrusion porosimetry and N2 adsorption. Int. J. Coal Geol. 2018, 200, 199–212. [Google Scholar] [CrossRef]
  22. Zhang, M.; Fu, X.; Duan, C.; Li, Y. Influencing factor analysis of the coal matrix compressibility of middle-high rank coals. J. Nat. Gas Sci. Eng. 2020, 81, 103462. [Google Scholar]
  23. Feng, G.; Li, W.; Zhu, Y.; Wang, X.; Wang, Y.; Song, Y.; Zheng, S.; Shang, F. Matrix Compressibility and Multifractal Nature of Nanoporous Shale. Energy Fuels 2024, 38, 4057–4075. [Google Scholar] [CrossRef]
  24. Zhang, X.; Han, H.; Peng, J.; Gou, Y. Multifractal Analysis of Pore Structure and Evaluation of Deep-Buried Cambrian Dolomite Reservoir with Image Processing: A Case from Tarim Basin, NW China. Geofluids 2020, 2020, 7131573. [Google Scholar] [CrossRef]
  25. Mandelbrot, B. How long is the coast of Britain? Statistical self-similarity and fractional dimension. Science 1967, 156, 636–638. [Google Scholar] [CrossRef] [PubMed]
  26. Zhang, J.; Hu, Y. Comparative evaluation of pore structure heterogeneity in low-permeability tight sandstones using different fractal models based on NMR technology: A case study of Benxi Formation in the Central Ordos Basin. Energy Fuels 2020, 34, 13924–13942. [Google Scholar] [CrossRef]
  27. Hazra, B.; Wood, D.A.; Vishal, V.; Varma, A.K.; Sakha, D.; Singh, A.K. Porosity controls and fractal disposition of organic-rich Permian shales using low-pressure adsorption techniques. Fuel 2018, 220, 837–848. [Google Scholar] [CrossRef]
  28. Song, W.; Wang, D.; Yao, J.; Li, Y.; Sun, H.; Yang, Y.; Zhang, L. Multiscale image-based fractal characteristic of shale pore structure with implication to accurate prediction of gas permeability. Fuel 2019, 241, 522–532. [Google Scholar] [CrossRef]
  29. Han, W.; Zhou, G.; Zhang, Q.; Pan, H.; Liu, D. Experimental study on modification of physicochemical characteristics of acidified coal by surfactants and ionic liquids. Fuel 2020, 266, 116966. [Google Scholar] [CrossRef]
  30. Han, W.; Zhou, G.; Gao, D.; Zhang, Z.; Wei, Z.; Wang, H.; Yang, H. Experimental analysis of the pore structure and fractal characteristics of different metamorphic coal based on mercury intrusion-nitrogen adsorption porosimetry. Powder Technol. 2020, 362, 386–398. [Google Scholar] [CrossRef]
  31. Yao, Y.; Liu, D.; Tang, D.; Tang, S.; Huang, W. Fractal characterization of adsorption-pores of coals from North China: An investigation on CH4 adsorption capacity of coals. Int. J. Coal Geol. 2008, 73, 27–42. [Google Scholar] [CrossRef]
  32. Yang, F.; Ning, Z.; Liu, H. Fractal characteristics of shales from a shale gas reservoir in the Sichuan Basin, China. Fuel 2014, 115, 378–384. [Google Scholar] [CrossRef]
  33. Li, A.; Ding, W.; He, J.; Dai, P.; Yin, S.; Xie, F. Investigation of pore structure and fractal characteristics of organic-rich shale reservoirs: A case study of Lower Cambrian Qiongzhusi formation in Malong block of eastern Yunnan Province, South China. Mar. Pet. Geol. 2016, 70, 46–57. [Google Scholar] [CrossRef]
  34. Liu, Y.; Zhu, Y.; Wang, Y.; Chen, S. Fractal Characteristics of Nanoscale Pores in Shale and its Implications on Methane Adsorption Capacity. Fractals 2019, 27, 1940014. [Google Scholar] [CrossRef]
  35. Li, Y.; Wang, Z.; Pan, Z.; Niu, X.; Yu, Y.; Meng, S. Pore structure and its fractal dimensions of transitional shale: A cross-section from east margin of the Ordos Basin, China. Fuel 2019, 241, 417–431. [Google Scholar] [CrossRef]
  36. Li, W.; Liu, H.; Song, X. Multifractal analysis of Hg pore size distributions of tectonically deformed coals. Int. J. Coal Geol. 2015, 144, 138–152. [Google Scholar] [CrossRef]
  37. Muller, J.; Mccauley, J.L. Implication of fractal geometry for fluid flow properties of sedimentary rocks. Transp. Porous Media 1992, 8, 133–147. [Google Scholar] [CrossRef]
  38. Kravchenko, A.N.; Boast, C.W.; Bulock, D.G. Multifractal analyses of soil properties. Agron. J. 1999, 91, 1033–1041. [Google Scholar] [CrossRef]
  39. Posadas, A.N.; Giménez, D.; Quiroz, R.; Protz, R. Multifractal characterization of soil pore systems. Soil Sci. Soc. Am. J. 2003, 67, 1361–1369. [Google Scholar] [CrossRef]
  40. Montero, E.; Martín, M.Á. Hölder spectrum of dry grain volume-size distributions in soil. Geoderma 2003, 112, 197–204. [Google Scholar] [CrossRef]
  41. Anovitz, L.M.; Cole, D.R.; Rother, G.; Allard, L.F.; Jackson, A.J.; Littrell, K.C. Diagenetic changes in macro-to nano-scale porosity in the St. Peter Sandstone: An (ultra) small angle neutron scattering and backscattered electron imaging analysis. Geochim. Cosmochim. Acta 2013, 102, 280–305. [Google Scholar] [CrossRef]
  42. Liang, Z.; Jiang, Z.; Li, Z.; Song, Y.; Gao, F.; Liu, X.; Xiang, S. Nanopores Structure and Multifractal Characterization of Bulk Shale and Isolated Kerogen—An Application in Songliao Basin, China. Energy Fuels 2021, 35, 5818–5842. [Google Scholar] [CrossRef]
  43. Zhang, J.; Qin, Z.; Han, Y.; Wang, H.; Hou, M.; Yan, G.; Feng, G.; Zhang, X.; Yin, T.; Zhang, H. Pore-Fracture Distribution Heterogeneity of Shale Reservoirs Determined by using HPMI and LPN2 GA Tests. Acta Geo. Sin-Engl. 2022, 96, 1659–1672. [Google Scholar] [CrossRef]
  44. Li, F.; Jiang, B.; Cheng, G.; Song, Y.; Tang, Z. Structural and evolutionary characteristics of pores-microfractures and their influence on coalbed methane exploitation in high-rank brittle tectonically deformed coals of the Yangquan mining area, northeastern Qinshui basin, China. J. Petrol. Sci. Eng. 2019, 174, 1290–1302. [Google Scholar]
  45. Chong, H.; Liu, X.; Xi, D.; Zhang, J.; Vandeginste, V.; Wang, D.; Yao, P. Quantitative Description of Pore and Fracture Distribution Heterogeneity Using Mercury Removal Curve and Applicability of Fractal Models. Processes 2024, 12, 917. [Google Scholar] [CrossRef]
  46. GB/T 19145-2022; Determination for Total Organic Carbon in Sedimentary Rock. Standards Press of China: Beijing, China, 2022.
  47. GB/T 35210.1-2023; Determination of Isothermal Adsorption/Desorption of Methane in Shale—Part 1: Static Volumetric Method. Standards Press of China: Beijing, China, 2023.
  48. Song, Y.; Jiang, B.; Li, M.; Liu, J.; Cheng, G.; Tang, Z. Nano-porous structural evolution and tectonic control of low-medium metamorphic tectonically deformed coals—Taking Suxian mine field as an example. J. Nanosci. Nanotechnol. 2017, 17, 6083–6095. [Google Scholar] [CrossRef]
  49. Song, Y.; Jiang, B.; Shao, P.; Wu, J. Matrix compression and multifractal characterization for tectonically deformed coals by Hg porosimetry. Fuel 2018, 211, 661–675. [Google Scholar]
  50. Li, Y.H.; Lu, G.Q.; Rudolph, V. Compressibility and fractal dimension of fine coal particles in relation to pore structure characterisation using mercury porosimetry. Part. Part. Syst. Charact. 1999, 16, 25–31. [Google Scholar] [CrossRef]
  51. Halsey, T.C.; Jensen, M.H.; Kadanoff, L.P.; Procaccia, I.; Shraiman, B.I. Fractal measures and their singularities: The characterization of strange sets. Nucl. Phys. B 1987, 2, 501–511. [Google Scholar] [CrossRef]
  52. Ferreiro, J.P.; Vázquez, E.V. Multifractal analysis of Hg pore size distributions in soils with contrasting structural stability. Geoderma 2010, 160, 64–73. [Google Scholar] [CrossRef]
  53. Zhang, M.; Duan, C.; Li, G.; Fu, X.; Zhong, Q.; Liu, H.; Dong, Z. Determinations of the multifractal characteristics of the pore structures of low-, middle-, and high-rank coal using high-pressure mercury injection. J. Petrol. Sci. Eng. 2021, 203, 108656. [Google Scholar] [CrossRef]
  54. Chhabra, A.B.; Meneveau, C.; Jensen, R.V.; Sreenivasan, K.R. Direct determination of the f (α) singularity spectrum and its application to fully developed turbulence. Phys. Rev. A 1989, 40, 5284. [Google Scholar] [CrossRef]
  55. Ning, S.; Xia, P.; Hao, F.; Tian, J.; Fu, Y.; Wang, K. Pore Fractal Characteristics between Marine and Marine–Continental Transitional Black Shales: A Case Study of Niutitang Formation and Longtan Formation. Fractal. Fract. 2024, 8, 288. [Google Scholar] [CrossRef]
  56. Chen, S.; Gong, Z.; Li, X.; Wang, H.; Wang, Y.; Zhang, Y. Pore structure and heterogeneity of shale gas reservoirs and its effect on gas storage capacity in the Qiongzhusi Formation. Geosci. Front. 2021, 12, 101244. [Google Scholar] [CrossRef]
  57. Xu, Z.; Shi, W.; Zhai, G.; Peng, N.; Zhang, C. Study on the characterization of pore structure and main controlling factors of pore development in gas shale. J. Nat. Gas Geosci. 2020, 5, 255–271. [Google Scholar] [CrossRef]
  58. Muller, J. Characterization of pore space in chalk by multifractal analysis. J. Hydrol. 1996, 187, 215–222. [Google Scholar] [CrossRef]
  59. Peng, J.; Han, H.; Xia, Q.; Li, B. Evaluation of the pore structure of tight sandstone reservoirs based on multifractal analysis: A case study from the Kepingtage Formation in the Shuntuoguole uplift, Tarim Basin, NW China. J. Geophys. 2018, 15, 1122–1136. [Google Scholar] [CrossRef]
  60. Liu, K.; Ostadhassan, M.; Zou, J.; Gentzis, T.; Rezaee, R.; Bubach, B.; Carvajal-Ortiz, H. Multifractal analysis of gas adsorption isotherms for pore structure characterization of the Bakken Shale. Fuel 2018, 219, 296–311. [Google Scholar] [CrossRef]
  61. Guan, M.; Liu, X.; Jin, Z.; Lai, J. The heterogeneity of pore structure in lacustrine shales: Insights from multifractal analysis using N2 adsorption and mercury intrusion. Mar. Pet. Geol. 2020, 114, 104150. [Google Scholar] [CrossRef]
  62. Caniego, F.J.; Martí, M.A.; San José, F. Rényi dimensions of soil pore size distribution. Geoderma 2003, 112, 205–216. [Google Scholar] [CrossRef]
  63. Feng, G.; Li, W.; Zhu, Y.; Wang, Y.; Song, Y.; Zheng, S.; Shang, F. Scale-Dependent Fractal Properties and Geological Factors for the Pore Structure in Shale: Insights from Field Emission Scanning Electron Microscopy and Fluid Intrusion. Energy Fuels 2023, 37, 16519–16535. [Google Scholar] [CrossRef]
Figure 1. Outline of geological tectonic framework, sedimentary environment and sampling locations.
Fractalfract 08 00580 g001
Figure 2. Nitrogen adsorption and desorption curves and their corresponding pore type characteristics. (a) H2-type hysteresis curve; (b) H3-type hysteresis curve.
Fractalfract 08 00580 g002
Figure 3. Difference of raw and corrected MIP curves for the partial samples.
Fractalfract 08 00580 g003
Figure 4. Double-log plots of the partition function χ(q, ε) versus measure scale ε for the PSD of shale samples. (a) Sample QS-1 with the worst linear correlation, the R2 is above 0.85 for all fitted linear correlations. (b) Sample QS-8 with the best linear correlation, the R2 is above 0.98 for all fitted linear correlations.
Fractalfract 08 00580 g004
Figure 5. The relationship between matrix compressibility coefficient and material components. (a) Relationship between compressibility coefficient and quartz. (b) Relationship between compressibility coefficient and feldspar. (c) Relationship between compressibility coefficient and total organic carbon content. (d) Relationship between compressibility coefficient and clay minerals.
Fractalfract 08 00580 g005
Figure 6. Comparison of multifractal calculations by uncorrected and corrected MIP data. (a) Singularity index, α0. (b) Information dimension, D1. (c) Hurst exponent, H. (d) The width of singularity spectrum, α−10α10. (e) The width of generalized dimension spectrum, D−10D10. (f) the width difference of singularity spectrum, Rd.
Fractalfract 08 00580 g006
Figure 7. Plots of the Hausdorff dimension f[a(q)] and the singularity exponent a(q). (a) Singular spectra of samples with absolute values of Rd greater than 0.1. (b) Singular spectra of samples with absolute values of Rd less than 0.1.
Fractalfract 08 00580 g007
Figure 8. Multifractal analysis of PSD by generalized dimension. (a) Plots of mass exponent, τ(q), varying with the moment q; (b) plots of Dq versus q, ranging from q = −10 to q = 10.
Fractalfract 08 00580 g008
Figure 9. Correlation chord plots of multiple fractal parameters with matrix compression coefficients.
Fractalfract 08 00580 g009
Figure 10. Schematic of nanopore and micro-fracture variation due to matrix compression effect.
Fractalfract 08 00580 g010
Figure 11. Correlation between Hurst index (H) and mineral compositions. (a) The relationship between H and quartz; (b) the relationship between H and feldspar; (c) the relationship between H and TOC; (d) the relationship between H and clay.
Fractalfract 08 00580 g011
Table 1. Basic constituents information of the shale samples.
Sample IDTOC(%)Whole-Rock Minerals(%)
Total ClaysQuartzFeldsparCalciteDolomiteSideritePyrite
QS-12.6964.931.62.41.1000
QS-20.5838.340.41206.62.70
QS-31.3752.438.96.4002.30
QS-42.1445.541.24.1009.20
QS-52.6571.424.54.10000
QS-62.8368.929.100020
QS-70.6856.936.45001.70
QS-81.6658.434.3003.903.4
QS-93.1859.531.90002.46.2
Table 2. The matrix compression coefficient and its calculation parameters.
Sample IDVS, Matrix Volume (cm3/g) d V s / d P ω s (10−5 MPa−1) 6 10 ^ 5 V r a w  
(cm3/g)
6 10 ^ 5 V c o r r e c t e d  
(cm3/g)
Compression Ratio (%)
QS-10.44650.72391.62100.00610.004731.08
QS-20.43270.06650.15400.01010.01001.21
QS-30.44380.25120.56600.00550.00509.93
QS-40.44510.27570.61900.00720.00677.49
QS-50.44332.08844.71100.01150.007357.74
QS-60.43371.29752.99200.00760.005052.46
QS-70.43210.43501.00700.00600.005117.28
QS-80.43700.59161.35400.00470.003630.32
QS-90.43810.19550.44600.00480.00448.64
Note: ω s   is the matrix compressibility coefficient; Vraw is the raw mercury volume increment; Vcorrecred is the corrected mercury volume increment; compression ratio = (VrawVcorrected)/Vcorrected.
Table 3. Nano-aperture multifractal singular spectrum parameters and dimension spectrum parameters of shale samples.
Sample IDα0α0 − α10α−10 − α0α−10 − α10RdHD0D1D2D0D10D−10D0D−10D10
QS-11.0710.6960.4881.1830.2080.8150.9440.7900.6310.5190.4780.998
QS-21.0510.4160.3360.7520.0800.8890.9440.8450.7770.2780.3530.631
QS-31.0790.5590.4771.0360.0820.8560.9440.8120.7120.3870.4720.859
QS-41.0790.6460.3150.9610.3310.8320.9440.7940.6630.4690.3510.820
QS-51.1470.7770.3831.1600.3950.7910.9440.7320.5830.4810.4240.904
QS-61.1320.7040.3281.0320.3750.8090.9440.7500.6180.4810.4240.904
QS-71.1280.7340.3921.1260.3420.8080.9440.7540.6160.5100.4550.965
QS-81.1740.7410.7681.510-0.0270.8300.9440.7600.6600.4650.8281.293
QS-91.0830.5800.3250.9050.2560.8480.9440.8030.6970.4020.3720.774
Disclaimer/Publisher’s Note: The statements, opinions and data contained in all publications are solely those of the individual author(s) and contributor(s) and not of MDPI and/or the editor(s). MDPI and/or the editor(s) disclaim responsibility for any injury to people or property resulting from any ideas, methods, instructions or products referred to in the content.

