Article

Soliton Solutions and Chaotic Dynamics of the Ion-Acoustic Plasma Governed by a (3+1)-Dimensional Generalized Korteweg–de Vries–Zakharov–Kuznetsov Equation

1
Department of Mathematics, College of Science, University of Ha’il, Ha’il 55476, Saudi Arabia
2
Department of Mathematics, College of Science, Qassim University, Buraydah 52571, Saudi Arabia
3
Department of Mathematics, Turabah University College, Taif University, Taif 21944, Saudi Arabia
4
Department of Mathematics, Faculty of Science, Northern Border University, Arar 73213, Saudi Arabia
5
Department of Mathematics, Faculty of Science, Islamic University of Madinah, Madinah 42351, Saudi Arabia
*
Authors to whom correspondence should be addressed.
Fractal Fract. 2024, 8(11), 673; https://doi.org/10.3390/fractalfract8110673
Submission received: 2 October 2024 / Revised: 28 October 2024 / Accepted: 7 November 2024 / Published: 19 November 2024

Abstract

:
This study explores the novel dynamics of the (3+1)-dimensional generalized Korteweg–de Vries–Zakharov–Kuznetsov (KdV-ZK) equation. A Galilean transformation is employed to derive the associated system of equations. Perturbing this system allows us to investigate the presence and characteristics of chaotic behavior, including return maps, fractal dimension, power spectrum, recurrence plots, and strange attractors, supported by 2D and time-dependent phase portraits. A sensitivity analysis is demonstrated to show how the system behaves when there are small changes in initial values. Finally, the planar dynamical system method is used to derive anti-kink, dark soliton, and kink soliton solutions, advancing our understanding of the range of solutions admitted by the model.

1. Introduction

Nonlinear partial differential equations (PDEs) are fundamental techniques for describing a wide array of natural phenomena in various fields, including aerospace industries, science, and engineering [1,2]. A central focus in the study of these phenomena is finding solutions to nonlinear mathematical models. Various effective methods exist for deriving exact solutions to nonlinear PDEs, including the exponential rational function approach [3], the variation of parameters method [4], the generalized separation of variable (GSV) methods [5], the inverse scattering technique [6], the modified hyperbolic function method [7], the Exp ( ϕ ( ζ ) ) expansion method [8], the extended G G 2 expansion method [9], the planar dynamical system scheme [10], and many others [11,12,13,14,15].
Extensive research has documented different kinds of soliton solutions, such as bright, dark, and kink solitons. Tariq et al. [16] derived bright solitons using a novel F-expansion approach for the (2+1)-dimensional chiral equation. Ding et al. [17] investigated dark solitary waves in the context of the Davey–Stewartson II model. Similarly, Chen and co-authors [18] discovered kink waves in the 3D BLMP equation using the three-wave method.
In contemporary research, mathematicians extensively engage with nonlinear PDEs and their associated dynamical systems (DSs). The use of advanced symbolic software has greatly improved the comprehension of these systems, enabling more structured analysis. Investigating dynamical systems (DSs) includes approaches like bifurcation analysis, sensitivity analysis, and examining chaotic behaviors. Recently, academic interest has grown significantly in these facets of DSs. Prominent examples include investigations of the Radhakrishnan–Kundu–Lakshmanan equation [19], the nonlinear Schrödinger equation [20], the Kadomtsev–Petviashvili equation in (3+1)-dimensional equations, the Jimbo–Miwa equation in (3+1)-dimensional equations [21], and the Sasa–Satsum model equation [22].
This study focuses on a comprehensive examination of the (3+1)-dimensional generalized KdV-ZK equation:
G t + λ 1 G 2 G x + λ 2 G x x x + λ 3 G y y + G z z x = 0 .
Here, G is a function of the spatial variables x ,   y ,   z and the temporal variable t, while λ 1 ,   λ 2 , and λ 3 are constants. Our analysis aims to deeply illustrate the dynamics of this equation. We begin with a Galilean transformation, a foundational step that allows us to derive the dynamical system (DS) associated with model (1). Using the comprehensive framework of planar DSs, we perform an in-depth bifurcation analysis, uncovering the intricate behaviors of the system. Additionally, we demonstrate the model’s chaotic dynamics by introducing a perturbation term to the DS. We display these chaotic behaviors via a variety of two- and three-dimensional phase plots, offering a comprehensive understanding of the system’s complex dynamics.
Moreover, we utilize the RK4 method to study sensitivity analysis. This endeavor reveals the resilience and stability of the obtained solutions when subjected to minor alterations in initial values. By introducing slight changes and examining their effects on stability, we gain a comprehensive understanding of the bifurcation analysis for the unperturbed DS, accompanied by intricate phase diagrams. Additionally, we consider chaos in the perturbed DS, using diverse methodologies to detect chaotic outlines in both temporal sequences and phase diagrams.
Finally, we employ the planar DS approach to construct various bright, dark, and kink soliton solutions for the governing system. Significantly, this type of exploration has not been previously undertaken within the framework of the considered equation.

2. Dynamics of the Aforementioned Model

In this section, we transform the proposed PDE into an ODE, followed by its conversion into a system of ODEs. Let the (3+1)-dimensional generalized KdV-ZK equation be given by
G t + λ 1 G 2 G x + λ 2 G x x x + λ 3 G y y + G z z x = 0 .
Now, consider the following wave transformation:
G x , t = Z δ ,
where δ = ϱ t + ζ 1 x + ζ 2 y + ζ 3 z . Substituting Equation (3) into Equation  (2), we obtain the following ODE:
ϱ Z δ + λ 1 ζ 1 Z 2 δ Z δ + λ 2 ζ 1 3 Z δ + λ 3 ζ 1 ζ 2 2 Z δ + ζ 1 ζ 3 2 Z δ = 0 .
Integrating Equation (3) with respect to δ , we have
ζ 1 Z ( δ ) λ 3 ζ 2 2 + ζ 3 2 + ζ 1 2 λ 2 + 1 3 ζ 1 λ 1 Z ( δ ) 3 ϱ Z ( δ ) = 0 .
From Equation (5), one can obtain the following dynamical system:
d Z δ d δ = W , d W δ d δ = F 1 Z 3 δ + F 2 Z ( δ ) ,
where F 1 = λ 1 3 λ 3 ζ 2 2 + ζ 3 2 + ζ 1 2 λ 2 , F 2 = ϱ ζ 1 λ 3 ζ 2 2 + ζ 3 2 + ζ 1 2 λ 2 .

3. Periodic Orbits

In dynamical models, periodic orbits are observed when the system’s trajectory visit goes back to its initial state after a fixed period, following a repeating cycle.
For the generalized KdV-ZK equation, the system initially displays periodic behavior when specific parameters, such as the parameter M and frequency u , are small. As these parameters increase, the system undergoes a transition from order (periodic or quasi-periodic motion) to chaos. This transition can be explored by analyzing the governing system with varying parameter values.
By simulating the system with small values for M and u , we observe regular, periodic behavior. For example, with M = 0.01 and u = 0.01 , the phase portraits exhibit a closed loop, indicating that the system follows a periodic orbit, as can be observed in Figure 1.

3.1. Transition from Order to Chaos

The transition from order to chaos is a critical juncture in the behavior of the system. The bifurcation analysis helps us understand this transition by examining how variations in parameters M and u affect the system’s trajectory.
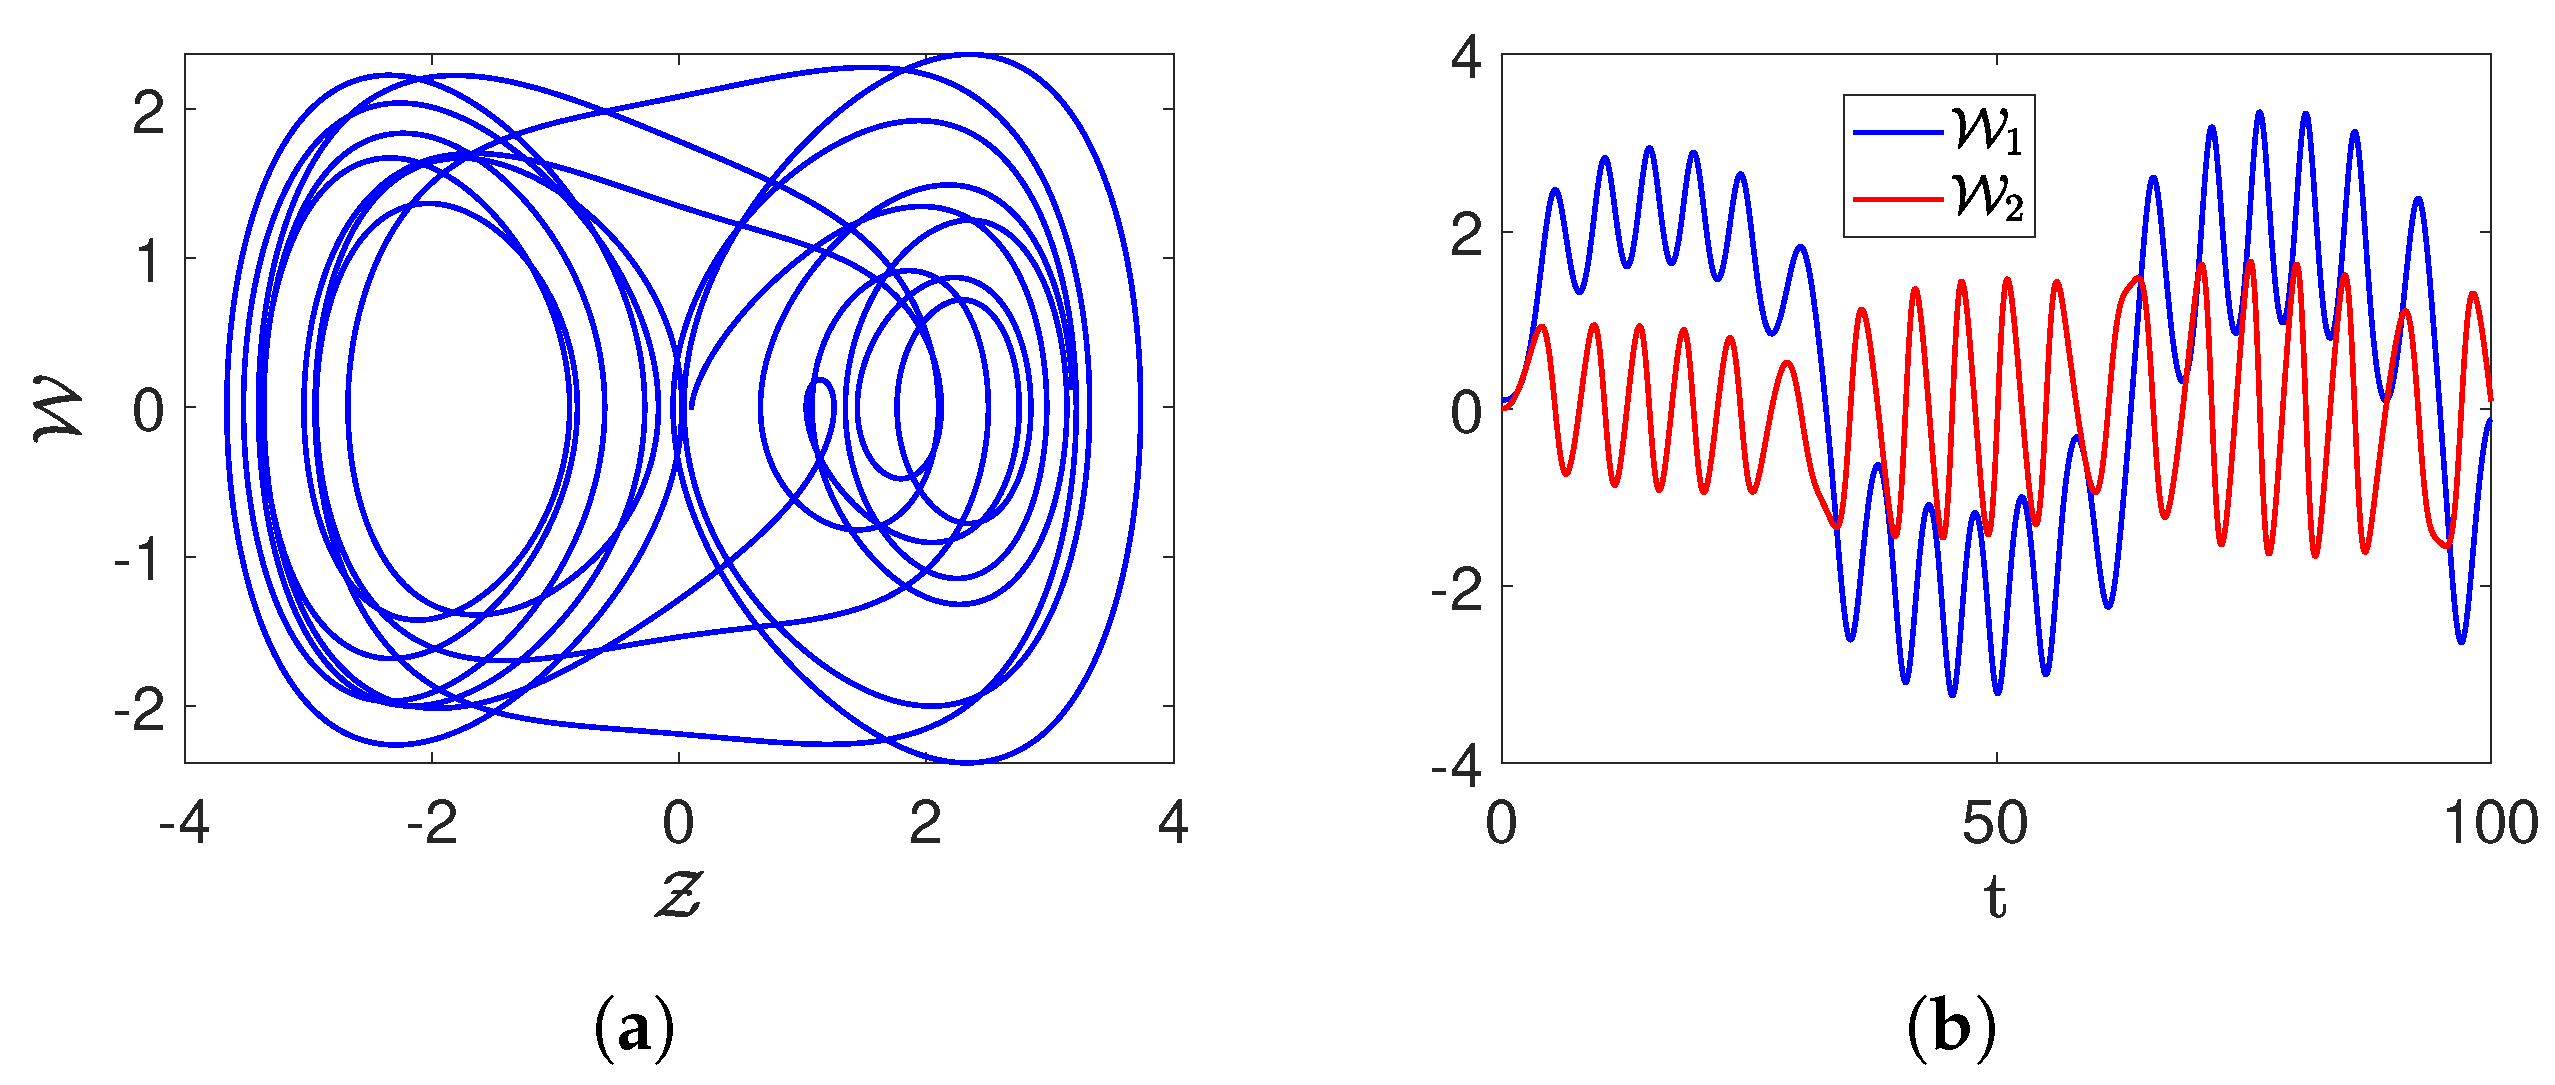
As M and u increase (e.g., M = 0.4 , u = 0.4 ), we notice that the phase portraits begin to stretch and fold, representing chaos. The system no longer follows a closed, periodic path but instead moves through a strange attractor, indicating chaotic behavior. The diagrams below show how the system evolves as the value of M is increased, leading to the onset of chaos:
d Z ( t ) d t = W ( t ) , d W ( t ) d t = F 1 Z 3 ( t ) + F 2 Z ( t ) + M sin ( u t ) ,
where the introduction of the term M sin ( u t ) induces the chaotic behavior which can be observed in Figure 2.

3.2. Chaos and Other Novel Dynamics of the Proposed System

This section investigates the chaotic and other novel dynamical behaviors of the proposed system. Here, we study the chaotic behavior of the system (6) by introducing a perturbed term. We then analyze the resulting two- and three-dimensional phase portraits. The perturbed dynamical system is given by
d Z t d t = W ( t ) , d W t d t = F 1 Z 3 t + F 2 Z t + M sin u t .
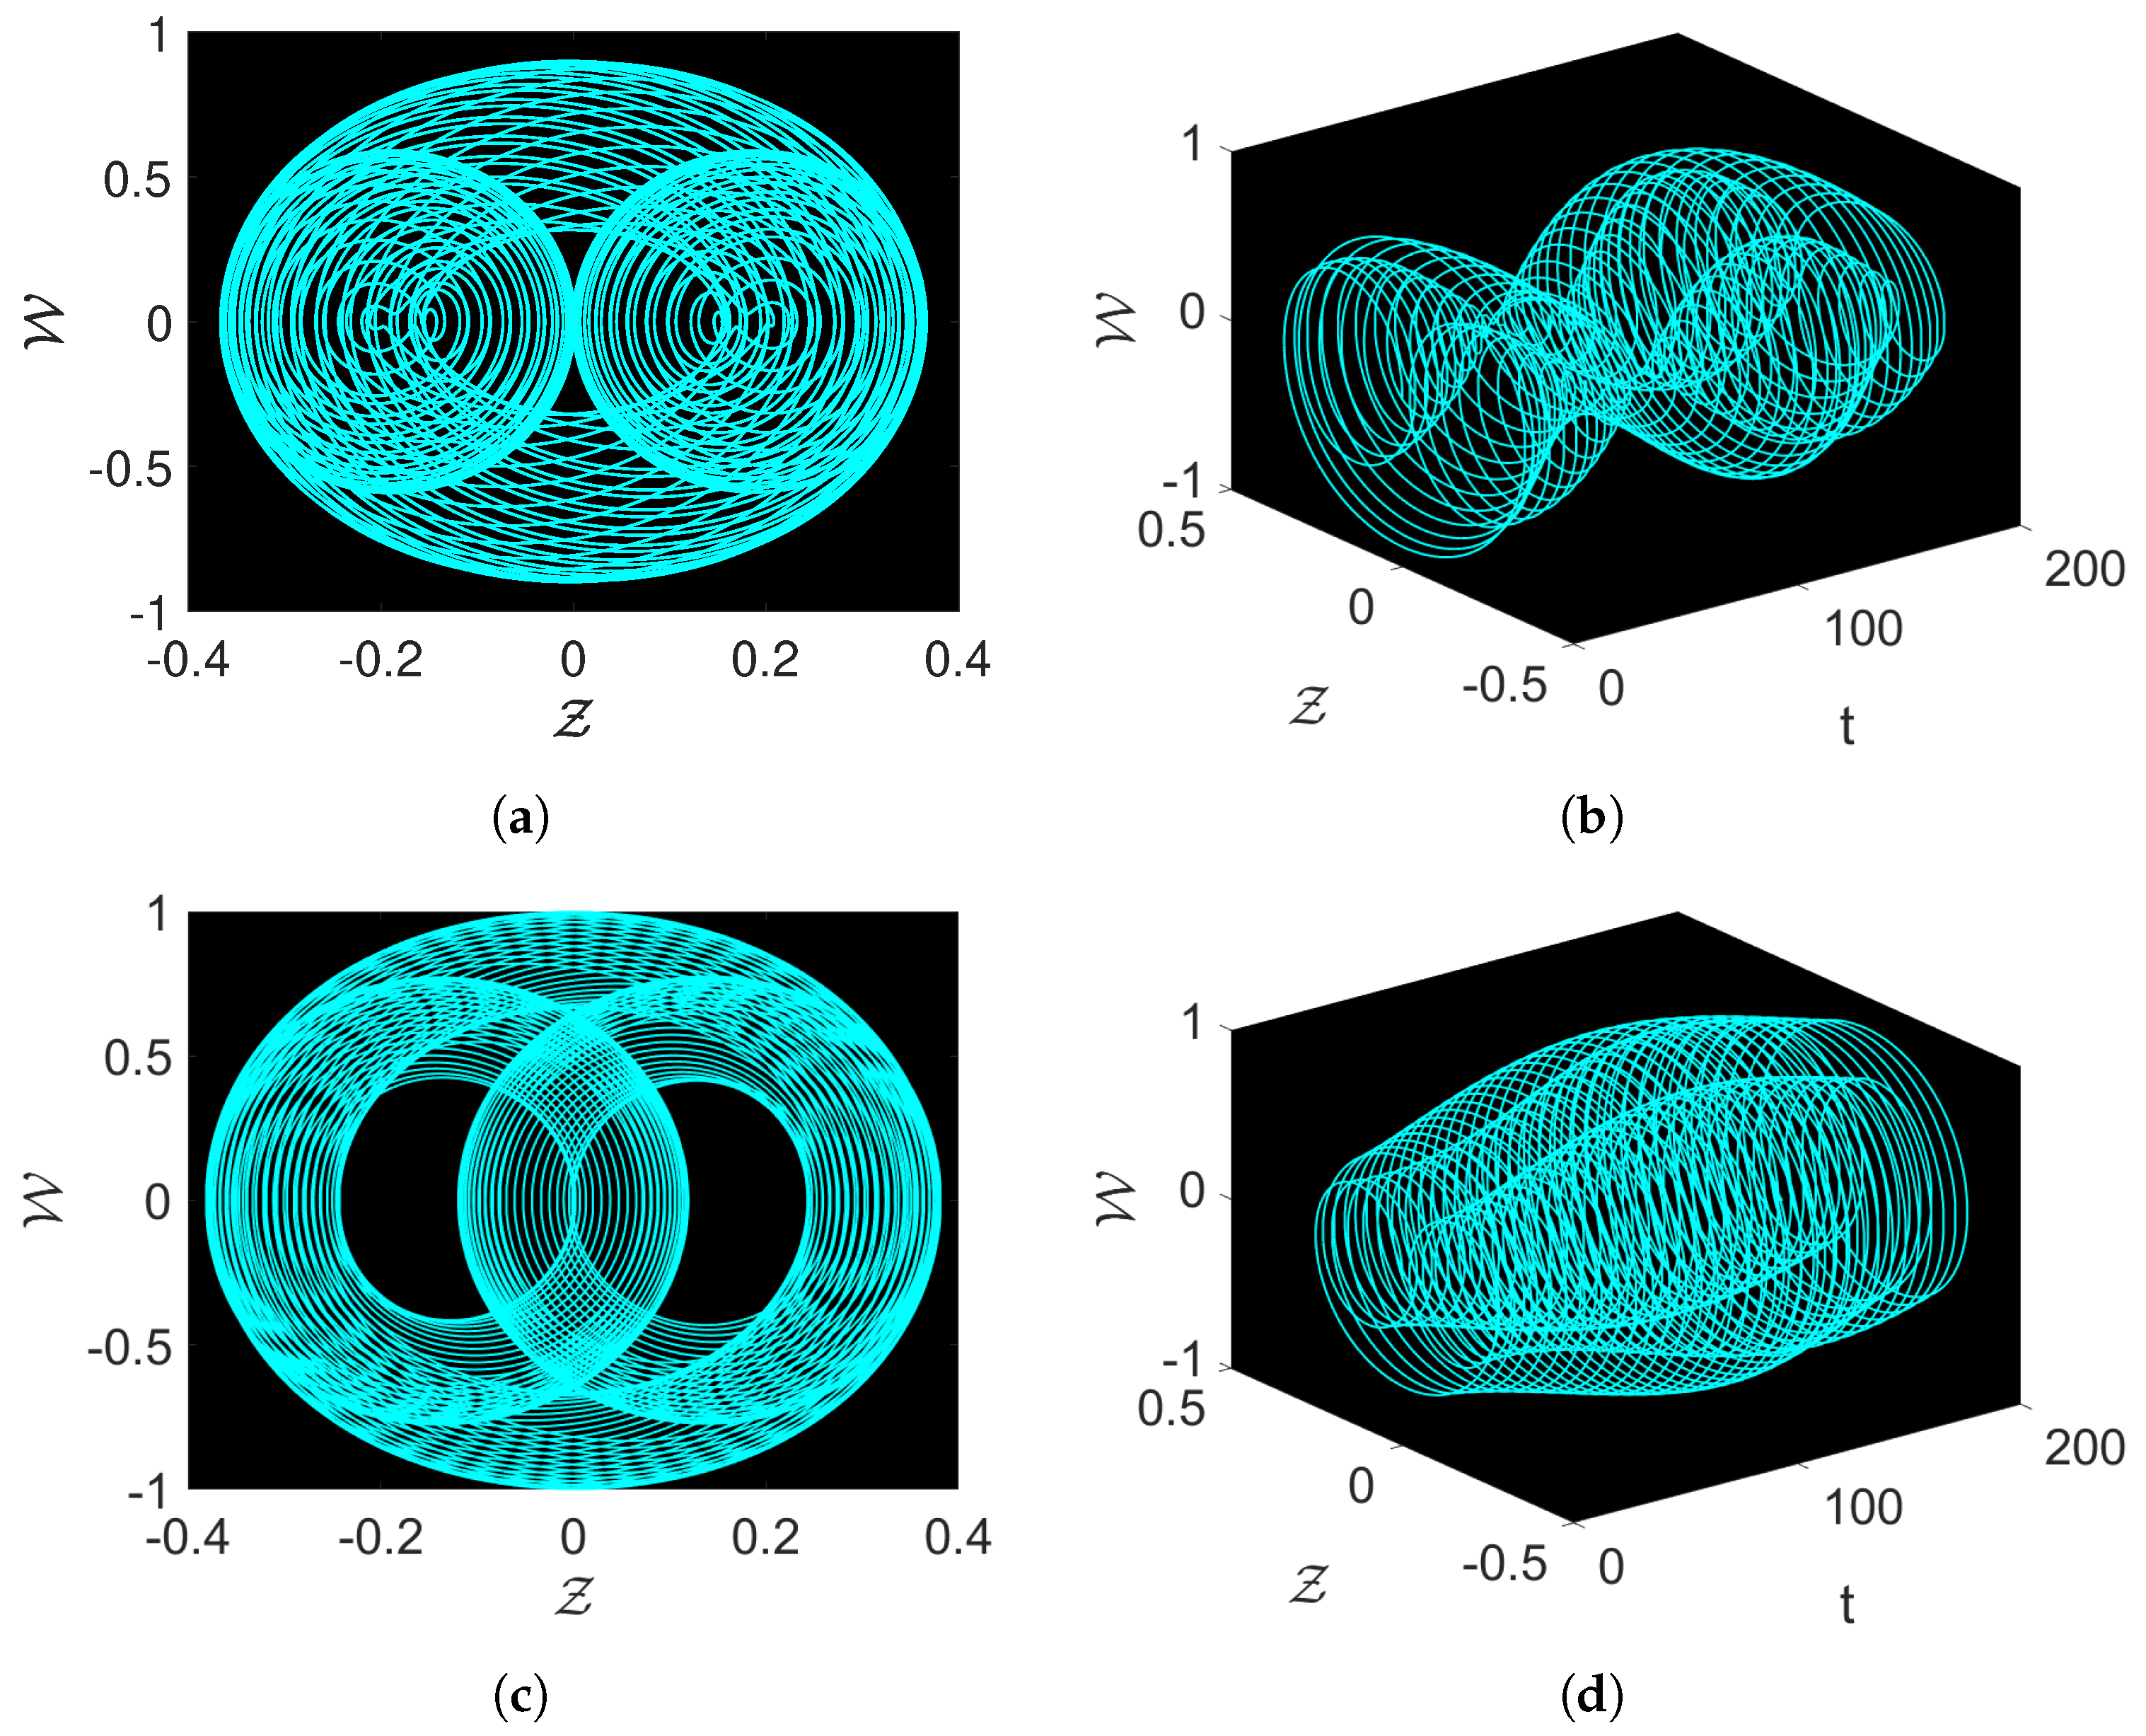
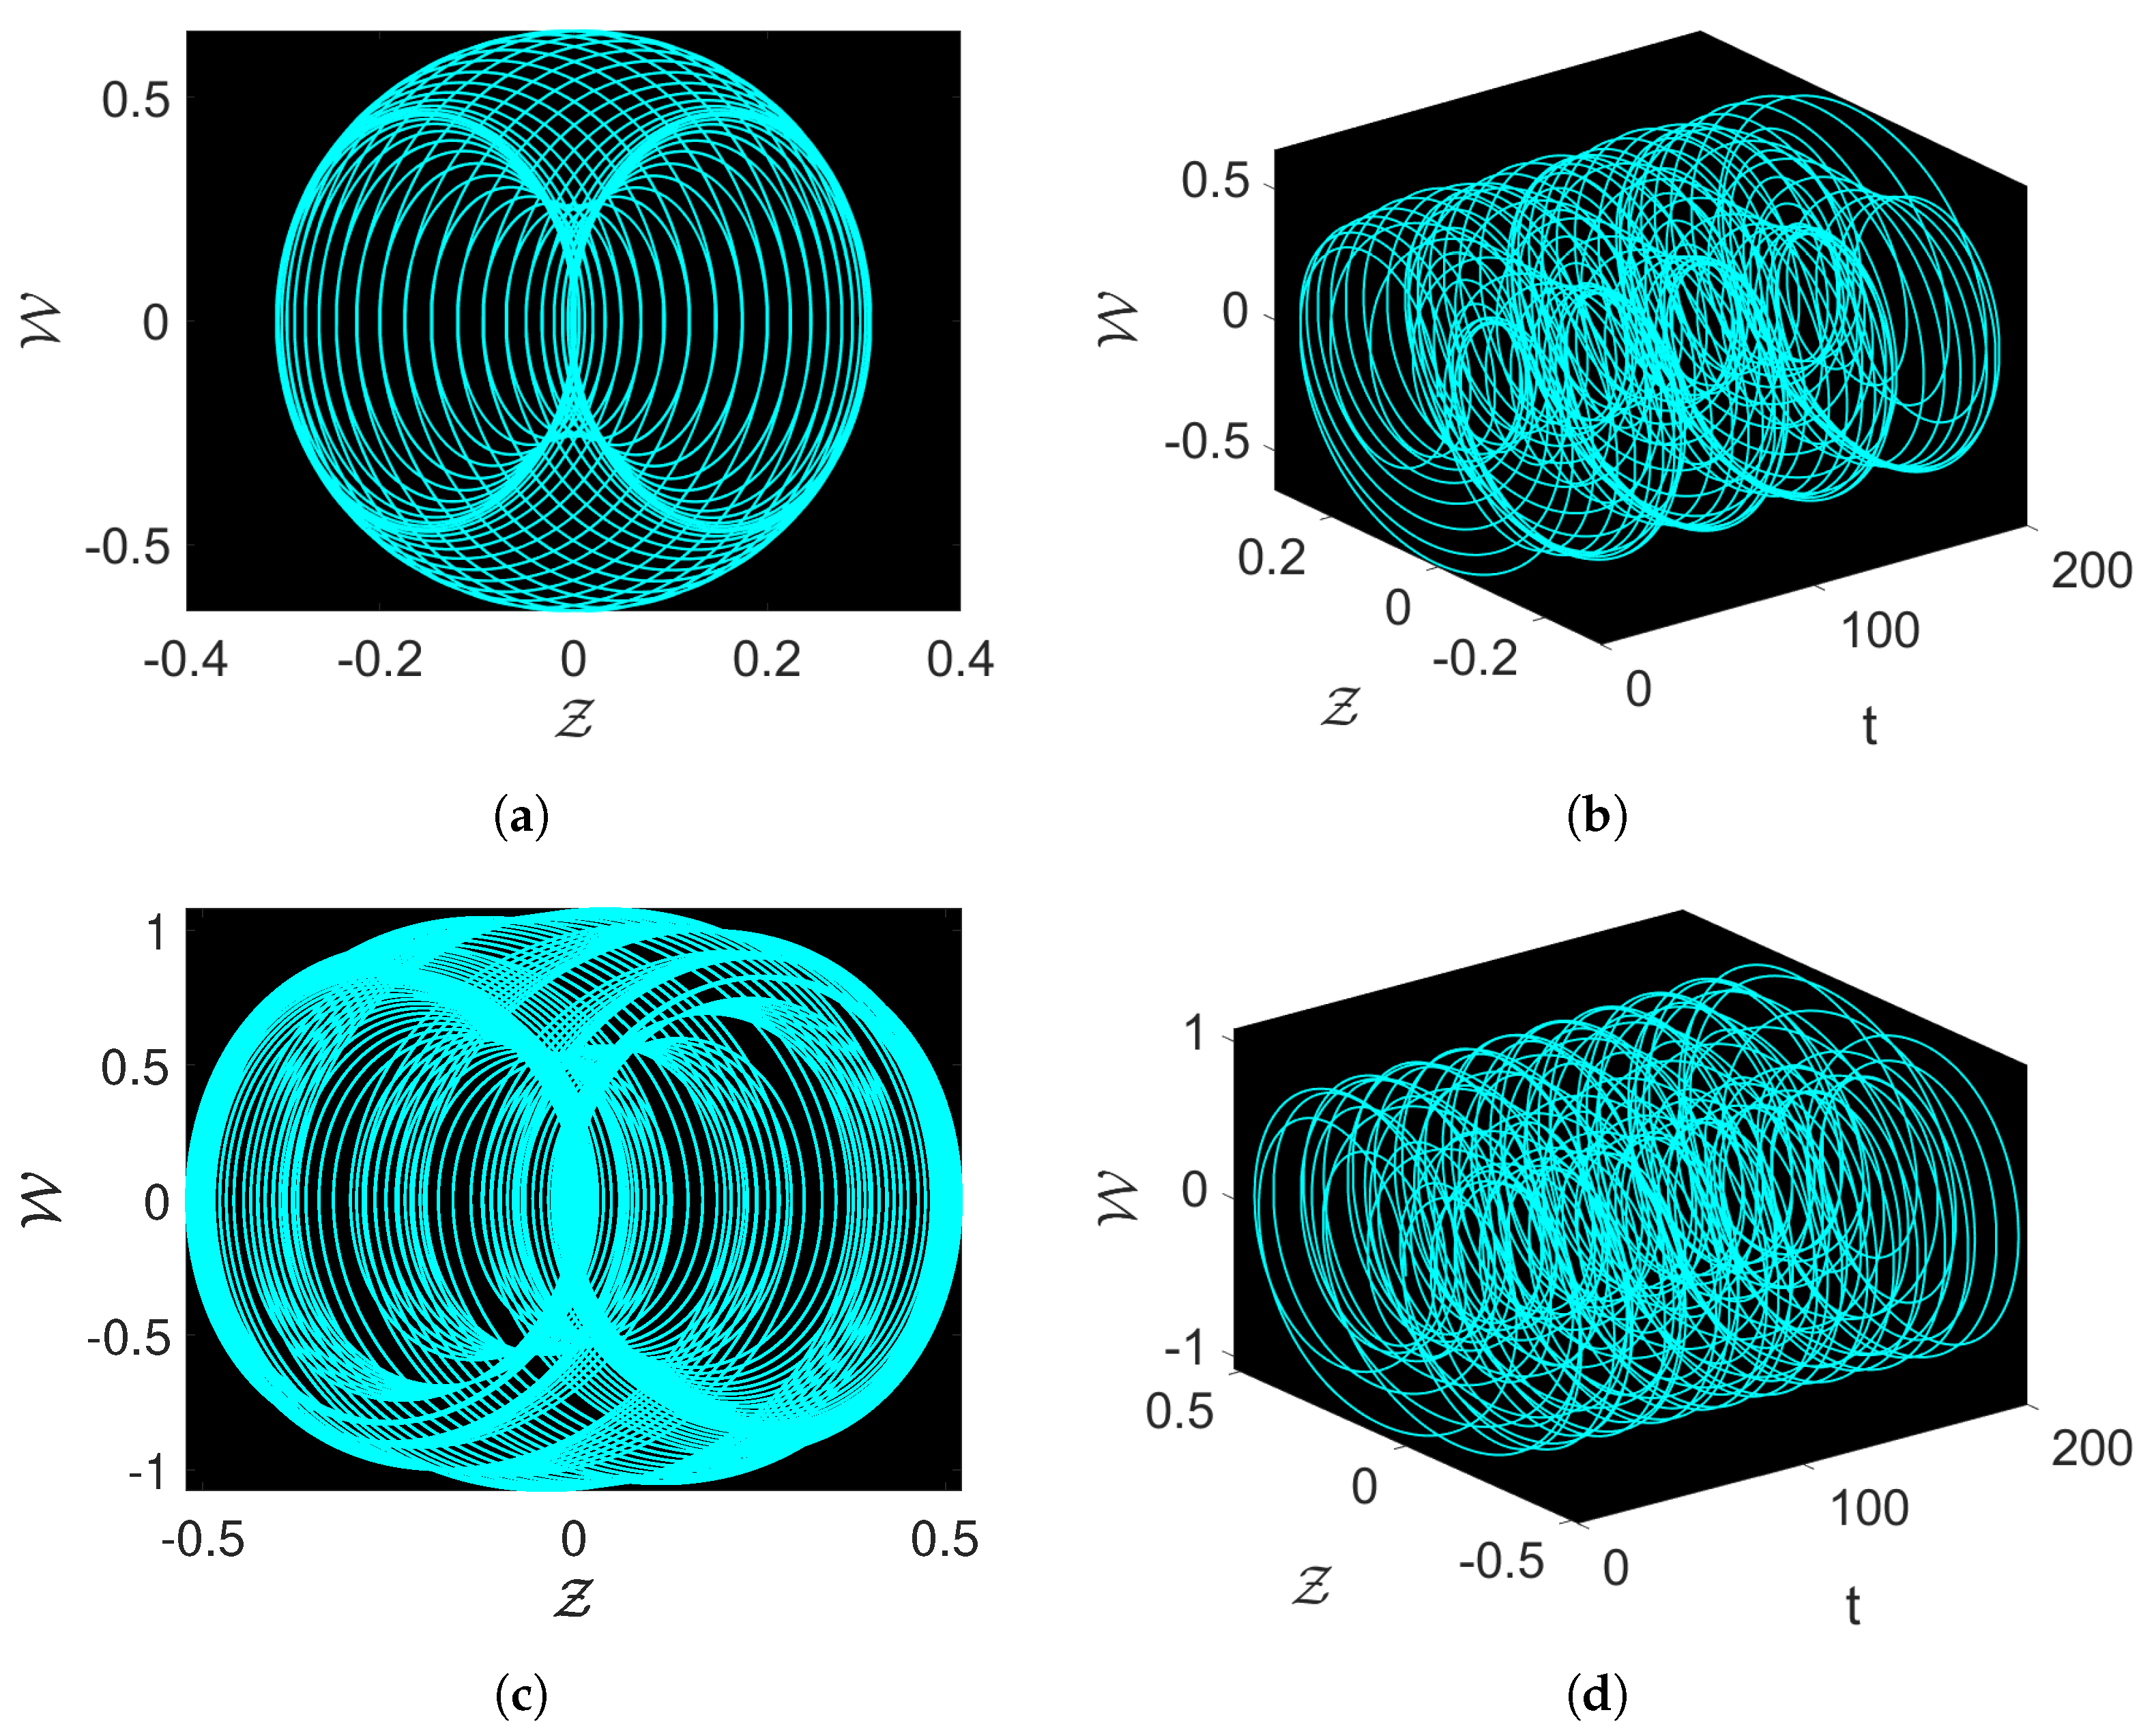
Figure 3 and Figure 4 illustrate the effect of the perturbation term M sin ( u t ) on the system (7). Here, M and u denote the amplitude and frequency, respectively. Different values of M and u are considered for the simulations in Figure 3 and Figure 4. The 2D figures represent the dynamics of the state variables Z W , and the 3D phase portraits show the dynamics versus time. The parameters are fixed as λ 1 = 0.01 , λ 2 = 2 , λ 3 = 1 , ζ 1 = 1 , ζ 2 = 1 , ζ 3 = 0.4 , and ϱ = 0.7 , while various values for M and u are assumed.
For Figure 3a,b, M = 1.8 and u = 1 , and for Figure 3c,d, M = 1.3 and u = 1 . For Figure 4a,b, M = 1.3 and u = 0.95 , and for Figure 4c,d, M = 2.3 and u = 0.85 . Upon investigation of the phase portraits, intriguing dynamics unfold. In Figure 3a,b, the DS described by Equation (7) demonstrates strange chaotic behavior, while the multiscroll attractors can be seen in Figure 3c,d. Furthermore, some more complex structures are observed in Figure 4. These observations highlight how the system is influenced by changes in the parameters u and M and give treasured insights into the effects of M sin ( u t ) on the system’s conduct as a whole.

3.3. Sensitivity

Here, we study the sensitivity of the system (6) by varying the initial conditions of the governing system, therefore solving the following system:
d Z t d t = W , d W t d t = F 1 Z 3 t + F 2 Z t + M sin ( u t ) .
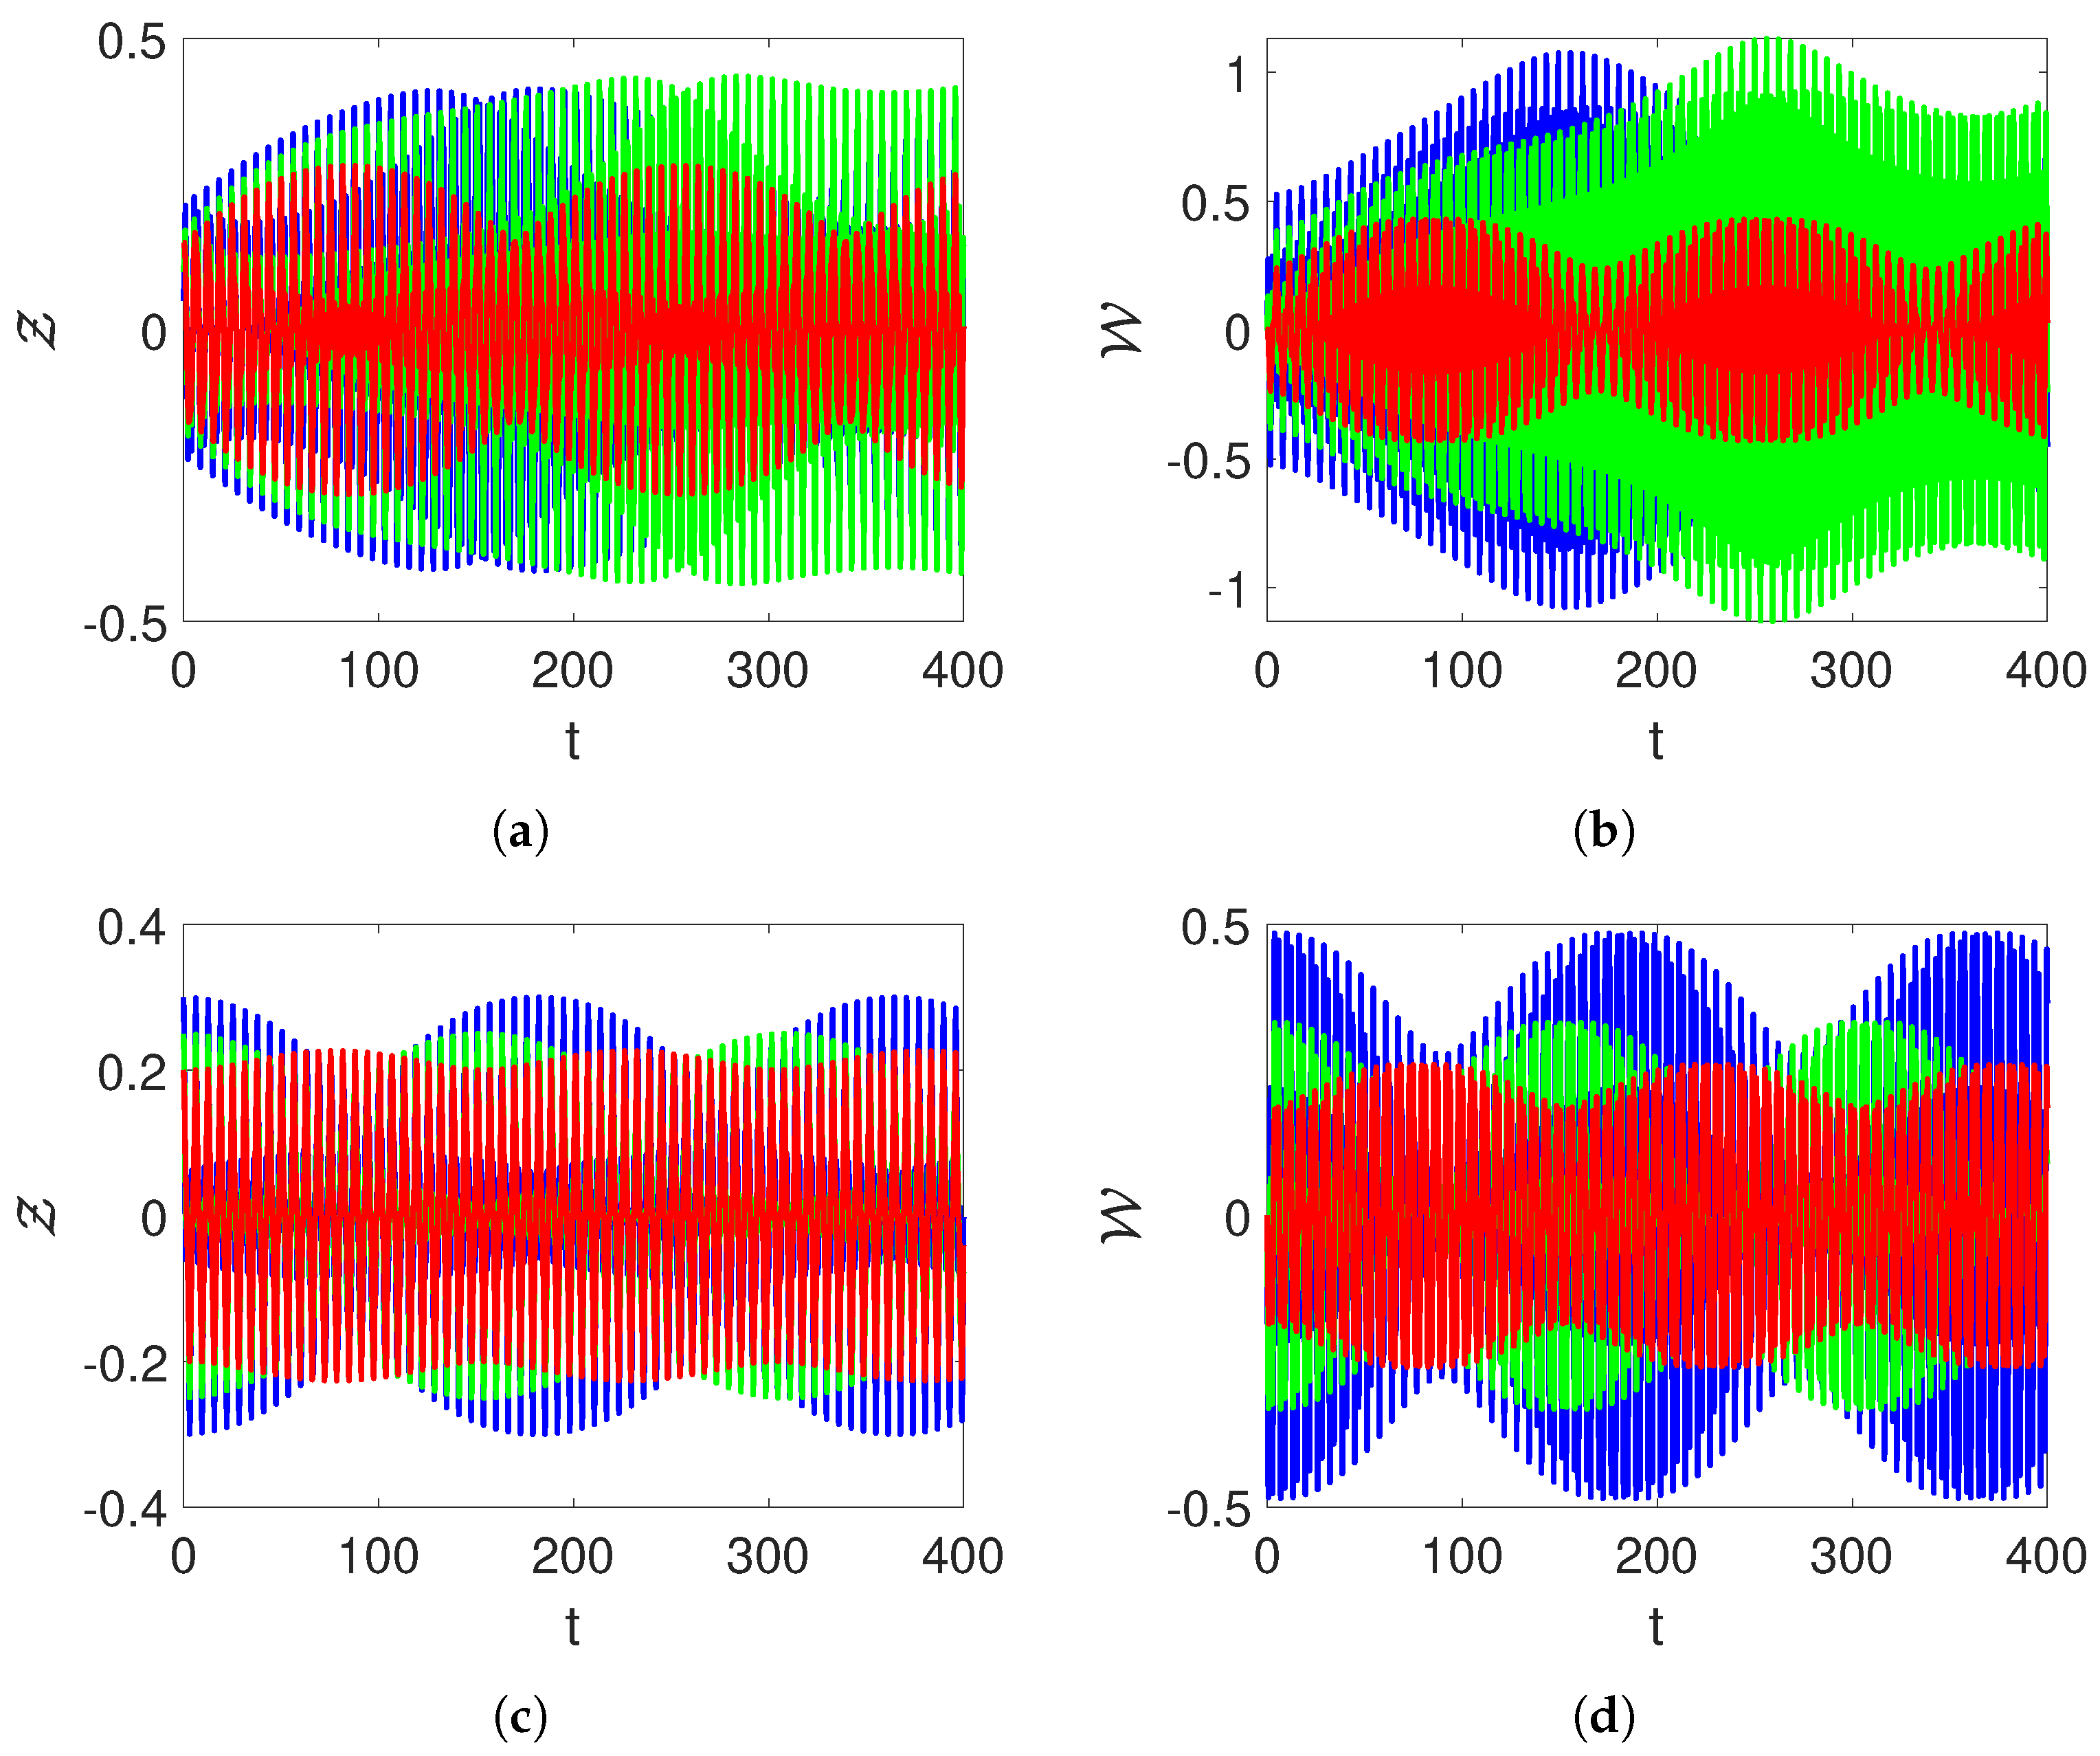
We implement the RK4 method with the specific values of λ 1 = 0.01 , λ 2 = 2 , λ 3 = 1 , ζ 1 = 1 , ζ 2 = 1 , ζ 3 = 0.4 , ϱ = 0.7 , M = 1 , and u = 1 with the following initial conditions in Figure 5a,b: blue color curves represent Z 0 = 0.1 and W = 0 , green color curves represent Z 0 = 0.15 and W = 0 , and red color curves represent Z 0 = 0.2 and W = 0 .
For Figure 5c,d, the following values are used:
Blue color curves: Z 0 = 0 and W = 0.1 ; green color curves: Z 0 = 0 and W = 0.15 ; and red color curves: Z 0 = 0 and W = 0.2 .
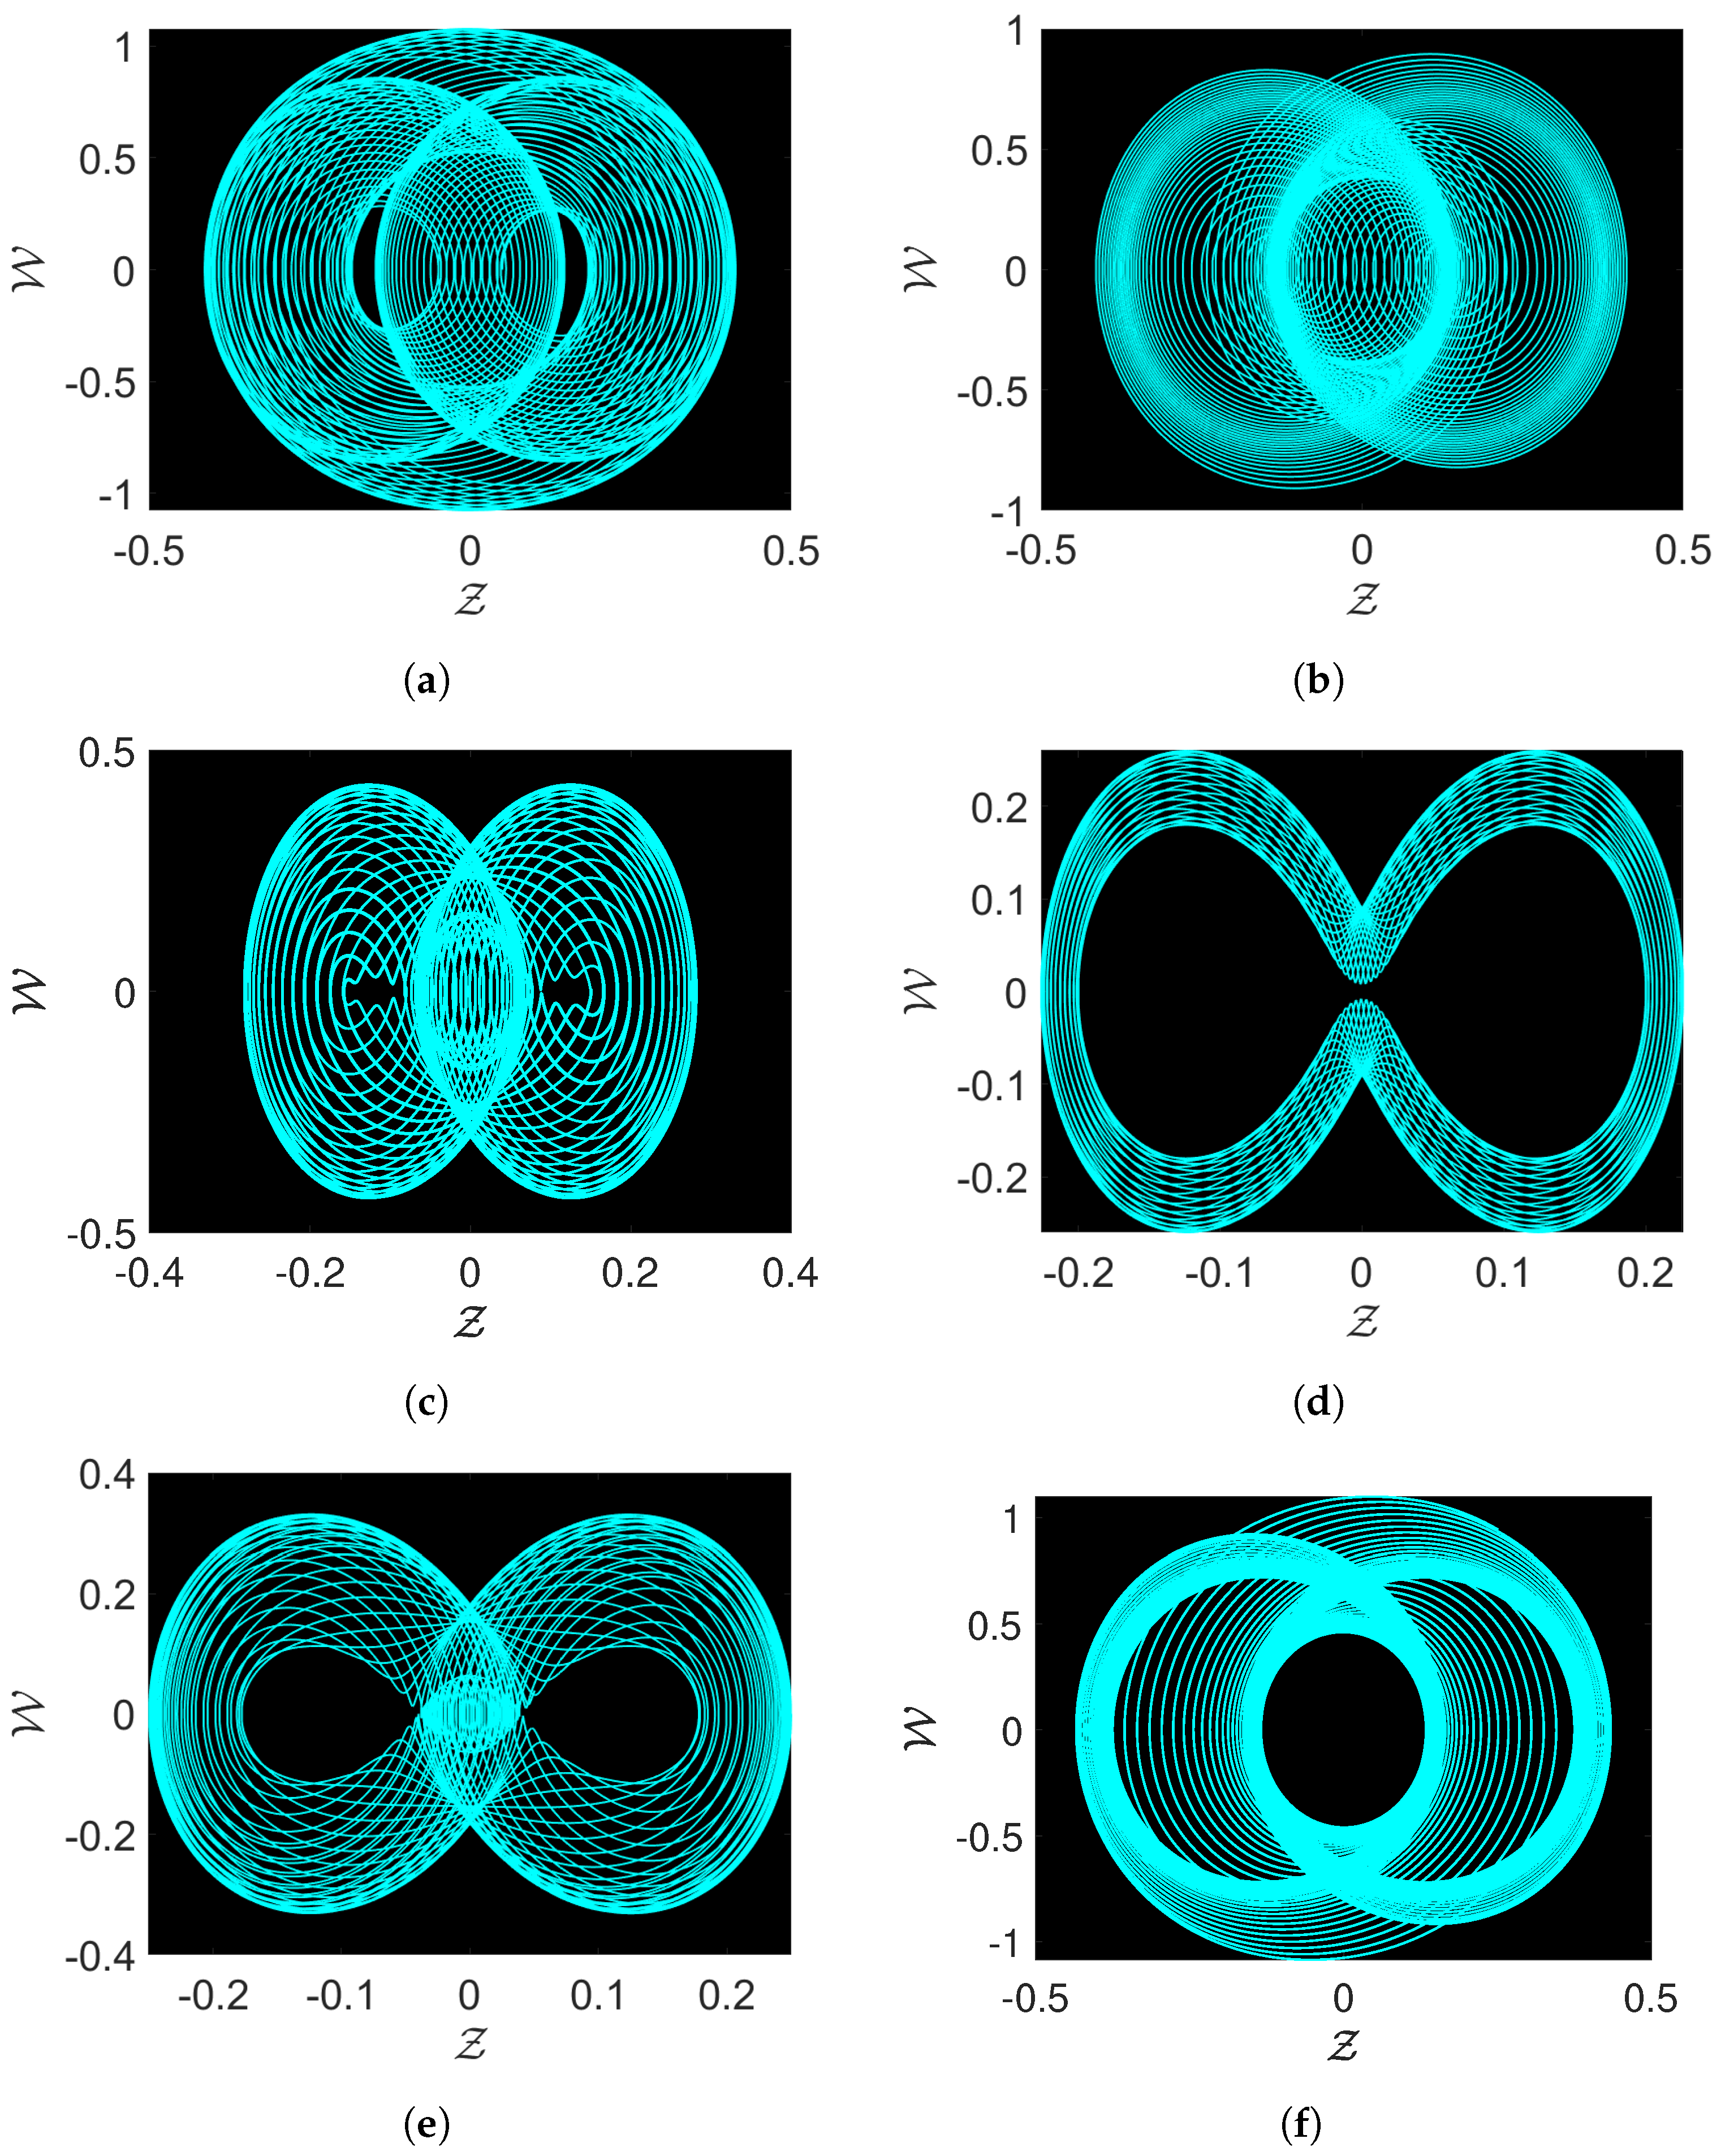
The simulations of the phase portraits are carried out using the RK4 method with d t = 0.01 . The phase portraits in Figure 5 reveal intricate details of the chaotic behavior of the proposed system under various initial conditions. Each subplot shows the trajectories in the W Z plane, where the dynamics of the system unfold in a complex and non-repeating manner, indicative of strange attractors. Strange attractors are characterized by their fractal structure, meaning that trajectories exhibit self-similar patterns at different scales, and their paths never repeat. This fractal nature is evident in the dense looping patterns observed in the figures, where the trajectories do not converge to fixed points or repeating cycles but continue to evolve seemingly randomly.
In Figure 5a,b, where the initial values vary in Z ( 0 ) while keeping W ( 0 ) constant, the blue, green, and red curves show the distinct paths for slight differences in Z ( 0 ) . This sensitive nature toward initial conditions is a hallmark of chaos, where small variations can lead to vastly different outcomes. The resulting trajectories are densely packed and complex, filling the phase space without forming closed loops or periodic patterns. This behavior reveals that the system is highly sensitive to initial conditions and its long-term dynamics are unpredictable.
Similarly, Figure 5c,d show the phase dynamics for varying initial values of W ( 0 ) while keeping Z ( 0 ) constant. The obtained trajectories again highlight the chaotic nature of the proposed system. The complex loops in these figures indicate the possible presence of strange attractors, further emphasizing the chaotic dynamics. The trajectories do not settle into fixed points or limit cycles, reinforcing the idea that the system’s evolution is highly sensitive to initial conditions and exhibits a complex interplay between the system states.
The simulations in Figure 6 are carried out using the O d e 45 built-in function in MATLAB R21b with d t = 0.01 . The initial conditions used are presented earlier in this section. The complex dynamics observed across the phase portraits in Figure 6 suggest that the system oscillates in a chaotic regime for the considered parameter values with varying initial conditions. The strange attractors depicted here illustrate the system’s fractal nature, where the trajectories occupy a fractal subset in the phase space. This fractal dimension, which is typically non-integer, reflects the complexity and density of the attractors. In the following section, the fractal dimension is visualized for better understanding. Analyzing these strange attractors is crucial for investigating the system’s behavior as they provide insights into the sensitive and unpredictable nature of chaotic dynamics.
In summary, the phase diagrams in Figure 6 highlight the presence and evolution of strange attractors in the W Z plane, characterized by their fractal patterns and sensitivity to initial conditions. These strange attractors signify the chaotic dynamics of the system, where small variations in initial values can lead to significantly different trajectories. The dense and complex patterns observed in the phase diagrams underscore the system’s unpredictable behavior, making long-term predictions challenging despite the deterministic nature of the governing equations. Understanding these attractors is crucial for analyzing chaotic systems and exploring methods to control or stabilize their behavior.

3.4. Novel Dynamical Analysis of the Proposed System

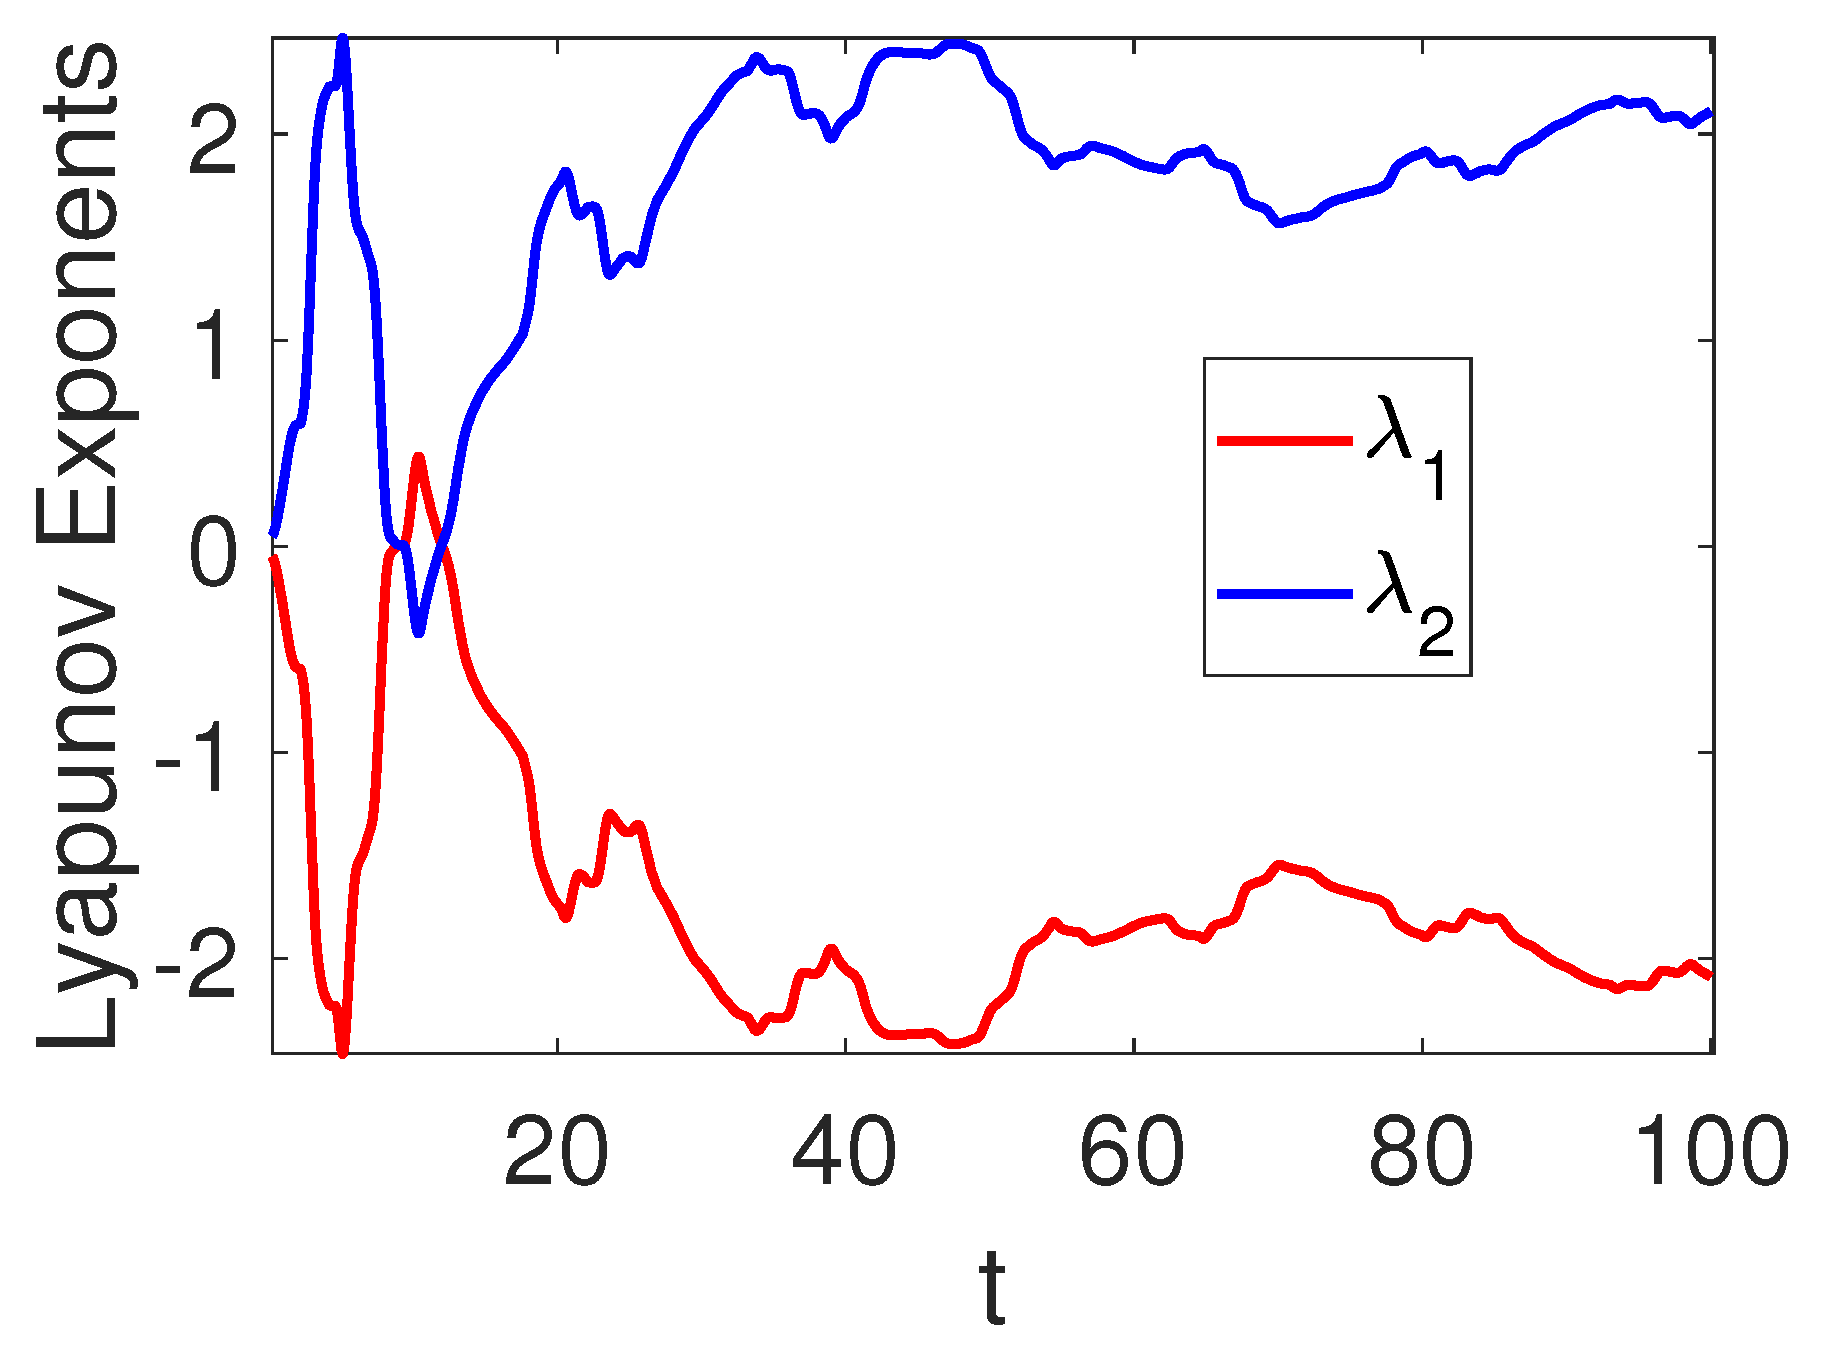
This section offers a comprehensive investigation of the chaotic dynamics of the system defined by the state variables Z and W . The visualizations presented here include return maps, power spectra, strange attractors, recurrence plots, and fractal dimensions. Figure 7 shows the dynamics of the Lyapunov spectrum. For the demonstration, we solved the system of ODEs with the ode45 solver in time span [ 0 , 100 ] with initial conditions [ 0.01 , 0.01 ] for state variables and an identity matrix for the variational matrix. The solution is computed at N time points, and at each iteration, the Lyapunov exponents are calculated with the application of QR decomposition of the variational matrix. Finally, the two largest Lyapunov exponents are plotted against time to visualize the system’s chaotic behavior.
The other figures are generated by solving the proposed system using the ‘ode45’ solver in MATLAB, with initial conditions [ Z , W ] = [ 0.01 , 0.01 ] and a time span of [ 0 , 200 ] . The evolution of the system is iterated over time, producing variables W 1 and x 2 . The return map is created by plotting Z 1 ( n ) and W 1 ( n ) against Z 1 ( n + 1 ) and W 1 ( n + 1 ) , showing the system’s recurrence and stability, with time [ 0 , 200 ] and d t = 0.01 . For the power spectrum, time is considered to be [ 0 , 200 ] with d t = 0.01 . Similarly, for the recurrence plot, the values of Z 1 ( t ) and Z 1 ( t ) and W 1 ( t ) and W 1 ( t ) are simulated with the threshold ϵ = 0.4 determining recurrence. Similar is the case for the fractal dimension where d t = 0.001 . For the simulation of the strange attractor, the delay conditions are used with d t = 0.01 .
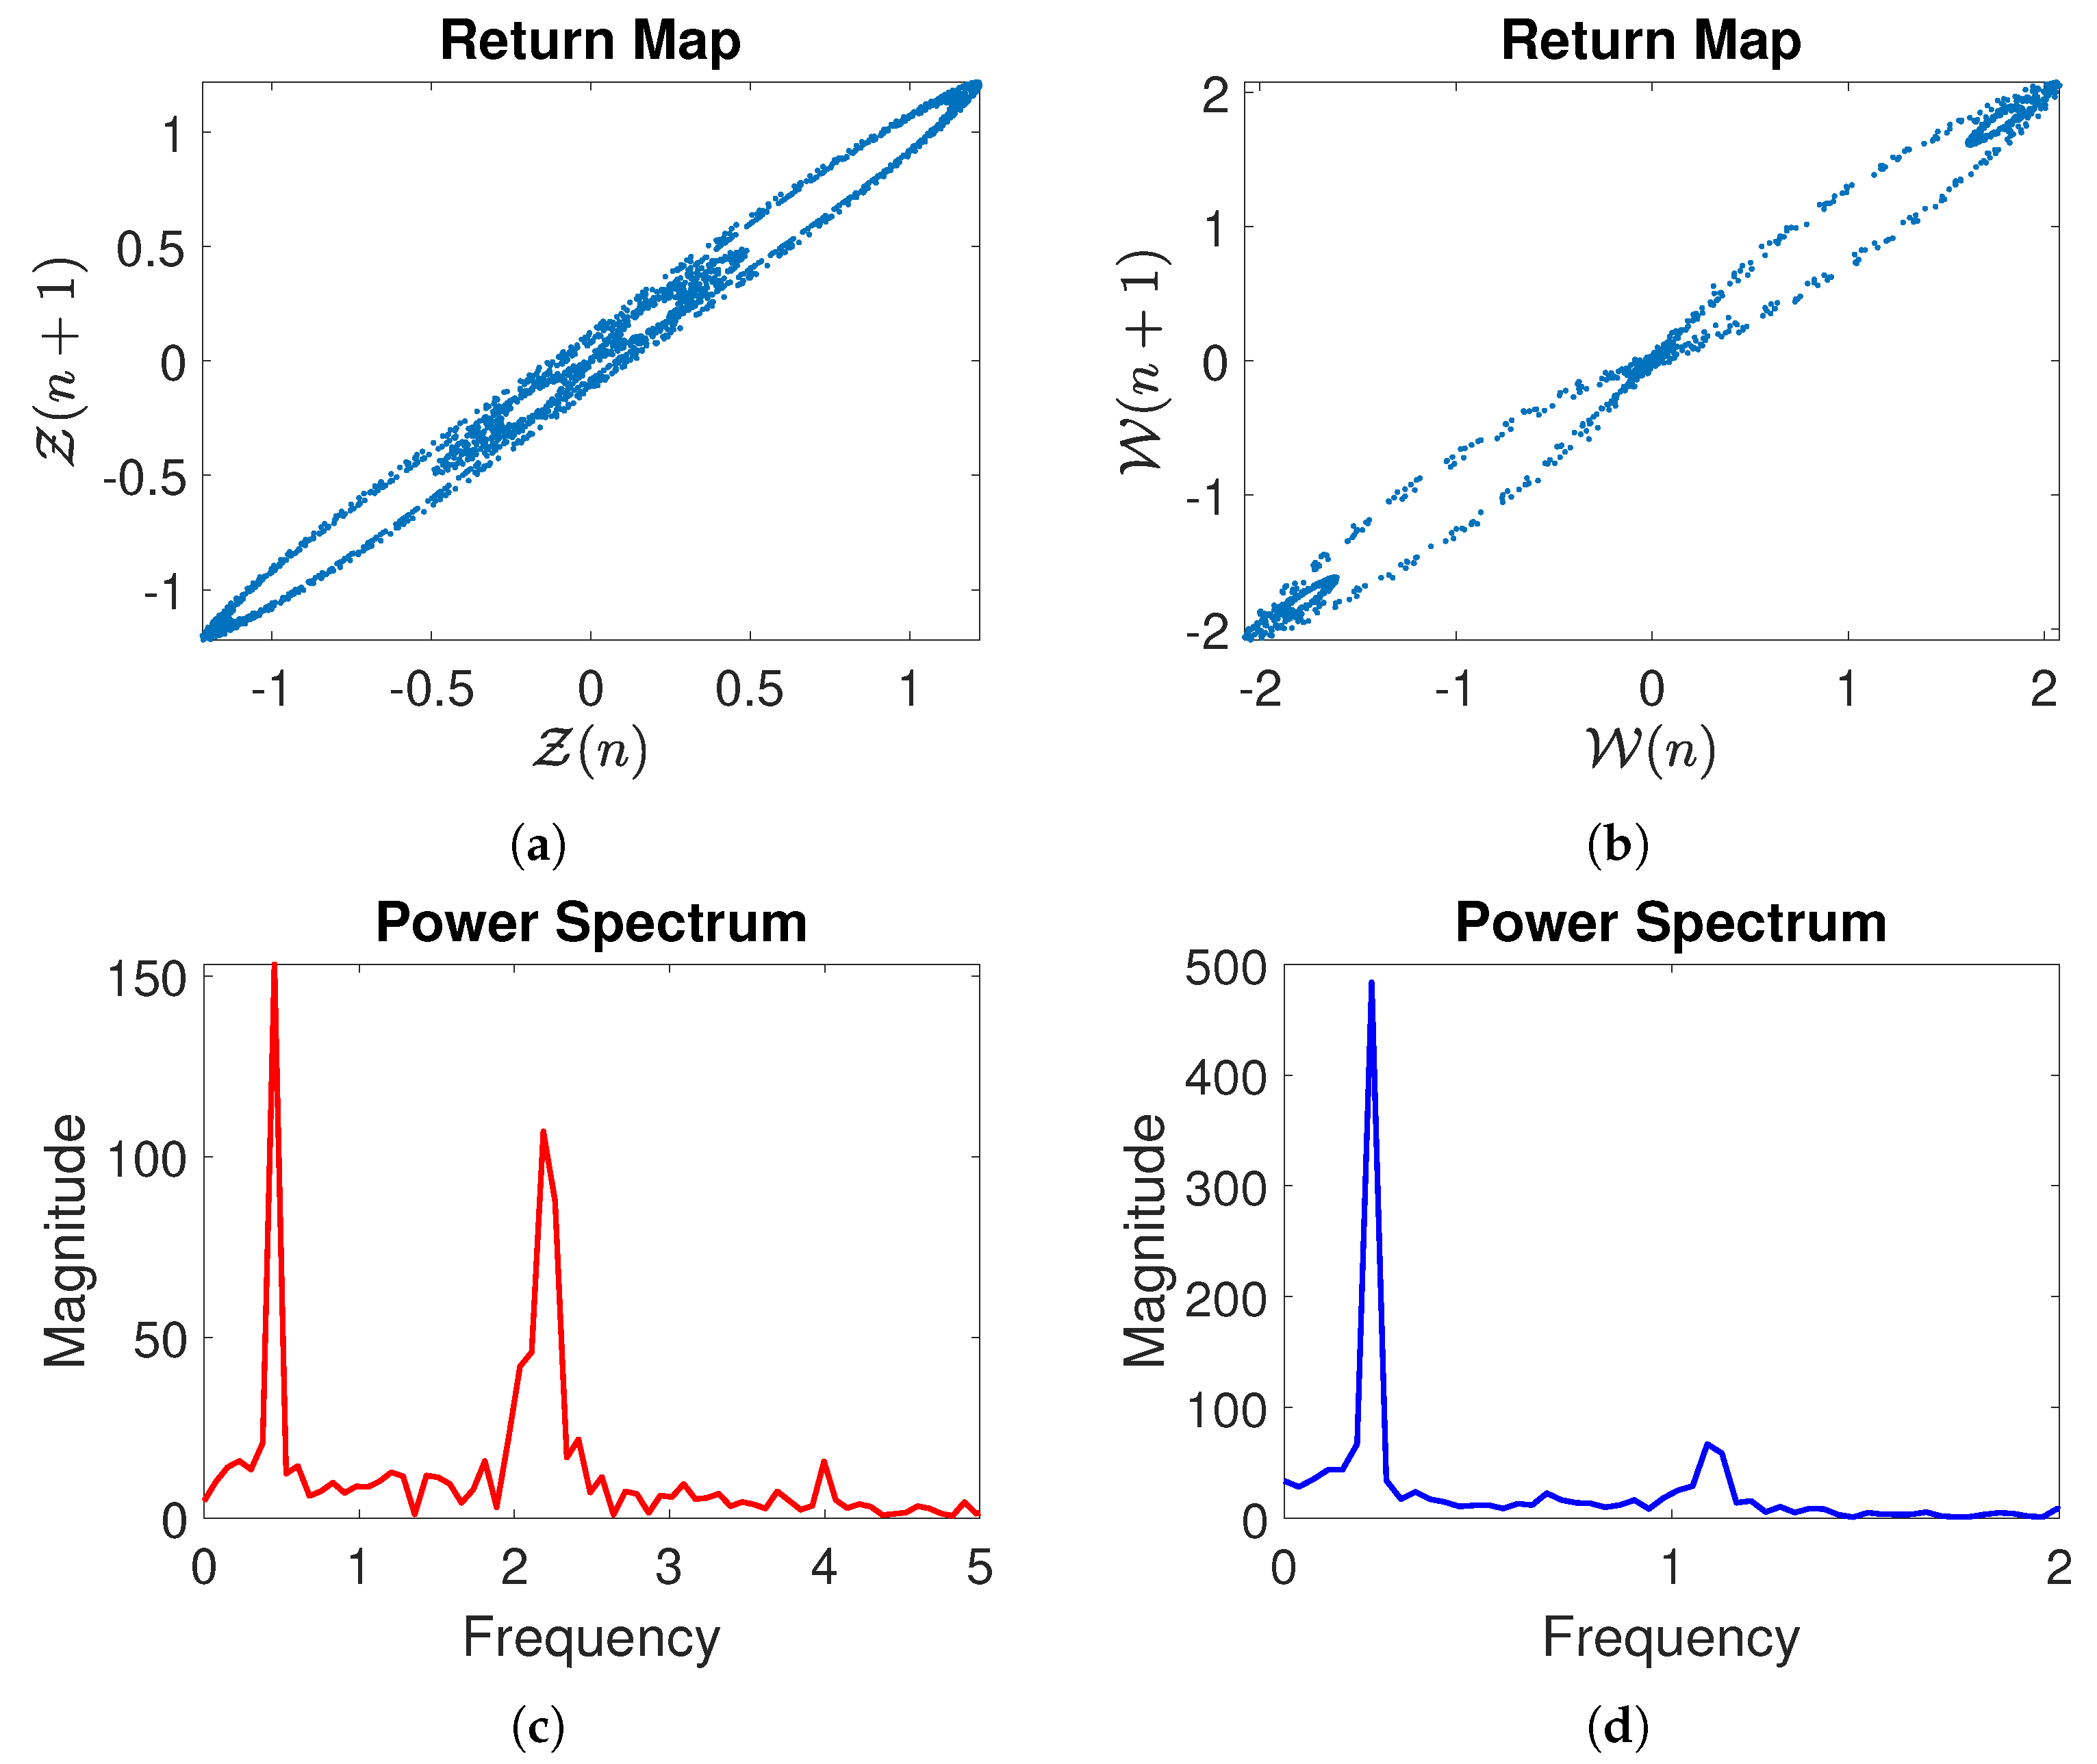
Figure 8 illustrates the return maps and power spectra. Figure 5a,b show the return maps for Z ( n ) and W ( n ) , respectively. These subplots provide insights into the iterative behavior of the system by plotting the state variable at a given time step against its value at the next time step. The return maps show scattered points forming dense, diagonal structures, suggesting a complex chaotic system. The dense and spread-out nature of the points, particularly away from a simple linear relationship, indicates that the system is not following simple periodic or quasi-periodic dynamics but exhibits chaos instead.
Furthermore, Figure 5c,d present the power spectra for Z and W . The power spectrum displays the frequency components of the time series data for the state variables. The presence of multiple peaks in the power spectrum diagrams indicates that the system’s dynamics are influenced by several frequencies, a characteristic of chaotic systems. The broad dispersion of power across frequencies in these plots suggests a lack of dominant periodicity, further supporting the presence of chaos in the system.
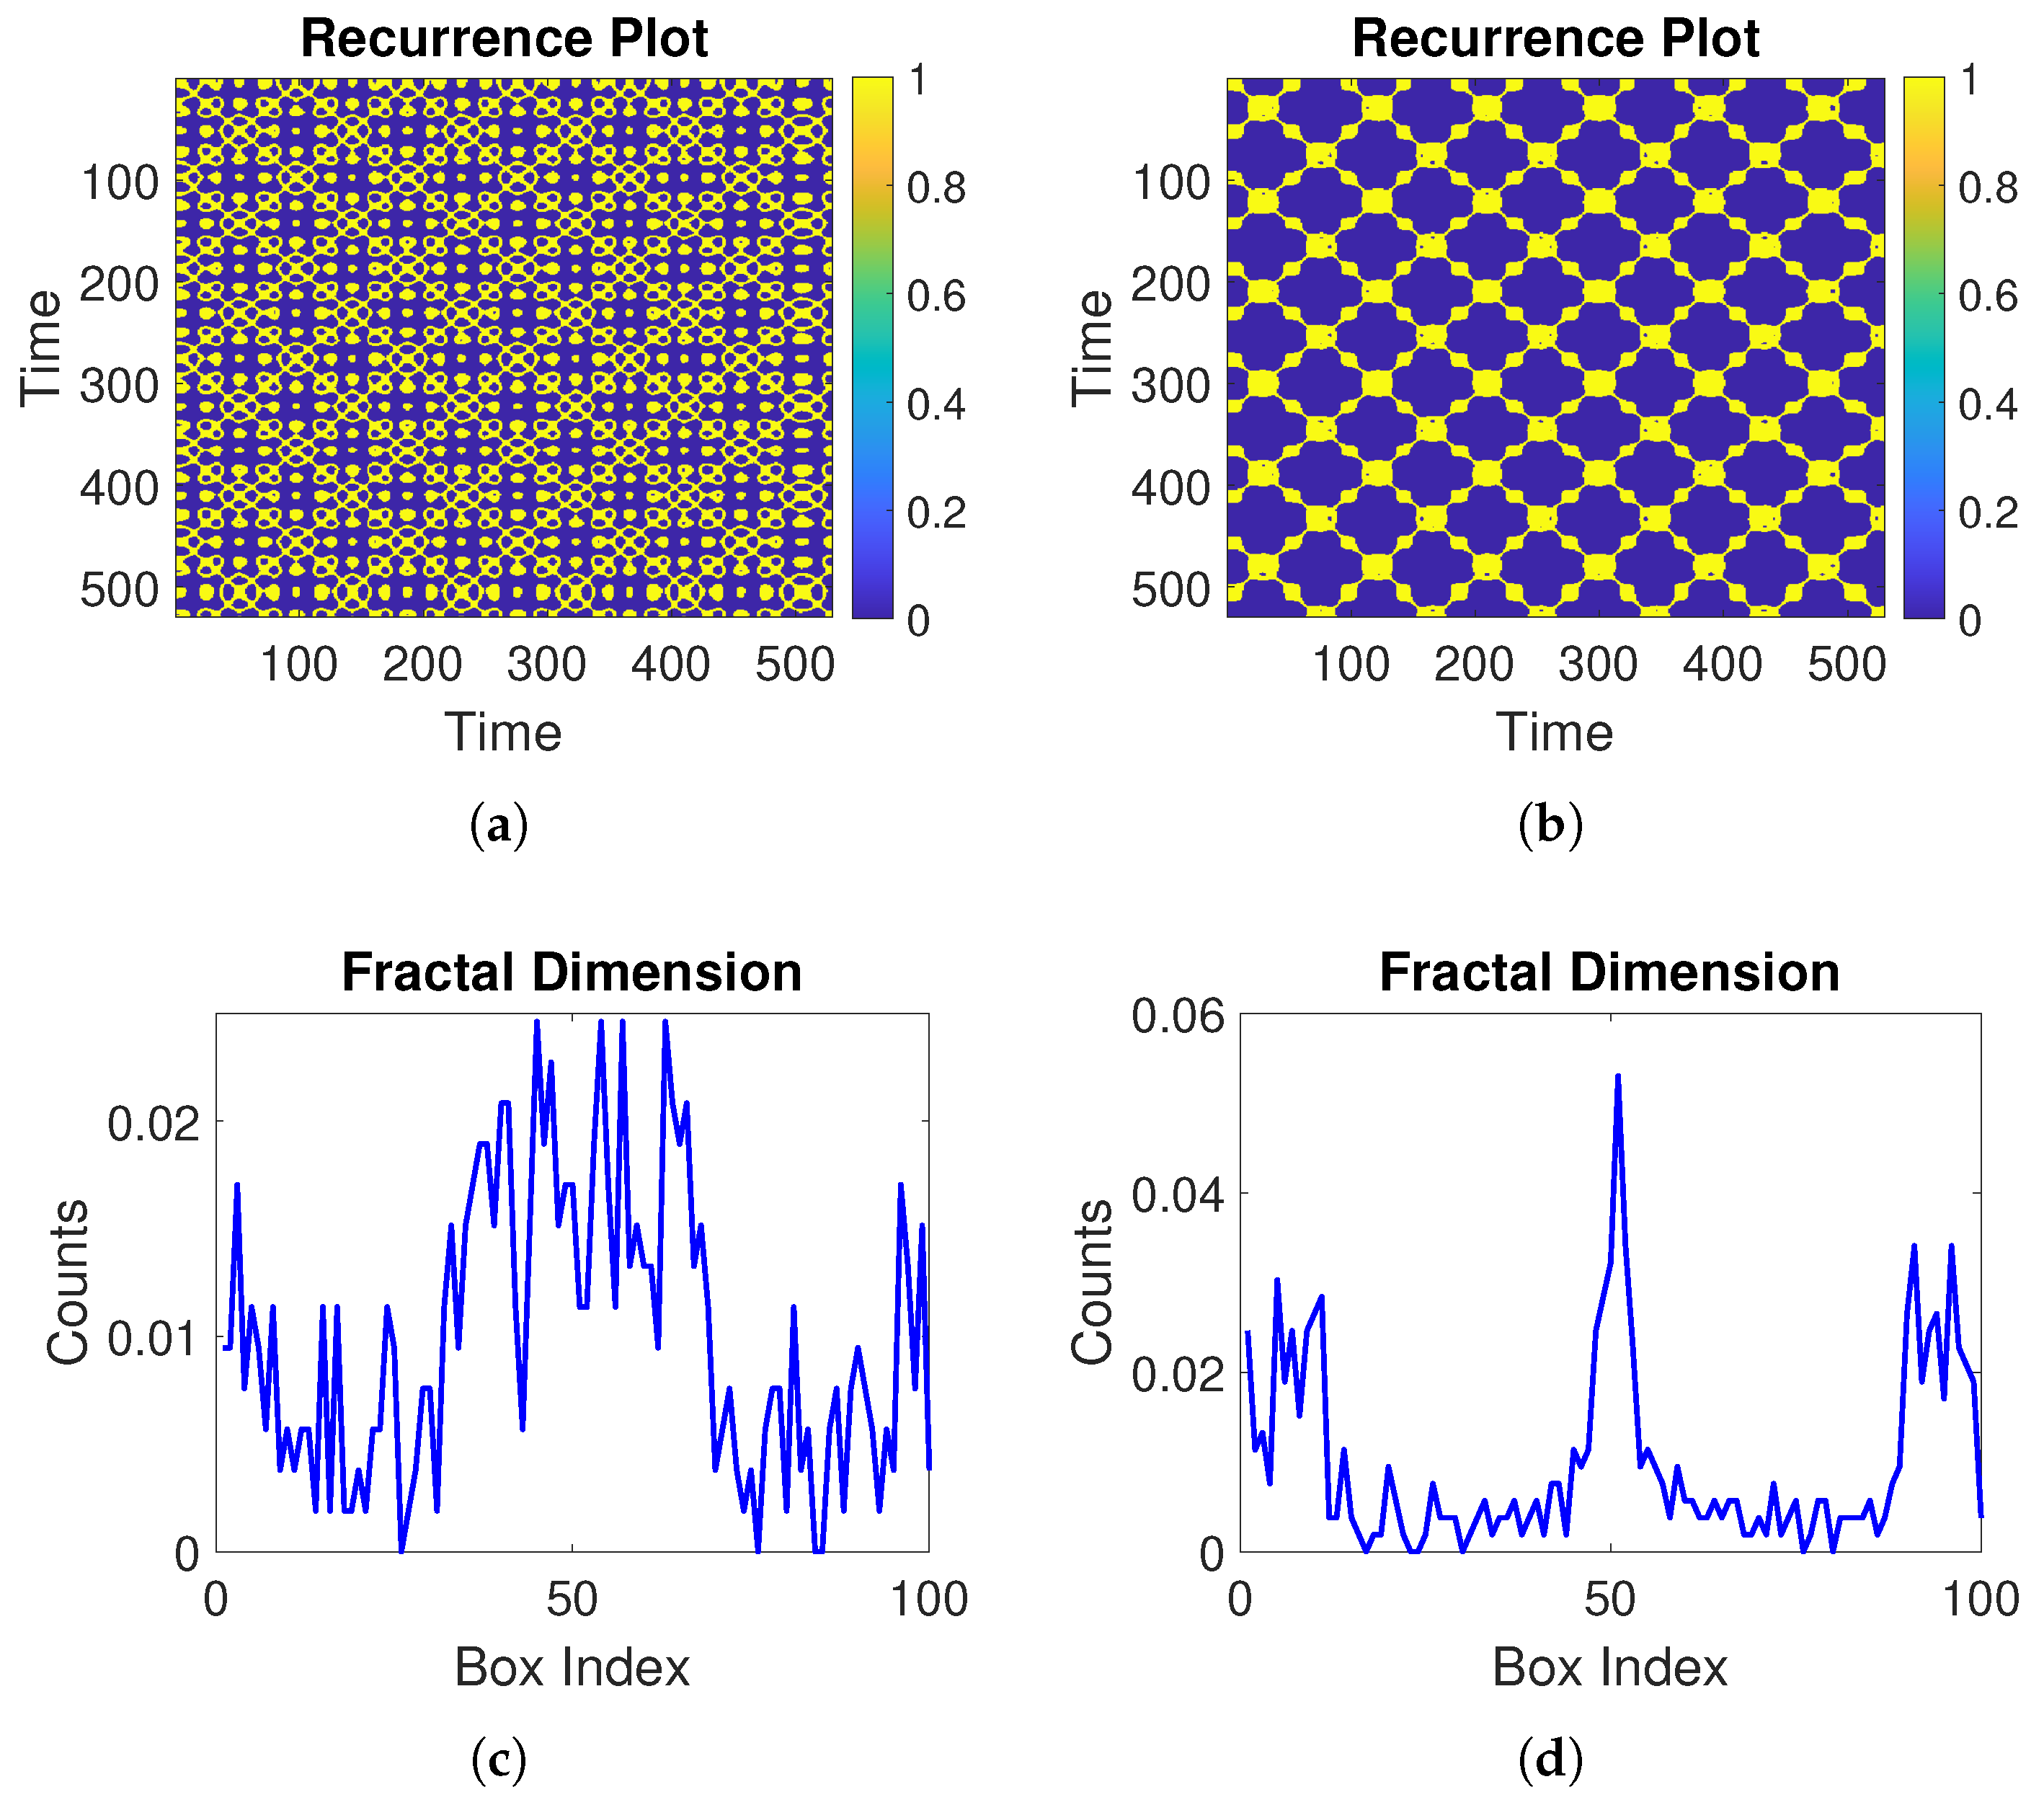
Figure 9a,b portray the recurrence plots of the state variables, which show when the system’s state returns to a previously encountered value. The recurrence plots exhibit a complex, lattice-like structure comprising repeated patterns, suggesting the recurrence of similar states over time. This structure is consistent with the dynamics of chaotic systems, where the state variables revisit similar regions but in a non-regular, intricate manner. The recurrence plots reinforce the notion that the dynamics of the system are governed by underlying chaos.
The fractal dimensions visualized in Figure 6c,d provide a quantitative measure of the complexity of the attractors. The fractal dimensions reveal how the state space of the system is filled in detail. High peaks in the simulated plots indicate regions with significant structure and detail, characteristic of fractal geometries. The varying counts across different box indices show the non-uniform distribution of state space occupation, typical of chaotic attractors. These simulations further emphasize the fractal nature and complexity of the system’s evolutionary behavior.
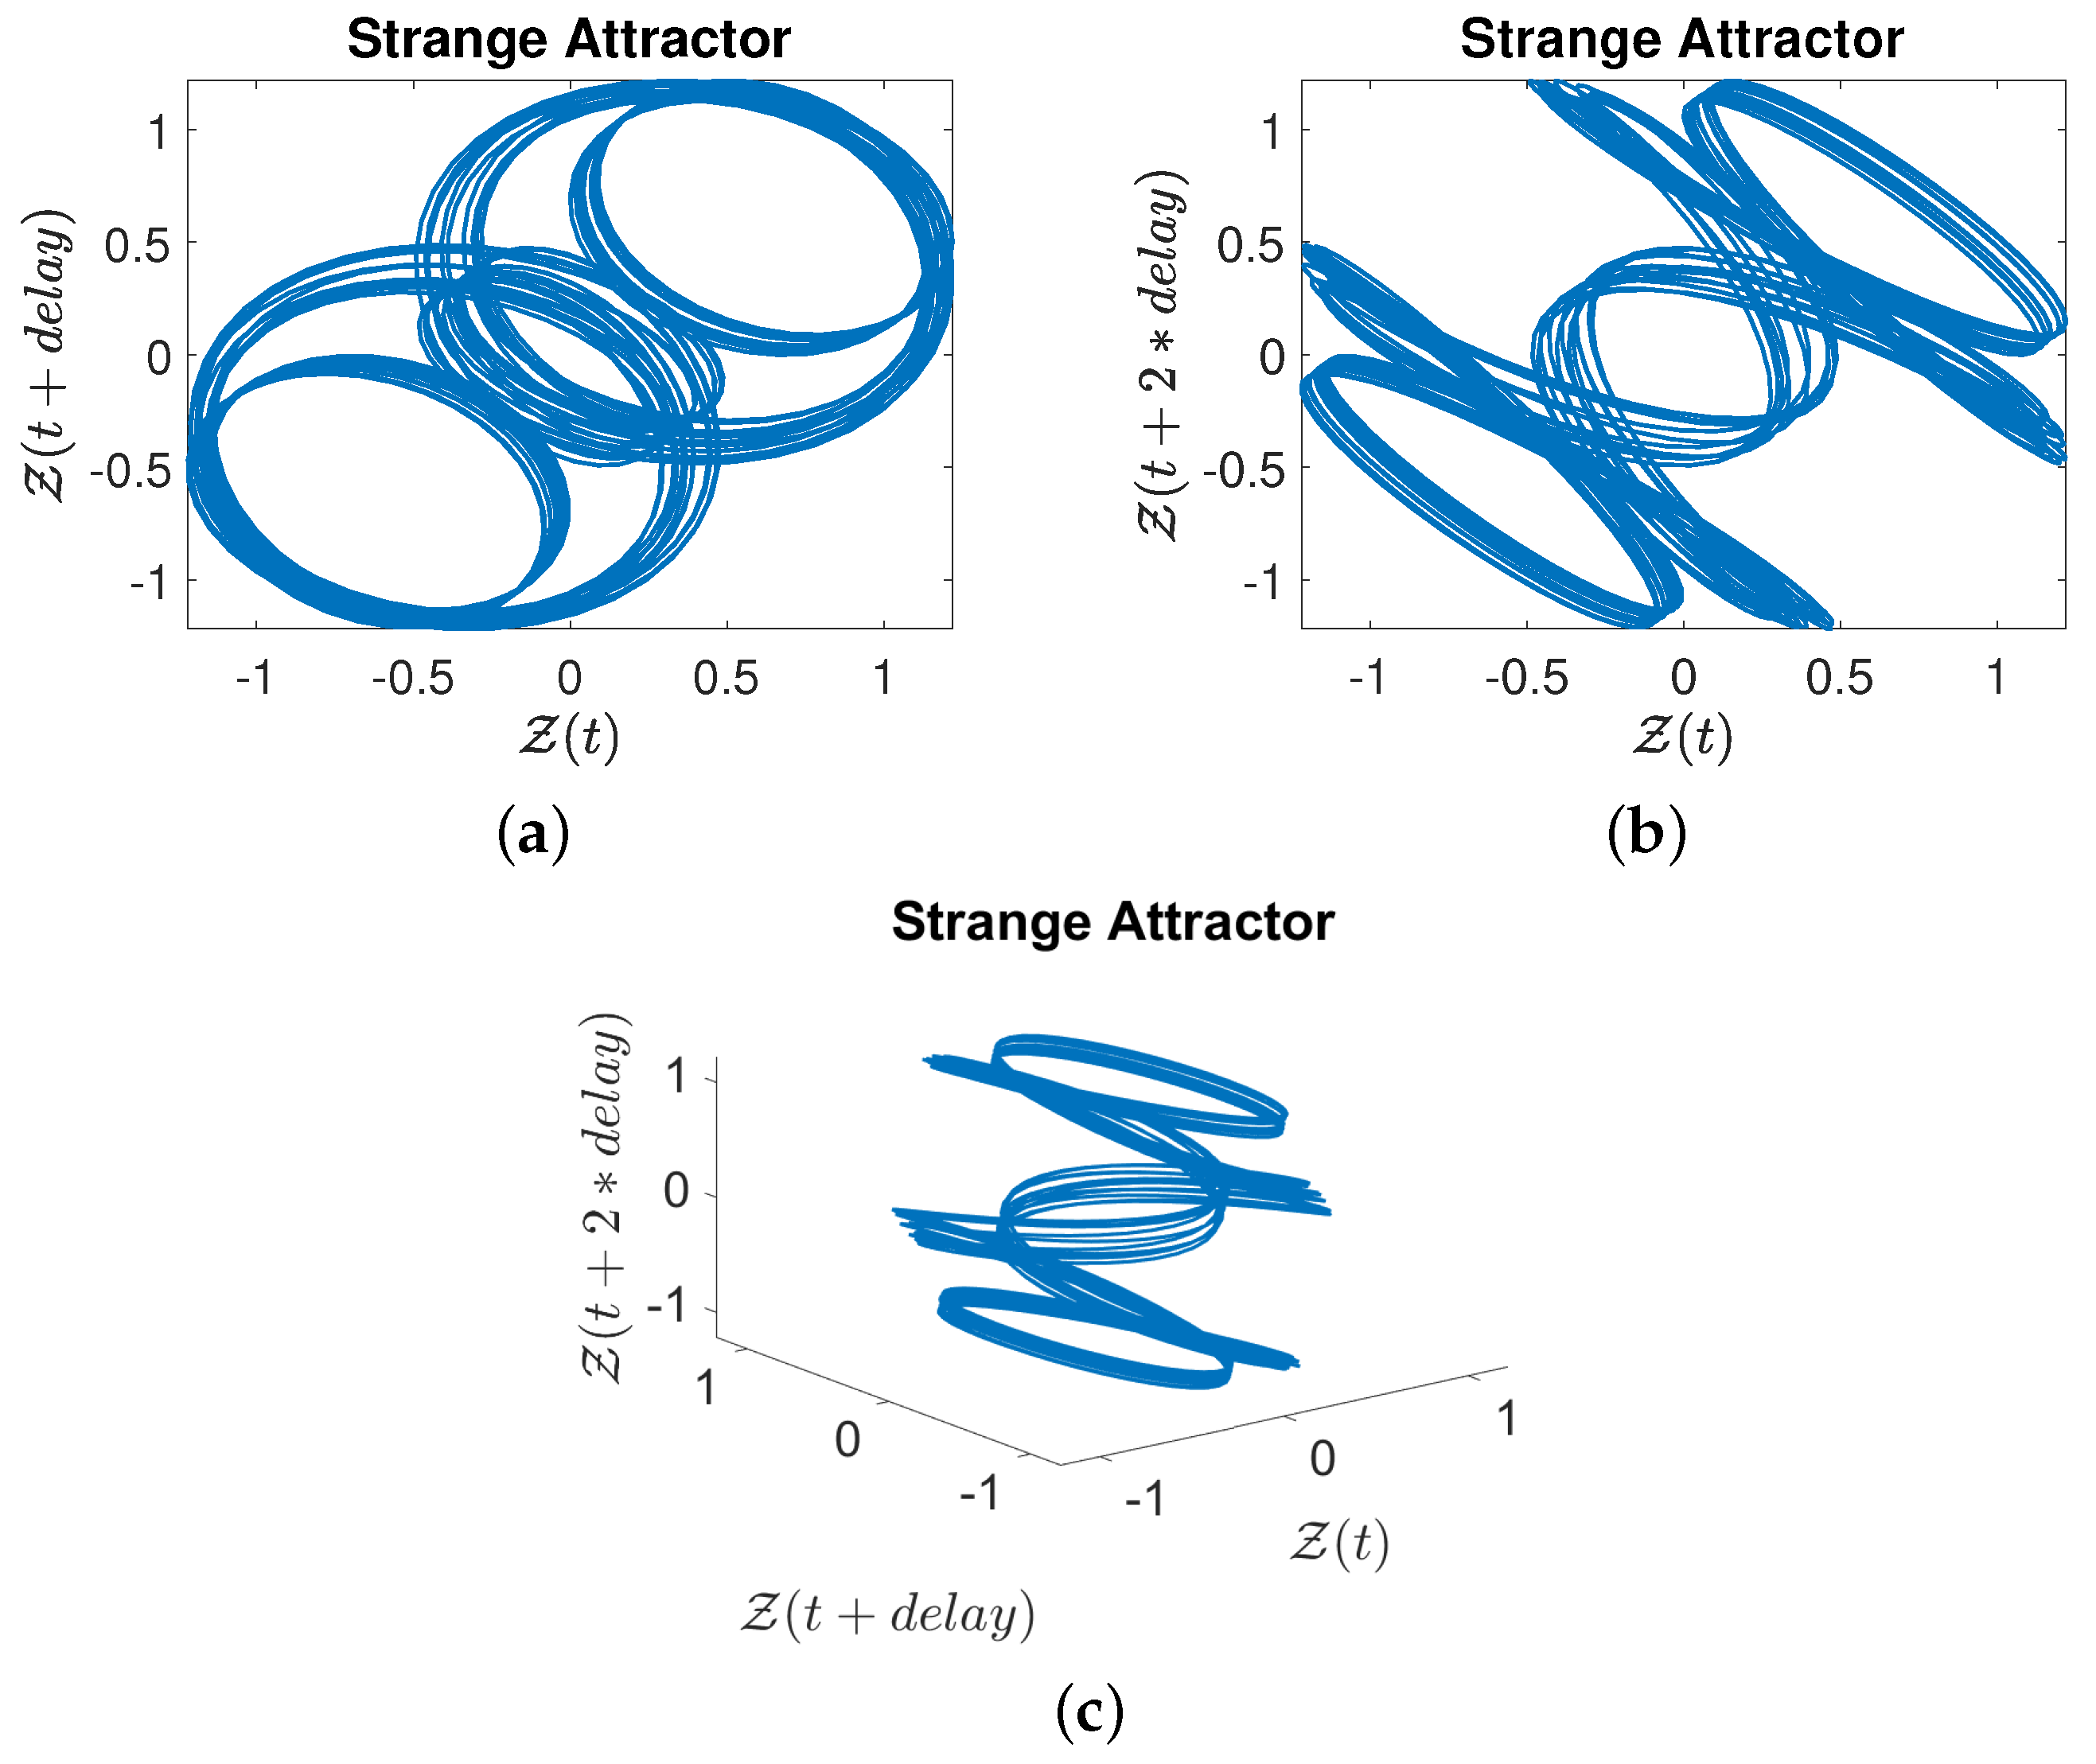
Moreover, Figure 10 and Figure 11 showcase the strange attractors in the Z W plane. Figure 7a–c present the dynamics of the state variable Z using delay coordinates, visualizing how the state evolves over time with different delays. Notably, the delay is considered to be eight. The complex looping patterns observed in these plots do not repeat, indicating the presence of strange attractors. These attractors are characterized by their fractal structure, exhibiting self-similar patterns at different scales. The three-dimensional representation in Figure 7c particularly highlights the non-repeating nature of the trajectories.
Similarly, Figure 8a–c show the dynamics of the state variable W using delay coordinates. The patterns obtained here mirror those in the Z plots, reinforcing the presence of chaos in the system. The attractors presented here are also strange attractors, evident from their complex and densely packed trajectories. The use of delay coordinates is advantageous as it allows us to visualize the multi-dimensional aspects of the chaotic attractors, revealing the system’s complexity.
The figures collectively present the chaotic dynamics of the governed system through different visualizations. The return maps and power spectra reveal the non-periodic, multi-frequency nature of the system’s behavior. The recurrence plots and fractal dimensions provide a more profound analysis of the complexity and fractal nature of the system. Finally, the strange attractors emphasize the complex, non-repeating trajectories indicative of chaos. These findings enhance the present study and highlight the underlying chaotic processes that govern the system’s dynamics.

4. Soliton Solutions for the Suggested Model

In this section, we study the kink, bright, and dark soliton solutions of the proposed equation using the planar dynamical system approach. Here, we reconsider the dynamical system (6) as
d Z δ d δ = W , d W δ d δ = F 1 Z 3 δ + F 2 Z ( δ ) .
We can write the Hamiltonian function for the dynamical system (9) as
H W , Z = W 2 2 + F 1 Z 4 4 F 2 Z 2 2 = h ,
where h is a Hamiltonian constant. To find the kink, bright, and dark solitons solution, we only discuss the following two cases:
Case 1: F 1 > 0 and F 2 > 0 .
When k lies in F 2 2 4 F 1 , 0 , we have two periodic orbits. Therefore, the Hamiltonian function can be written as
W 2 = F 1 2 Z 4 + 2 F 2 F 1 Z 2 + 4 k F 1 = F 1 2 Z 2 υ 1 k 2 υ 2 k 2 Z 2 ,
where
υ 1 k = F 2 F 1 F 2 2 + 4 k F 1 F 1 , υ 2 k = F 2 F 1 + F 2 2 + 4 k F 1 F 1 .
Considering the first equation of Equation (6) and using Equation (11), we obtain
υ 2 k Z d η η 2 υ 1 k 2 υ 2 k 2 η 2 = ± F 1 2 δ δ 0 , Z υ 2 k d η η 2 υ 1 k 2 υ 2 k 2 η 2 = F 1 2 δ δ 0 .
The resulting Jacobi function solutions are as follows:
Z 1 , 2 = ± υ 2 k d n υ 2 k F 1 2 ϱ t + ζ 1 x + ζ 2 y + ζ 3 z δ 0 , υ 2 k 2 υ 1 k 2 υ 2 k ,
where F 1 = λ 1 3 λ 3 ζ 2 2 + ζ 3 2 + ζ 1 2 λ 2 , F 2 = ϱ ζ 1 λ 3 ζ 2 2 + ζ 3 2 + ζ 1 2 λ 2 .
The 3D behavior of Z 2 is simulated in Figure 12a, while the 2D cross-sectional dynamics are simulated in Figure 12b. From the simulations, we observe an anti-kink soliton wave that starts at a higher z-axis value on the left side and smoothly transitions to a lower z-value on the right side. When k = 0 , we have υ 1 k 2 = 0 and υ 2 k 2 = 2 F 2 F 1 . Therefore, we can express the following bright soliton solution:
Z 3 , 4 x , t = ± 2 F 2 F 1 s e c h F 2 ϱ t + ζ 1 x + ζ 2 y + ζ 3 z δ 0 .
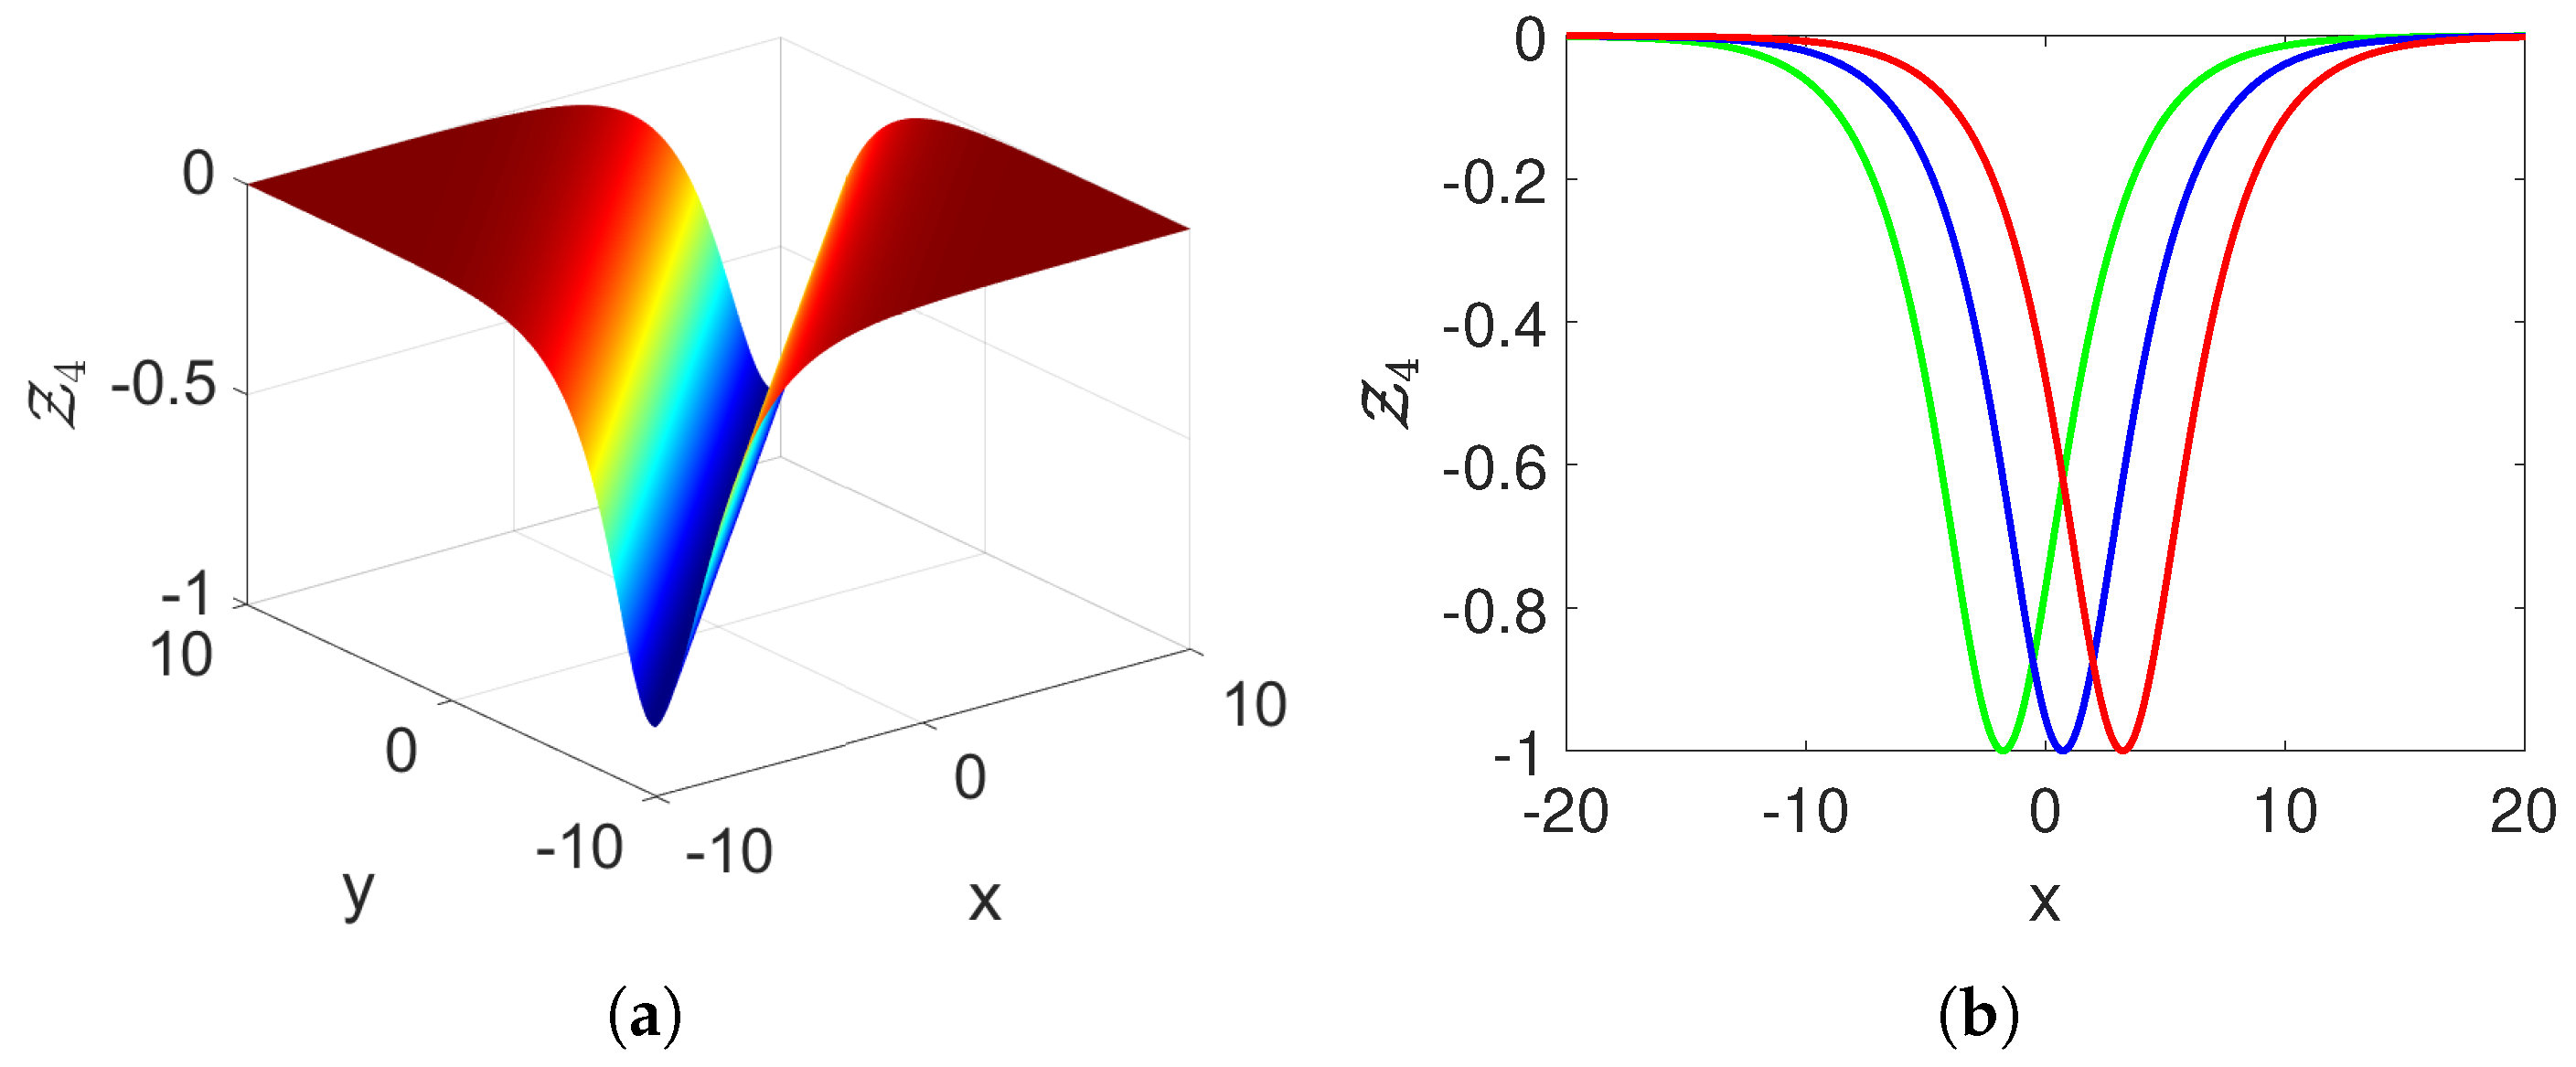
The 3D behavior of Z 4 is simulated in subplot Figure 13a, while the 2D cross-sectional dynamics are simulated in Figure 13b. From the simulations, we observe a dark soliton wave, where the amplitude of the wave is less than the surrounding values.
Case 2: F 1 < 0 and F 2 < 0
For this, the Hamiltonian function is given by
W 2 = F 1 2 Z 4 2 F 2 F 1 Z 2 4 k F 1
= F 1 2 υ 3 k 2 Z 2 υ 4 k 2 Z 2 ,
where
υ 1 k = F 2 F 1 F 2 2 + 4 k F 1 F 1 , υ 2 k = F 2 F 1 + F 2 2 + 4 k F 1 F 1 .
From Equation (13) and the first equation of (6), we obtain
0 Z d η υ 3 k 2 η 2 υ 4 k 2 η 2 = ± F 1 2 δ δ 0 .
The Jacobi function solutions are expressed as
Z 5 , 6 x , t = ± υ 3 k s n υ 4 k F 1 2 ϱ t + ζ 1 x + ζ 2 y + ζ 3 z δ 0 , υ 3 k υ 4 k ,
where F 1 = λ 1 3 λ 3 ζ 2 2 + ζ 3 2 + ζ 1 2 λ 2 and F 2 = ϱ ζ 1 λ 3 ζ 2 2 + ζ 3 2 + ζ 1 2 λ 2 .
Considering k = F 2 2 4 F 1 leads to υ 3 k 2 = υ 4 k 2 = F 2 F 1 . Therefore, we obtain the following dark solitons for the governing equation as
Z 7 , 8 x , t = ± F 2 F 1 tanh F 1 2 ϱ t + ζ 1 x + ζ 2 y + ζ 3 z δ 0 .
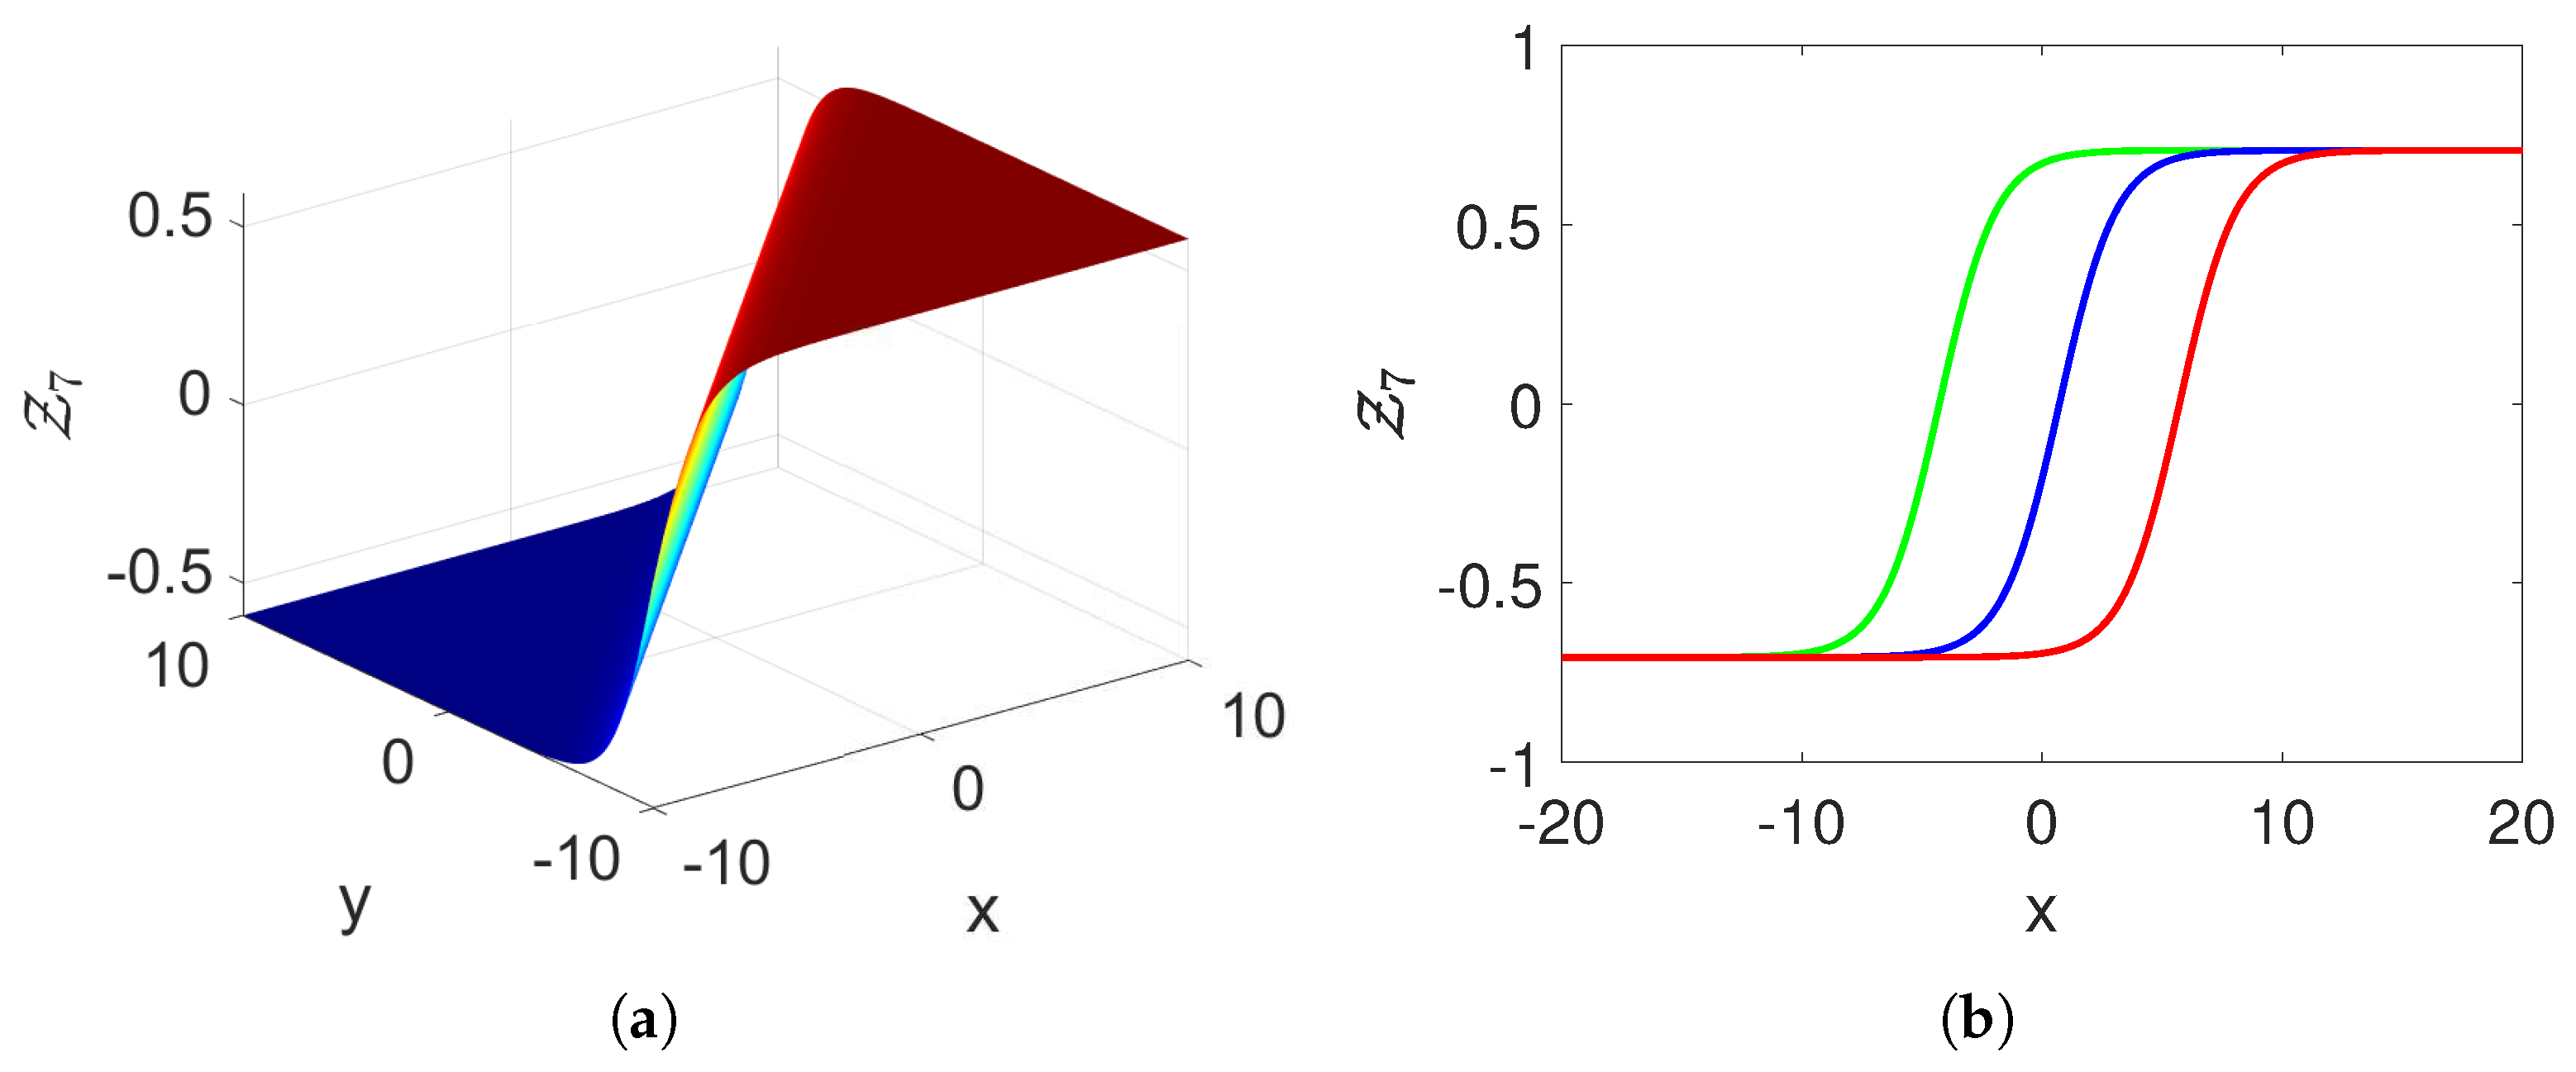
The 3D behavior of Z 7 is simulated in Figure 14a, while the 2D cross-sectional dynamics are simulated in Figure 14b. From the simulations, we observe a kink soliton wave that starts at a lower z-axis value on the left side and smoothly transitions to a higher z-value on the right side.

5. Conclusions

This research provides a detailed investigation of the complexities associated with the (3+1)-dimensional generalized KdV-ZK equation. We revealed these complexities by systematically proposing a related dynamical system with the aid of the Galilean transformation and studied bifurcation diagrams. We thoroughly investigated a sensitivity analysis and chaotic behaviors, which are displayed via phase portraits by incorporating perturbations. Furthermore, we examined novel dynamical properties, including the return map, fractal dimension, power spectrum, recurrence plot, and strange attractors, revealing a variety of characteristics. We also constructed diverse solution structures, including anti-kink, dark soliton, and kink soliton solutions, using the planar dynamical system approach. This study highlights the effectiveness of analytical techniques for dynamical systems, paving the way for future applications in the dynamics of nonlinear systems and mathematical physics. In the future, neural networks, stochastic noise, and synchronization will be used for the proposed model [23,24,25].

Author Contributions

Conceptualization, M.N.A.R.; Methodology, A.A.; Formal analysis, M.N.A.R.; Investigation, A.A.; Resources, A.A.; Writing—original draft, A.M.; Writing—review & editing, A.E.H., K.A. and H.S.; Supervision, K.A.; Funding acquisition, M.N.A.R. All authors have read and agreed to the published version of the manuscript.

Funding

The only institution supporting the publication fees is Qassim University, through its project number (QU-APC-2024-9/1). No other university or institution is providing support for the publication fees. This is a declaration from all the researchers.

Data Availability Statement

Data is contained within the article.

Acknowledgments

The researchers would like to thank the Deanship of Graduate Studies and Scientific Research at Qassim University for the financial support (QU-APC-2024-9/1). The authors extend their appreciation to the Deanship of Scientific Research at Northern Border University, Arar, KSA for funding this research work through the project number “NBU-FFR-2024-2718-03”. The support from Northern Border University is provided only for the researchers from Northern Border University and does not include any funding for the publication fees.

Conflicts of Interest

The authors claim no conflicts of interest.

References

  1. Ahmad, H.; Khan, T.A.; Stanimirovic, P.S.; Shatanawi, W.; Botmart, T. New approach on conventional solutions to nonlinear partial differential equations describing physical phenomena. Results Phys. 2022, 41, 105936. [Google Scholar] [CrossRef]
  2. Alam, M.N.; Bonyah, E.; Fayz-Al-Asad, M.; Osman, M.S.; Abualnaja, K.M. Stable and functional solutions of the Klein-Fock-Gordon equation with nonlinear physical phenomena. Phys. Scr. 2021, 96, 055207. [Google Scholar] [CrossRef]
  3. Fadhal, E.; Akbulut, A.; Kaplan, M.; Awadalla, M.; Abuasbeh, K. Extraction of exact solutions of higher order Sasa-Satsuma equation in the sense of beta derivative. Symmetry 2022, 14, 2390. [Google Scholar] [CrossRef]
  4. Mhadhbi, N.; Gana, S.; Alsaeedi, M.F. Exact solutions for nonlinear partial differential equations via a fusion of classical methods and innovative approaches. Sci. Rep. 2024, 14, 6443. [Google Scholar] [CrossRef]
  5. Prakash, P.; Priyendhu, K.S.; Sahadevan, R. Generalized separation of variable methods with their comparison: Exact solutions of time-fractional nonlinear PDEs in higher dimensions. Fract. Calc. Appl. Anal. 2024, 1–51. [Google Scholar] [CrossRef]
  6. Ma, W.-X. The inverse scattering transform and soliton solutions of a combined modified Korteweg–de Vries equation. J. Math. Anal. Appl. 2019, 471, 796–811. [Google Scholar] [CrossRef]
  7. Li, J.; Xu, C.; Lu, J. The exact solutions to the generalized (2 + 1)-dimensional nonlinear wave equation. Results Phys. 2024, 58, 107506. [Google Scholar] [CrossRef]
  8. Hussain, A.; Ali, H.; Usman, M.; Zaman, F.D.; Park, C. Some New Families of Exact Solitary Wave Solutions for Pseudo-Parabolic Type Nonlinear Models. J. Math. 2024, 2024, 5762147. [Google Scholar] [CrossRef]
  9. Kaplan, M.; Akbulut, A. A mathematical analysis of a model involving an integrable equation for wave packet envelope. J. Math. 2022, 2022, 3486780. [Google Scholar] [CrossRef]
  10. Zhang, H.; Jing, M.; Dong, S.; Dong, D.; Liu, Y.; Meng, Y. Stability and evolutionary trend of Hopf bifurcations in double-input SEPIC DC–DC converters. Int. J. Bifurc. Chaos 2019, 29, 1950192. [Google Scholar] [CrossRef]
  11. Khan, A.; Saifullah, S.; Ahmad, S.; Khan, M.A.; Rahman, M.U. Dynamical properties and new optical soliton solutions of a generalized nonlinear Schrödinger equation. Eur. Phys. J. Plus 2023, 138, 1059. [Google Scholar] [CrossRef]
  12. Ahmad, S.; Ullah, A.; Ahmad, S.; Saifullah, S.; Shokri, A. Periodic solitons of Davey Stewartson Kadomtsev Petviashvili equation in (4+1)-dimension. Results Phys. 2023, 50, 106547. [Google Scholar] [CrossRef]
  13. Saifullah, S.; Alqarni, M.M.; Ahmad, S.; Baleanu, D.; Khan, M.A.; Mahmoud, E.E. Some more bounded and singular pulses of a generalized scale-invariant analogue of the Korteweg–de Vries equation. Results Phys. 2023, 52, 106836. [Google Scholar] [CrossRef]
  14. Saifullah, S.; Ahmad, S.; Khan, M.A.; ur Rahman, M. Multiple solitons with fission and multi waves interaction solutions of a (3+1)-dimensional combined pKPBKP integrable equation. Phys. Scr. 2024, 99, 065242. [Google Scholar] [CrossRef]
  15. Baber, M.Z.; Ahmed, N.; Xu, C.; Iqbal, M.S.; Sulaiman, T.A. A computational scheme and its comparison with optical soliton solutions for the stochastic Chen–Lee–Liu equation with sensitivity analysis. Mod. Phys. Lett. B 2024, 2450376. [Google Scholar] [CrossRef]
  16. Tariq, K.U.; Wazwaz, A.M.; Kazmi, S.R. On the dynamics of the (2+ 1)-dimensional chiral nonlinear Schrödinger model in physics. Optik 2023, 285, 170943. [Google Scholar] [CrossRef]
  17. Ding, C.-C.; Zhou, Q.; Triki, H.; Sun, Y.; Biswas, A. Dynamics of dark and anti-dark solitons for the x-nonlocal Davey–Stewartson II equation. Nonlinear Dyn. 2023, 111, 2621–2629. [Google Scholar] [CrossRef]
  18. Chen, X.; Guo, Y.; Zhang, T. Some new kink type solutions for the new (3+ 1)-dimensional Boiti–Leon–Manna–Pempinelli equation. Nonlinear Dyn. 2023, 111, 683–695. [Google Scholar] [CrossRef]
  19. Muflih Alqahtani, A.; Akram, S.; Alosaimi, M. Study of bifurcations, chaotic structures with sensitivity analysis and novel soliton solutions of non-linear dynamical model. J. Taibah Univ. Sci. 2024, 18, 2399870. [Google Scholar] [CrossRef]
  20. Chahlaoui, Y.; Ali, A.; Javed, S. Study the behavior of soliton solution, modulation instability and sensitive analysis to fractional nonlinear Schrödinger model with Kerr Law nonlinearity. Ain Shams Eng. J. 2024, 15, 102567. [Google Scholar] [CrossRef]
  21. Borhan, J.R.M.; Mamun Miah, M.; Duraihem, F.Z.; Iqbal, M.A.; Ma, W.X. New Optical Soliton Structures, Bifurcation Properties, Chaotic Phenomena, and Sensitivity Analysis of Two Nonlinear Partial Differential Equations. Int. J. Theor. Phys. 2024, 63, 183. [Google Scholar] [CrossRef]
  22. Li, P.; Shi, S.; Xu, C.; Rahman, M.U. Bifurcations, chaotic behavior, sensitivity analysis and new optical solitons solutions of Sasa-Satsuma equation. Nonlinear Dyn. 2024, 112, 7405–7415. [Google Scholar] [CrossRef]
  23. Xu, C.; Zhao, Y.; Lin, J.; Pang, Y.; Liu, Z.; Shen, J.; Liao, M.; Li, P.; Qin, Y. Bifurcation investigation and control scheme of fractional neural networks owning multiple delays. Comput. Appl. Math. 2024, 43, 1–33. [Google Scholar] [CrossRef]
  24. Shukla, V.K.; Joshi, M.C.; Mishra, P.K.; Xu, C. Adaptive fixedtime difference synchronization for different classes of chaotic dynamical systems. Phys. Scr. 2024, 99, 095264. [Google Scholar] [CrossRef]
  25. Baber, M.Z.; Yasin, M.W.; Xu, C.; Ahmed, N.; Iqbal, M.S. Numerical and Analytical Study for the Stochastic Spatial Dependent Prey–Predator Dynamical System. J. Comput. Nonlinear Dyn. 2024, 19, 101003. [Google Scholar] [CrossRef]
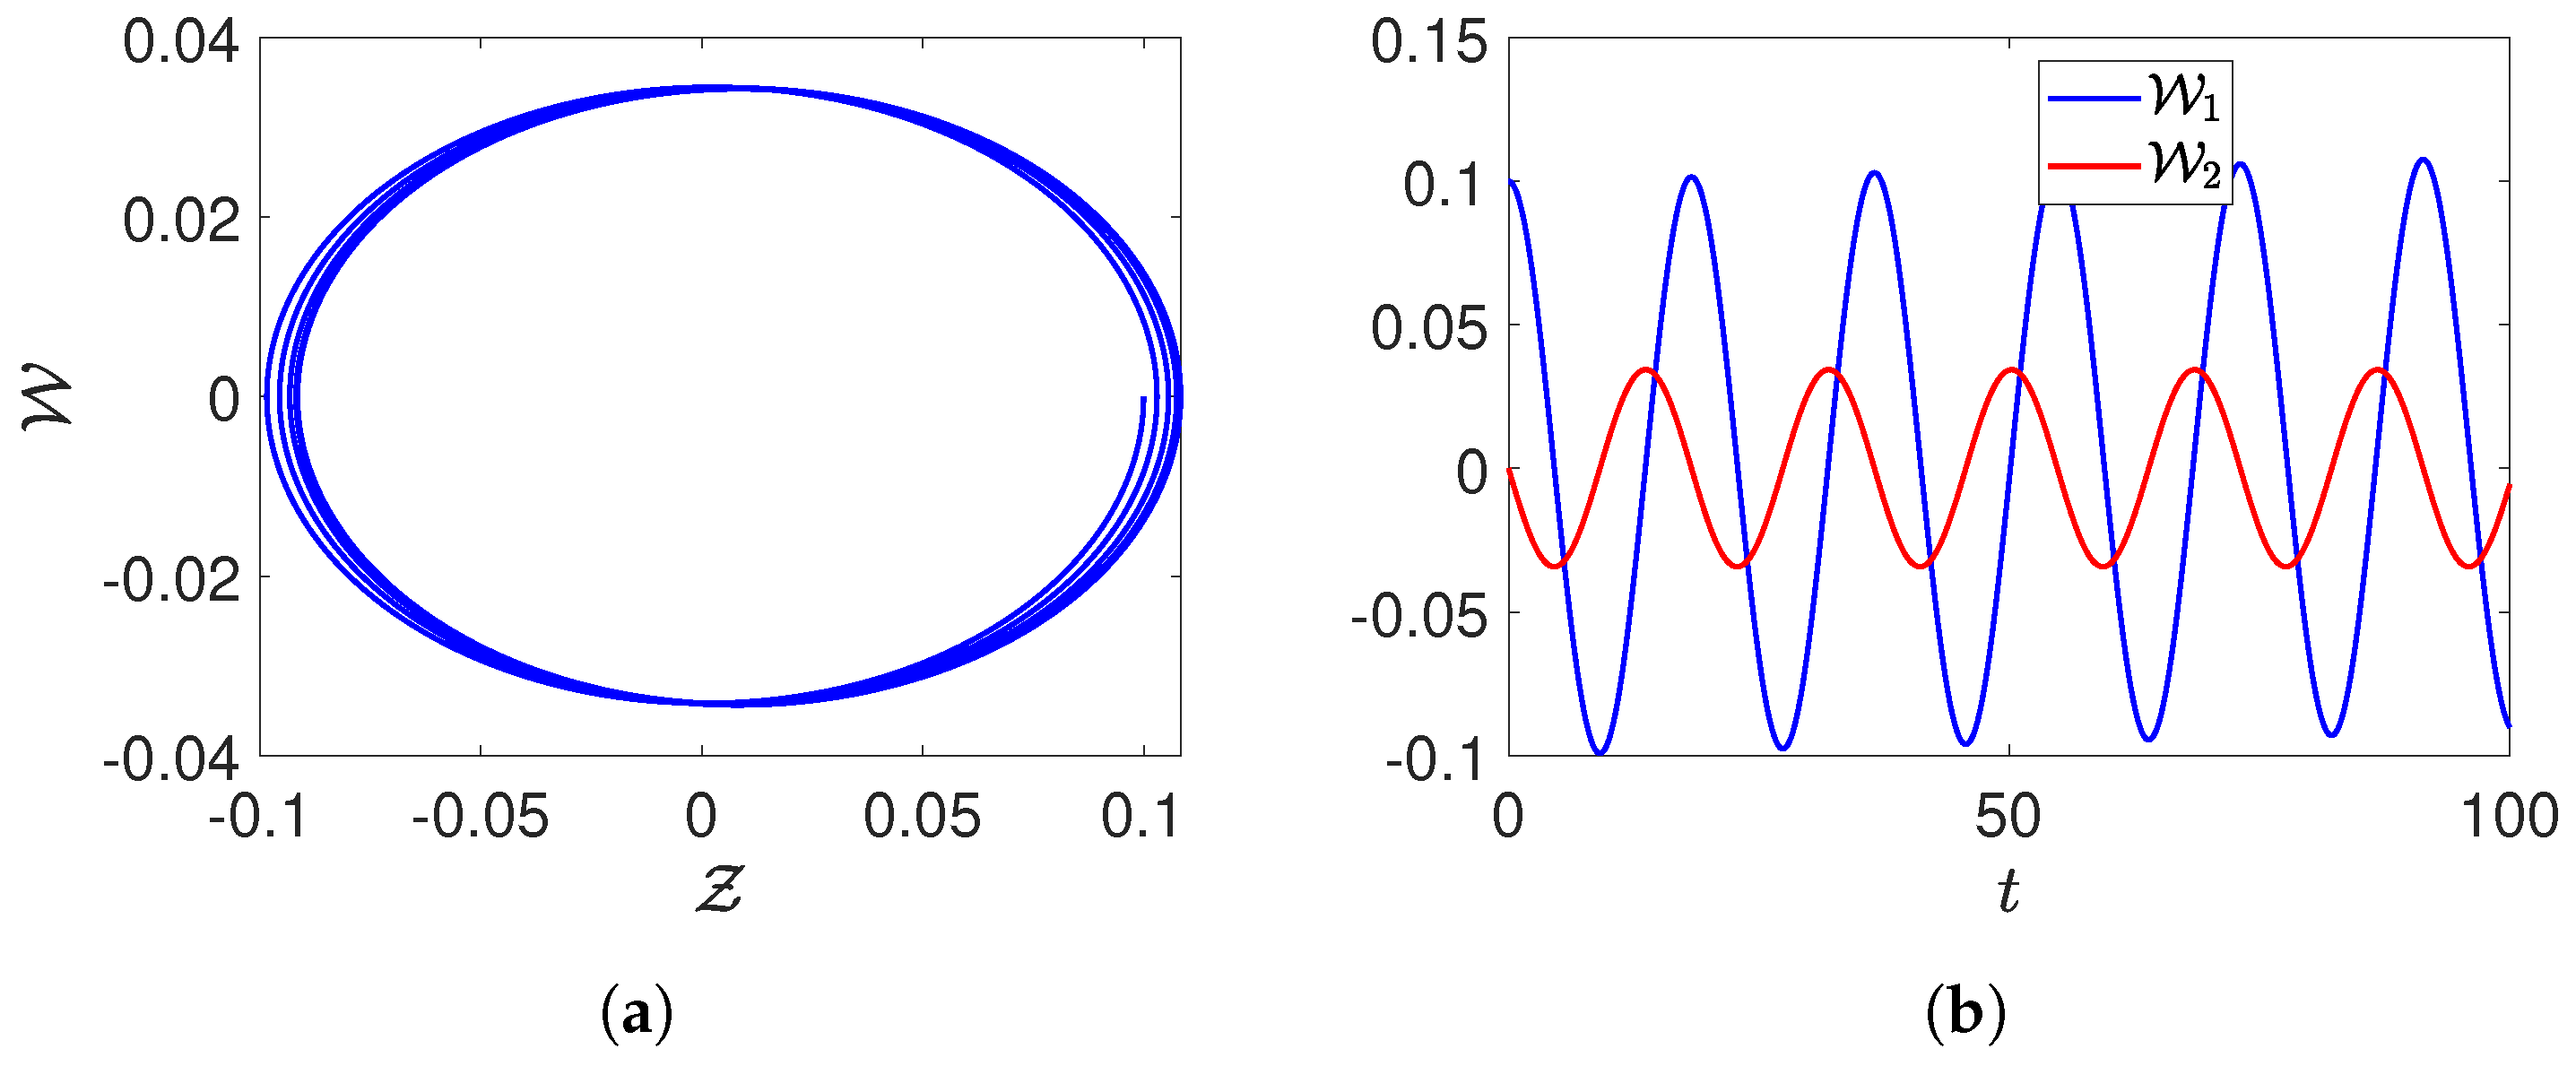
Figure 1. (a,b) Visualization of the dynamics of the proposed perturbed system by setting specific parameter values as λ 1 = 0.01 , λ 2 = 2 , λ 3 = 1 , ζ 1 = 1 , ζ 2 = 1 , ζ 3 = 0.4 , ϱ = 0.7 , M = 0.01 , and u = 0.01 .
Fractalfract 08 00673 g001
Figure 2. (a,b) Visualization of the dynamics of the proposed perturbed system by setting specific parameter values as λ 1 = 0.01 , λ 2 = 2 , λ 3 = 1 , ζ 1 = 1 , ζ 2 = 1 , ζ 3 = 0.4 , ϱ = 0.7 , M = 0.5 , and u = 0.1 .
Fractalfract 08 00673 g002
Figure 3. (ad) Chaotic behavior by assuming the parameters λ 1 = 0.01 , λ 2 = 2 , λ 3 = 1 , ζ 1 = 1 , ζ 2 = 1 , ζ 3 = 0.4 , and ϱ = 0.7 .
Fractalfract 08 00673 g003
Figure 4. (ad) Chaotic behavior by assuming the parameters λ 1 = 0.01 , λ 2 = 2 , λ 3 = 1 , ζ 1 = 1 , ζ 2 = 1 , ζ 3 = 0.4 , and ϱ = 0.7 .
Fractalfract 08 00673 g004
Figure 5. (ad) Visualizations based on numerical simulations of the various state variables over time t assuming λ 1 = 0.01 , λ 2 = 2 , λ 3 = 1 , ζ 1 = 1 , ζ 2 = 1 , ζ 3 = 0.4 , and ϱ = 0.7 with various initial values.
Fractalfract 08 00673 g005
Figure 6. (af) Visualizations based on numerical simulations of the given equation with parameters assumed to be λ 1 = 0.01 , λ 2 = 2 , λ 3 = 1 , ζ 1 = 1 , ζ 2 = 1 , ζ 3 = 0.4 , ϱ = 0.7 , M = 1 , and u = 1 . with various initial values.
Fractalfract 08 00673 g006
Figure 7. Visualizations of the Lyapunov spectrum for λ 1 = 0.1 , λ 2 = 0.1 , λ 3 = 0.1 , ζ 1 = 2 , ζ 2 = 1 , ζ 3 = 0.4 , ϱ = 0.1 , M = 1 , and u = 1 with various initial values.
Fractalfract 08 00673 g007
Figure 8. (ad) Visualizations of the return maps and power spectra for λ 1 = 0.1 , λ 2 = 0.1 , λ 3 = 0.1 , ζ 1 = 2 , ζ 2 = 1 , ζ 3 = 0.4 , ϱ = 0.1 , M = 1 , and u = 1.8 with various initial values.
Fractalfract 08 00673 g008
Figure 9. (ad) Visualizations of the return map and fractal dimensions for λ 1 = 0.1 , λ 2 = 0.1 , λ 3 = 0.1 , ζ 1 = 2 , ζ 2 = 1 , ζ 3 = 0.4 , ϱ = 0.1 , M = 1 , and u = 1.8 with various initial values.
Fractalfract 08 00673 g009
Figure 10. (ac) Visualizations of the behavior of strange attractors for λ 1 = 0.1 , λ 2 = 0.1 , λ 3 = 0.1 , ζ 1 = 2 , ζ 2 = 1 , ζ 3 = 0.4 , ϱ = 0.1 , M = 1 , and u = 1.8 with various initial values.
Fractalfract 08 00673 g010
Figure 11. (ac) Visualizations of the behavior of strange attractors for λ 1 = 0.1 , λ 2 = 0.1 , λ 3 = 0.1 , ζ 1 = 2 , ζ 2 = 1 , ζ 3 = 0.4 , ϱ = 0.1 , M = 1 , and u = 1.8 with various initial values.
Fractalfract 08 00673 g011
Figure 12. (a,b) Numerical demonstration of the obtained solution Z 2 with λ 1 = 0.1 , λ 2 = 2 , λ 3 = 1 , ζ 1 = 1 , ζ 2 = 1 , ζ 3 = 1 , and ϱ = 1 ; green t = −4, blue t = 0, and red t = 4.
Fractalfract 08 00673 g012
Figure 13. (a,b) Graphical behavior of Z 4 for λ 1 = 0.1 , λ 2 = 2 , λ 3 = 1 , ζ 1 = 1 , ζ 2 = 1 , ζ 3 = 1 , and ϱ = 1 ; green t = −5, blue t = 0, and red t = 5.
Fractalfract 08 00673 g013
Figure 14. (a,b) Numerical demonstration of the obtained solution Z 7 with parameters used as z = 1 , λ 1 = 0.01 , λ 2 = 2 , λ 3 = 1 , ζ 1 = 1 , ζ 2 = 1 , ζ 3 = 0.4 , and ϱ = 1 ; green t = −10, blue t = 0, and red t = 10.
Fractalfract 08 00673 g014
Disclaimer/Publisher’s Note: The statements, opinions and data contained in all publications are solely those of the individual author(s) and contributor(s) and not of MDPI and/or the editor(s). MDPI and/or the editor(s) disclaim responsibility for any injury to people or property resulting from any ideas, methods, instructions or products referred to in the content.