Article

Discrete Element Method Analyses of Bond Degradation Evolutions for Cemented Soils

1
College of Civil Engineering, Tongji University, Shanghai 200092, China
2
State Key Laboratory for Disaster Reduction in Civil Engineering, Tongji University, Shanghai 200092, China
3
School of Transportation Science and Engineering, Civil Aviation University of China, Tianjin 300300, China
*
Author to whom correspondence should be addressed.
Fractal Fract. 2024, 8(2), 119; https://doi.org/10.3390/fractalfract8020119
Submission received: 10 November 2023 / Revised: 9 February 2024 / Accepted: 15 February 2024 / Published: 17 February 2024
(This article belongs to the Special Issue Fractals in Geology and Geochemistry)

Abstract

:
The degradation of soil bonding, which can be described by the evolution of bond degradation variables, is essential in the constitutive modeling of cemented soils. A degradation variable with a value of 0/1.0 indicates that the applied stress is completely sustained by bonded particles/unbounded grains. The discrete element method (DEM) was used for cemented soils to analyze the bond degradation evolution and to evaluate the degradation variables at the contact scale. Numerical cemented soil samples with different bonding strengths were first prepared using an advanced contact model (CM). Constant stress ratio compression, one-dimensional compression, conventional triaxial tests (CTTs), and true triaxial tests (TTTs) were then implemented for the numerical samples. After that, the numerical results were adopted to investigate the evolution of the bond degradation variables BN and B0. In the triaxial tests, B0 evolves to be near to or larger than BN due to shearing, which indicates that shearing increases the bearing rate of bond contacts. Finally, an approximate stress-path-independent bond degradation variable Bσ was developed. The evolution of Bσ with the equivalent plastic strain can be effectively described by an exponential function and a hyperbolic function.

1. Introduction

Soil fabric and interparticle bonding together can be termed soil structure [1]. There are substantial distinctions in the mechanical properties between natural/artificially cemented soils (CSs) and uncemented soils (USs) ascribed to the interparticle bonding derived from cementation, as verified by experimental data [2,3]. Cemented soils exhibit structural yielding in isotropic compression and strain softening in triaxial tests. These characteristics are ascribed to the degradation evolutions of cementation bond contacts. Further, for silt-sized soils, fine particles can sustain themselves in a loose structure due to the van der Waals attraction force [4]. Loose cemented soils may undergo a considerable volume change under loading/wetting due to interparticle bond degradation and may cause engineering problems [5,6]. Accordingly, it is essential to quantify the bonding effect and to assess the bonding degradation evolution when carrying out constitutive modeling of cemented soil.
As a cemented soil is loaded, the interparticle bonds gradually break, and the cemented soil correspondingly performs towards the uncemented soil. A bond degradation variable represents the degree to which the soil bonding is damaged. Although it is complex to model the degree and degradation of interparticle bonding, a variety of formulations have been proposed and incorporated into constitutive models in recent decades. Some models have assumed a larger yield surface for cemented soil, which is progressively reduced during bond degradation. By comparing the yield surface size of cemented soil p c and the corresponding uncemented soil p c 0 , the bonding effect can be assessed by evaluating the additional strength Δ p c = p c p c 0 [7,8] or the strength ratio R * = p c 0 / p c [9,10,11]. Alternatively, in the disturbed state concept [12,13], cemented soil is modeled by a combination of material parts at relatively intact and fully adjusted states. The bonding effect can be quantified by the disturbance function D, which denotes the contribution ratio of fully adjusted states to material stress. In the damage model for cemented soils [14,15], a similar strategy is employed, and the bonding effect can be quantified by a bond degradation variable. However, owing to the difficulties in microscopic observations and the deficiency of the micromechanical basis, these bond degradation indicators that denote the debonding process are based on the macro mechanical differences between cemented and corresponding uncemented soils.
Since it is difficult to obtain insight into the debonding process at the particle and contact scales with current experimental technologies [16,17,18], the DEM [19] is a supplementary way to study microscopic behavior and analyze the bond degradation evolution of cemented soils. The DEM has been employed in microscopic investigations on various cemented soils, such as cemented sand, structural silt, methane hydrate-bearing soil, etc. [20,21,22,23,24,25]. The DEM has also been applied to correlate the macro- and micromechanical performances of geomaterials [15,26,27]. Thornton [26] relates the normal and tangential contact forces to the stress tensor, respectively. Jiang et al. [15] relates the forces at bonded contacts and the forces at unbonded contacts to the stress tensor, respectively, and developed micromechanical-based models for cemented soils.
In this study, a numerical sample is first produced using the particle flow code 3D (PFC3D) [28], whose contact model takes into account rolling and twisting resistances [29] and van der Waals forces [30,31] to sustain an open structure, followed by precompression and cementation bond generation. Subsequently, various loading paths, including constant stress ratio compression, one-dimensional compression, conventional triaxial, and true triaxial loading, are applied on cemented DEM assemblies with different bond strengths. After that, the evolution of two representative bond degradation variables versus plastic strain is micromechanically investigated. Finally, the bond degradation evolution of cemented soils not only depends on the plastic strain but also the stress path. Based on the DEM analyses of the bond degradation evolution, an approximate stress-path-independent bond degradation variable and its degradation evolution law are proposed.

2. Materials and Methods

2.1. Bond Contact Model Framework

The force and moment at a contact point between particles are considered to be conveyed through both particle interactions and the bonding material in parallel. The total force (moment) vector is the sum of the force (moment) vector transmitted by the particle interaction and the force (moment) vector transmitted by the cementation bond. The schematic diagram (Figure 1) shows the forces and moments in four directions: normal, tangential, rolling, and twisting.

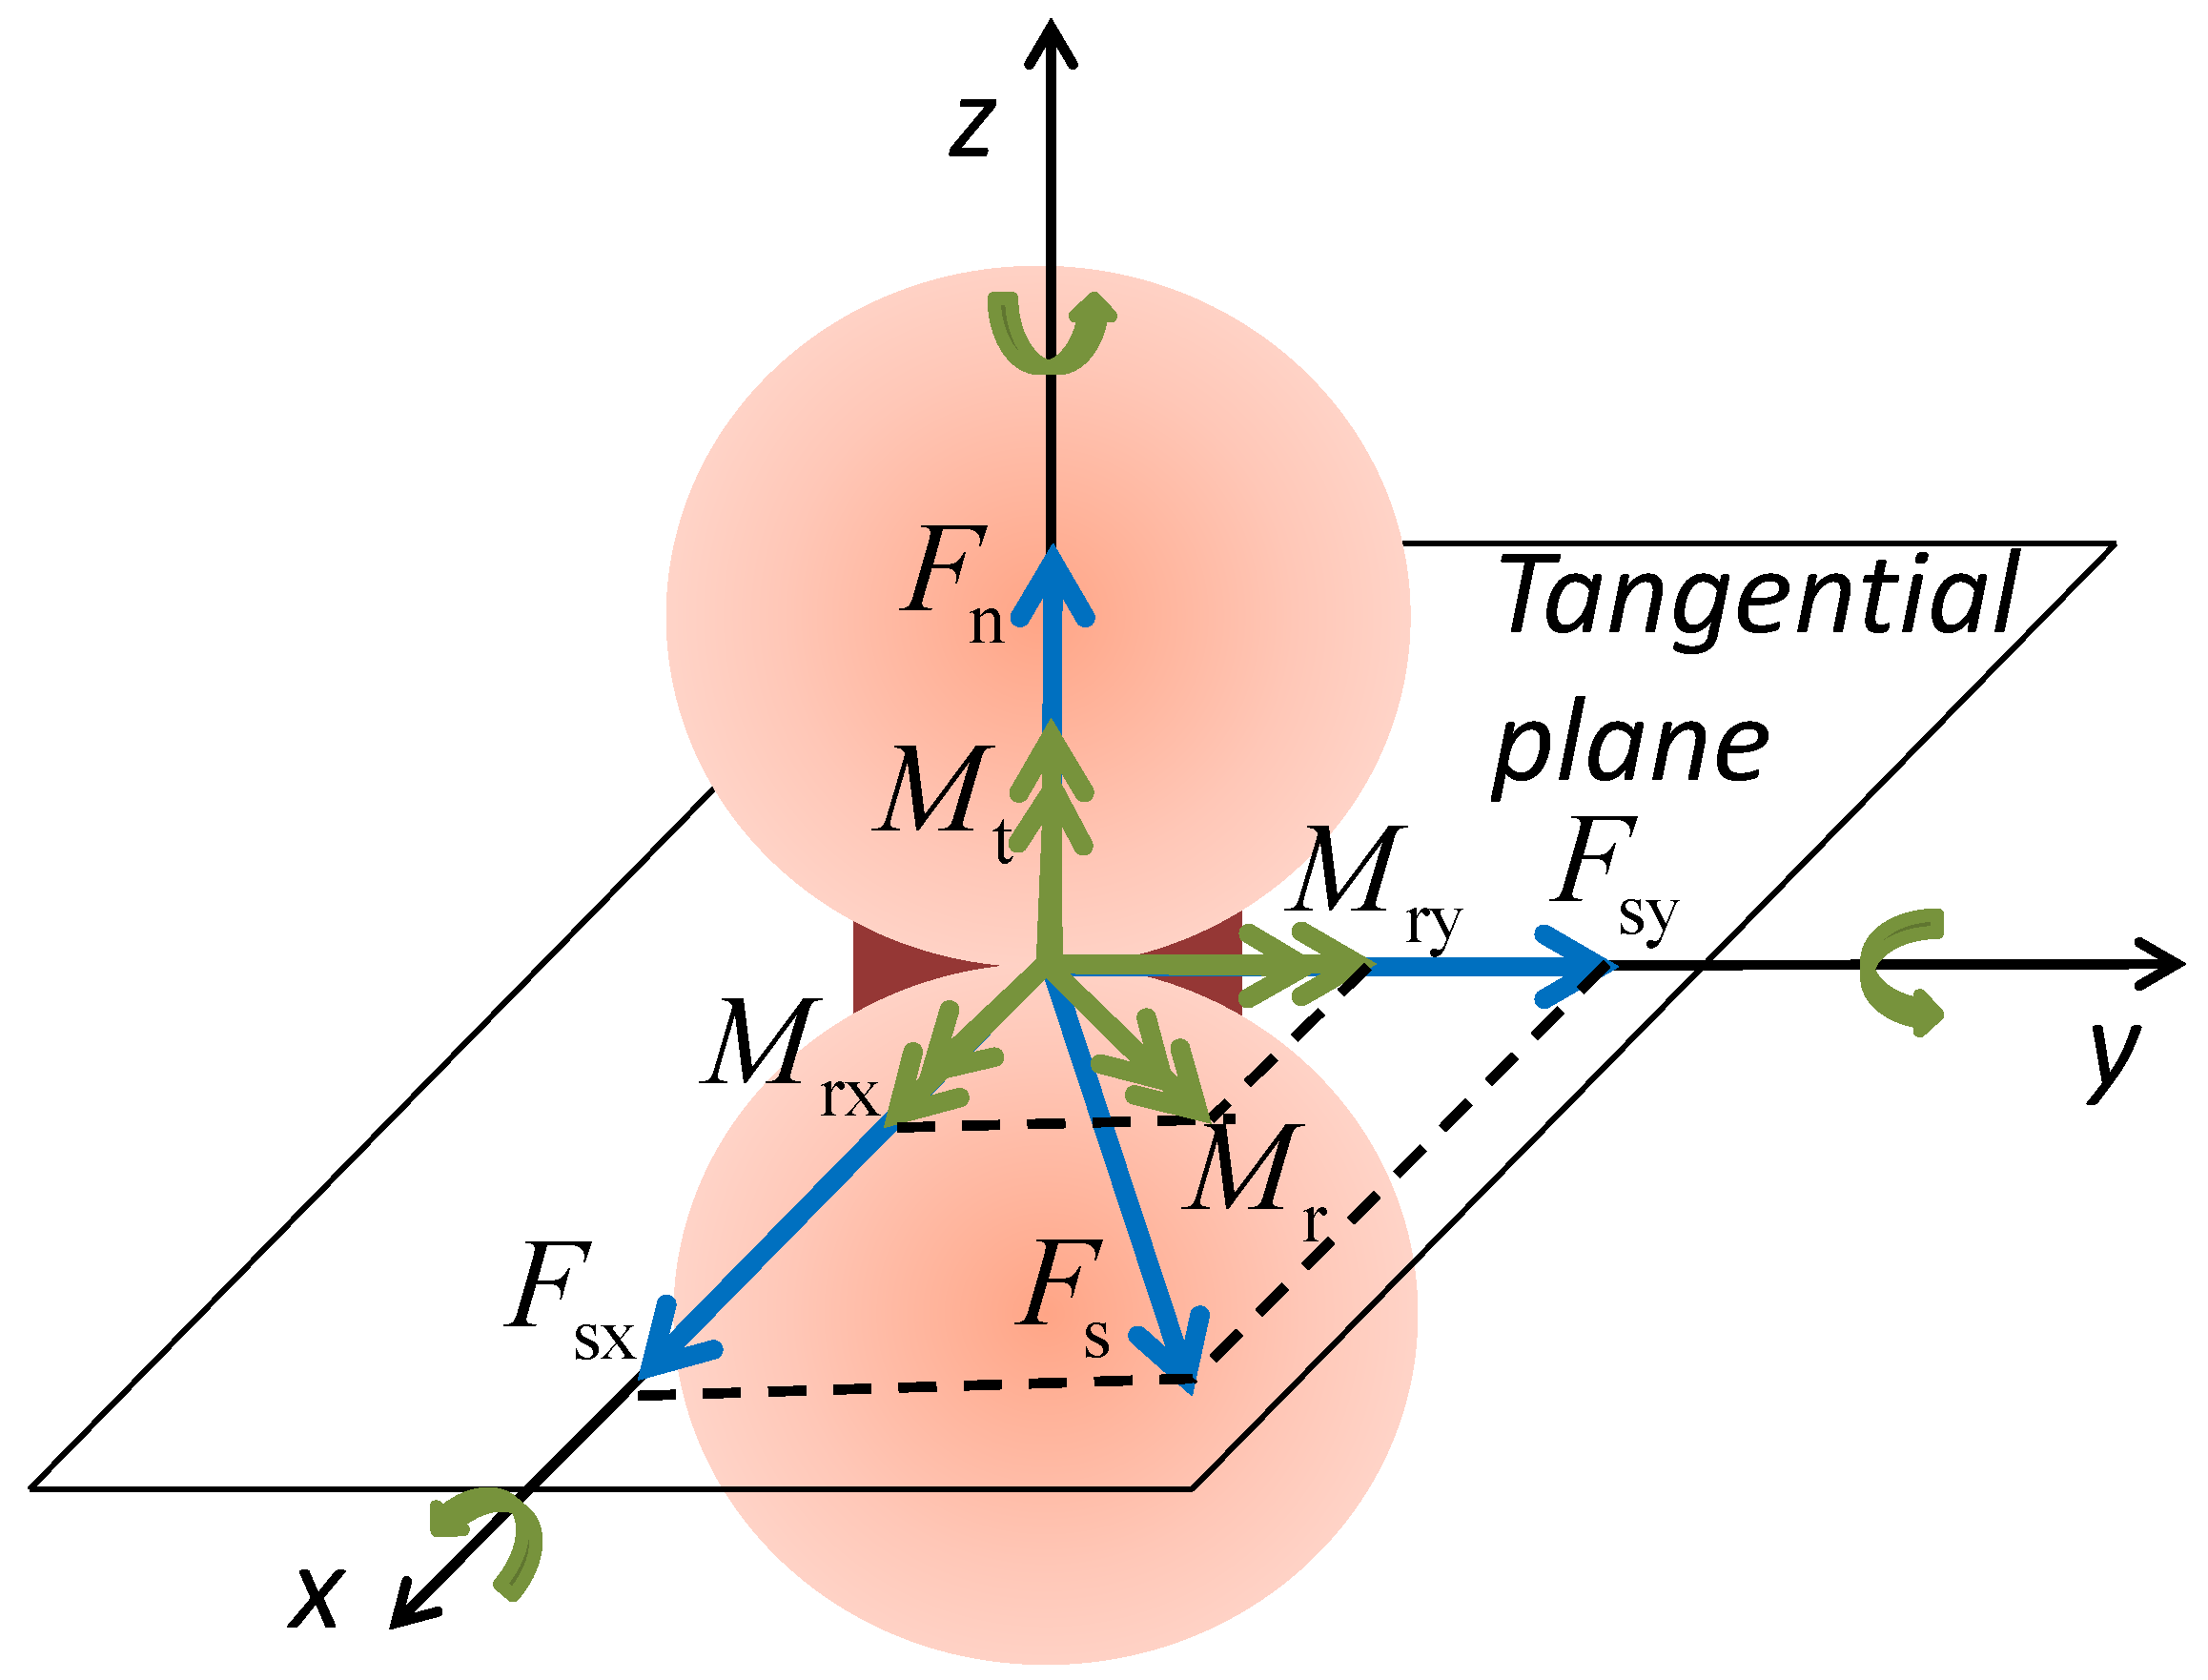
2.1.1. Particle Interaction

A three-dimensional contact model, which accounts for sliding, rolling and twisting resistances [28,29], was employed to account for the influence of particle shapes on sphere-based DEM simulations, and it was then further developed for soils with interparticle attraction forces, such as silt-sized soils with van der Waals forces [30].
The model posits that the interaction between two spheres occurs at the contact through a circular flat region with a specific radius R c = β R , where β serves as the shape parameter governing the characteristics of rolling and twisting resistances, R = 2 R 1 R 2 / ( R 1 + R 2 ) represents the shared radius of the particle pair, and R1 and R2 are their individual radii, respectively.
In the direction perpendicular to the surface, the normal force is computed by the following:
F n p = k n δ n F v         δ n 0 0                         δ n < 0
where kn is the normal stiffness, δn is the normal overlap between a pair of particles with a negative value denoting separation, and Fv is the van der Waals force.
The tangential force, rolling moment, and twisting torque are determined through incremental calculations as follows:
F s p F s p k s Δ δ s
M r p M r p k r Δ θ r
M t p M t p k t Δ θ t
where ks, k r = 0.25 k n R c   2 , and k t = 0.5 k s R c   2 denote the tangential, rolling, and twisting stiffnesses, respectively, and Δ δ s , Δ θ r , and Δ θ t are the relative shear displacement increment, rotation increment, and twist increment, as introduced in the contact resolution in PFC3D [28]. Tangential sliding is initiated and the contact transitions to the perfectly plastic stage once the tangential force reaches its limiting value, i.e., F s p μ ( F n   p + F v ) , where μ is the friction coefficient between the particles. Similarly, rolling is initiated when the rolling moment attains the limiting value, i.e., M r p 0.25 ζ c R c ( F n   p + F v ) , where the local crushing parameter ζ c is 2.1. Plastic twisting is triggered when the torque reaches its limiting value, i.e., M t p 0.65 μ R c ( F n   p + F v ) .
The normal and tangential stiffnesses can be calculated in a simple way to consider the effect of particle radii [28]:
k n = π R 2 E * / ( R 1 + R 2 )
k s = k n / κ *
where E * represents the effective modulus between particles, and κ * denotes the ratio of normal stiffness to shear stiffness.

2.1.2. Prefailure Behavior of the Cementation Bond

The connection between two spheres can be conceptualized as a short cylinder with concave spherical ends. The behavior of the cementation bond is proposed based on both contact tests and theoretical analyses. The bond cylinder radius is calculated by R b = λ b R [28], where λ b is the bond radius multiplier. Before a bond breaks, the bond force and moment can be updated as follows [28,32]:
F n b F n b k n b Δ δ n
F s b F s b k s b Δ δ s
M r b M r b k r b Δ θ r
M t b M t b k t b Δ θ t
where F n b , F s b , M r b , and M t b denote the transmission of normal force, tangential force, rolling moment, and twisting torque through the bond material, respectively. k n b , k s b , k r b = 0.25 k n b R b   2 , and k t b = 0.5 k s b R b   2 are the normal stiffness, tangential stiffness, rolling stiffness, and twisting stiffness, respectively. Δ δ n is the relative normal displacement increment.
The transmission of bond force and moment is assumed to occur through different components or sections, namely A1, B1, C1, C2, B2, and A2 in series, as shown in Figure 2. Hence, the bond normal stiffness can be calculated as follows [33]:
k n b = 1 / ( δ A 1 + δ A 2 + δ B 1 + δ B 2 + δ C 1 + δ C 2 )
δ A 1 = R 1 ξ E π E ¯ * R b   2
δ B 1 = 1 2 π E ¯ * ( 1 η E ) R 1 Λ E ln ( Λ E + 1 Λ E 1 ) ln ( Λ E + ξ E Λ E ξ E )       ( when   η E < 1 ) R 1 ( 1 ξ E ) π E ¯ * R b   2       ( when   η E = 1 )
δ C 1 = h 0 b / 2 η E π E ¯ * R b 2
where δ A 1 , δ B 1 , and δ C 1 are calculated by integration along the force-transmitting path, while δ A 2 , δ B 2 , and δ C 2 can be obtained similarly. ξ E = 1 ( R b / R 1 ) 2 and Λ E = 1 + η E 1 η E ( R b / R 1 ) 2 are intermediate variables. h 0 b is the bond thickness, and h 0 b = 0 for a thin bond, which forms after the two particles have been in physical contact. E ¯ *     is the bond effective modulus. Since the modulus of the bond material is smaller than that of the particles, the modulus reduction factor η E is incorporated. The stiffness will be reduced to the parallel bond [32] when η E = 1 and h 0 b = 0 .
The bond tangential stiffness can be computed as follows [28]:
k s b = k n b / κ ¯ *
where κ ¯ * represents the ratio of normal stiffness to shear stiffness in the bond.

2.1.3. Bond Failure Criterion

Upon reaching the failure criterion, the bond undergoes breakage, resulting in abrupt reductions in force and moment in the contact to their residual values. A bond failure criterion proposed in Shen et al. [34] is simplified [33] and applied in the simulations. This bond failure criterion considers the bond size effect and the coupled effect of the normal force, tangential force, rolling moment, and twisting torque on the bond failure. The criterion will be briefly introduced below.
The bond compressive and tensile strengths, denoted by R nc b and R nt b , respectively, are expressed as follows [34]:
R nc b = χ c σ c b A b ,             χ c = c 1 λ b   c 3 exp ( c 2 h 0 b 2 R b )
R nt b = χ t σ t b A b ,               χ t = 1
where A b = π R b   2 represents the cross-sectional area of the bond cylinder. σ c b represents the compressive strength, and σ t b signifies the tensile strength of the bond material. σ t b = η σ σ c b , where η σ represents the ratio of tensile strength to compressive strength. χ c and χ t are two factors considering the bond size effect, for which c 1 = 1.45 , c 2 = 0.7 , and c 3 = 1 / 6 were used.
The shearing, rolling, and twisting strengths, namely R s b = S s b ( R nc b + R nt b ) , R r b = S r b ( R nc b + R nt b ) R b , and R t b = S t b ( R nc b + R nt b ) R b , of the bond depend on the compressive strength R nc b , the tensile strength R nt b , and the bond size [34], where S i b (I = s, r, and t, denoting shearing, rolling, and twisting, respectively) captures the impact of the normal force on the shearing, rolling, and twisting strengths. A simplified form of S i b can be expressed as follows [33,34]:
S i b = m i f n b [ ln ( 1 / f n b ) ] 3 / 5
where f n b = ( F n b + R nt b ) / ( R nc b + R nt b ) is a dimensionless normal force, and the strength envelope shape parameters m s = 0.5 , m r = 0.3 , and m t = 0.36 are adopted according to the data obtained by Shen et al. [34].
In general, a bond may be subjected to the normal and shear forces, rolling moment, and torque. A unified failure criterion can be characterized as follows [34]:
F s b R s b 2 + M r b R r b 2 + M t b R t b 2 = 1      

2.2. DEM Simulations

2.2.1. Sample Preparation

The particle and particle interaction parameters that are used to prepare the uncemented sample are the same as those of the saturated sample in the work of Li et al. [30] and are shown in Table 1. In particular, at the ball–wall contacts, both the friction coefficient and the shape parameter are zero. A van der Waals force of 1.6 × 10⁻⁶ N is applied to each ball–ball contact because it cannot be neglected for silt-sized soils [4]. Figure 3 shows the grain size distribution curve of the DEM sample with a median grain size of 20 µm. An assembly is compacted in five layers via the multi-layer under-compaction method (UCM) [35]. The cubic sample is composed of 42,180 particles with a side length of 0.67 mm. When using the UCM method, the accumulated layers of the particles are compacted to an intermediate void ratio that is slightly higher than the target void ratio, 0.945, to obtain a homogenous DEM sample. Then, a vertical pressure of 12.5 kPa is applied to the top and bottom walls with the sidewalls kept stationary to reproduce an in situ K0 stress state.
After sample preparation, the bonds were then installed at neighboring particles with a gap of less than g c R b , where g c is the bond thickness threshold. Table 1 lists the bond parameters that were empirically set to study cemented silts in general [33]. The compressive and tensile strengths are significant parameters that control the shear strength of a cemented soil. Two representative compressive strengths, 5 MPa for weak bonds and 25 MPa for strong bonds, were analyzed in this study. Given that the experimental results indicate a significantly lower tensile strength compared to the compressive strength, the tension-to-compression strength ratio was assumed to be 0.1.

2.2.2. Simulation Execution

The mean stress p, deviator stress q, volumetric strain ε v , and deviator strain ε s are expressed as follows:
p = 1 3 ( σ 1 + σ 2 + σ 3 )
q = 2 2 ( σ 1 σ 2 ) 2 + ( σ 2 σ 3 ) 2 + ( σ 3 σ 1 ) 2
ε v = ε 1 + ε 2 + ε 3
ε s = 2 3 ( ε 1 ε 2 ) 2 + ( ε 2 ε 3 ) 2 + ( ε 3 ε 1 ) 2
where σ 1 , σ 2 , and σ 3 are the principal stresses of the stress tensor, and ε 1 , ε 2 , and ε 3 are the principal strains of the stain tensor.
Following the installation of bonds, numerical samples underwent a series of tests, including constant stress ratio compression, one-dimensional compression (1D compression), conventional triaxial tests, and true triaxial tests. Figure 4 shows the stress paths in the DEM simulations. During one-dimensional compression, incremental loads were imposed on the top and bottom walls while keeping the sidewalls in a stationary position. In constant stress ratio compression (CSR compression), incremental loads were applied to the top and bottom walls, and the sidewalls were servo-controlled to maintain a constant principal stress ratio C S R = σ 3 / σ 1 .
In triaxial tests, following the isotropic compression of samples to various confining stresses, continuous deviator loading was initiated by downward and upward movement of the top and bottom walls. Simultaneously, the sidewalls were servo-controlled to sustain a constant horizontal stress in the conventional triaxial tests and to align the horizontal stresses with their designated target values in the true triaxial tests (constant p). The target values are determined through the following calculation:
σ 2 = ( 3 3 b ) p ( 1 2 b ) σ 1 2 b
σ 3 = 3 p ( 1 + b ) σ 1 2 b
where the coefficient b = (σ2σ3)/(σ1σ3).

3. Results

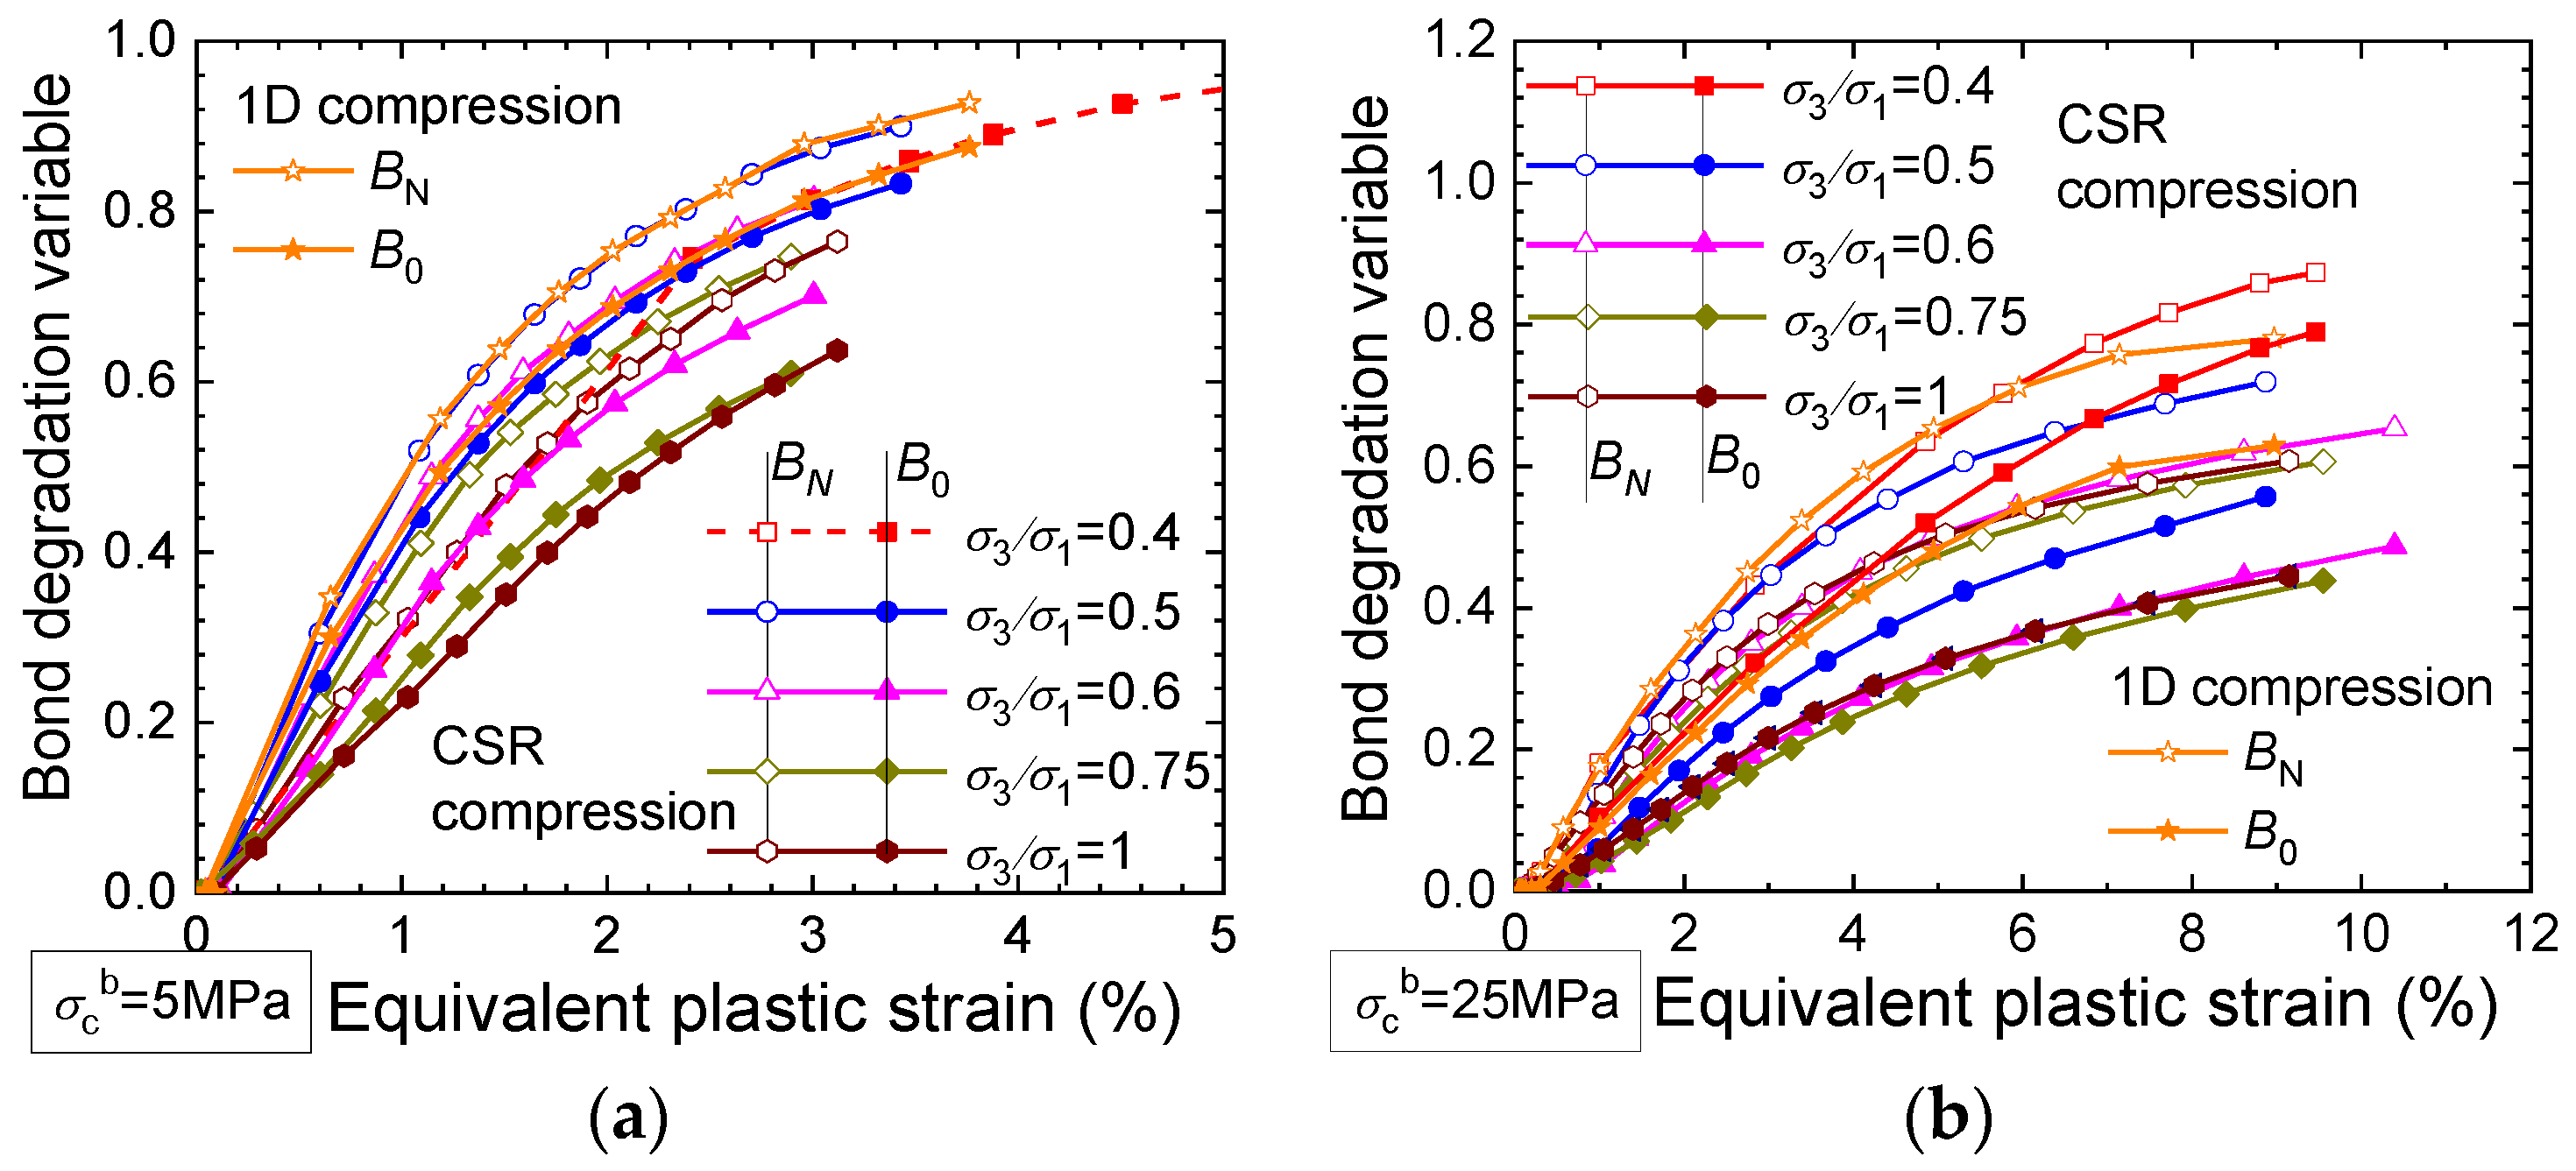
3.1. Bond Degradation Evolutions

The stress and strain of a granular material depend on the interparticle forces at the contacts. The average stress of a representative volume element (RVE) can be expressed as follows [36]:
σ ¯ i j   = 1 V   k = 1 N   F i k l j k
where V and N are the volume and the number of contacts of the RVE, respectively; F i k is the contact force at contact k; and l j k is the branch vector connecting the centers of the two particles.
In the disturbed state concept and damage mechanics [37] regarding cemented granular materials, it is assumed that cemented soils generally consist of bonded aggregates and unbonded grains. To evaluate the bond degradation in cemented soils subjected to external loading, a primary bond degradation variable can be defined as the ratio of the unbonded contact number to the total contact number as follows:
B N = N d N
where N d is the number of unbonded contacts.
By assuming that the applied loading is independently sustained by bonded aggregates and unbonded grains, the second bond degradation variable can be defined as the ratio of the stress sustained by the unbonded contacts to the total stress as follows:
B 0 = k = 1 N d F i k l j k k = 1 N F i k l j k
Under external loading, the bonded aggregates in the cemented soil gradually break and transform into unbonded grains due to the breakage of bonded contacts. The bond degradation variables BN and B0 represent the degree to which the soil bonding is damaged. When the bond degradation variable equals zero, the applied loading is completely sustained by the bonded aggregates, indicating that the soil bonding is intact. The bond degradation variable of the soil increases as more bonded contacts break. When the value of the bond degradation variable reaches 1.0, the soil bonding is fully disturbed; the applied stress is completely sustained by the unbonded grains.
The bond degradation is commonly assumed to vary with the plastic strain. The bond degradation mainly evolves with the volumetric plastic strain in compression tests, while it primarily develops with the deviator plastic strain in triaxial tests. Hence, an equivalent plastic strain must be introduced to consider both the volumetric and deviator plastic strains. A simple equivalent plastic strain can be defined as ε d p = ( ε v p ) 2 + ( ε s p ) 2 , where ε v p is the volumetric plastic strain and ε s p is the deviator plastic strain.

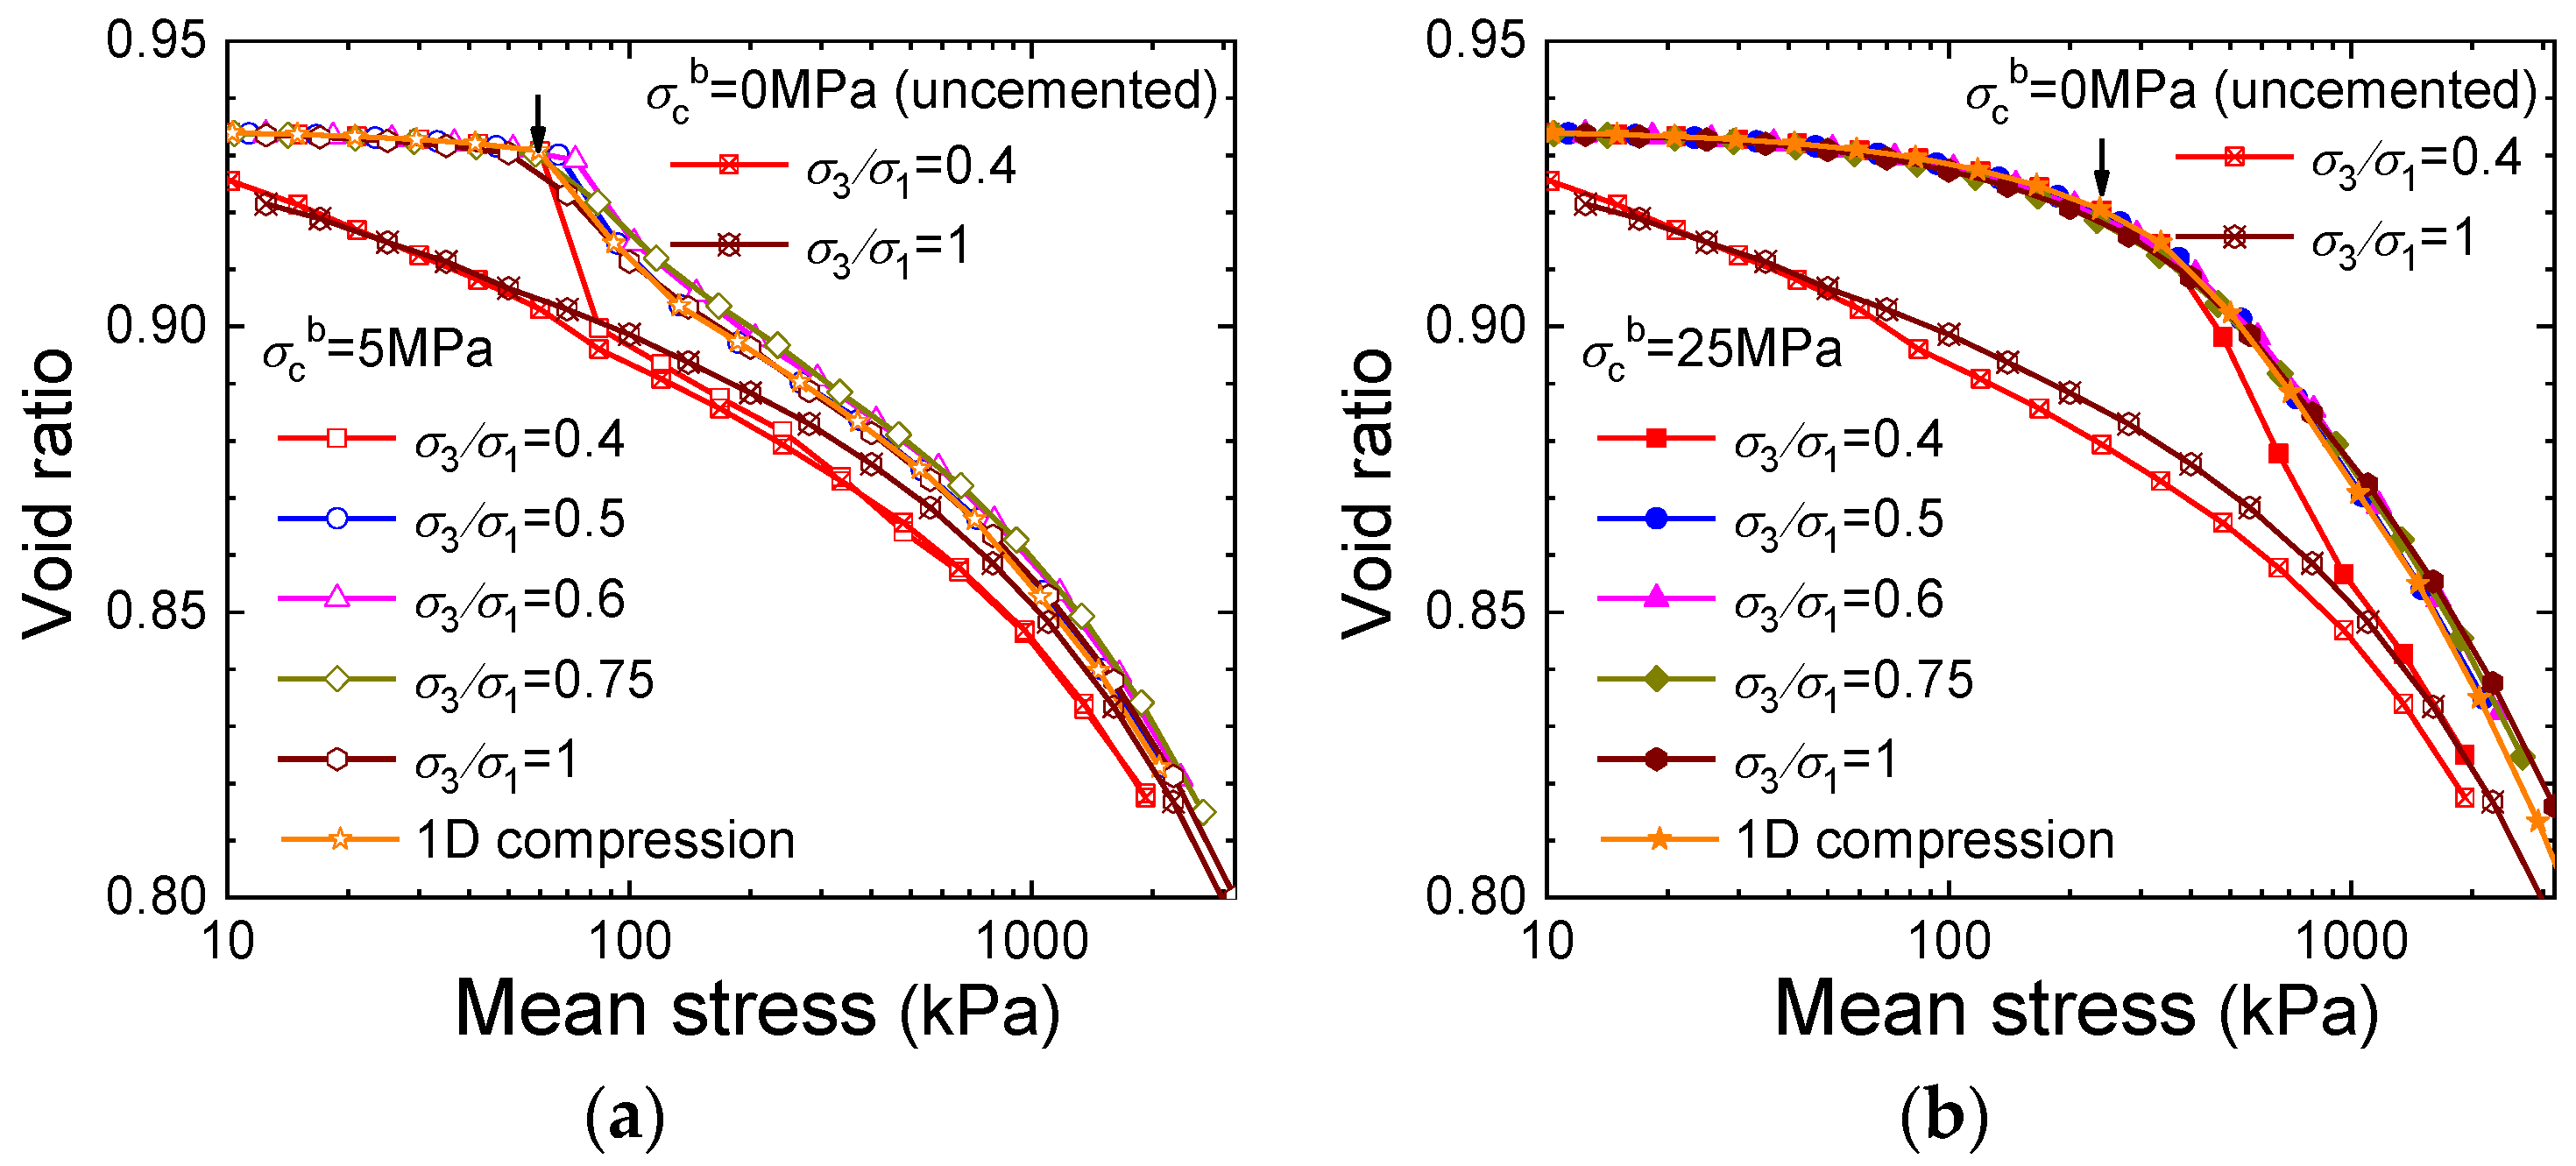
3.2. Compression Tests

Figure 5 shows the compression curves of the numerical samples under constant stress ratio compression with different principal stress ratios as well as the one-dimensional compression tests. For the numerical sample with weak bonds ( σ c b = 5 MPa , sample I), the void ratio first gradually decreases and then accelerates after an obvious distinguishing point, namely the “structural yield stress” point, which agrees with the experimental results [38]. In contrast, the slopes of the compression curves vary relatively gradually for the numerical sample with strong bonds ( σ c b = 25 MPa , sample II).
All of the specimens with different principal stress ratios are fairly coincident with each other except for the specimen with a principal stress ratio of σ 3 / σ 1 = 0.4 . Both the experimental [38,39] and DEM results illustrate that the compression curve with a small principal stress ratio is separated from the coincident curve, which is probably because the stress state approaches the sample strength envelope. The compression curve with σ 3 / σ 1 = 0.4 is separated from the coincident curves at a mean stress of approximately 65 kPa for sample I, while it separates at approximately 400 kPa for sample II due to the different bond strengths.
Figure 6 shows the evolution of the bond degradation variables BN and B0 with the equivalent plastic strain under compression tests. Both variables increase at a decreasing rate with the equivalent plastic strain until they reach 1.0 under different principal stress ratios. There is a small threshold strain, especially for sample II, with strong bonds.
Both the principal stress ratio and the bond strength affect the evolution of the bond degradation variables. The effect of the principal stress ratio in sample II with strong bonds is more considerable than that in sample I. The bond degradation variables generally decrease as the principal stress ratio increases between 0.4 and 1.0. Except for σ 3 / σ 1 = 0.4 in sample I, B0 is smaller than the corresponding BN, demonstrating the priority of the bonded contacts to sustain the applied loading throughout the compression tests.

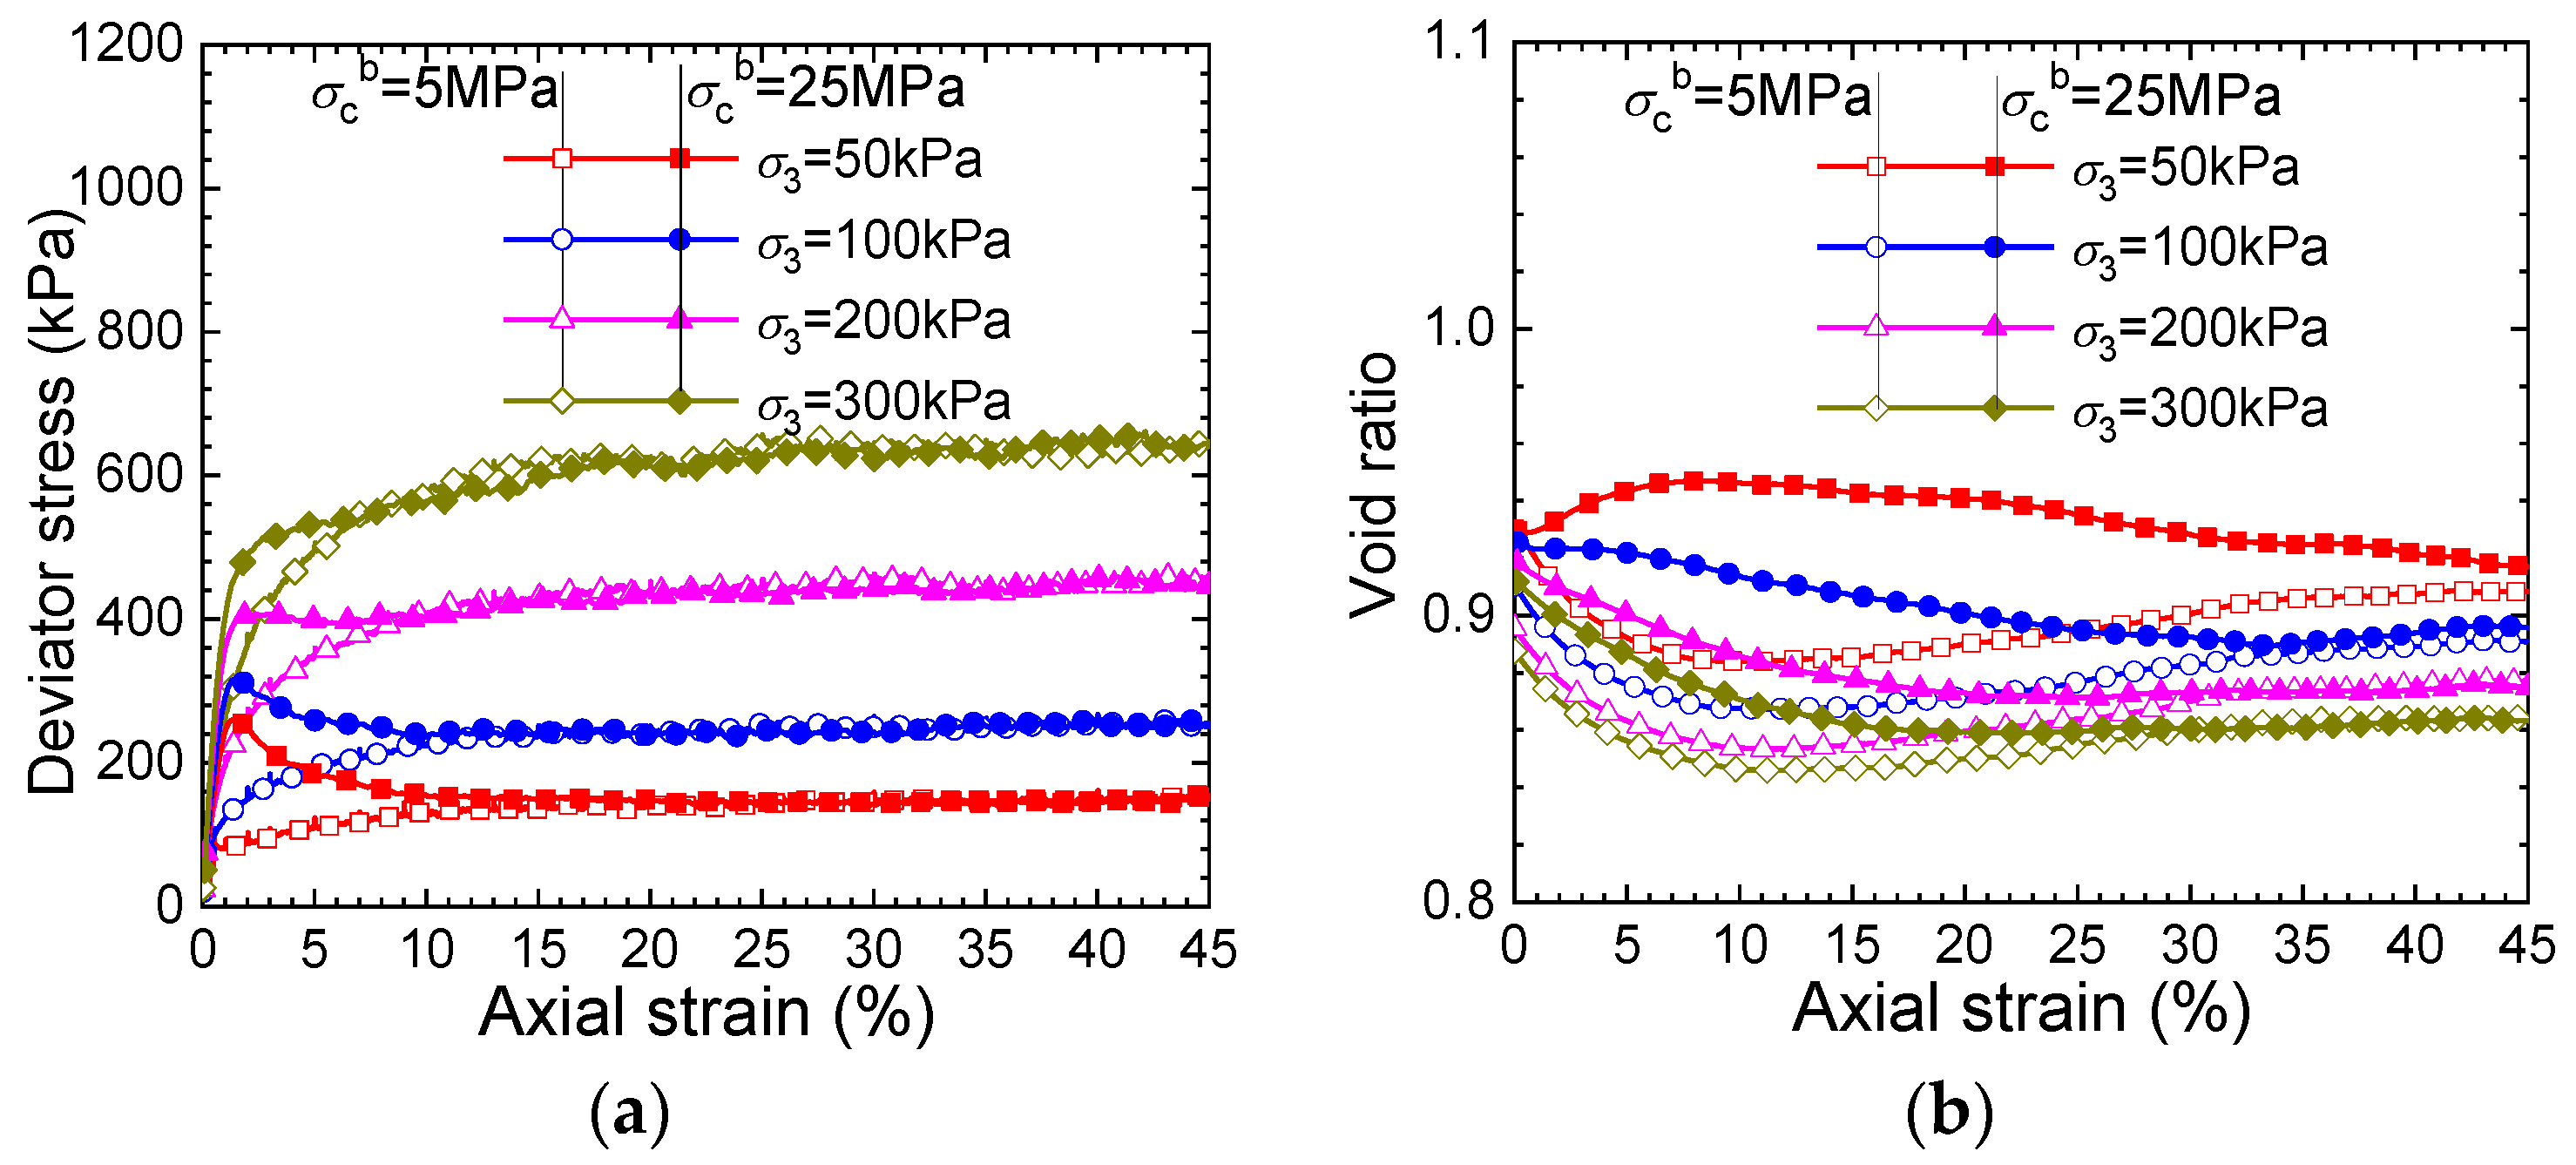
3.3. Conventional Triaxial Tests

Figure 7 shows the relationships between the deviator stress/void ratio and axial strain observed in the conventional triaxial tests. The DEM simulation reproduces the typical behavior of cemented soils [2,40]. The deviator stress increases, and the void ratio decreases with the increase in confining stress. The strain-softening behavior increases, and the tendency for the specimens to expand increases under shearing as the bond strength increases. The deviator stresses and void ratios are almost the same for samples I and II at the critical state, which demonstrates a similar critical state for samples with different bond strengths.
Figure 8 shows the evolution of the bond degradation variables BN and B0 in conventional triaxial tests. There are initial equivalent plastic strains and initial bond degradation variables at the beginning of shearing for sample I under confining stresses larger than 50 kPa, which is ascribed to isotropic compression before shearing. However, the initial degradation variables are almost zero after isotropic compression for sample II on account of the large bond strength.
The evolution of the bond degradation variables in sample I with weak bonds is slightly influenced by the confining stress; some curves form a rough “S” shape under shearing. The degradation variables of the robust bonds in Sample II show an upward trend with an increasing confining stress. The degradation variable B0 is smaller than BN at the intermediate stage of shearing, similar to the conclusion in the compression tests, while B0 varies near or higher than BN at the end of shearing when the stress state develops close to the strength envelope, as illustrated by the circles in Figure 8 and Figure 9.

3.4. True Triaxial Tests

Figure 10 represents the macroscopic behavior of the numerical specimens in true triaxial tests (constant p). Parallel to the findings in conventional triaxial tests, there is an augmentation in the strain-softening behavior and an expanding tendency as the bond strength rises. In laboratory tests [41], it is noted that the deviator stress declines, and the void ratio increases with the growing coefficient b = (σ2σ3)/(σ1σ3).
Figure 11 shows the evolution of the bond degradation variables BN and B0 in the true triaxial tests. The degradation variables increase with the equivalent plastic strain, forming a rough “S” shape for sample I with weak bonds, and increase at a decreasing rate for sample II with strong bonds. The bond degradation variables are slightly influenced by the coefficient b for sample I, while they decrease considerably as the coefficient b increases for sample II. The degradation variable B0 tends to be near or higher than BN at the end of shearing, especially for the samples with a small confining stress and small coefficient b.

4. Discussion

The evolution of the bond degradation variables BN and B0 with the equivalent plastic strain appears to be affected by the ratio of principal stresses, confining stress, and coefficient b, especially for samples with strong bonds. Hence, there is a defect in using a general bond degradation evolution law, e.g., B N   or   B 0 = f ( ε d p ) , in constitutive modeling since the parameters in the formula are dependent on the stress path. It is necessary to further develop a stress-path-independent bond degradation variable.
The stress ratio and strength potential are incorporated into B0 to derive a bond degradation variable Bσ that considers their effect on the bond degradation evolution as follows:
B σ = 2 B 0 1 + ( η / η f ) 2
where η = q / p is the stress ratio, η f = q f / p is the strength potential, and q f is the deviator stress at failure. η f can be expressed by an extended elliptical envelope:
η f = max ( M ( p + p t p ) ( p c p + p t 1 ) 1 / n , M )
The envelope, in which the parameters are determined using conventional triaxial tests, is shown in Figure 4 for both samples I and II. In the expression of Bσ, η / η f is incorporated to accommodate the bond degradation rate.
Figure 12 shows the collective evolution of the bond degradation variables B0 and Bσ with the equivalent plastic strain under all of the above stress paths. The impact of the stress path on the evolution of the bond degradation variable Bσ seems to be less pronounced compared to that on B0. The collective data of Bσ can be effectively fitted using the following exponential formulation and hyperbolic formulation:
B σ = 1 exp [ c a ( ε d p ) c b ]
B σ = ε d p h a + h b ε d p
where c a represents the increasing rate of Bσ, and c b is an index. 1 / h a controls the increasing rate of Bσ, and 1 / h b represents the ultimate value of Bσ. Figure 12c,d show the fitting curves of both formulations.
In constitutive modeling, one-dimensional compression and conventional triaxial tests are recommended to determine the parameters in the evolution law of the bond degradation variable Bσ for simplicity.

5. Conclusions

This paper investigates the bond degradation evolution of cemented soils at the particle and contact scales. Numerical compression and triaxial tests reproduced the primary experimental mechanical behavior. Then, the simulation results were used to investigate the evolution of the bond degradation variables BN and B0. A stress-path-independent bond degradation variable Bσ was developed based on B0, and its evolution law was formulated accordingly. The conclusions are as follows:
(1)
The bond degradation variables BN, B0, and Bσ represent the extent to which the soil bonding is damaged. A degradation variable of 0/1.0 indicates that the applied stress is completely sustained by the bonded aggregates/unbounded grains.
(2)
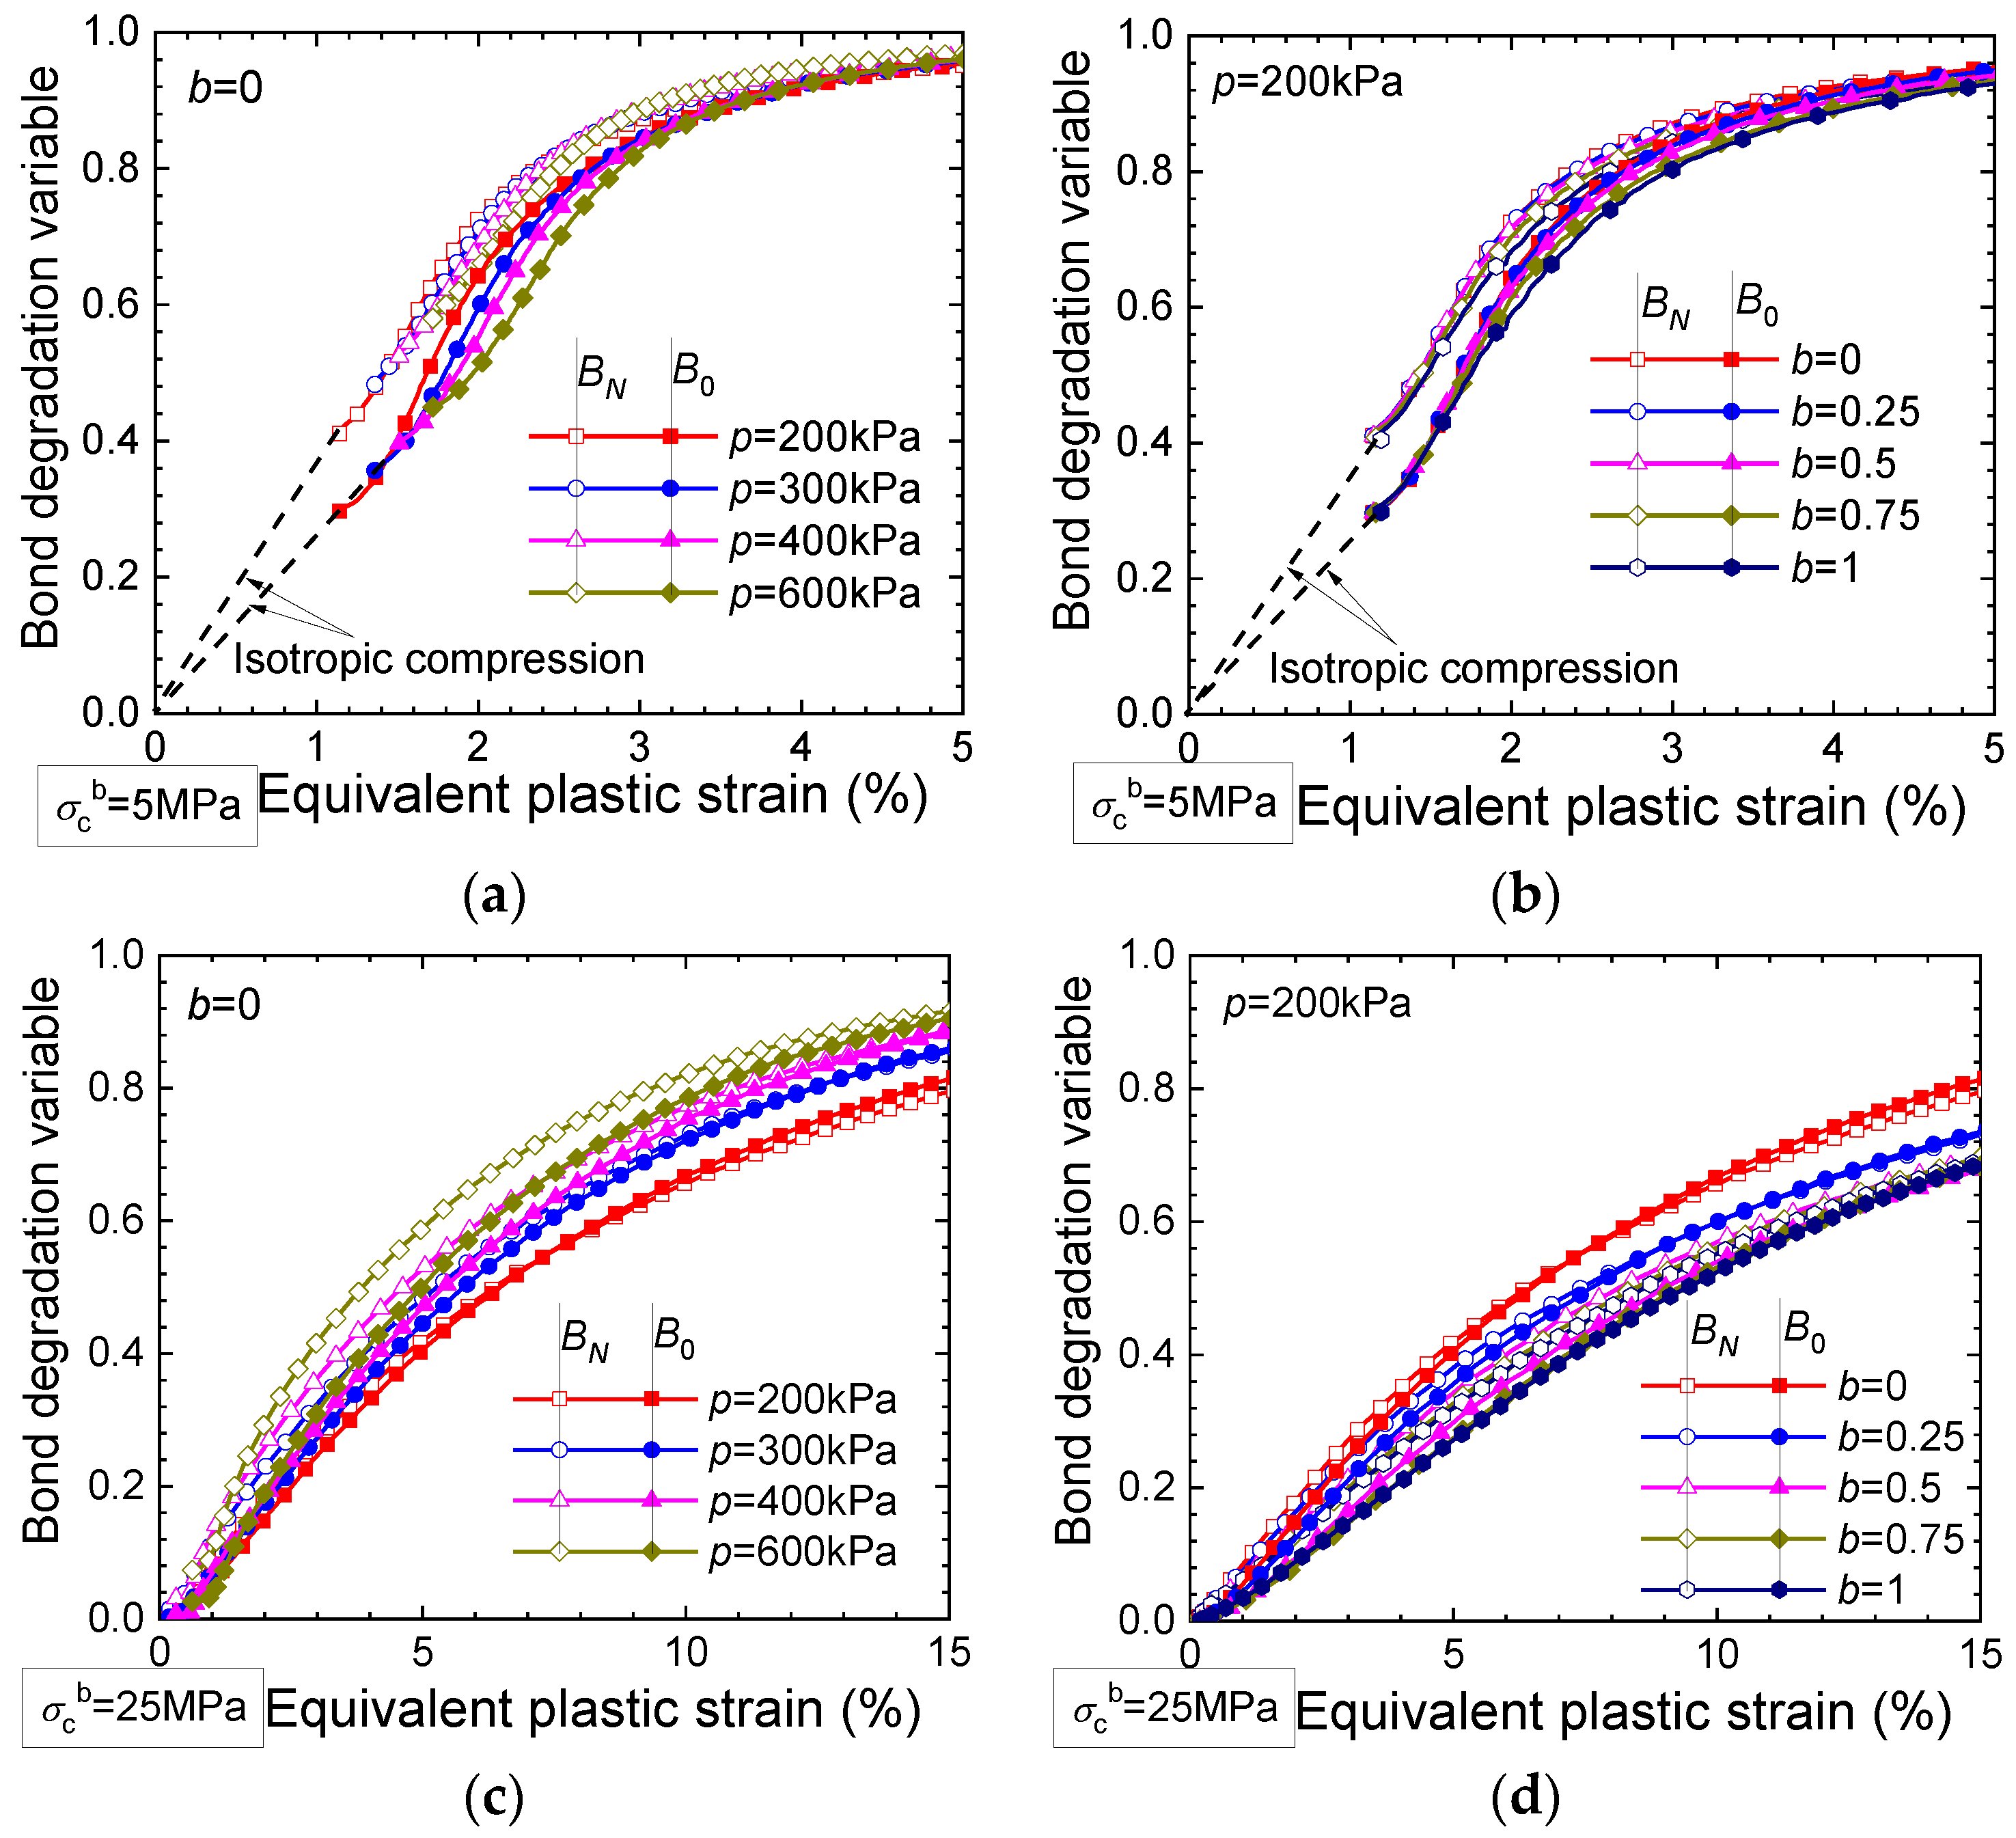
The bond degradation variables BN and B0 increase with the equivalent plastic strain until they reach 1.0 under varying stress paths. The evolutions of both variables are influenced by the principal stress ratio, confining stress, and coefficient b, especially for the sample with strong bonds.
(3)
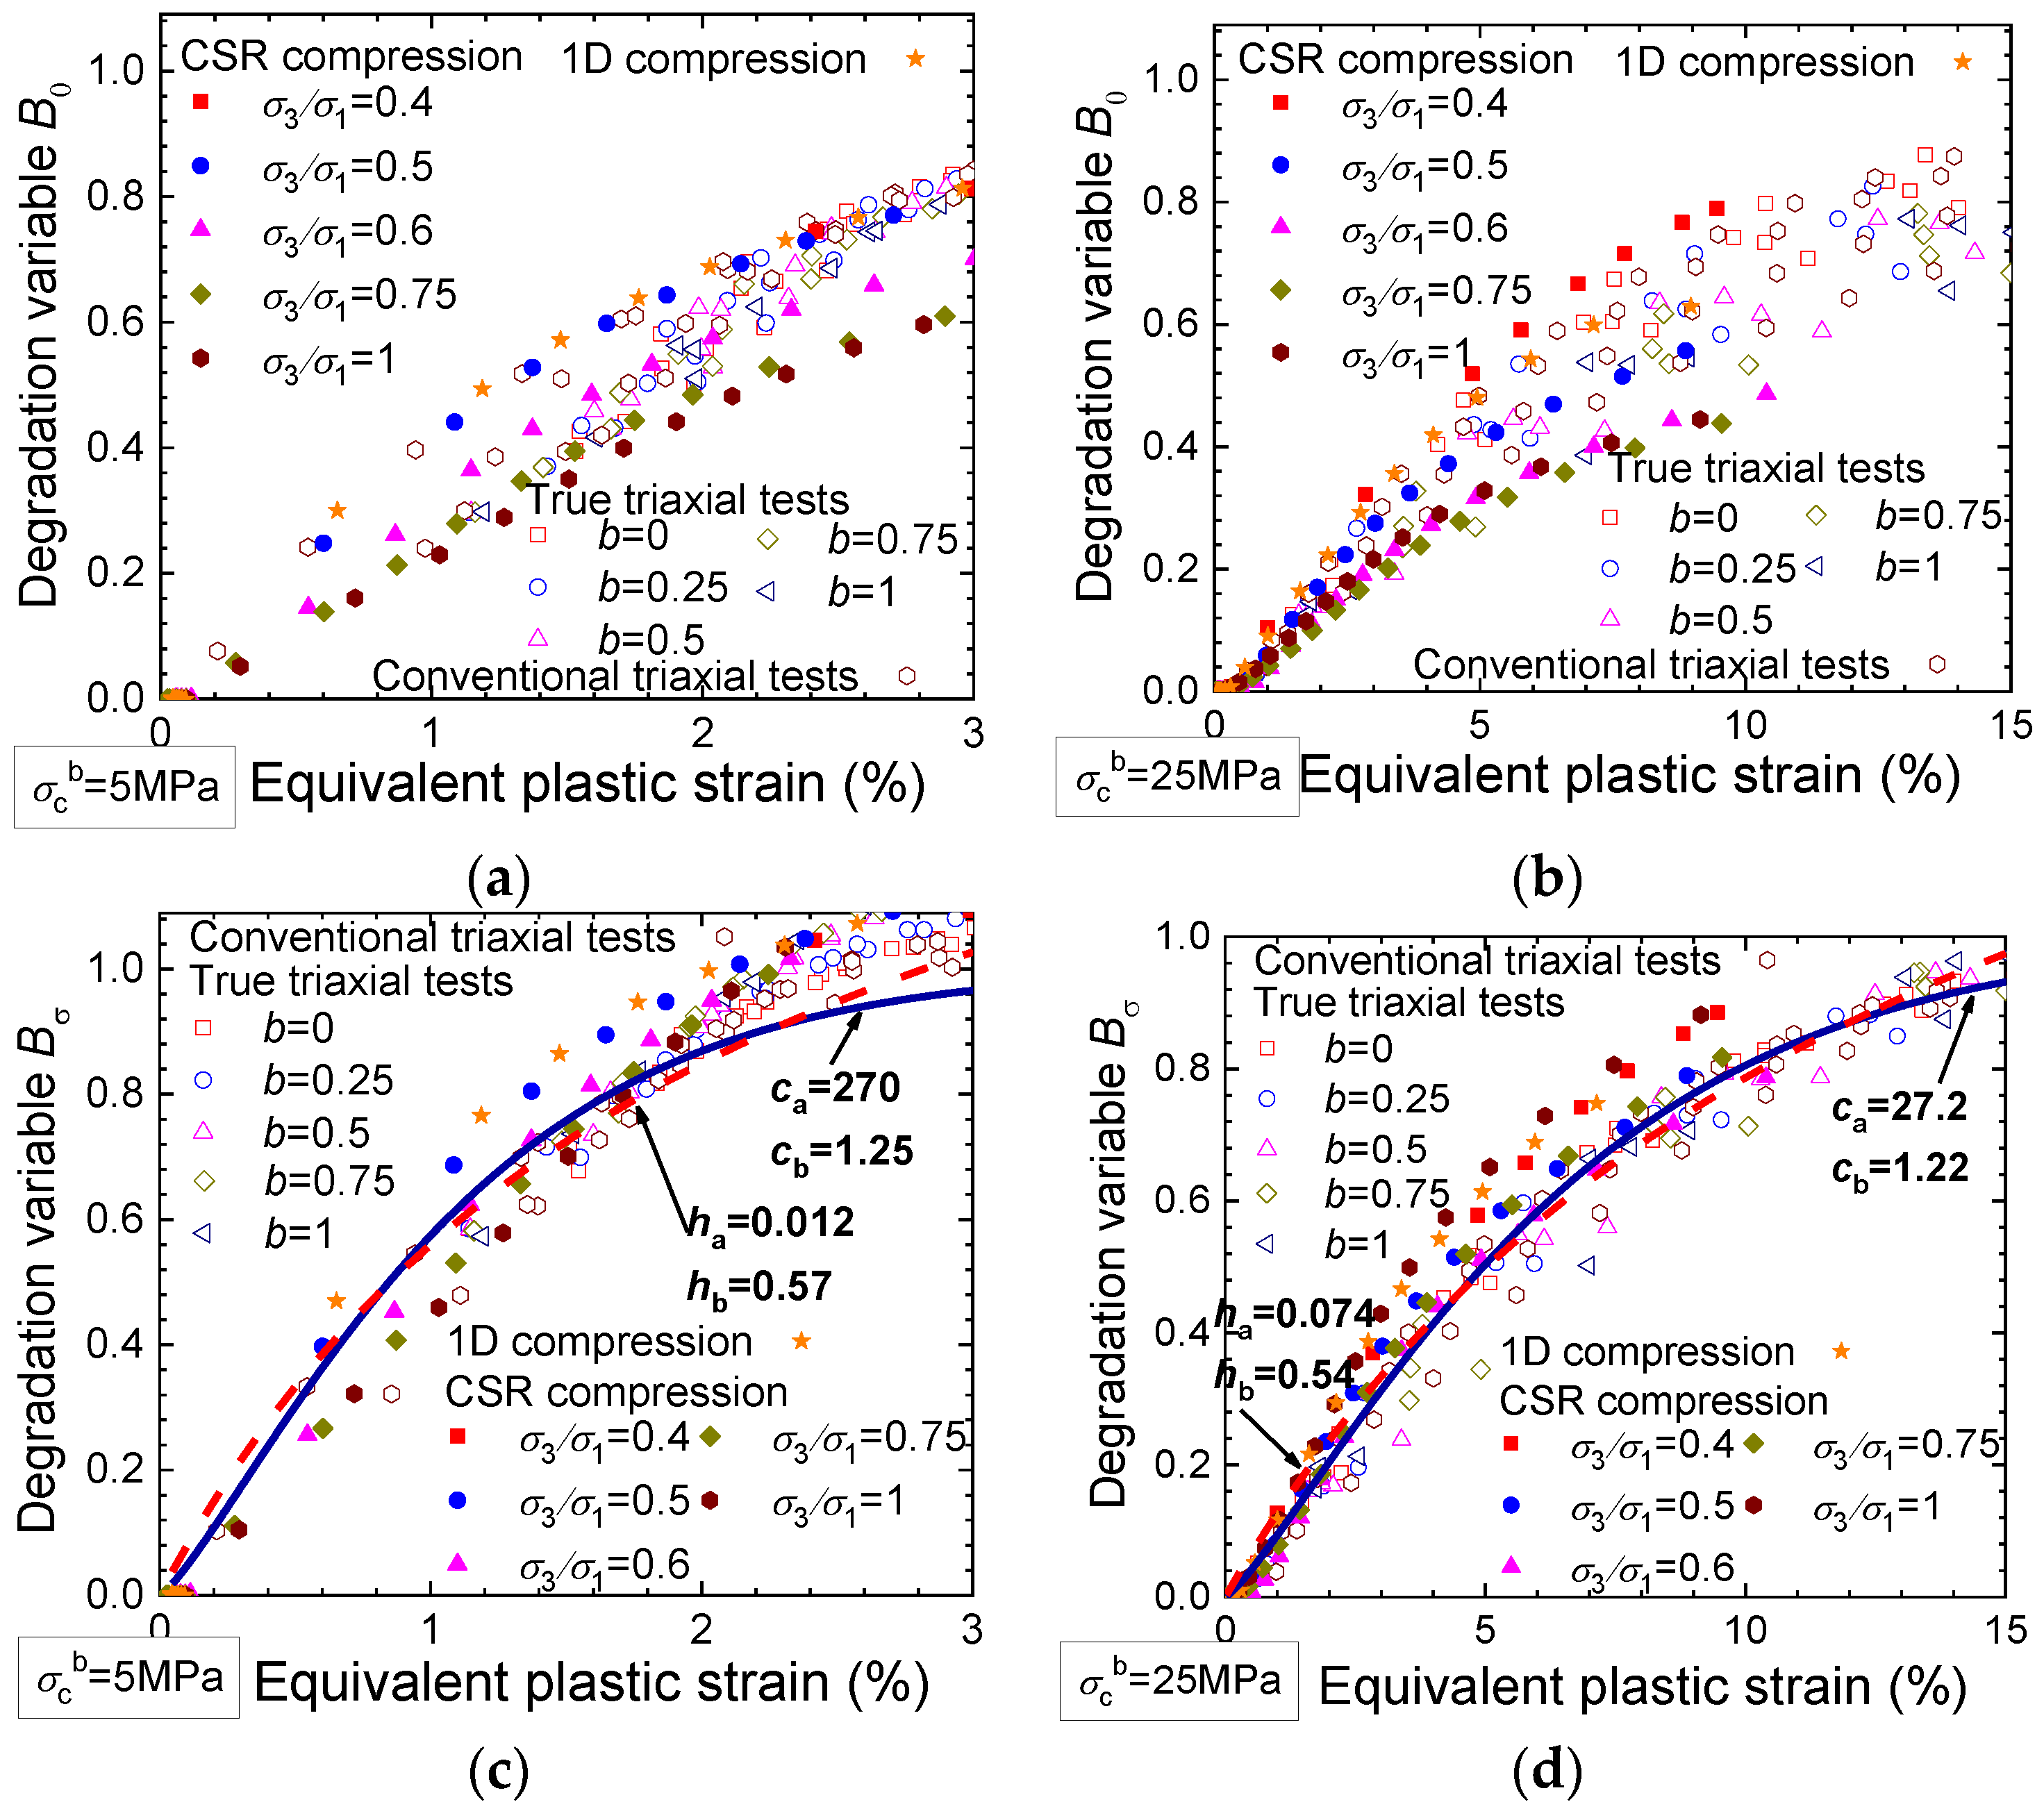
In compression tests with principal stress ratios higher than 0.4, B0 is smaller than the corresponding BN, indicating the priority of the bonded contacts to sustain the applied loads. In triaxial tests, B0 is smaller than BN before the intermediate stage of shearing, and then B0 evolves to be near or larger than BN at the end of shearing when the stress state approaches the strength envelope.
(4)
The evolutions of the further developed bond degradation variable Bσ under different stress paths are approximately coincident with each other. The collective data of Bσ can be effectively fitted by an exponential or a hyperbolic evolution law.
In the future, the evolution of the bond degradation variables for unsaturated structured soils will be studied by taking capillary forces into account. A micromechanical-based constitutive model for cemented soils can be developed by incorporating the evolution law of the bond degradation variable.

Author Contributions

Writing—original draft and review and editing, J.H.; writing—original draft and review and editing, T.L. and Y.R. All authors have read and agreed to the published version of the manuscript.

Funding

This work was financially supported by the China National Natural Science Foundation (No. 51809193) and the China Postdoctoral fund (No. 2019M651580). These supports are greatly appreciated.

Data Availability Statement

The data associated with this research are available from the corresponding author upon reasonable request.

Conflicts of Interest

The authors declare that they have no known competing financial interests or personal relationships that could have appeared to influence the work reported in this paper.

Abbreviations

R c contact radius of particle interaction
β shape parameter
R common radius of a particle pair
F v van der Waals force
F n p normal force of particle interaction
F s p tangential force of particle interaction
M r p rolling moment of particle interaction
M t p twisting torque of particle interaction
k n normal stiffness of particle interaction
k s tangential stiffness of particle interaction
k r rolling stiffness of particle interaction
k t twisting stiffness of particle interaction
δ n normal overlap between a particle pair
Δ δ s relative shear displacement increment
Δ θ r relative rotation increment
Δ θ t relative twist increment
μ friction coefficient between a particle pair
E * interparticle effective modulus
κ * normal-to-shear stiffness ratio
λ b bond radius multiplier
R b bond radius
F n b bond normal force
F s b bond tangential force
M r b bond rolling moment
M t b bond twisting torque
k n b bond normal stiffness
k s b bond tangential stiffness
k r b bond rolling stiffness
k t b bond twisting stiffness
Δ δ n relative normal displacement increment
h 0 b bond thickness
E ¯ *     bond effective modulus
η E bond modulus reduction factor
κ ¯ * bond normal-to-shear stiffness ratio
σ c b compressive strength of the bond material
σ t b tensile strength of the bond material
R nc b bond compressive strength
R nt b bond tensile strength
η σ bond tension-to-compression strength ratio
R s b bond shearing strength
R r b bond rolling strength
R t b bond twisting strength
g c bond thickness threshold
σ 1 , σ 2 and σ 3 principal stresses of a stress tensor
ε 1 , ε 2 and ε 3 principal strains of a stain tensor
p mean stress
q deviator stress
ε v volumetric strain
ε s deviator strain
σ ¯ i j   average stress tensor of a representative volume element
B N bond degradation variable based on the number of unbonded contacts
B 0 bond degradation variable based on the stress contribution of unbonded contacts
ε d p equivalent plastic strain
ε v p volumetric plastic strain
ε s p deviator plastic strain
B σ bond degradation variable considering stress effect
η stress ratio
η f strength potential
p c yield surface size of a cemented soil
p c 0 yield surface size of corresponding uncemented soil

References

  1. Mitchell, J.K. Fundamentals of Soil Behavior; Wiley: New York, NY, USA, 1976. [Google Scholar]
  2. Leroueil, S.; Vaughan, P.R. The general and congruent effects of structure in natural soils and weak rocks. Géotechnique 1990, 40, 467–488. [Google Scholar] [CrossRef]
  3. Burland, J.B. On the compressibility and shear strength of natural clays. Géotechnique 1990, 40, 329–378. [Google Scholar] [CrossRef]
  4. Yang, R.Y.; Zou, R.P.; Yu, A.B. Computer simulation of the packing of fine particles. Phys. Rev. E 2000, 62, 3900–3908. [Google Scholar] [CrossRef] [PubMed]
  5. Zourmpakis, A.; Boardman, D.; Rogers, C.; Jefferson, I.; Gunn, D.; Jackson, P.; Northmore, K.; Entwisle, D.; Nelder, L.; Dixon, N. Case study of a loess collapse field trial in Kent, SE England. Q. J. Eng. Geol. Hydrogeol. 2006, 39, 131–150. [Google Scholar] [CrossRef]
  6. Xu, L.; Dai, F.C.; Tham, L.G.; Tu, X.B.; Min, H.; Zhou, Y.F.; Wu, C.X.; Xu, K. Field testing of irrigation effects on the stability of a cliff edge in loess, North-west China. Eng. Geol. 2011, 120, 10–17. [Google Scholar] [CrossRef]
  7. Yu, H.S.; Tan, S.M.; Schnaid, F. A critical state framework for modelling bonded geomaterials. Geomech. Geoengin. Int. J. 2007, 2, 61–74. [Google Scholar] [CrossRef]
  8. Nova, R.; Castellanza, R.; Tamagnini, C. A constitutive model for bonded geomaterials subject to mechanical and/or chemical degradation. Int. J. Numer. Anal. Mech. Geomech. 2003, 27, 705–732. [Google Scholar] [CrossRef]
  9. Asaoka, A.; Nakano, M.; Noda, T. Superloading yield surface concept for highly structured soil behavior. Soils Found 2000, 40, 99–110. [Google Scholar] [CrossRef]
  10. Zhu, E.Y.; Yao, Y.P. Structured UH model for clays. Transp. Geotech. 2015, 3, 68–79. [Google Scholar] [CrossRef]
  11. Liu, W.H.; Li, W.G.; Zhang, H.Y.; Lin, X.Y.; Kong, G.Q.; Wang, L.; Hu, P. A critical state constitutive model for unsaturated structured soils. Comput. Geotech. 2022, 152, 104993. [Google Scholar] [CrossRef]
  12. Desai, C.S.; Toth, J. Disturbed state constitutive modeling based on stress-strain and nondestructive behavior. Int. J. Solids Struct. 1996, 33, 1619–1650. [Google Scholar] [CrossRef]
  13. Wu, Z.; Xu, J.; Li, Y.; Wang, S. Disturbed state concept–based model for the uniaxial strain-softening behavior of fiber-reinforced soil. Int. J. Geomech. 2022, 22, 04022092. [Google Scholar] [CrossRef]
  14. Shen, Z.J. An elasto-plastic damage model for cemented clays. Chin. J. Geotech. Eng. 1993, 15, 21–28. (In Chinese) [Google Scholar]
  15. Jiang, M.J.; Zhang, F.G.; Sun, Y.G. An evaluation on the degradation evolutions in three constitutive models for bonded geomaterials by DEM analyses. Comput. Geotech. 2014, 57, 1–16. [Google Scholar] [CrossRef]
  16. Nemat-Nasser, S.; Okada, N. Radiographic and microscopic observation of shear bands in granular materials. Géotechnique 2001, 51, 753–765. [Google Scholar] [CrossRef]
  17. White, D.; Take, W.A.; Bolton, M.D. Soil deformation measurement using particle image velocimetry (PIV) and photogrammetry. Géotechnique 2003, 53, 619–631. [Google Scholar] [CrossRef]
  18. Andò, E.; Hall, S.A.; Viggiani, G.; Desrues, J.; Bésuelle, P. Experimental micromechanics: Grain-scale observation of sand deformation. Geotech. Lett. 2012, 2, 107–112. [Google Scholar] [CrossRef]
  19. Cundall, P.A.; Strack, O.D.L. A discrete numerical model for granular assemblies. Géotechnique 1979, 29, 47–65. [Google Scholar] [CrossRef]
  20. Wang, Y.H.; Leung, S.C. A particulate-scale investigation of cemented sand behavior. Can. Geotech. J. 2008, 45, 29–44. [Google Scholar] [CrossRef]
  21. Jiang, M.J.; Li, T.; Hu, H.J.; Thornton, C. DEM analyses of one-dimensional compression and collapse behaviour of unsaturated structural loess. Comput. Geotech. 2014, 60, 47–60. [Google Scholar] [CrossRef]
  22. Cohen, E.; Klar, A. Micromechanical modeling of the effect of dissociation on the mechanical response of hydrate-bearing sediments. Granul. Matter 2022, 24, 84. [Google Scholar] [CrossRef]
  23. Li, T.; Li, L.; Liu, J.; Zhou, H. Influence of hydrate participation on the mechanical behaviour of fine-grained sediments under one-dimensional compression: A DEM study. Granul. Matter 2022, 24, 32. [Google Scholar] [CrossRef]
  24. He, J.; Zhu, H.; Zhou, M. DEM-Based Study on the Mechanical Behaviors of Pore-Filling MHBS under Drained True Triaxial Conditions Varying the Intermediate Stress Ratio of Constant Mean Effective Stresses. Int. J. Geomech. 2022, 22, 04022132. [Google Scholar] [CrossRef]
  25. He, J.; Li, T.; Rui, Y. Geomechanical Properties of Deep-Sea Pore-Filled Methane Hydrate-Bearing Soils at Critical State Using DEM Analysis. Fractal Fract. 2023, 7, 681. [Google Scholar] [CrossRef]
  26. Thornton, C. Numerical simulations of deviatoric shear deformation of granular media. Géotechnique 2000, 50, 43–53. [Google Scholar] [CrossRef]
  27. Jiang, M.J.; Liu, J.D.; Arroyo, M. Numerical evaluation of three non-coaxial kinematic models using the distinct element method for elliptical granular materials. Int. J. Numer. Anal. Mech. Geomech. 2016, 40, 2468–2488. [Google Scholar] [CrossRef]
  28. Itasca Particle Flow Code: User’s Manual. 2014. Available online: http://www.itascacg.com (accessed on 14 February 2024).
  29. Jiang, M.J.; Shen, Z.F.; Wang, J.F. A novel three-dimensional contact model for granulates incorporating rolling and twisting resistances. Comput. Geotech. 2015, 65, 147–163. [Google Scholar] [CrossRef]
  30. Li, T.; Jiang, M.J.; Thornton, C. Three-dimensional discrete element analysis of triaxial tests and wetting tests on unsaturated compacted silt. Comput. Geotech. 2018, 97, 90–102. [Google Scholar] [CrossRef]
  31. Li, T.; Jiang, M.; Li, L. DEM Analysis of Mechanical Behavior of Unsaturated Silt under Strain-Controlled Constant Stress Ratio Compression Tests. Int. J. Geomech. 2021, 21, 04021197. [Google Scholar] [CrossRef]
  32. Potyondy, D.O.; Cundall, P.A. A bonded-particle model for rock. Int. J. Rock Mech. Min. 2004, 41, 1329–1364. [Google Scholar] [CrossRef]
  33. Li, T. Three-Dimensional DEM Simulation and Constitutive Model of Unsaturated Structural Loess. Ph.D. Thesis, Tongji University, Shanghai, China, 2017. (In Chinese). [Google Scholar]
  34. Shen, Z.F.; Jiang, M.J.; Wan, R. Numerical study of inter-particle bond failure by 3D discrete element method. Int. J. Numer. Anal. Mech. Geomech. 2016, 40, 523–545. [Google Scholar] [CrossRef]
  35. Jiang, M.J.; Konrad, J.M.; Leroueil, S. An efficient technique for generating homogeneous specimens for DEM studies. Comput. Geotech. 2003, 30, 579–597. [Google Scholar] [CrossRef]
  36. Bagi, K. Stress and strain in granular assemblies. Mech. Mater. 1996, 22, 165–177. [Google Scholar] [CrossRef]
  37. Shen, Z.J. Breakage mechanics for geological materials: An ideal brittle-elasto-plastic model. Chin. J. Geotech. Eng. 2003, 25, 253–257. (In Chinese) [Google Scholar]
  38. Hu, Z.Q. Inundation Deformation Test and Numerical Analysis on Loess Structural Model and Loess Canal. Ph.D. Thesis, Xi’an University of Technology, Xi’an, China, 2000. (In Chinese). [Google Scholar]
  39. Charles, J.A. The use of one-dimensional compression tests and elastic theory in predicting deformations of rockfill embankments. Can. Geotech. J. 1976, 13, 189–200. [Google Scholar] [CrossRef]
  40. Maccarini, M. Laboratory Studies of Weakly Bonded Artificial Soil. Ph.D. Thesis, University of London, London, UK, 1987. [Google Scholar]
  41. Callisto, L.; Rampello, S. Shear strength and small-strain stiffness of a natural clay under general stress conditions. Géotechnique 2002, 52, 547–560. [Google Scholar] [CrossRef]
Figure 1. Contact forces and moments in the local coordinate system.
Fractalfract 08 00119 g001
Figure 2. Stiffness calculation sketch of the bond contact.
Fractalfract 08 00119 g002
Figure 3. Grain size distribution of the DEM sample.
Fractalfract 08 00119 g003
Figure 4. Stress paths in the DEM simulations: (a) σ c b = 5   MPa and (b) σ c b = 25   MPa .
Fractalfract 08 00119 g004
Figure 5. Compression behavior of the samples with different bond strengths: (a) σ c b = 5   MPa and (b) σ c b = 25   MPa .
Fractalfract 08 00119 g005
Figure 6. Evolutions of the bond degradation variables in the compression tests on the DEM samples with different bond strengths: (a) σ c b = 5   MPa and (b) σ c b = 25   MPa .
Fractalfract 08 00119 g006
Figure 7. Stress–strain relationships and volume evolutions in the conventional triaxial tests on the DEM samples with different bond strengths: (a) stress–strain relationships and (b) volume evolutions.
Fractalfract 08 00119 g007
Figure 8. Evolutions of the bond degradation variables in conventional triaxial tests on the DEM samples with different bond strengths: (a) σ c b = 5   MPa and (b) σ c b = 25 MPa .
Fractalfract 08 00119 g008
Figure 9. Relationships between the bond degradation variables and the stress ratio in the conventional triaxial tests on the DEM samples with different bond strengths: (a) σ c b = 5 MPa and (b) σ c b = 25   MPa .
Fractalfract 08 00119 g009
Figure 10. Stress–strain relationships and volume evolutions in the true triaxial tests on the DEM samples with different bond strengths: (a) stress–strain relationships and (b) volume evolutions.
Fractalfract 08 00119 g010
Figure 11. Evolutions of the bond degradation variables in true triaxial tests on the DEM samples with different bond strengths: (a,b) σ c b = 5   MPa and (c,d) σ c b = 25   MPa .
Fractalfract 08 00119 g011
Figure 12. Overview of the evolution of the bond degradation variables: (a,b) variable B 0 and (c,d) variable B σ .
Fractalfract 08 00119 g012
Table 1. DEM simulation parameters.
ParametersValues
Particle
Particle density/kg·m−32710
Local damping coefficient0.7
Particle interaction
Effective modulus E * /MPa800
Normal-to-shear stiffness ratio κ * 1.5
Friction coefficient μ0.5
Shape parameter β0.21
Van der Waals force Fv/N1.6 × 10−6
Bond contact
Bond effective modulus E ¯ *     /MPa200
Bond modulus reduction factor η E 0.2
Bond normal-to-shear stiffness ratio κ ¯ * 2.0
Compressive strength of the bond material σ c b /MPa5; 25
Bond tension-to-compression strength ratio η σ 0.1
Bond radius multiplier λ b 0.35
Bond thickness threshold g c 0.1
Disclaimer/Publisher’s Note: The statements, opinions and data contained in all publications are solely those of the individual author(s) and contributor(s) and not of MDPI and/or the editor(s). MDPI and/or the editor(s) disclaim responsibility for any injury to people or property resulting from any ideas, methods, instructions or products referred to in the content.

