Article

Changes in Pore Structure and Fractal Characteristics of Solvents Pretreated High-Rank Coal under Supercritical CO2

1
School of Energy Science and Engineering, Henan Polytechnic University, Jiaozuo 454003, China
2
Institute of Environmental Geology, Hebei Coal Geology Bureau, Shijiazhuang 050091, China
3
School of Earth, Atmosphere & Environment, Monash University, Melbourne 3800, Australia
4
The Frist Institute of Resources and Environment Investigation of Henan Province, Zhengzhou 450000, China
*
Author to whom correspondence should be addressed.
Fractal Fract. 2024, 8(3), 141; https://doi.org/10.3390/fractalfract8030141
Submission received: 3 January 2024 / Revised: 17 February 2024 / Accepted: 21 February 2024 / Published: 28 February 2024
(This article belongs to the Special Issue Fractal Analysis and Its Applications in Geophysical Science)

Abstract

:
CO2 injection in coal seams, which is a significant initiative to mitigate environmental problems caused by greenhouse gases, often leads a sequence of changes in the physical properties of coal reservoirs. To look into how the pore structure changes in the process of CO2 sequestration, we selected fresh coal from Huoerxinhe coal mine in China as the object. Then, acid treatment and SC-CO2 extraction were used to dissolve Organic and inorganic components in coal. Thus, by using SEM, LTGA-N2 apparatus and XRD, the characteristics of pore parameter and fractal dimension variation were discussed. The research results show that, the APS of samples THF, HCL-HF and Y-C increase, while the total PV decreases and the pore connectivity deteriorates. The pore connectivity of Samples THF and HCL-HF is improved (THF-C, HCL-HF-C), but the total pore volume continuously reduces. In addition, solvents treatment and SC-CO2 extraction mainly act on the microporous fraction. After solvents pretreatment, the changes in the pore size distribution curves are mainly manifested in the reduction of number of micropores, especially in the micropores around 3–4 nm. There is a small increase in micropores for samples Y-C and HCL-HF-C, with the pore size mainly concentrated around 4 nm, while the pores of the sample THF-C mainly show an increase within the scope of 3–16 nm. Generally, solvent pretreatment and SC-CO2 extraction help to simplify pore structure. However, the sample HCL-HF-C shows opposite change characteristics. In a short period of time, the larger pore fractal dimension, the less beneficial it is to the flow of CO2, while pore fractal dimension becomes progressively less useful in assessing pore connectivity with increasing time.

1. Introduction

With the fast development of industrialization, the emissions of greenhouse gases, and (GHG) mainly carbon dioxide, have greatly increased, becoming the main factor affecting the global climate. To address this environmental problem, The Intergovernmental Panel on Climate Change (IPCC) suggests the employment of Carbon Capture, Utilization, and Storage (CCUS) technology to significantly reduce greenhouse gas emissions [1]. Currently, various methods for CO2 storage have been suggested, such as geological sequestration [2], oceanic sequestration [3], and mineral sequestration [4]. Out of these, sequestering CO2 in un-mineable coal seams has become a promising solution due to its multiple benefits (it enables CO2 sequestration while increasing methane recovery rates) [5].
Coal is a sedimentary rock composed of organic matter and minerals, with complex pore and fracture structures. The size and scale of pores and fractures in coal vary greatly, forming a complex and interdependent network structure [6]. Among them, pores mainly provide the storage space for fluids, including coalbed gas and water, while fractures mainly serve as channels for the fluids migration. Yu and his colleagues [7] discovered that gas adsorption in coal predominantly takes place within micropores. These micropores have an extensive internal surface area and provide locations for gas adsorption. As micropores become more developed, they create additional space for gas adsorption and increase the overall adsorption capacity. However, the transport properties of gas are predominantly influenced by the presence of mesopores and macropores [8].
On the other hand, coal is rich in organic matter and minerals. The use of organic solvents and acidic solvents can effectively dissolve the organic compounds and minerals in the coal and will influence the structure of the coal to a certain extent. Zhang et al. [9] investigated the dynamic evolution of nanoscale pores in detail on the basis of mercury intrusion measurements with four different rank coals under extraction with different solvents, and drawn that nanoscale pores in coal often exhibit a phenomenon of pore increase and expansion under solvent extraction. Wang et al. [10] stated that organic solvents can extract soluble low molecular compounds from coals, alter the pore structure of coals, and produce channels for coalbed methane adsorption and transport. Acidic solvents have been shown to improve coal pore-fracture connectivity in field tests. Turenr and Steel [11] concluded experimentally that the process of demineralization by hydrochloric acid is effective in improving pore connectivity and permeability in coal reservoirs with abundant minerals. Similarly, wang et al. [12] conducted field tests using hydrochloric acid and HF acid in the No. 3 coal seam in the southern Qinshui Basin. They observed that acid fracturing led to a significant increase in daily natural gas production up to 2400 m3.
Furthermore, supercritical CO2 (SC-CO2) becomes acidic when dissolved in water, and thus SC-CO2 can influence the pore structure through dissolving the minerals. Du and his colleagues [13] determined that the injection of SC-CO2 into coal seams leads to varying degrees of corrosion of carbonate and clay minerals in the seams. The result will be an increase in the pore volume of mesopores and macropores to some extent. Feng et al. [14] conducted experiments on different coal samples using SC-CO2/NMP (N-methyl pyrrolidone) solvent mixture and observed that some mineral components present in the coal were extracted. Masudian et al. [15] thought that SC-CO2 induced changes in organic matter and minerals in coal may lead to reversible alteration in coal microstructure. Consequently, studying the mechanism behind changes in pore and fracture structure is highly significant during CO2 injection to master the CO2 storage mechanism and migration law in coal seams.
In the laboratory, many methodologies have been developed to characterize pore size distribution (PSD), including gas adsorption [16,17,18], high-pressure mercury intrusion (MICP) [19,20], synchrotron small-angle X-ray scattering (SAXS) [21], nuclear magnetic resonance (NMR) [22,23], atomic force microscope (AFM) [24], microfocus X-ray computed tomography (X-ray CT) [25,26,27], scanning electron microscopy (SEM) [28,29], and transmission electron microscopy (TEM) [30]. Among these methodologies, it has been established that low-temperature N2 gas adsorption (LTGA-N2) analysis is a useful technique for describing the pore structure of porous medium [31,32].
In terms of theory, fractal geometry is frequently employed to depict rough and uneven geometric forms found in nature and nonlinear systems [33]. Consequently, fractal theory can aid in characterizing the intricate of coal pore structures, providing insight into the physical structure of coal surface and the intricate pore-fracture system within. Xie was the first to propose the use of fractal theory to quantitatively characterize the complex structural systems within coal rocks [34], and the selection of fractal models, scaling and geometrical parameters is the key to the application of fractal theory. The FHH and Menger models are the most widely used fractal models, and they are used to characterize nanopore and micropore fractals, respectively [35]. Liu et al. [36] investigated the fractal characteristics of the pore distribution fractal dimension (D1) and surface fractal dimension (D2) of different coal samples using LTGA-N2 and SEM methods, respectively. Meanwhile, Yao et al. [37] conducted fractal analyses of adsorption pores (pore size less than 100 nm) of different coal samples collected from China. The results showed that (D-3) better reflects the pore structure characteristics.
The pore structure of coals of different coal rank has significant differences, Wang et al. [38] found that coalification makes pore structure more complex and pore surface rougher. The current research on the pore structure of high-rank coal mainly focuses on the improvement of CBM production, while few studies on the characteristics of changes in the pore structure of high-rank coal during CO2 sequestration. Therefore, we take the low-volatile bituminous coal from Hoerxinhe Coal Mine as the research object, and the coal was subjected to secondary treatment with SC-CO2 after pre-treatment with different solvents. Subsequently, a comparative analysis was conducted on the disparities in pore structure parameters of the coal samples before and after extraction to explore the fractal characteristics of the pore structure of the high-ranking coal under the synergistic effect of different solvents and SC-CO2 by means of SEM, LTGA-N2 experiments, and X-ray diffraction, which can provide theoretical support for the optimization of CO2 sequestration in coal seams and ultimately improve the sequestration efficiency.

2. Experimental

2.1. Coal Samples

Low volatile bituminous coal samples were all taken from a fresh working face of the Hoerxinhe coal mine. Samples were wax sealed immediately after taking and transported directly to the laboratory for testing. Pre-experimental processing of the samples was divided into three parts, grinding, drying and cooling. The standard size of the coal powder by grinding is 20–60 mesh. The drying process was mainly carried out in an oven at 105 °C following the method of Solomon et al. [39]. The criterion for drying was to weigh the samples after a certain time interval and a weight change of less than 0.01% between two times. Finally, the dried coal samples were cooled for subsequent experiments. Table 1 provides statistics on the intrinsic property of the coal cores and the proximate industrial and maceral analyses. ‘Y’ indicates untreated coal, ‘HCL-HF’ indicate a coal sample successively treated with HCl and HF, ‘THF’ indicate coal treated by THF, ‘-C’ indicate samples are treated with SC-CO2.

2.2. Solvent Pretreatment

The reagents were hydrochloric acid (HCl) with a mass fraction of 20%, hydrofluoric acid (HF) with a mass fraction of 10% and tetrahydrofuran pure solvent (THF). The dried coal samples were divided into three equal portions of 250 g. One portion was used as the control group, one portion was treated first with hydrochloric acid (HCl) (mass fraction of 20%) and then with HF (mass fraction of 10%), and the last of the portions was treated with tetrahydrofuran pure solvent (THF). The ratios of sample and solvent were 1 g:10 mL, and the purity of the acids used were all analytically pure. Then the samples were thoroughly mixed with the solvent and stirred with a magnetic stirrer at 30-min intervals. After 24 h, the mixed liquids were filtered, centrifuged, washed and dried to finally obtain the solvent-treated coal samples.

2.3. SC-CO2 Extraction Experiments

The SC-CO2 extraction experimental equipment was a homemade TC120-50 supercritical extractor. The experiment was carried out in the following steps: the first step was to put 150 g of coal samples into the reaction vessel and adjust its temperature to 45 °C. The second step was to start injecting the gas. Before injection, a booster pump was used to turn the CO2 into a supercritical state. Finally, the pressure was kept constant at 10 MPa and the temperature was kept constant at 45 °C.

2.4. LTGA-N2 Tests

The LTGA-N2 experiment was carried out using the principle of physical adsorption and capillary condensation of nitrogen on a solid surface under saturated temperature standard. LTGA-N2 measurements were carried out using a TriStar II 3020 automated specific surface area (SSA) and porosity analyzer. Liquid nitrogen was used as the adsorbing medium for experiments at −196 °C. Approximately 1.5 g coal sample was automatically degassed in vacuum at 110 °C for 12 h. Finally, Brunauer-Emmett-Teller (BET) multimolecular layer adsorption, density functional theory (DFT) and Barret-Joyner-Halenda (BJH) models were used to characterize SSA and PV.

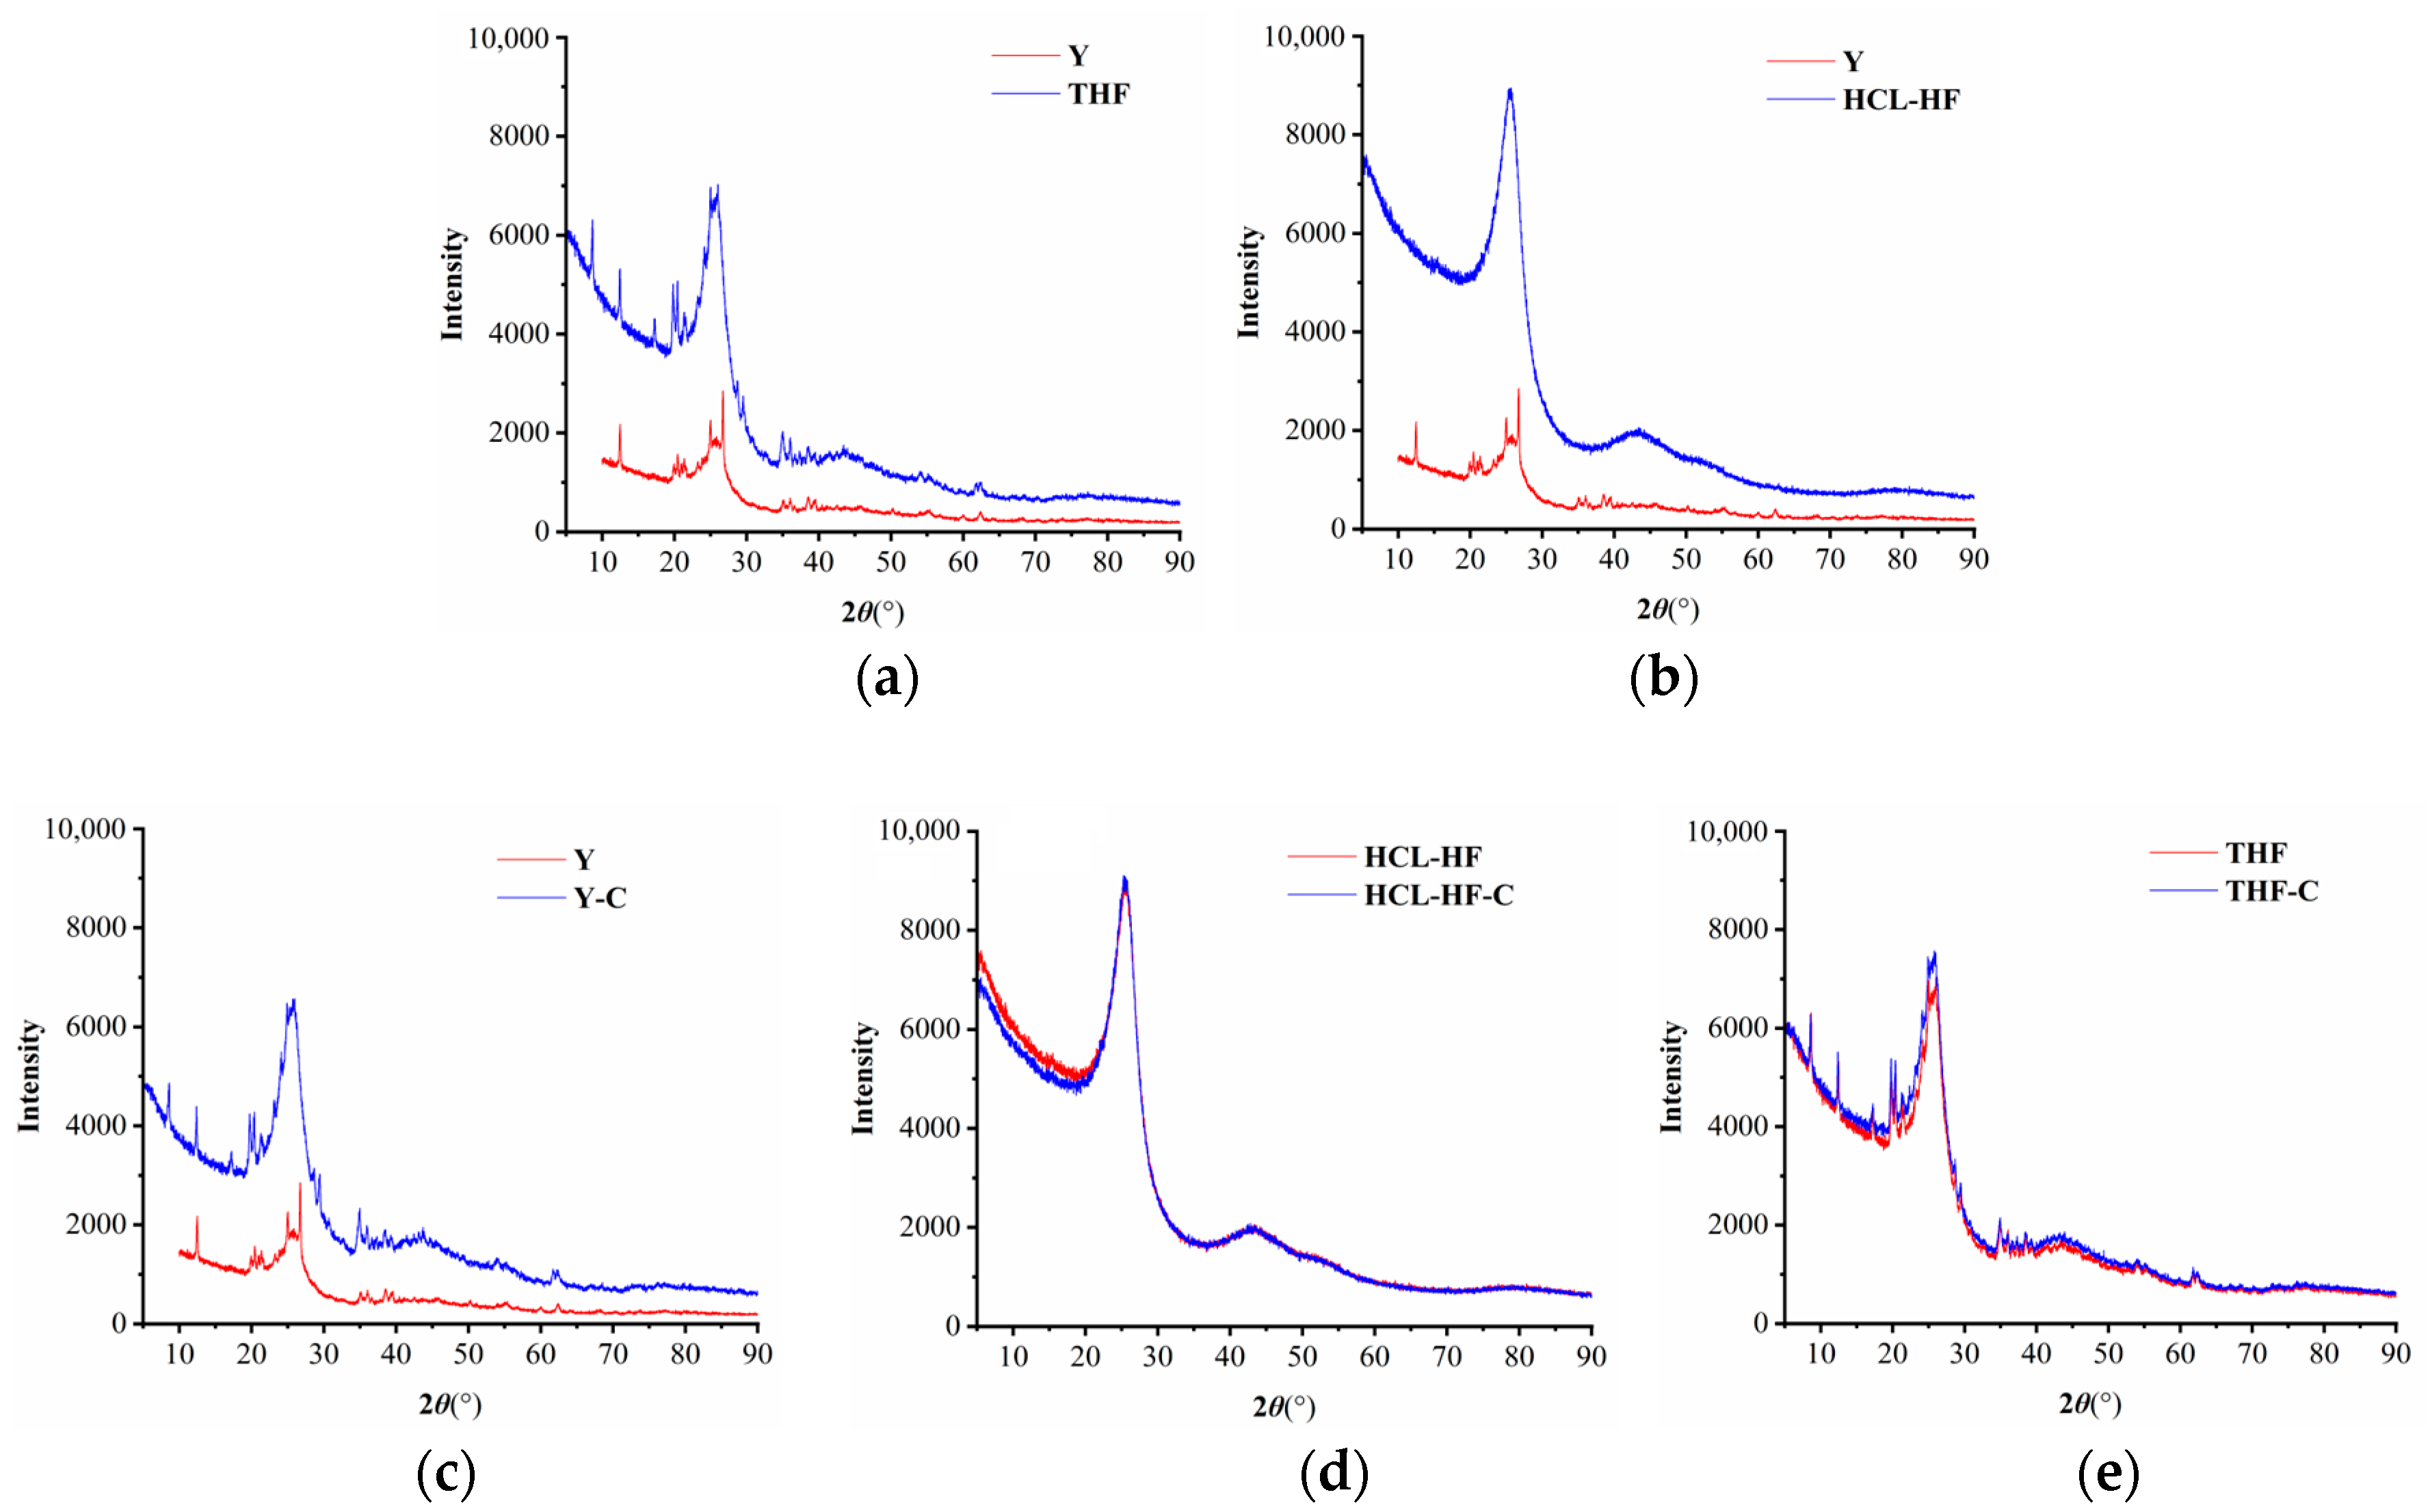
2.5. X-ray Diffraction Experiment

The tests were conducted using the Bruker Smart Lab-SEX Advance XRD produced by Rigaku Japan. The instrument parameters are set as follows: Cu target, Kα radiation, test voltage 40 kV, test current 40 mA, continuous scanning mode, scanning speed 2 r/min, angular test range 0°~90°. The coal samples and their experimental residues were not demineralized and were used in amounts of 5 ± 0.5 g in each test.

3. Results and Discussion

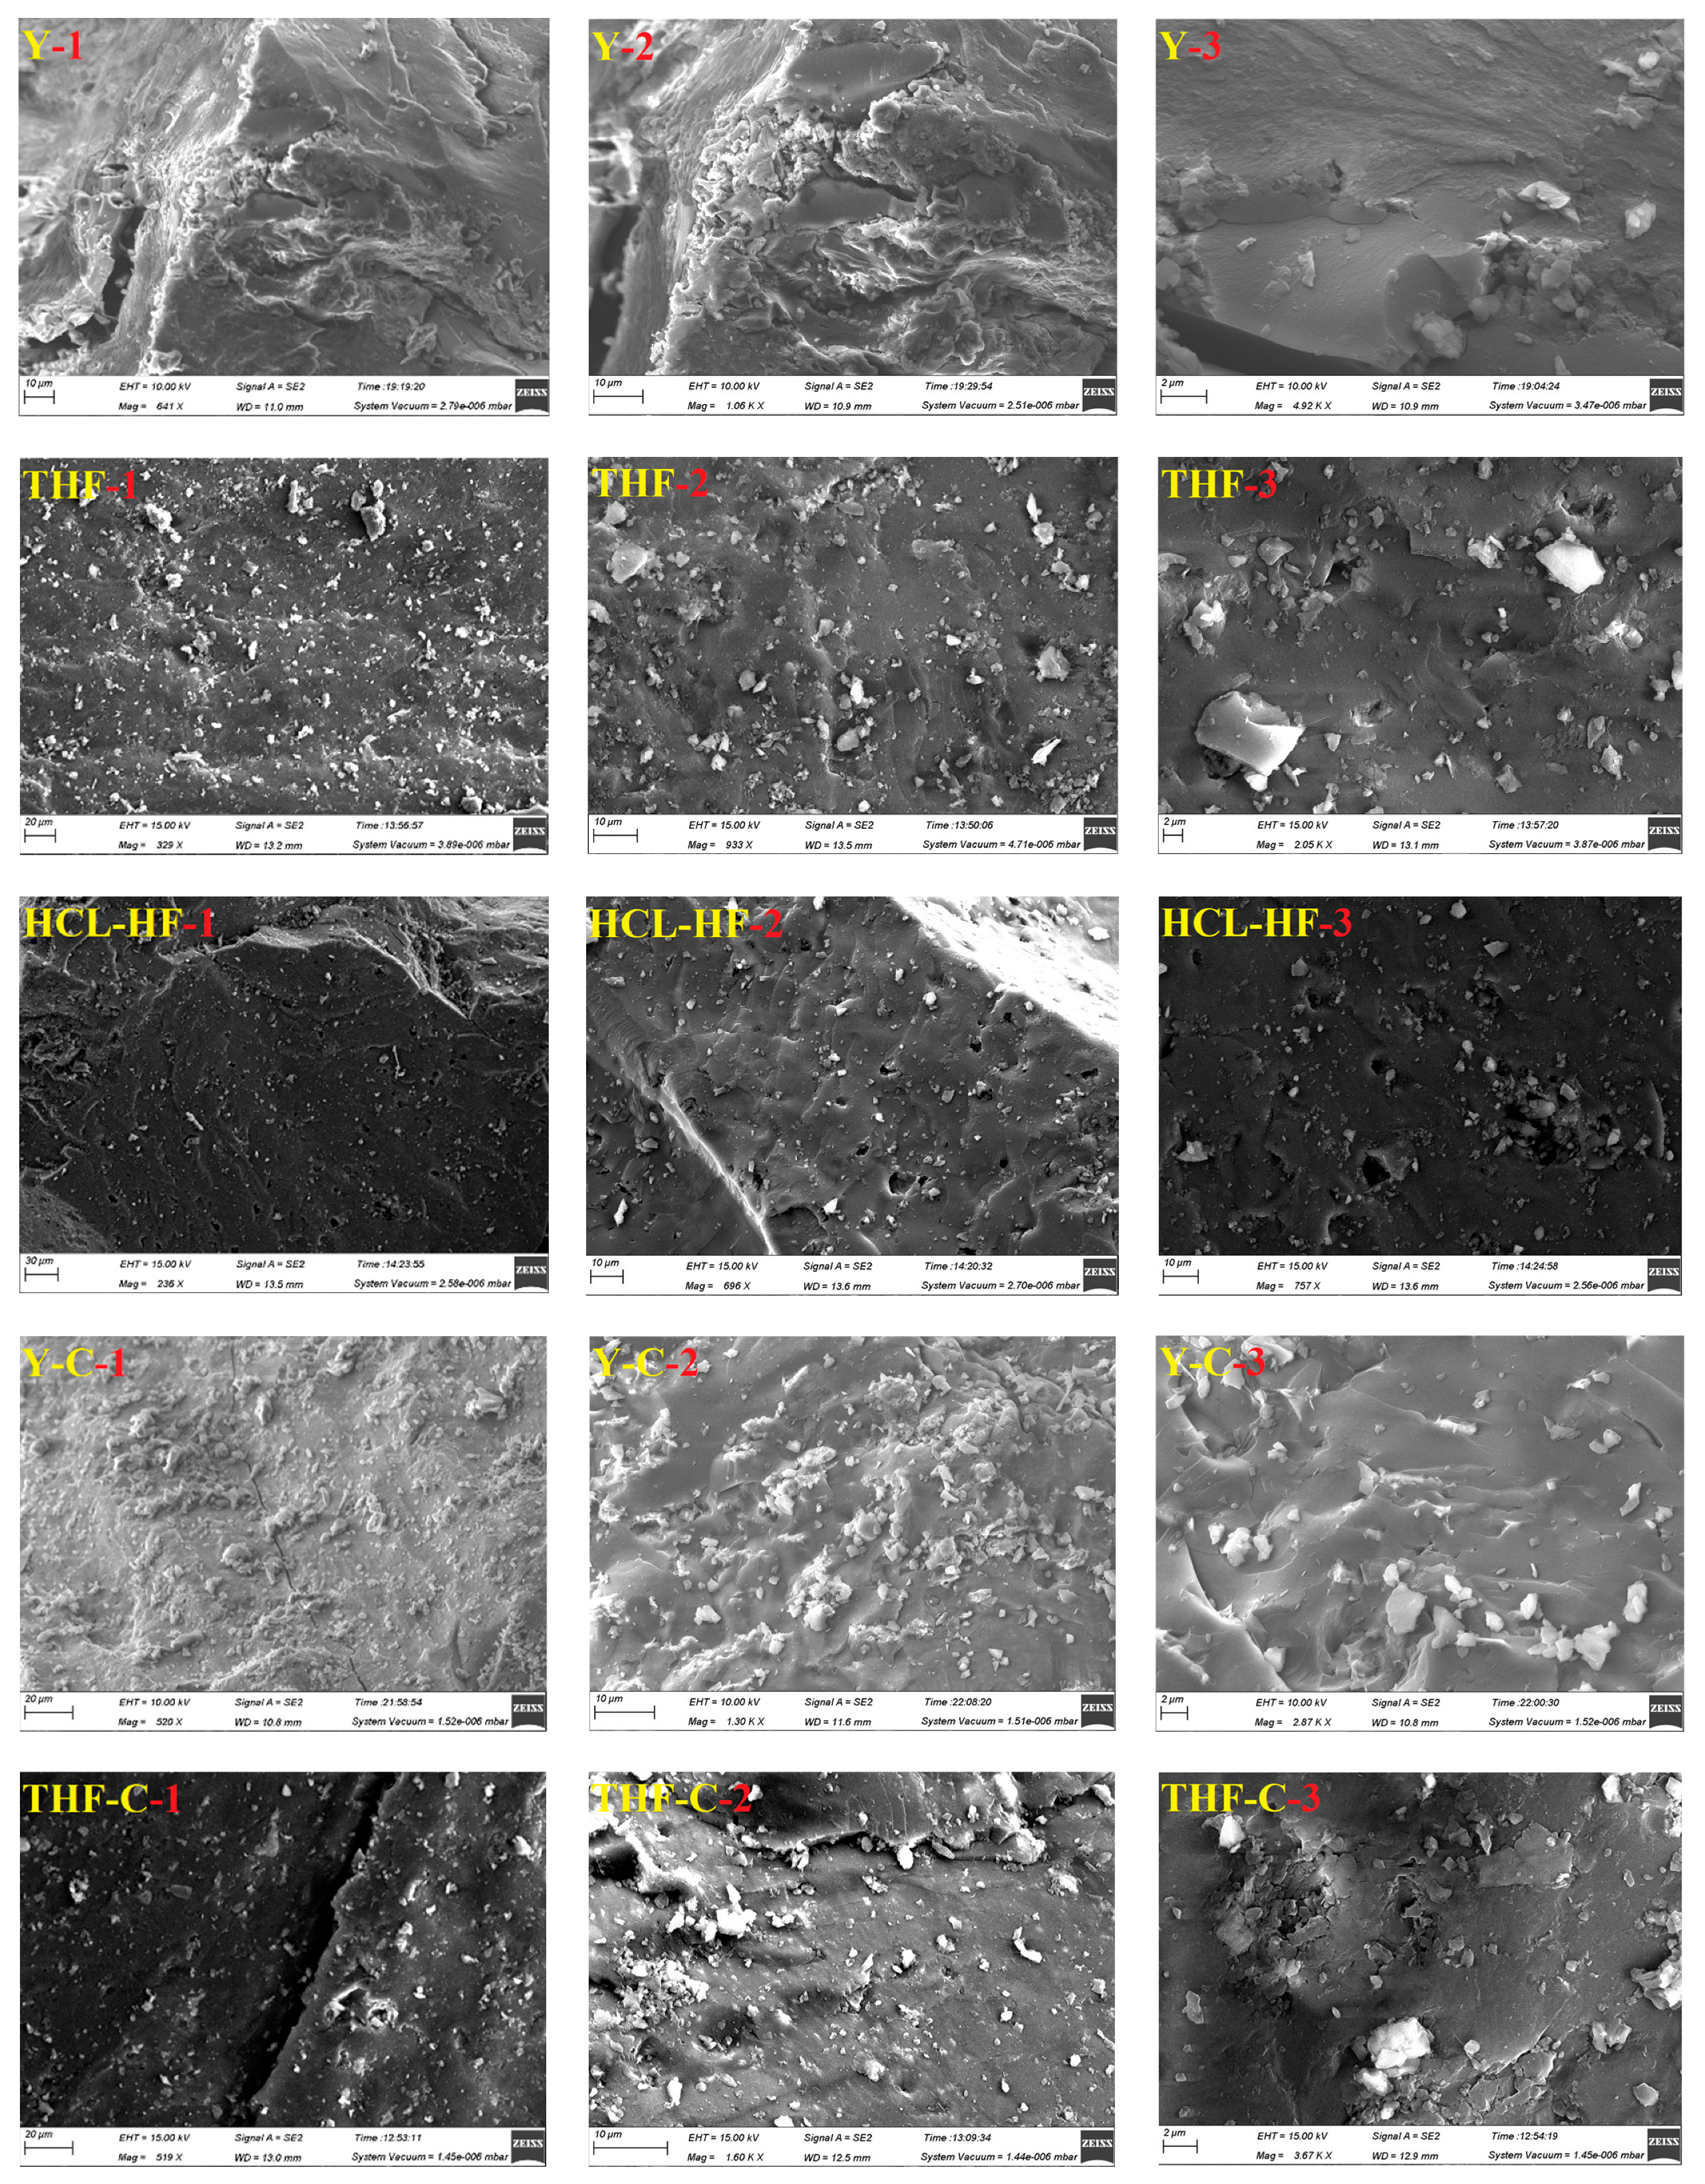
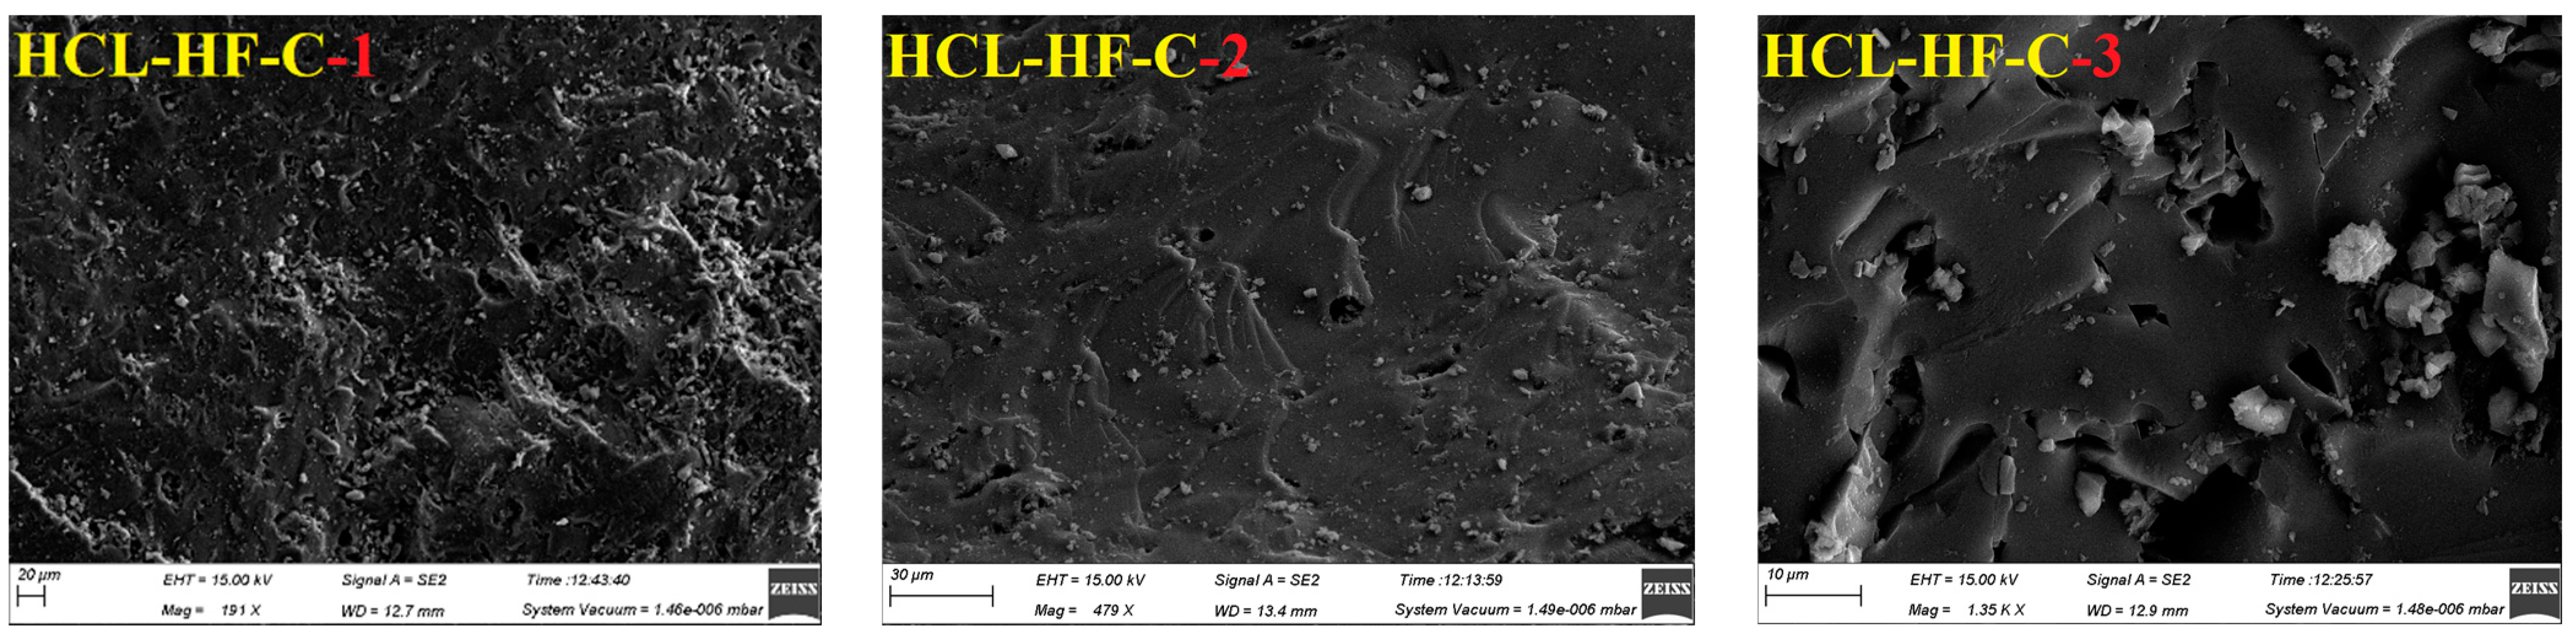
3.1. Surface Morphology of Coal Samples

From the SEM images (Figure 1), it can be seen that there are mainly some nanoscale and microscale pores and fractures, including some mineral intergranular pores and micro-fractures (Figure 1(Y-1,Y-2)), and the surface is relatively smooth (Figure 1(Y-3)). After THF solvent extraction, the surface structure becomes loose and no longer smooth (Figure 1(THF-1,THF-2)), and a small number of dissolution pores (Figure 1(THF-3)) have been appeared. A large amount of mineral particles mineral particles are attached to the surface which have a tendency to fall off, which is due to the fact that THF is an organic solvent and cannot dissolve the minerals. Evidently, the minerals on the surface of the sample HCL-HF are obviously reduced after the treatment of HCl and HF solvent, and a large number of dissolution pores appear (Figure 1(THF-2)). This indicates that carbonate minerals and silicate minerals in coal can be effectively removed by acid solvents.
We can know that the surface states of samples Y-C and THF are similar (THF-2, Y-C-2) after the action of SC-CO2. This is due to the fact that SC-CO2 also has an extractive effect, it can make the surface of coal become rough (HCL-HF-1, HCL-HF-C-1). At the same time, since SC-CO2 penetrates into the coal during its action and is able to dissolve the carbonate minerals, the minerals on the surface of the solvent-pretreated samples further appeared to be reduced after the action of SC-CO2 (THF-1, THF-C-1) (HCL-HF-2, HCL-HF-C-2).

3.2. Pore Structure Characteristics

3.2.1. N2 Adsorption Isotherms of Coal

Figure 2 is N2 adsorption/desorption curves of different coal samples, which symbolically describe the pore shape and pore connectivity. In the figure, all of the samples show a “hysteresis loops” of different shapes and sizes.
LTGA-N2 adsorption and desorption curves in the Figure 2 can be roughly divided into three types; (1) Taking the sample Y as a representative, the hysteresis loop is obvious and relatively smooth. According to the International Union of Pure and Applied Chemistry (IUPAC) classification standard of hysteresis loop, it can be seen that the hysteresis loop characteristic reflects that the pore morphology is mainly a well-connected flat plate pore. However, the unclosed hysteresis loop in coal sample Y may be due to the high micropore content in anthracite, which leads to an adsorption swelling phenomenon. (2) Taking the two samples THF and HCL-HF as representative. the adsorption and desorption curves are close to each other. This is due to the fact that the pores are mainly wedge-shaped and slit-shaped with poor connectivity. (3) Taking the samples Y-C, THF-C and HCL-HF-C as representative, the desorption curves of the type present a short-term decrease around P/P0 = 0.5, which is mainly due to the decreases of P/P0 near this point; less adsorbate can desorb due to delayed condensation caused by the pore plugging effect [33]. According to the Kelvin equation, the pore size is 4.0 nm when P/P0 is 0.5. This shows that after SC-CO2 extraction, the pores with pore size greater than 4.0 nm appear the ink-bottle type.
On the other hand, the comparison indicates the hysteresis loop of sample Y decreased after different pretreatment, which suggests that the pore connectivity of raw coal deteriorated. This may be due to the plugging phenomenon of minerals retained in the pore throat. After SC-CO2 extraction, the hysteresis loop of samples THF-C and HCL-HF-C have become larger than that of samples THF and HCL-HF, it stated that SC-CO2 extraction had the effect of expanding the pores of coal and improved its connectivity to a certain extent. Nevertheless, the plugging of minerals during extraction has to be taken into account, which affected the pore connectivity improvement effect of the extraction (Y and Y-C).

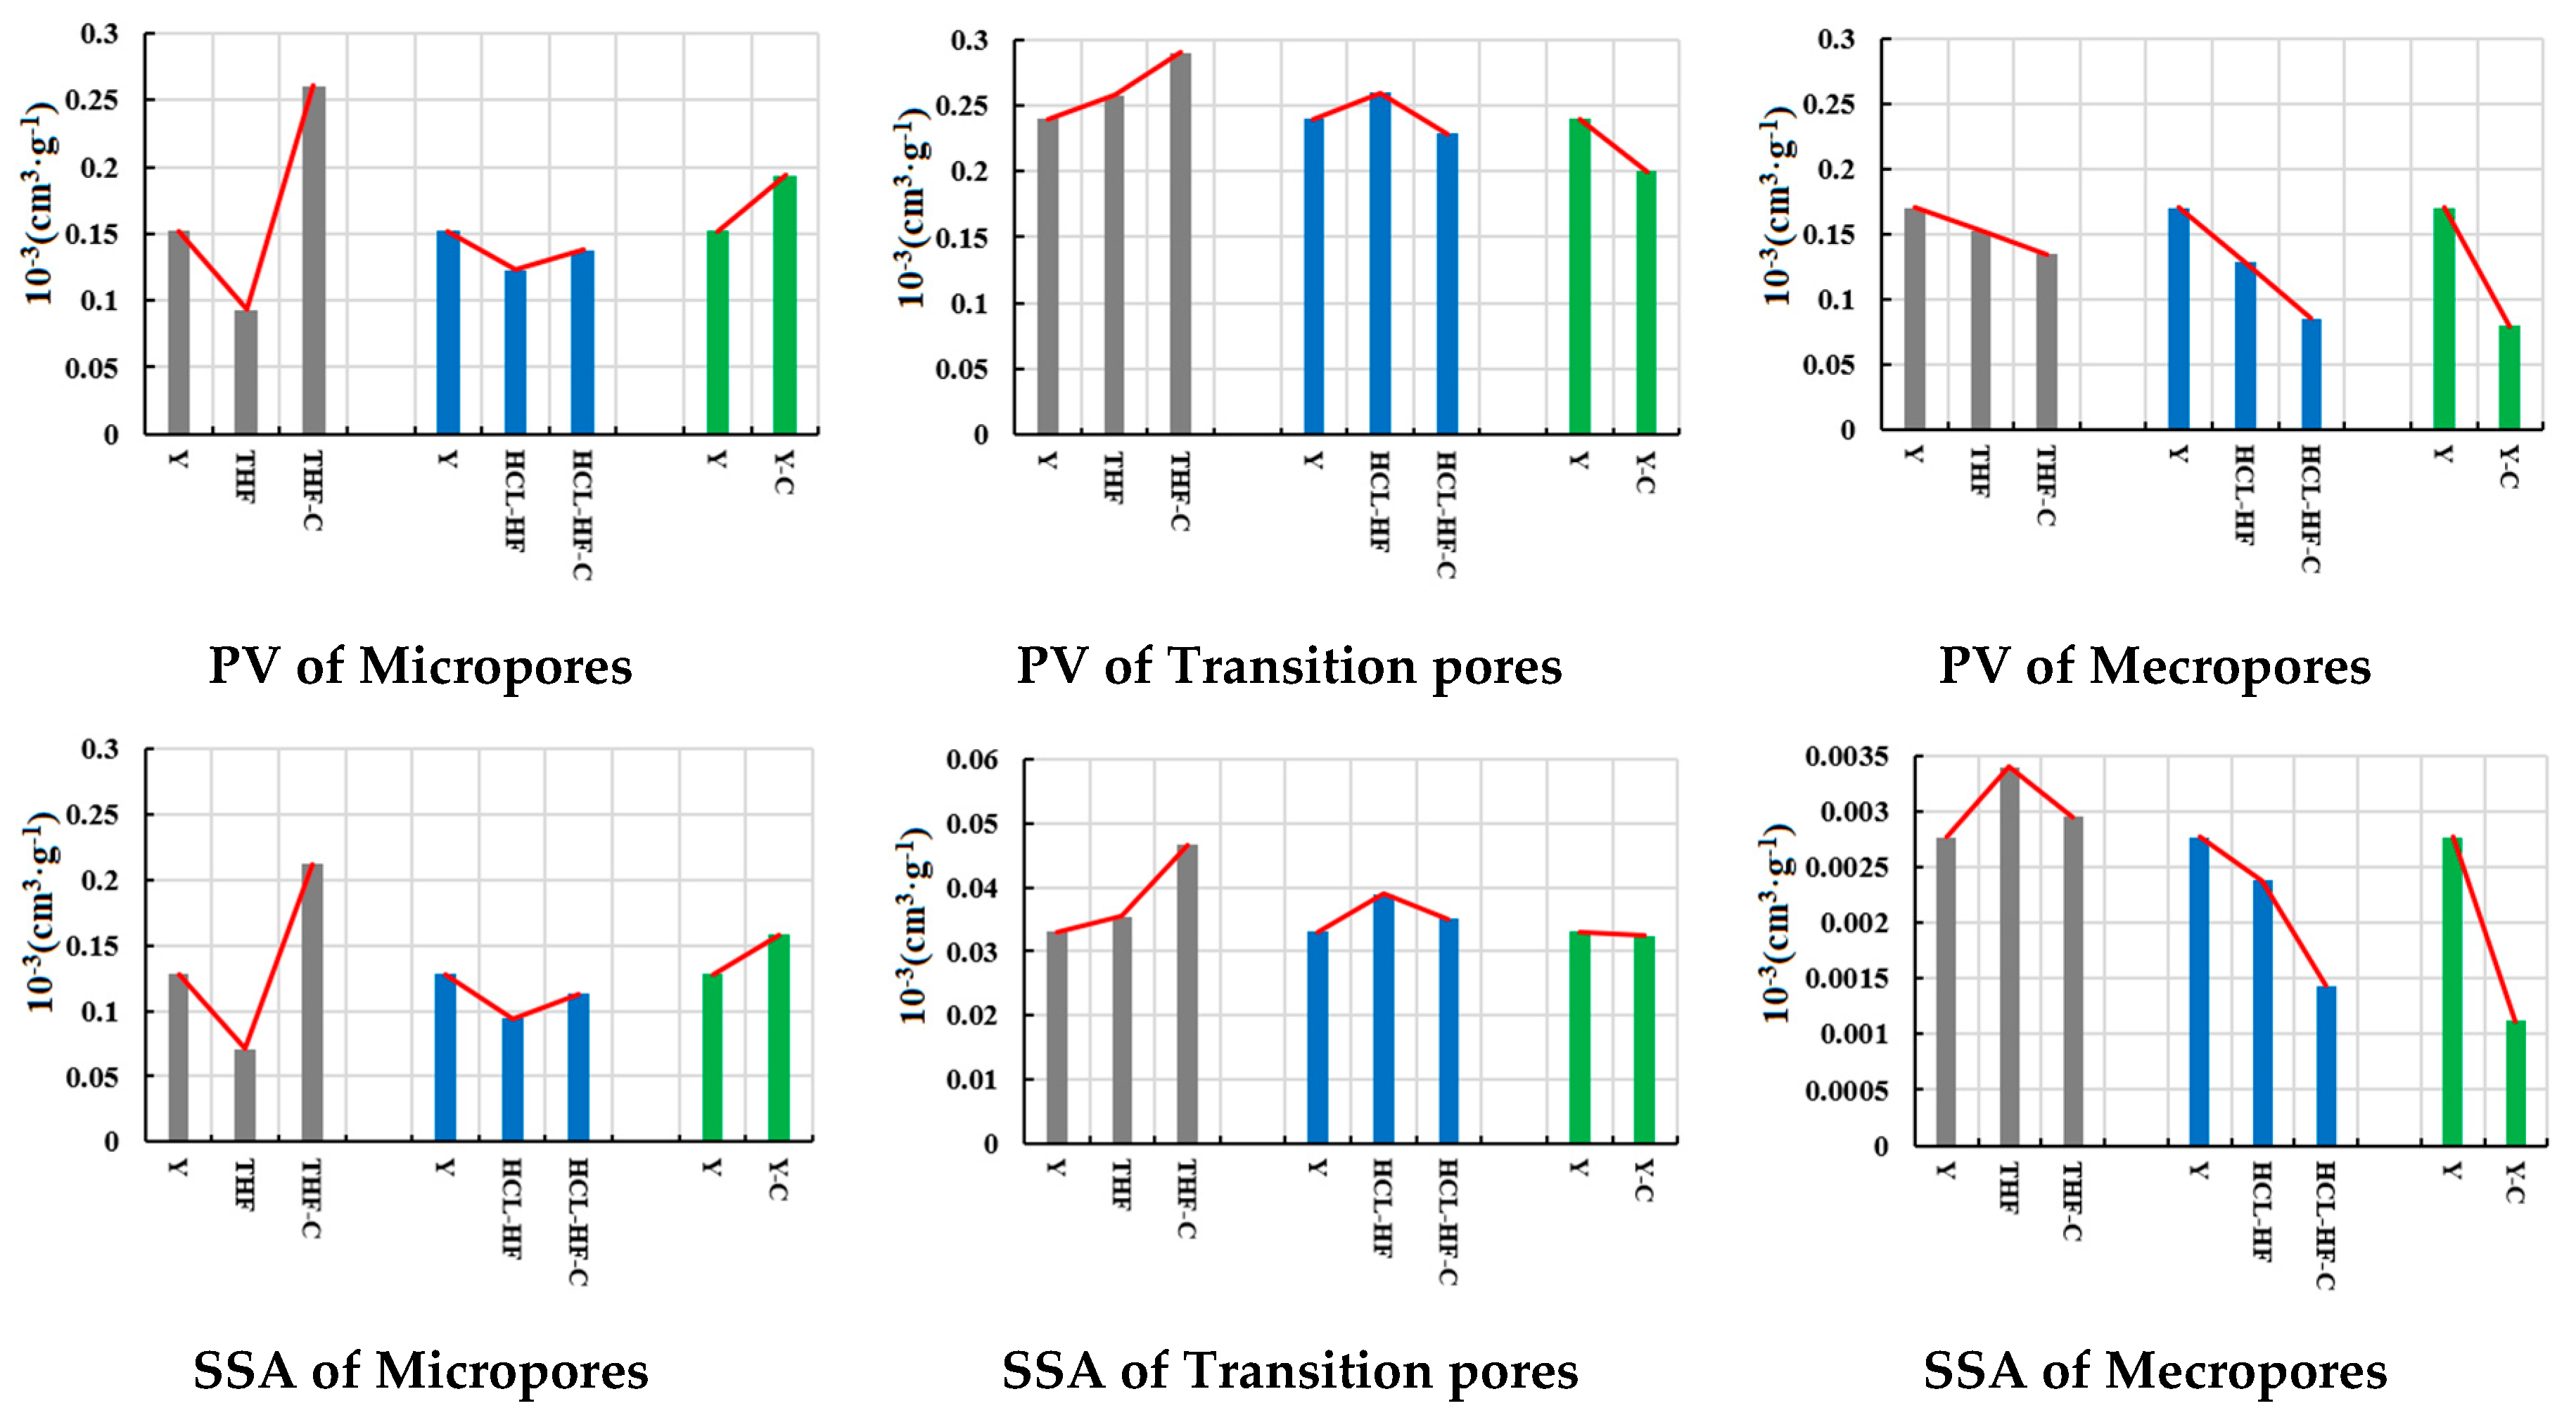
3.2.2. Pore Structure Parameters

During the last few years, many researchers have proposed pore classification criteria based on these parameters [40,41]. Liu et al. [36] analyzed the relationship between fractal dimension and gas adsorption through relevant experimental tests and classified the pores in coal into four types according to different sizes: micropores (<10 nm), transition pores (10–100 nm), mecropores (100–1000 nm), and macropores (>1000 nm). In this paper, Liu and Nie’s method will be used to categorize the pore size.
Table 2 shows the results of SSA (pore specific surface area) and PV (pore volume) of nanoscale pores in the coal samples. Overall, we can find that the average pore size of the other samples has increased in comparison to coal sample Y. The largest increase in average pore size is about 85% after pretreatment (THF). The PV in total and SSA in total of samples THF and HCL-HF were lower than those of sample Y. following solvent pretreatment. The PV of samples Y, THF, and HCL-HF did not exhibit consistent pattern of change after SC-CO2 extraction, but the BET-SSA increased in all of them, suggesting that the SC-CO2 extraction possibility can increase the number of micropores. The pore sizes were further divided into different ranges, and the BET-SSA and PV data of the samples in different pore size ranges can be seen in Table 2.
Pore size < 10 nm: SSA and PV of pores in this range have a consistent pattern of change (Figure 3). The pretreatment of the solvent will lead to a significant decrease of SSA and PV in the raw coal, and then appeared to increase after SC-CO2 extraction. This result means that the pretreatment of solvent will reduce the number of micropores, while SC-CO2 extraction in turn increases the number of micropores.
Pore size in the range of 10–100 nm: the change in PV and SSA are also consistent for pore sizes in this range. The SSA and PV of all samples with pore sizes in this range increased to some extent following solvent pretreatment. For sample THF, the PV and SSA further increased after SC-CO2 extraction (THF-C in Figure 3), while the PV and SSA of samples Y and HCL-HF show the opposite pattern of change (Y-C, HCL-HF-C in Figure 3).
Pore size > 100 nm: the change of PV and SSA of sample THF no longer have consistency, and the PV decreases while the SSA increases compared with sample Y. In addition, the PV and SSA of sample Y decreased continuously after the treatment with acidic solvent (HCL-HF in Figure 3) and SC-CO2 extraction in turn (HCL-HF-C in Figure 3). Generally speaking, in this pore size range, SC-CO2 extraction cause a decrease in the number of pores in all samples.
Based on Table 2, THF solvent has the most significant effect on expanding pore space, with the average pore size (APS) increasing from 8.309 to 15.363 nm in sample Y (sample THF in Table 2). While the effect of acidic solvents (HCl, HF) is comparatively weaker in contrast, the APS increases from 8.309 to 11.630 nm (sample HCL-HF in Table 2). According to Figure 3, the increase in PV caused by pretreatment in the samples is mainly dominated by transition pores. Actually, the adsorption pores in the coals are mainly dominated by micropores with a pore diameter < 10 nm. Combined with the fact that total PV and SSA of the coal samples THF and HCL-HF are lower than Y, it can be concluded that the solvent pretreatment mainly promotes the conversion of micropores to transition pores, thus leading to an increase in a number of transition pores while a decrease in total PV and SSA.
The APS of the samples shows different changes after SC-CO2 extraction. Wherein, the APS of samples Y and HCL-HF increased, with the sample HCL-HF showing the highest increase, i.e., from 11.63 nm to 16.099 nm (HCL-HF and HCL-HF-C in Table 2). As for the results of sample THF, SC-CO2 extraction increases the number of micropores, leading to a decrease in the APS of the sample (THF and THF-C in Table 2).

3.2.3. Pore Size Distribution in Coal

The distribution curves of pore size show complex fluctuations in Figure 4. They reflect the inhomogeneity of PSD. The PSD curves have some changes after pretreatment and supercritical CO2 extraction, mainly in the microporous part below 10 nm, especially around 4 nm, which indicates that the pretreatment and supercritical CO2 extraction mainly control the microporous part.
The changes in the PSD curves of the coal samples are mainly manifested in the reduction of micropores after solvents pretreatment, especially in the micropores around 3–4 nm. The reduction of number of micropores in coal samples caused by acid treatment is mainly the result of minerals removed from coal, while THF treatment prompts the dissolution of low molecular weight compound, which resulted in loosening of the macromolecular skeleton of coal and the increase of pore size. Both methods resulted in a more uniform PSD of micropores below 10 nm, while that of transition pores and mesopores above 10 nm remained basically unchanged.
There is a small increase in the number of micropores appeared in the samples Y-C and HCL-HF-C after SC-CO2 extraction, with the pore size mainly concentrated around 4 nm, while the pores number of the sample THF-C mainly shows an increase around 3–16 nm, the increase in micropores around 4 nm is the most significant. The supercritical CO2 effect caused an increase in the discontinuity of the PSD of the micropores below 10 nm, while the fluctuation of the PSD curves of transition pores and mesopores above 10 nm tended to be smoother and the distribution was more uniform.

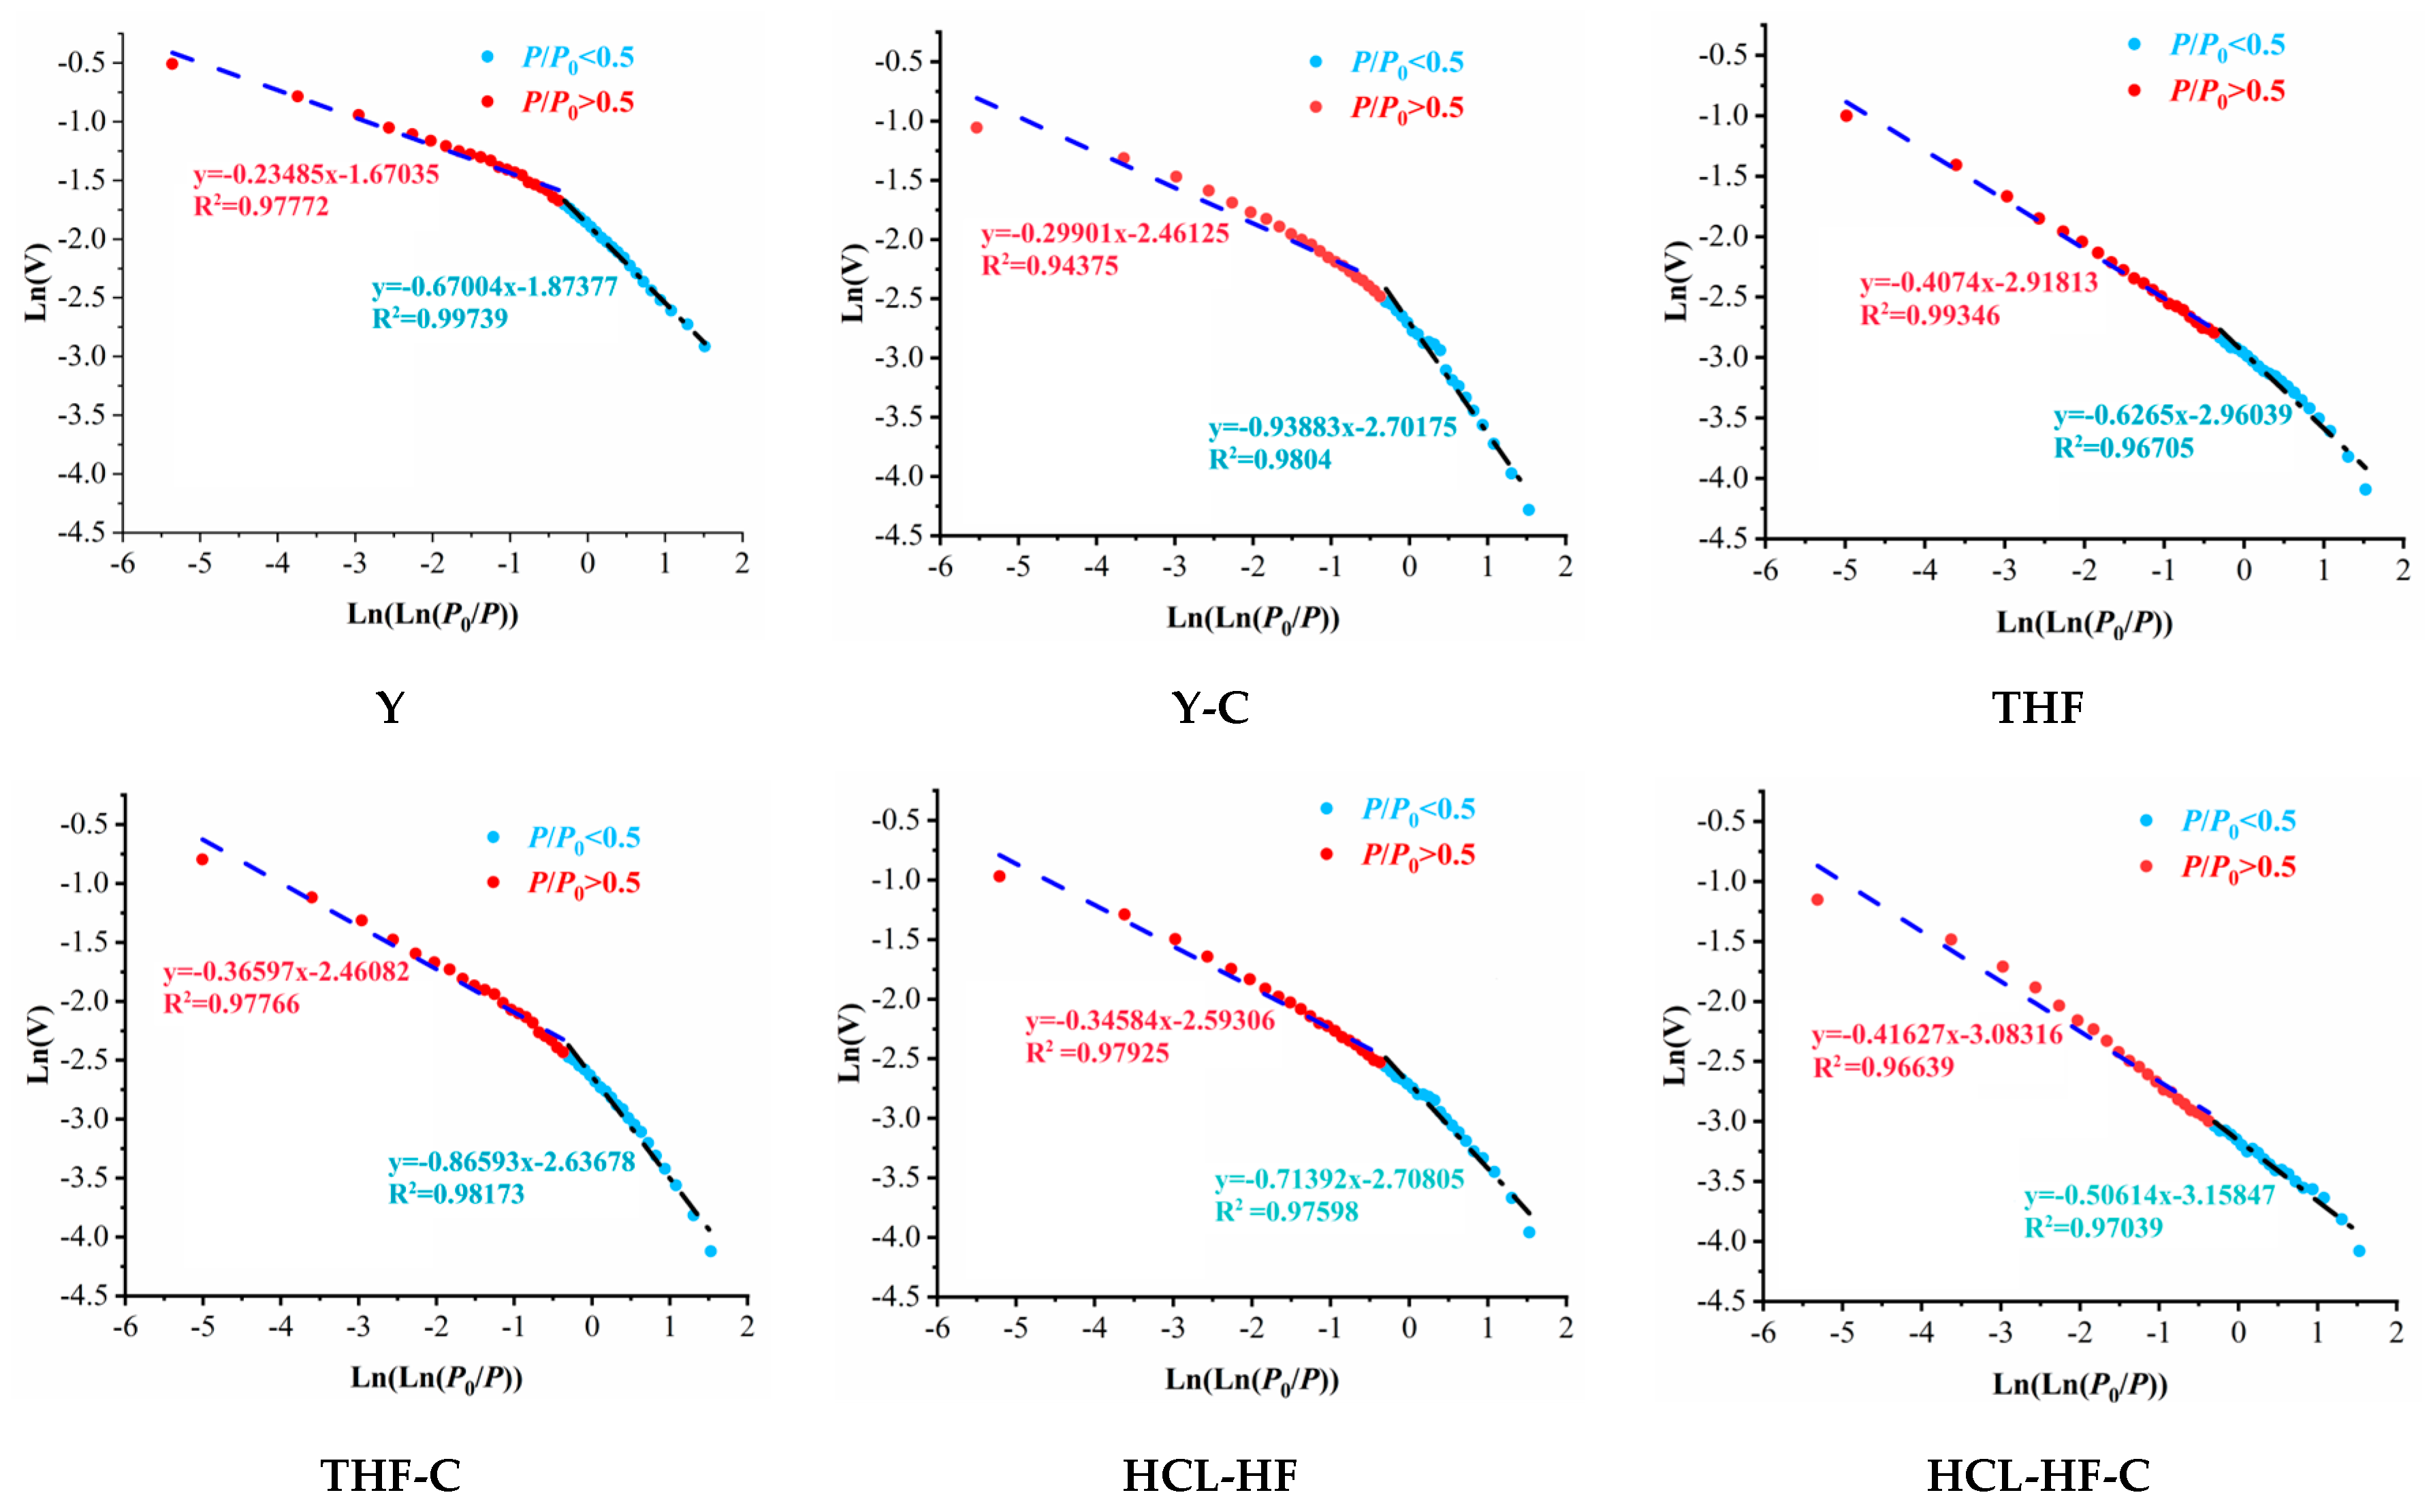
3.2.4. Fractal Characteristics of Nanopores

Coal is a non-homogeneous and highly anisotropic porous medium, the fractal dimension can precisely and quantitatively depict its pore structure. Based on the results of LTGA-N2 experiments, there are many methods to calculate the fractal dimension of adsorption pores, such as the BET model, thermodynamic model and Frenkel-Halsey-Hill (FHH) model, among which the FHH model is a computational model that is applied by scholars at home and abroad [42].
Xie [43] concluded that the FHH model has good applicability for calculating the fractal dimension of pores in cryogenic liquid nitrogen test results through the fractal dimension fitting results of the previous authors. In this study, thus, the (FHH) model was used to express the pore structure characteristics of coal. The relationship between the relative equilibrium pressure, the fractal dimension, and the pore adsorption capacity measured by LTGA-N2 test is as follows [44]:
V = V 0 l n P 0 P K
Taking logarithms on each side of the equation, we can obtain the following formula:
l n V = K l n l n P 0 P + C
where V is the gas adsorption capacity at equilibrium pressure, mL; P the adsorption equilibrium pressure, MPa; P0 the adsorption saturated vapor pressure, MPa; K the fractal dimension factor, i.e., the linear slope of l n V and ln(ln(P0/P)); and C the constant.
The fractal dimension (D) of coal pore structure can be calculated by K value. Different scholars have proposed two different calculation methods based on different adsorption theories [36,45,46]. One viewpoint is that the adsorption of N2 by coal is monolayer adsorption, which is controlled by the van der Waals (VDW) force between the adsorbent and adsorbate, i.e., the interface between gas and solid. The calculation equation of calculating D through K is:
D = 3K + 3
Another viewpoint is that the VDW force between the interface is negligible relative to the surface tension, and the adsorption of nitrogen by coal is mainly controlled by the capillary cohesion effect, in which case the calculation equation of D calculated by K is:
D = K + 3
Generally, the fractal dimension of pore structure is between 2 and 3, and the result calculated by Equation (3) has been separated from the meaning of fractal. Therefore, we used Equation (4) to calculate D.
From Figure 2, the desorption curve exhibits a “falling inflection point” at a P/P0 of 0.5. Consequently, when calculating D, a P/P0 of 0.5 was utilized as the critical point (the pore size is typically 4 nm). D1 (Pore surface roughness) denotes the fractal dimension when P/P0 > 0.5 and D2 (Pore space complexity) denotes the fractal dimension when P/P0 < 0.5.
Plotting with ln(ln(P0/P)) as the horizontal coordinate and lnV as the vertical coordinate, and then fit the data points. The results shown in Figure 5 indicate that the fitting coefficients R2 of all the samples are larger than 0.95, which indicates that the fitting results are better and the pores in the coal have significant fractal characteristics. The results of the fractal dimension calculation were counted into Table 3, and it can be seen that the value of D (D1, D2) is between 2.41726 and 2.77792 (Table 3), which indicates that the calculation results are consistent with the FHH model (D = 2~3). Among them, the larger values of the fractal dimension means that the pore structure is more complex [47].
Table 3 and Figure 5 indicate that the values of D2 and D1 are 2.68124 and 2.87441 for sample Y, and the values of that are larger than the samples THF and HCL-HF respectively, it shows that the effect of pretreatment has contributed to the simplification of the coal pore structure.
After SC-CO2 extraction of the sample Y and the pretreated coal samples respectively, the values of D2 and D1 of the sample Y-C are 2.14177 and 2.80515, that of the coal sample THF-C are 2.09398 and 2.74053. The comparison of the before and after shows that the value of D2 and D1 of the sample Y are reduced, So SC-CO2 extraction can simplify the pore structure. But on the contrary, the value of D2 and D1 are 2.34605 and 2.744 for the coal sample HCL-HF-C, the pore structure of the sample HCL-HF instead becomes more complex by the SC-CO2 extraction. For sample THF, D1 decreased and D2 increased after SC-CO2 extraction, suggesting that the pore surface roughness increased while the pore structure tended to be simple.

3.3. Microcrystalline Structure

XRD testing of all coal samples using the same test conditions. The test data of the coal samples are made into XRD spectra by MDI Jade 6.0, and Figure 6 is the diffraction spectra of the coal samples.
From Figure 6, it can be seen that the coal samples all have diffraction peaks with different intensities when 2θ is near 25° and 45°, which are called the 002 peak and 101 peak, respectively. The low-volatile bituminous coal belongs to the coal with high metamorphic degree, and all the coal samples have sharp 002 peak. It can be seen that the trends of the spectral curves and the positions of the broad diffraction peaks of the coal samples are basically the same. All of them have obvious 002 peaks, while the 101 peaks are relatively weaker and the positions of the peaks do not change much. This suggests that there is no obvious change in the basic unit of aromatic carbon before and after treatment.

3.4. Mechanism of Solvent and SC-CO2 Extraction on the Pore Structure of Coal

Figure 2 illustrates that the hysteresis loops of all samples are relatively wide at around P/P0 = 0.5 (the pore size is typically 4 nm). This suggests that pore connectivity is mainly contributed by the microporous fraction. Consequently, Table 4 shows a smaller division of the microporous fraction with a 4 nm as the limit. The mechanisms of different solvents and SC-CO2 effects on coal pore structure are discussed separately.

3.4.1. Acid Solvent

There are silicate minerals dominated by quartz and kaolinite and carbonate minerals dominated by CaCO3 in the low-volatile bituminous coal According to the XRD physical phase analysis and SEM energy spectrum analysis. It can be seen in Figure 6 that the mineral peaks disappeared and the curves became smoother after acid solvent treatment, which indicates that the hydrochloric acid solvent can effectively dissolve the carbonate minerals and the HF acid solvent can dissolve the silicate minerals in the coal. The HCL and HF solvents used simultaneously on the coal samples to remove the minerals in the coal. The data on the variation of ash in the ultimate and proximate analysis in Table 1 indicates that the ash removal rate in sample HCL-HF reached 96.5%. This suggests that the vast majority of the minerals and some inorganic salts in the coal were removed, and the following chemical reactions mainly occurred:
           Al2O3·2SiO2·2H2O (kaolinite) + 6HCl = 2AlCl3 + 2SiO2 + 5H2O
SiO2 (quartz) + 6HF = H2SiF6 + 2H2O
     CaCO3 (calcite) + HCl = CaCl2 + CO2↑ + H2O
Based on relevant charts (Figure 2, Table 2 and Table 4), the connectivity of coal sample deteriorated (HCL-HF) after treatment with acid solvents, decreased PV of micropores and mesopores while increased transition pores. Furthermore, the total PV and total SSA decreased. This is mainly due to two reasons:
(1) The HCl acid and HF acid are highly acidic and can dissolve silicate and carbonate minerals, but do not completely dissolve aluminosilicate minerals [48,49]. This results in undissolved kaolinite particles loosening, and then clogging the pore throat during transport, leading to reduced pore connectivity. (2) It was mentioned earlier that acid solutions are able to dissolve minerals, the minerals become smaller particles when they are dissolved. Then the particles are transported through the pore channels and then reabsorbed into the surface and pores of the coal due to the Brownian movement and the electrostatic interaction [50,51].

3.4.2. THF Solvent

Coal contains a large number of soluble low molecular weight compounds, which can be extracted by THF solvent according to the principle of organic mutual solubility. As these compounds are extracted, the pore connectivity is effectively improved, thus promoting gas adsorption and transport.
From Figure 2 and Table 2, the trend of pore parameter changes of coal sample THF is the same as that of HCL-HF and the hysteresis loops are very similar. Further through Figure 4 and Table 4, the reduction of the microporous part of the sample THF and HCL-HF is mainly below 4 nm compared with the coal sample Y, with 3.5–4 nm dominating. Again, it can be surmised that this is due to the blockage of the pore throat by low molecular compounds in the micropores during the THF extraction process, resulting in a decrease in the number of open pores and poor connectivity.

3.4.3. SC-CO2

SC-CO2 can dissolve both organic low molecular compounds and a part of inorganic minerals in coal due to its special properties. The reaction formula for dissolving minerals is:
CO2 + H2O ⇋ H2CO3 ⇋ H+ + HCO−3
CaCO3 + 2H+ = Ca2+ + CO2↑ + H2O
           Al2O3·2SiO2·2H2O (kaolinite) + 6H+ = 2Al3+ + 2SiO2 + 5H2O
The hysteresis loops of coal samples Y and Y-C show that the microporous PV and total SSA increased while the pore connectivity decreased instead after supercritical CO2 extraction. On the one hand, parts of the minerals were dissolved due to the poor solubility of SC-CO2 in a short time, resulting in the addition of new micropores and an increase in the number of micropores and the SSA. On the other hand, the pore plugging phenomenon of mineral particles and low molecular compounds leads to the reduction of transition and mesopore pore volume, and a subsequent decrease in the total PV.
The micropore PV and SSA of coal sample THF increased after SC-CO2 extraction, and the pore connectivity became better. The transition pores PV and the total PV increased, which indicates that CO2 could further dissolve the low molecular compounds and unclog the pores, At the same time, CO2 could also dissolve part of the minerals, which had a pore-expanding effect.
The PV of the micropores increased and the pore connectivity was improved of the sample HCL-HF after SC-CO2 extraction. However, the transition pores and mesopores and the total PV decreased, which may be due to the fact that SC-CO2 is able to carry low molecular compounds out of the micropores, lead to an increase in the PV of micropores. On the other hand, the residual mineral particles after HCL and HF solvent treatment were carried into the transition pores and mesopores by SC-CO2 fluid, resulting in the decrease of transition pores and mesopores PV. This is also the reason for the increase of pore surface complexity (D1) of sample HCL-HF-C in Table 3.

3.5. Relationship between Fractal Dimension and Pore Structure Parameters and Implications for Geological Sequestration of CO2

Figure 7 demonstrates the relationship between pore structure parameters and fractal dimension for different pore size segments. There is no obvious linear or nonlinear relationship between PV, SSA and fractal dimension. It is generally believed that the more homogeneous the pore structure is, the easier it is for mineral particles to flow out through the pores during the dissolution. This suggests that the fractal dimension of pores is related to the pore connectivity to some extent. CO2 sequestration in coal seams is a long-term process, the mechanism of SC-CO2 action, composition of minerals, the evolution of temporal and spatial all lead to different changes in the permeability of coal. In CO2 sequestration process, the spatial changes can be understood as the change of fractal dimension (pore structure complexity) in the short term.
CO2 in the sequestration process will extract low molecular compounds in coal, this process tends to reduce the pore surface roughness (D2), so that the low molecular compounds within the pore space can easily pass through the pore, and ability to increase pore connectivity while expanding pores (THF → THF-C). However, low molecular compounds are incompletely dissolved and block the channels during transport when the time is too short and the space is too complex, thus causing damage to the reservoir (Y → THF). At the same time, coal contains a large number of minerals. The weak acidic conditions after CO2 dissolved in the formation water, resulting in calcite, feldspar and other minerals are dissolved. Although this process can produce secondary pores, but the dissolution effect is not obvious in a short period of time. The surface of the minerals in the pore is partially dissolved and the pore surface roughness is increased. As a result, the mineral particles cannot be successfully pass through the pore channels and even lead to channel blockage in the complex pore space structure (Y → Y-C, Y → HCL-HF). On the other hand, the injection of a large amount of dry (undersaturated) SC-CO2 leads to the evaporation of water from the coal seam into the CO2 stream and results in an increase in the concentration of dissolved salts in the aqueous phase. When the salt concentration exceeds the solubility limit for a given thermodynamic state, the excess salt will precipitate out of the aqueous phase, which in turn will increase the complexity of the pore space. Secondly, the physical stability of clay minerals is weakened after CO2 injection, and the diffusion and grain-carrying effects of the gas cause them to be transported. The transport effect may even cancel out the dissolution of the minerals if the content of clay minerals is high [52]. Nevertheless, it will in turn widen the pore channels and facilitating the outflow of particles to a certain extent when mineral dissolution continues to occur, and it will improve an increase in the connectivity of the pore space when the facilitating effect is more pronounced (HCL-HF → HCL-HF-C).

4. Conclusions

(1)
Raw coals treated with different solvents and SC-CO2 shows an increase in average pore size, while the total PV decreased and pore connectivity deteriorated. Samples THF and HCL-HF show improved pore connectivity with secondary treatment of SC-CO2, but the total PV was continuously decreased.
(2)
Solvents treatment and SC-CO2 extraction mainly act on the microporous fraction. After solvents pretreatment, the changes in the PSD curves of the coal samples are mainly manifested in the reduction of number of micropores after solvents pretreatment, especially in the micropores around 3–4 nm. There is a small increase in the number of micropores appeared in the samples Y-C and HCL-HF-C, with the pore size mainly concentrated around 4 nm, while the pores number of the sample THF-C mainly shows an increase in the range of 3–16 nm.
(3)
Generally, solvent pretreatment and SC-CO2 extraction help to simplify pore structure. However, for sample HCL-HF, the pore becomes more complicated by SC-CO2 secondary extraction (HCL-HF-C).
(4)
There is no obvious linear or nonlinear relationship between PV, SSA and fractal dimension. Pore connectivity is influenced by both fractal dimension and time to some extent. In the short term, the larger the fractal dimension, the more unfavorable it is for CO2 flow. Then, the effect of CO2 in enlarging the pores plays a dominant role with increasing time and the pore fractal dimension becomes progressively less useful in assessing pore connectivity.

Author Contributions

Y.L.: Experiment, Writing—original draft, Formal analysis; X.Z.: Supervision, Writing—reviewing & editing, Funding acquisition; Y.S.: Resources; Z.W.: Writing—reviewing & editing; S.Z.: Validation, Writing—reviewing & editing, Funding acquisition; B.L.: Data curation. All authors have read and agreed to the published version of the manuscript.

Funding

This work was supported by the National Natural Science Foundation of China, China (Grant Nos. 42172198 and 42202210), Key Scientific Research Projects of Colleges and Universities in Henan Province (23A44007), and Scientific and Technological Research Project in Henan Province, China (232102320336).

Data Availability Statement

All data, models, and code generated or used during the study appear in the submitted article.

Acknowledgments

The authors are grateful to the referees for their careful reading of this paper and valuable comments.

Conflicts of Interest

The authors declare no conflict of interest.

References

  1. Haszeldine, R.S. Carbon capture and storage: How green can black be? Science 2009, 325, 1647–1652. [Google Scholar] [CrossRef] [PubMed]
  2. Ma, T.; Rutqvist, J.; Oldenburg, C.M.; Liu, W. Coupled thermal-hydrological-mechanical modeling of CO2 enhanced coalbed methane recovery. Int. J. Coal Geol. 2017, 179, 81–91. [Google Scholar] [CrossRef]
  3. Agrawal, R.; Kumar, Y.; Sarkhel, R.; Damdhar, M.S.; Sangwai, J.S. Enhancing the CO2 sequestration potential in subsea terrain by hydrate formation from liquid CO2. Energy Fuels 2023, 37, 14961–14976. [Google Scholar] [CrossRef]
  4. Ni, S.M.; Lv, W.F.; Ji, Z.M.; Wang, K.; Andersen, P.O. CO2 mineralized sequestration and assistance by microorganisms in reservoirs: Development and outlook. Energies 2023, 16, 7571. [Google Scholar] [CrossRef]
  5. Fan, C.J.; Yang, L.; Sun, H.; Luo, M.K.; Zhou, L.J.; Yang, Z.H.; Li, S. Recent advances and perspectives of CO2-Enhanced coalbed methane: Experimental, modeling, and technological development. Energy Fuels 2023, 37, 3371–3412. [Google Scholar] [CrossRef]
  6. Radovic, L.; Menon, V.; Leon, C.L.Y.; Kyotani, T.; Danner, R.P.; Anderson, S.; Hatcher, P.G. On the porous structure of coals: Evidence for an interconnected but constricted micropore system and implications for coalbed methane recovery. Adsorption 1997, 3, 221–232. [Google Scholar] [CrossRef]
  7. Yu, J.K. Study on the Relationship between the Microstructure of Tectonic Coal and Gas Adsorption; Henan Polytechnic University: Jiaozuo, China, 2018. [Google Scholar]
  8. Zhao, J.; Xu, H.; Tang, D.; Mathews, J.P.; Li, S.; Tao, S. A comparative evaluation of coal specific surface area by CO2 and N2 adsorption and its influence on CH4 adsorption capacity at different pore sizes. Fuel 2016, 183, 420–431. [Google Scholar] [CrossRef]
  9. Zhang, X.D.; Zhang, S.; Li, X.Z.; Heng, S. Dynamic evolution of nanoscale pores of different rank coals under solvent extraction. J. Nanosci. Nanotechnol. 2021, 21, 450–459. [Google Scholar] [CrossRef]
  10. Wang, F.F.; Zhang, X.D.; Wu, C.F.; Zhang, S.; Wang, K. Mechanism of solvent extraction-induced changes to nanoscale pores of coal before and after acidification. Fuel 2023, 344, 128027. [Google Scholar] [CrossRef]
  11. Turner, L.G.; Steel, K.M. A study into the effect of cleat demineralisation by hydrochloric acid on the permeability of coal. J. Nat. Gas. Sci. Eng. 2016, 36, 931–942. [Google Scholar] [CrossRef]
  12. Wang, J.H.; Mei, M.H.; Liu, J.; Wang, H.J. Optimization of acid fracturing mechanism and construction procedure for increasing production in coalbed methane wells. Contem. Chem. Ind. 2020, 49, 1892–1895. [Google Scholar]
  13. Du, Y.; Fu, C.Q.; Pan, Z.J.; Sang, S.X.; Wang, W.F.; Liu, S.Q.; Zhao, Y.C.; Zhang, J.Y. Geochemistry effects of supercritical CO2 and H2O on the mesopore and macropore structures of high-rank coal from the Qinshui basin, China. Int. J. Coal Geol. 2020, 223, 103467. [Google Scholar] [CrossRef]
  14. Feng, T.T.; Sun, Y.; Wang, X.J.; Xu, J.L.; Wang, F.C. Structure and gasification characteristics of coal extracted by supercritical CO2/NMP mixed solvent. J. East China Univ. Sci. Technol. (Nat. Sci. Ed.) 2013, 39, 131–137. [Google Scholar]
  15. Mohsen, S.M.; David, W.A.; Abbas, E.Z. Experimental investigations on the effect of CO2 on mechanics of coal. Int. J. Coal. Geol. 2015, 399, 134–144. [Google Scholar]
  16. Zhang, S.; Wang, Z.M.; Zhang, X.D.; Chen, F.J.; Ping, X.D.; Sun, Z.Y. Experimental study on physicochemical structure of different rank coals under acid solvent treatments and its effects on heat of gas adsorption. J. Pet. Sci. Eng. 2022, 211, 110191. [Google Scholar] [CrossRef]
  17. Neupane, B.; Ju, Y.W.; Huang, C. Micro/Nano-Pore Structure Characterization of Western and Central Nepal Coals Using Scanning Electron Microscopy and Gas Adsorption. J. Nanosci. Nanotechnol. 2017, 17, 6836–6842. [Google Scholar] [CrossRef]
  18. Nie, B.S.; Liu, X.F.; Yang, L.L.; Meng, J.Q.; Li, X.C. Pore structure characterization of different rank coals using gas adsorption and scanning electron microscopy. Fuel 2015, 158, 908–917. [Google Scholar] [CrossRef]
  19. Li, Y.; Song, D.; Liu, S.; Ji, X.; Hao, H. Evaluation of pore properties in coal through compressibility correction based on mercury intrusion porosimetry: A practical approach. Fuel 2021, 291, 120130. [Google Scholar] [CrossRef]
  20. Zhao, S.; Chen, X.; Li, X.; Qi, L.; Zhang, G. Experimental analysis of the effect of temperature on coal pore structure transformation. Fuel 2021, 305, 121613. [Google Scholar] [CrossRef]
  21. Okolo, G.N.; Everson, R.C.; Neomagus, H.W.; Roberts, M.J.; Sakurovs, R. Comparing the porosity and surface areas of coal as measured by gas adsorption, mercury intrusion and SAXS techniques. Fuel 2015, 141, 293–304. [Google Scholar] [CrossRef]
  22. Zhao, S.P.; Ding, R.; Tian, W.G.; Ye, J.C. Multiscale Fine Characterization of a Coal Pore–Fracture System Based on SEM, CT, and NMR in the Jingbian Block, Ordos Basin. Energies 2023, 16, 5315. [Google Scholar] [CrossRef]
  23. Yao, Y.; Liu, D.; Xie, S. Quantitative characterization of methane adsorption on coal using a low-field NMR relaxation method. Int. J. Coal Geol. 2014, 131, 32–40. [Google Scholar] [CrossRef]
  24. Li, Y.; Yang, J.H.; Pan, Z.J.; Tong, W.S. Nanoscale pore structure and mechanical property analysis of coal: An insight combining AFM and SEM images. Fuel 2020, 260, 116352. [Google Scholar] [CrossRef]
  25. Xiong, Q.R.; Li, K.; Yang, D.S.; Yu, H.D.; Pan, Z.J.; Song, Y. Characterizing coal pore space by gas adsorption, mercury intrusion, FIB–SEM and μ-CT. Environ. Earth. Sci. 2020, 79, 209. [Google Scholar] [CrossRef]
  26. Liu, S.Q.; Sang, S.X.; Wang, G.; Ma, J.S.; Wang, X.; Wang, W.F.; Du, Y.; Wang, T. FIB-SEM and X-ray CT characterization of interconnected pores in high rank coal formed from regional metamorphism. J. Pet. Sci. Eng. 2017, 148, 21–31. [Google Scholar] [CrossRef]
  27. Jing, D.; Meng, X.; Ge, S.; Zhang, T.; Ma, M.; Tong, L. Reconstruction and seepage simulation of a coal pore-fracture network based on CT technology. PLoS ONE 2021, 16, e0252277. [Google Scholar] [CrossRef]
  28. Giffin, S.; Littke, R.; Klaver, J.; Urai, J.L. Application of BIB–SEM technology to characterize macropore morphology in coal. Int. J. Coal Geol. 2013, 114, 85–95. [Google Scholar] [CrossRef]
  29. Zhou, S.D.; Liu, D.M.; Cai, Y.D.; Yao, Y.B.; Li, Z.T. 3D characterization and quantitative evaluation of pore-fracture networks of two Chinese coals using FIB-SEM tomography. Int. J. Coal Geol. 2017, 174, 41–54. [Google Scholar] [CrossRef]
  30. Harris, L.A.; Yust, C.S. Transmission electron microscope observations of porosity in coal. Fuel 1976, 55, 233–236. [Google Scholar] [CrossRef]
  31. Ye, J.; Tao, S.; Zhao, S.; Li, S.; Chen, S.; Cui, Y. Characteristics of methane adsorption/desorption heat and energy with respect to coal rank. J. Nat. Gas Sci. Eng. 2022, 99, 104445. [Google Scholar] [CrossRef]
  32. Liu, S.; Ma, J.; Sang, S.; Wang, T.; Du, Y.; Fang, H. The effects of supercritical CO2 on mesopore and macropore structure in bituminous and anthracite coal. Fuel 2018, 223, 32–43. [Google Scholar] [CrossRef]
  33. Li, Z.B.; Ren, T.; Li, X.C.; Qiao, M.; Yang, X.H.; Tan, L.H.; Nie, B.S. Multi-scale pore fractal characteristics of differently ranked coal and its impact on gas adsorption. Int. J. Min. Sci. Technol. 2023, 33, 389–401. [Google Scholar] [CrossRef]
  34. Ye, Z.N.; Hou, E.K.; Duan, Z.H.; Wen, Q.; Huang, M.T.; He, D. Fractal characteristics of pores and microfractures of coals with different structure and their effect on permeability. Coal Geol. Explor. 2019, 47, 70–78. [Google Scholar]
  35. Cai, Y.D.; Liu, D.M.; Pan, Z.J.; Che, Y.; Liu, Z.H. Investigating the effects of seepage-pores and fractures on coal permeability by fractal analysis. Transp. Porous Media 2016, 111, 479–497. [Google Scholar] [CrossRef]
  36. Liu, X.F.; Nie, B.S. Fractal characteristics of coal samples utilizing image analysis and gas adsorption. Fuel 2016, 182, 314–322. [Google Scholar] [CrossRef]
  37. Yao, Y.B.; Liu, D.M.; Tang, D.Z.; Tang, S.H.; Huang, W.H. Fractal characterization of adsorption-pores of coals from North China: An investigation on CH4 adsorption capacity of coals. Int. J. Coal Geol. 2008, 73, 27–42. [Google Scholar] [CrossRef]
  38. Wang, F.; Cheng, Y.P.; Lu, S.Q.; Jin, K.; Zhao, W. Influence of coalification on the pore characteristics of middle high rank coal. Energy Fuels 2014, 28, 5729–5736. [Google Scholar] [CrossRef]
  39. Wang, F.F.; Zhang, X.D.; Wu, C.F.; Zhang, S.; Wang, K. Mechanism of supercritical CO2 on the chemical structure and composition of high-rank coals with different damage degrees. Fuel 2023, 344, 128027. [Google Scholar] [CrossRef]
  40. Clarkson, C.; Wood, J.; Burgis, S. Nanopore-structure analysis and permeability predictions for a tight gas siltstone reservoir by use of low-pressure adsorption and mercury-intrusion techniques. SPE Reservoir Eval. Eng. 2012, 15, 648–661. [Google Scholar] [CrossRef]
  41. Gregg, S.J.; Sing, K.S.W. Adsorption, Surface Area and Porosity, 2nd ed.; Academic Press: New York, NY, USA, 1982. [Google Scholar]
  42. Shao, L.Y.; Li, J.X.; Wang, S.; Hou, H.H.; Li, J.A.; Zhu, M.Y. Pore structures and fractal characteristics of liquid nitrogen adsorption pores in lignite in the Hailar Basin. Nat. Gas Ind. 2020, 40, 15–25. [Google Scholar]
  43. Xie, W.D.; Wang, M.; Wang, H.; Duan, H.Y. Multi-scale fractal characteristics of pores in transitional shale gas reservoir. Nat. Gas Geosci. 2022, 33, 451–460. [Google Scholar]
  44. Qi, H.; Ma, J.; Wong, P. Adsorption isotherms of fractal surfaces. Colloid Surf. A 2002, 206, 401–407. [Google Scholar] [CrossRef]
  45. Li, Z.W.; Hao, Z.Y.; Pang, Y.; Gao, Y. Fractal dimensions of coal and their influence on methane adsorption. J. China Coal. Soc. 2015, 40, 863–869. [Google Scholar]
  46. Wang, M.; Xue, H.T.; Tian, S.S.; Wilkins, R.W.T.; Wang, Z.W. Fractal characteristics of Upper Cretaceous lacustrine shale from the Songliao Basin, NE China. Mar. Petrol. Geol. 2015, 67, 144–153. [Google Scholar] [CrossRef]
  47. Zou, J.P.; Chen, W.Z.; Yang, D.S.; Yuan, J.Q.; Jiao, Y.Y. Fractal characteristics of the anisotropic microstructure and pore distribution of low-rank coal. AAPG Bull. 2019, 103, 1297–1319. [Google Scholar] [CrossRef]
  48. Xu, Q.; Liu, R.; Yang, H. Effect of acid and alkali solutions on micro-components of coal. J. Mol. Liq. 2021, 329, 115518. [Google Scholar] [CrossRef]
  49. Hu, B.; Zhang, C.; Zhang, X. The effects of hydrochloric acid pretreatment on different types of clay minerals. Minerals 2022, 12, 1167. [Google Scholar] [CrossRef]
  50. Yu, Y.; Cheng, G.; Ma, L.; Huang, G.; Wu, L.; Xu, H. Effect of agitation on the interaction of coal and kaolinite in flotation. Powder Technol. 2017, 313, 122–128. [Google Scholar] [CrossRef]
  51. Chen, Q.; Cao, T.; Xiong, Y.; Wang, C.; Lin, Z.; Chen, Z.; Xu, S.; Xu, Z. Understanding interactions between clay and model coal surfaces in electrolyte solutions by a quartz crystal microbalance with dissipation study. Energy Fuels 2018, 32, 233–240. [Google Scholar] [CrossRef]
  52. Zhou, L.S.; Du, J.F.; Guo, P.; Wang, Z.H. Influence of supercritical CO2 on the physical property of unconsolidated sandstone reservoir. Oilfield Chem. 2015, 32, 217–222. [Google Scholar]
Figure 1. Images of pore morphology before and after solvent and SC-CO2 treatment.
Fractalfract 08 00141 g001aFractalfract 08 00141 g001b
Figure 2. N2 adsorption/desorption curves.
Fractalfract 08 00141 g002
Figure 3. Variation of pore PV and SSA.
Fractalfract 08 00141 g003
Figure 4. Pore size distribution curve. (a) HCL-HF and HCL-HF-C; (b) THF and THF-C; (c) Y and Y-C; (d) Y and THF; (e) Y and HCL-HF.
Fractalfract 08 00141 g004
Figure 5. Fractal fitting diagrams for coal samples.
Fractalfract 08 00141 g005
Figure 6. Diffraction spectra of the coal samples. (a) Y and THF; (b) Y and HCL-HF; (c) Y and Y-C; (d) HCL-HF and HCL-HF-C; (e) THF and THF-C.
Fractalfract 08 00141 g006
Figure 7. Relationship between fractal dimension and pore structure parameters.
Fractalfract 08 00141 g007
Table 1. Ultimate and proximate analyses of coal samples.
Coal SamplesUltimate Analysis (%)Proximate Analysis (%)
CHONMadAadVdafFCdaf
Y74.023.2821.610.841.1425.5312.0361.3
HCl-HF86.313.598.431.391.730.8912.9184.47
THF73.933.7020.361.780.189.4612.4677.90
Y-C79.213.5115.631.451.048.8011.8078.36
HCl-HF-C84.523.809.381.940.881.0634.9763.09
THF-C68.433.3326.571.430.099.1712.2878.46
Note: Aad is the ash on an air-dried basis of coal, %; Mad is the moisture on an air-dried basis in coal, %; Vdaf is the volatile on a dry and ash-free basis of coal, %; FCdaf is the fixed carbon on a dry and ash-free basis of coal, %.
Table 2. Pore structure parameters of coal samples after different ways of treatment.
SamplesAverage Pore Size (nm)PV in Different Pore Sizes/10−3(cm3·g−1)SSA in Different Pore Sizes/(cm2·g−1)
<10 nm10–100 nm>100 nmPV in Total<10 nm10–100 nm>100 nmSSA in Total
Y8.3090.152010.239390.170260.9330.127910.033120.002770.164
Y-C10.370.193410.200060.079690.53920.15840.03250.001120.192
THF15.3630.0928580.2578320.152730.56910.0709020.0354980.00340.11
THF-C13.1870.260680.289620.134450.69920.211840.046570.002950.261
HCL-HF11.630.122560.259560.127870.58850.0943770.0389930.002380.136
HCL-HF-C16.0990.137450.228410.085150.48920.11330.035080.001430.15
Table 3. Fractal dimension of each coal sample.
SamplesDiameter < 4 nmDiameter > 4 nm
K2D2R2K1D1R2
Y−0.318762.681240.99739−0.125592.874410.97772
Y-C−0.858232.141770.9804−0.194852.805150.94375
THF−0.675292.324710.96705−0.312242.687760.99346
THF-C−0.906022.093980.98173−0.259472.740530.97766
HCL-HF−0.769542.230460.97598−0.271612.728390.97925
HCL-HF-C−0.653952.346050.97039−0.2562.7440.96639
Table 4. Pore structure parameters of coal samples after different ways of treatment (pore size < 10 nm).
SamplesPV in Different Pore Sizes/×10−3(cm3·g−1)SSA in Different Pore Sizes/(cm2·g−1)
0–4 nm4–10 nm0–4 nm4–10 nm
Y0.0659990.0860110.0730350.054875
Y-C0.0535020.1399080.0587090.099691
THF0.0224080.070450.0254390.045463
THF-C0.0926860.1679940.0999790.111861
HCL-HF0.0328720.0896880.0367650.057612
HCL-HF-C0.0422750.0951750.0452420.068058
Disclaimer/Publisher’s Note: The statements, opinions and data contained in all publications are solely those of the individual author(s) and contributor(s) and not of MDPI and/or the editor(s). MDPI and/or the editor(s) disclaim responsibility for any injury to people or property resulting from any ideas, methods, instructions or products referred to in the content.

