


Experimental Study on the Butterfly Shape of the Plastic Zone around a Hole near Rock Failure


Abstract
1. Introduction
2. Method
3. Results
4. Discussion
5. Conclusions
Author Contributions
Funding
Data Availability Statement
Conflicts of Interest
References
- Małkowski, P.; Juszyński, D. Roof fall hazard assessment with the use of artificial neural network. Int. J. Rock Mech. Min. Sci. 2021, 143, 104701. [Google Scholar] [CrossRef]
- Guo, W.-Y.; Zhao, T.-B.; Tan, Y.-L.; Yu, F.-H.; Hu, S.-C.; Yang, F.-Q. Progressive mitigation method of rock bursts under complicated geological conditions. Int. J. Rock Mech. Min. Sci. 2017, 96, 11–22. [Google Scholar] [CrossRef]
- Wang, G.-F.; Li, G.; Dou, L.-M.; Mu, Z.-L.; Gong, S.-Y.; Cai, W. Applicability of energy-absorbing support system for rockburst prevention in underground roadways. Int. J. Rock Mech. Min. Sci. 2020, 132, 104396. [Google Scholar] [CrossRef]
- Kong, Y.; Li, X.; Zhao, J. Quantifying the transition of impact mechanisms of geophysical flows against flexible barrier. Eng. Geol. 2021, 289, 106188. [Google Scholar] [CrossRef]
- Li, J.; Deng, S.; Wang, M.; Huang, H. Weak disturbance-triggered seismic events: An experimental and numerical investigation. Bull. Eng. Geol. Environ. 2018, 78, 2943–2955. [Google Scholar] [CrossRef]
- Chen, X.; Li, L.; Wang, L.; Qi, L. The current situation and prevention and control countermeasures for typical dynamic disasters in kilometer-deep mines in China. Saf. Sci. 2019, 115, 229–236. [Google Scholar] [CrossRef]
- Feng, X.-T.; Kong, R.; Yang, C.; Zhang, X.; Wang, Z.; Han, Q.; Wang, G. A Three-Dimensional Failure Criterion for Hard Rocks Under True Triaxial Compression. Rock Mech. Rock Eng. 2019, 53, 103–111. [Google Scholar] [CrossRef]
- Bukowska, M. Post-Peak Failure Modulus in Problems of Mining Geo-Mechanics. J. Min. Sci. 2013, 49, 731–740. [Google Scholar] [CrossRef]
- Liu, J.-P.; Wang, R.; Lei, G.; Si, Y.-T.; Xu, S.-D.; Li, Y.-H. Studies of stress and displacement distribution and the evolution law during rock failure process based on acoustic emission and microseismic monitoring. Int. J. Rock Mech. Min. Sci. 2020, 132, 104384. [Google Scholar] [CrossRef]
- Ranjith, P.G.; Zhao, J.; Ju, M.; De Silva, R.V.S.; Rathnaweera, T.D.; Bandara, A.K.M.S. Opportunities and Challenges in Deep Mining: A Brief Review. Engineering 2017, 3, 546–551. [Google Scholar] [CrossRef]
- Zhao, C.; Zhang, Z.; Lei, Q. Role of hydro-mechanical coupling in excavation-induced damage propagation, fracture deformation and microseismicity evolution in naturally fractured rocks. Eng. Geol. 2021, 289, 106169. [Google Scholar] [CrossRef]
- Voznesenskii, A.S.; Osipov, Y.V.; Ushakov, E.I.; Semyonov, Y.G.; Vasilevykh, V.V. Effect of weak inclusions on the fracture toughness of interfaces between various rocks. Eng. Fail. Anal. 2023, 146, 107140. [Google Scholar] [CrossRef]
- Voznesenskii, A.S.; Ushakov, E.I. Temperature dependence of internal mechanical losses of gypsum stone with complex composition and structure. J. Alloys Compd. 2022, 906, 164194. [Google Scholar] [CrossRef]
- Guo, X.; Zhao, Z.; Gao, X.; Wu, X.; Ma, N. Analytical solutions for characteristic radii of circular roadway surrounding rock plastic zone and their application. Int. J. Min. Sci. Technol. 2019, 29, 263–272. [Google Scholar] [CrossRef]
- Li, C.; Guo, X.; Lian, X.; Ma, N. Failure Analysis of a Pre-Excavation Double Equipment Withdrawal Channel and Its Control Techniques. Energies 2020, 13, 6368. [Google Scholar] [CrossRef]
- Zhang, W.; Ma, N.; Ma, J.; Li, C.; Ren, J.; Jiang, B. Mechanism of Rock Burst Revealed by Numerical Simulation and Energy Calculation. Shock. Vib. 2020, 2020, 8862849. [Google Scholar] [CrossRef]
- Zhao, Z. Mechanism of Surrounding Rock Deformation and Failure and Control Method Research in Large Deformation Mining Roadway; China University of Mining and Technology: Beijing, China, 2014. [Google Scholar]
- Zhao, Z.; Ma, N.; Liu, H.; Guo, X. A butterfly failure theory of rock mass around roadway and its application prospect. J. China Univ. Min. Technol. 2018, 47, 969–978. [Google Scholar]
- Guo, X.; Zhao, Z.; Gao, X.; Ma, Z.; Ma, N. The Criteria of Underground Rock Structure Failure and Its Implication on Rockburst in Roadway: A Numerical Method. Shock. Vib. 2019, 2019, 7509690. [Google Scholar] [CrossRef]
- Wu, X.; Liu, H.; Li, J.; Guo, X. Space-time Evolutionary Regularity of Plastic Zone and Stability Control in Repetitive Mining Roadway. J. China Coal Soc. 2020, 2020, 1–16. [Google Scholar]
- Guo, X.; Guo, L.; Ma, N.; Zhao, Z. Applicability analysisi of the roadway butterfly theory. J. China Univ. Min. Technol. 2020, 49, 646–653. [Google Scholar]
- Guo, X.; Guo, L.; Li, C.; Ma, N. A quantitative assessment method of roadway rockburst risk based one the plastic zone shape coefficient. J. China Univ. Min. Technol. 2021, 50, 39–49. [Google Scholar]
- Hao, Z. Evolution Law of Plastic Zone and Burst Failure Mechanism of Gateway in Yima Coalfield; China University of Mining and Technology: Beijing, China, 2018. [Google Scholar]
- Liu, H.; Qiao, B.; Ma, N. Stability analysis and design of roadways in adjacent seams: A case study from Tashan coal mine in China. Arab. J. Geosci. 2020, 13, 308. [Google Scholar] [CrossRef]
- Gao, X.; Ma, Z.; Shi, H.; Feng, J. Energy release induced rockbursts based on butterfly-shaped plastic zones in roadways of coal reservoirs. PLoS ONE 2021, 16, e0255044. [Google Scholar] [CrossRef] [PubMed]
- Liu, H.; Guo, L.; Zhao, X.; Wang, P. Effect of Principal Stress Field on the Development of Plastic Zone ahead of the Gateroad. Energies 2020, 13, 4356. [Google Scholar] [CrossRef]
- Ma, N.; Feng, J.; Lv, K.; Zhao, Z. Study on cause classification method and support countermeasures of roof falling in coal drift. Coal Sci. Technol. 2015, 43, 34–40. [Google Scholar]
- Qiao, J.; Ma, N.; Ma, J.; Zhao, Z. Conjugate shear fracture-seismic composite model based on structural stability of dynamic system. J. China Coal Soc. 2019, 44, 1647–1653. [Google Scholar]
- Ma, N.; Ji, M.; Zhiqiang, Z.; Xiaofei, G. Mechanical mechanism and evolution of X-shaped conjugate shear fractures-seism. J. China Coal Soc. 2019, 44, 1647–1653. [Google Scholar]
- Shi, H.; Huang, P.; Ma, N.; Wang, Y. Evolution of regional tectonic system in the longmenshan mountains based on plasitc dislocation theory of rocks. Acta Geol. Sin. 2020, 94, 3581–3589. [Google Scholar] [CrossRef]
- Ma, N.; Zhao, X.; Zhao, Z.; Guo, X. Conjecture about mechanism of butterfly-shape coal and gas outburst in excavation roadway. J. Min. Sci. Technol. 2017, 2, 137–149. [Google Scholar]
- Li, D.; Wang, E.; Kong, X.; Ali, M.; Wang, D. Mechanical behaviors and acoustic emission fractal characteristics of coal specimens with a pre-existing flaw of various inclinations under uniaxial compression. Int. J. Rock Mech. Min. Sci. 2019, 116, 38–51. [Google Scholar] [CrossRef]
- Zhang, Z.; Wang, E.; Li, N. Fractal characteristics of acoustic emission events based on single-link cluster method during uniaxial loading of rock. Chaos Solitons Fractals 2017, 104, 298–306. [Google Scholar] [CrossRef]
- Lin, P.; Wei, P.; Wang, C.; Kang, S.; Wang, X. Effect of rock mechanical properties on electromagnetic radiation mechanism of rock fracturing. J. Rock Mech. Geotech. Eng. 2021, 13, 798–810. [Google Scholar] [CrossRef]
- Su, G.; Shi, Y.; Feng, X.; Jiang, J.; Zhang, J.; Jiang, Q. True-Triaxial Experimental Study of the Evolutionary Features of the Acoustic Emissions and Sounds of Rockburst Processes. Rock Mech. Rock Eng. 2017, 51, 375–389. [Google Scholar] [CrossRef]
- Voznesenskii, A.S.; Krasilov, M.N.; Kutkin, Y.O.; Tavostin, M.N.; Osipov, Y.V. Features of interrelations between acoustic quality factor and strength of rock salt during fatigue cyclic loadings. Int. J. Fatigue 2017, 97, 70–78. [Google Scholar] [CrossRef]
- Voznesenskii, A.S.; Kutkin, Y.O.; Krasilov, M.N.; Komissarov, A.A. The influence of the stress state type and scale factor on the relationship between the acoustic quality factor and the residual strength of gypsum rocks in fatigue tests. Int. J. Fatigue 2016, 84, 53–58. [Google Scholar] [CrossRef]
- Voznesenskii, A.S.; Kutkin, Y.O.; Krasilov, M.N.; Komissarov, A.A. Predicting fatigue strength of rocks by its interrelation with the acoustic quality factor. Int. J. Fatigue 2015, 77, 194–198. [Google Scholar] [CrossRef]
- Ren, F.; Zhu, C.; He, M. Moment Tensor Analysis of Acoustic Emissions for Cracking Mechanisms During Schist Strain Burst. Rock Mech. Rock Eng. 2019, 53, 153–170. [Google Scholar] [CrossRef]
- Zhang, W.; Li, C.; Huo, T.; Qu, X.; Xin, C. Vibration events in underground heading face and useful index for rock burst monitoring. Measurement 2021, 180, 109501. [Google Scholar] [CrossRef]
- Zhang, W.; Ma, N.; Ren, J.; Li, C. Peak particle velocity of vibration events in underground coal mine and their caused stress increment. Measurement 2021, 169, 108520. [Google Scholar] [CrossRef]
- Lian, X.; Zhang, W.; Li, C.; Guo, X. Application of discrete data extreme value distribution in the analysis of mine pressure rule. Arab. J. Geosci. 2021, 14, 2011. [Google Scholar] [CrossRef]
- Carpinteri, A.; Lacidogna, G.; Accornero, F.; Mpalaskas, A.C.; Matikas, T.E.; Aggelis, D.G. Influence of damage in the acoustic emission parameters. Cem. Concr. Compos. 2013, 44, 9–16. [Google Scholar] [CrossRef]
- Jiang, L.; Kong, P.; Zhang, P.; Shu, J.; Wang, Q.; Chen, L.; Wu, Q. Dynamic Analysis of the Rock Burst Potential of a Longwall Panel Intersecting with a Fault. Rock Mech. Rock Eng. 2019, 53, 1737–1754. [Google Scholar] [CrossRef]
- Zhang, R.; Dai, F.; Gao, M.Z.; Xu, N.W.; Zhang, C.P. Fractal analysis of acoustic emission during uniaxial and triaxial loading of rock. Int. J. Rock Mech. Min. Sci. 2015, 79, 241–249. [Google Scholar] [CrossRef]
- Zhang, W.; Lian, X.; Wu, Z. A multi-channel verification index to improve distinguish accuracy of target signals in rock burst monitoring of heading face. Measurement 2021, 189, 110483. [Google Scholar] [CrossRef]
- Li, Q.-Y.; Dong, L.-J.; Li, X.-B.; Yin, Z.-Q.; Liu, X.-L. Effects of sonic speed on location accuracy of acoustic emission source in rocks. Trans. Nonferrous Met. Soc. China 2011, 21, 2719–2726. [Google Scholar] [CrossRef]
- Wang, C.; Si, G.; Zhang, C.; Cao, A.; Canbulat, I. Location error based seismic cluster analysis and its application to burst damage assessment in underground coal mines. Int. J. Rock Mech. Min. Sci. 2021, 143, 104784. [Google Scholar] [CrossRef]
- Pu, Y.; Apel, D.B.; Hall, R. Using machine learning approach for microseismic events recognition in underground excavations: Comparison of ten frequently-used models. Eng. Geol. 2020, 268, 105519. [Google Scholar] [CrossRef]
- Dong, L.; Sun, D.; Li, X.; Du, K. Theoretical and Experimental Studies of Localization Methodology for AE and Microseismic Sources Without Pre-Measured Wave Velocity in Mines. IEEE Access 2017, 5, 16818–16828. [Google Scholar] [CrossRef]
- Kao, H.; Shan, S.-J. The Source-Scanning Algorithm: Mapping the distribution of seismic sources in time and space. Geophys. J. Int. 2004, 157, 589–594. [Google Scholar] [CrossRef]
- Zahradník, J.; Janský, J.; Plicka, V. Analysis of the source scanning algorithm with a new P-wave picker. J. Seismol. 2014, 19, 423–441. [Google Scholar] [CrossRef]
- Kao, H.; Shan, S.-J. Rapid identification of earthquake rupture plane using Source-Scanning Algorithm. Geophys. J. Int. 2007, 168, 1011–1020. [Google Scholar] [CrossRef]
- Kong, X.; Wang, E.; He, X.; Li, D.; Liu, Q. Time-varying multifractal of acoustic emission about coal samples subjected to uniaxial compression. Chaos Solitons Fractals 2017, 103, 571–577. [Google Scholar] [CrossRef]
- Guo, X. Criterion of Plastic Zone Shapes of Roadway Surrounding Rock and Its Application; China University of Mining and Technology: Beijing, China, 2019. [Google Scholar]
- Aker, E.; Kühn, D.; Vavryčuk, V.; Soldal, M.; Oye, V. Experimental investigation of acoustic emissions and their moment tensors in rock during failure. Int. J. Rock Mech. Min. Sci. 2014, 70, 286–295. [Google Scholar] [CrossRef]


| Device | Model | Other Main Parameters |
|---|---|---|
| Universal tester | YAW-5000 | Vertical pressure: 5000 kN; Piston stroke: 0–1500 mm; Constant velocity stress control range: 1–10 N/m |
| AE acquisition instrument | DS5-16 | Data acquisition: 2~16 channels Sampling frequency: 6 MHz when 8 channels were used |
| AE sensors | VS150 | Receiving frequency: 50~400 kHz; Center receiving frequency: 150 kHz |
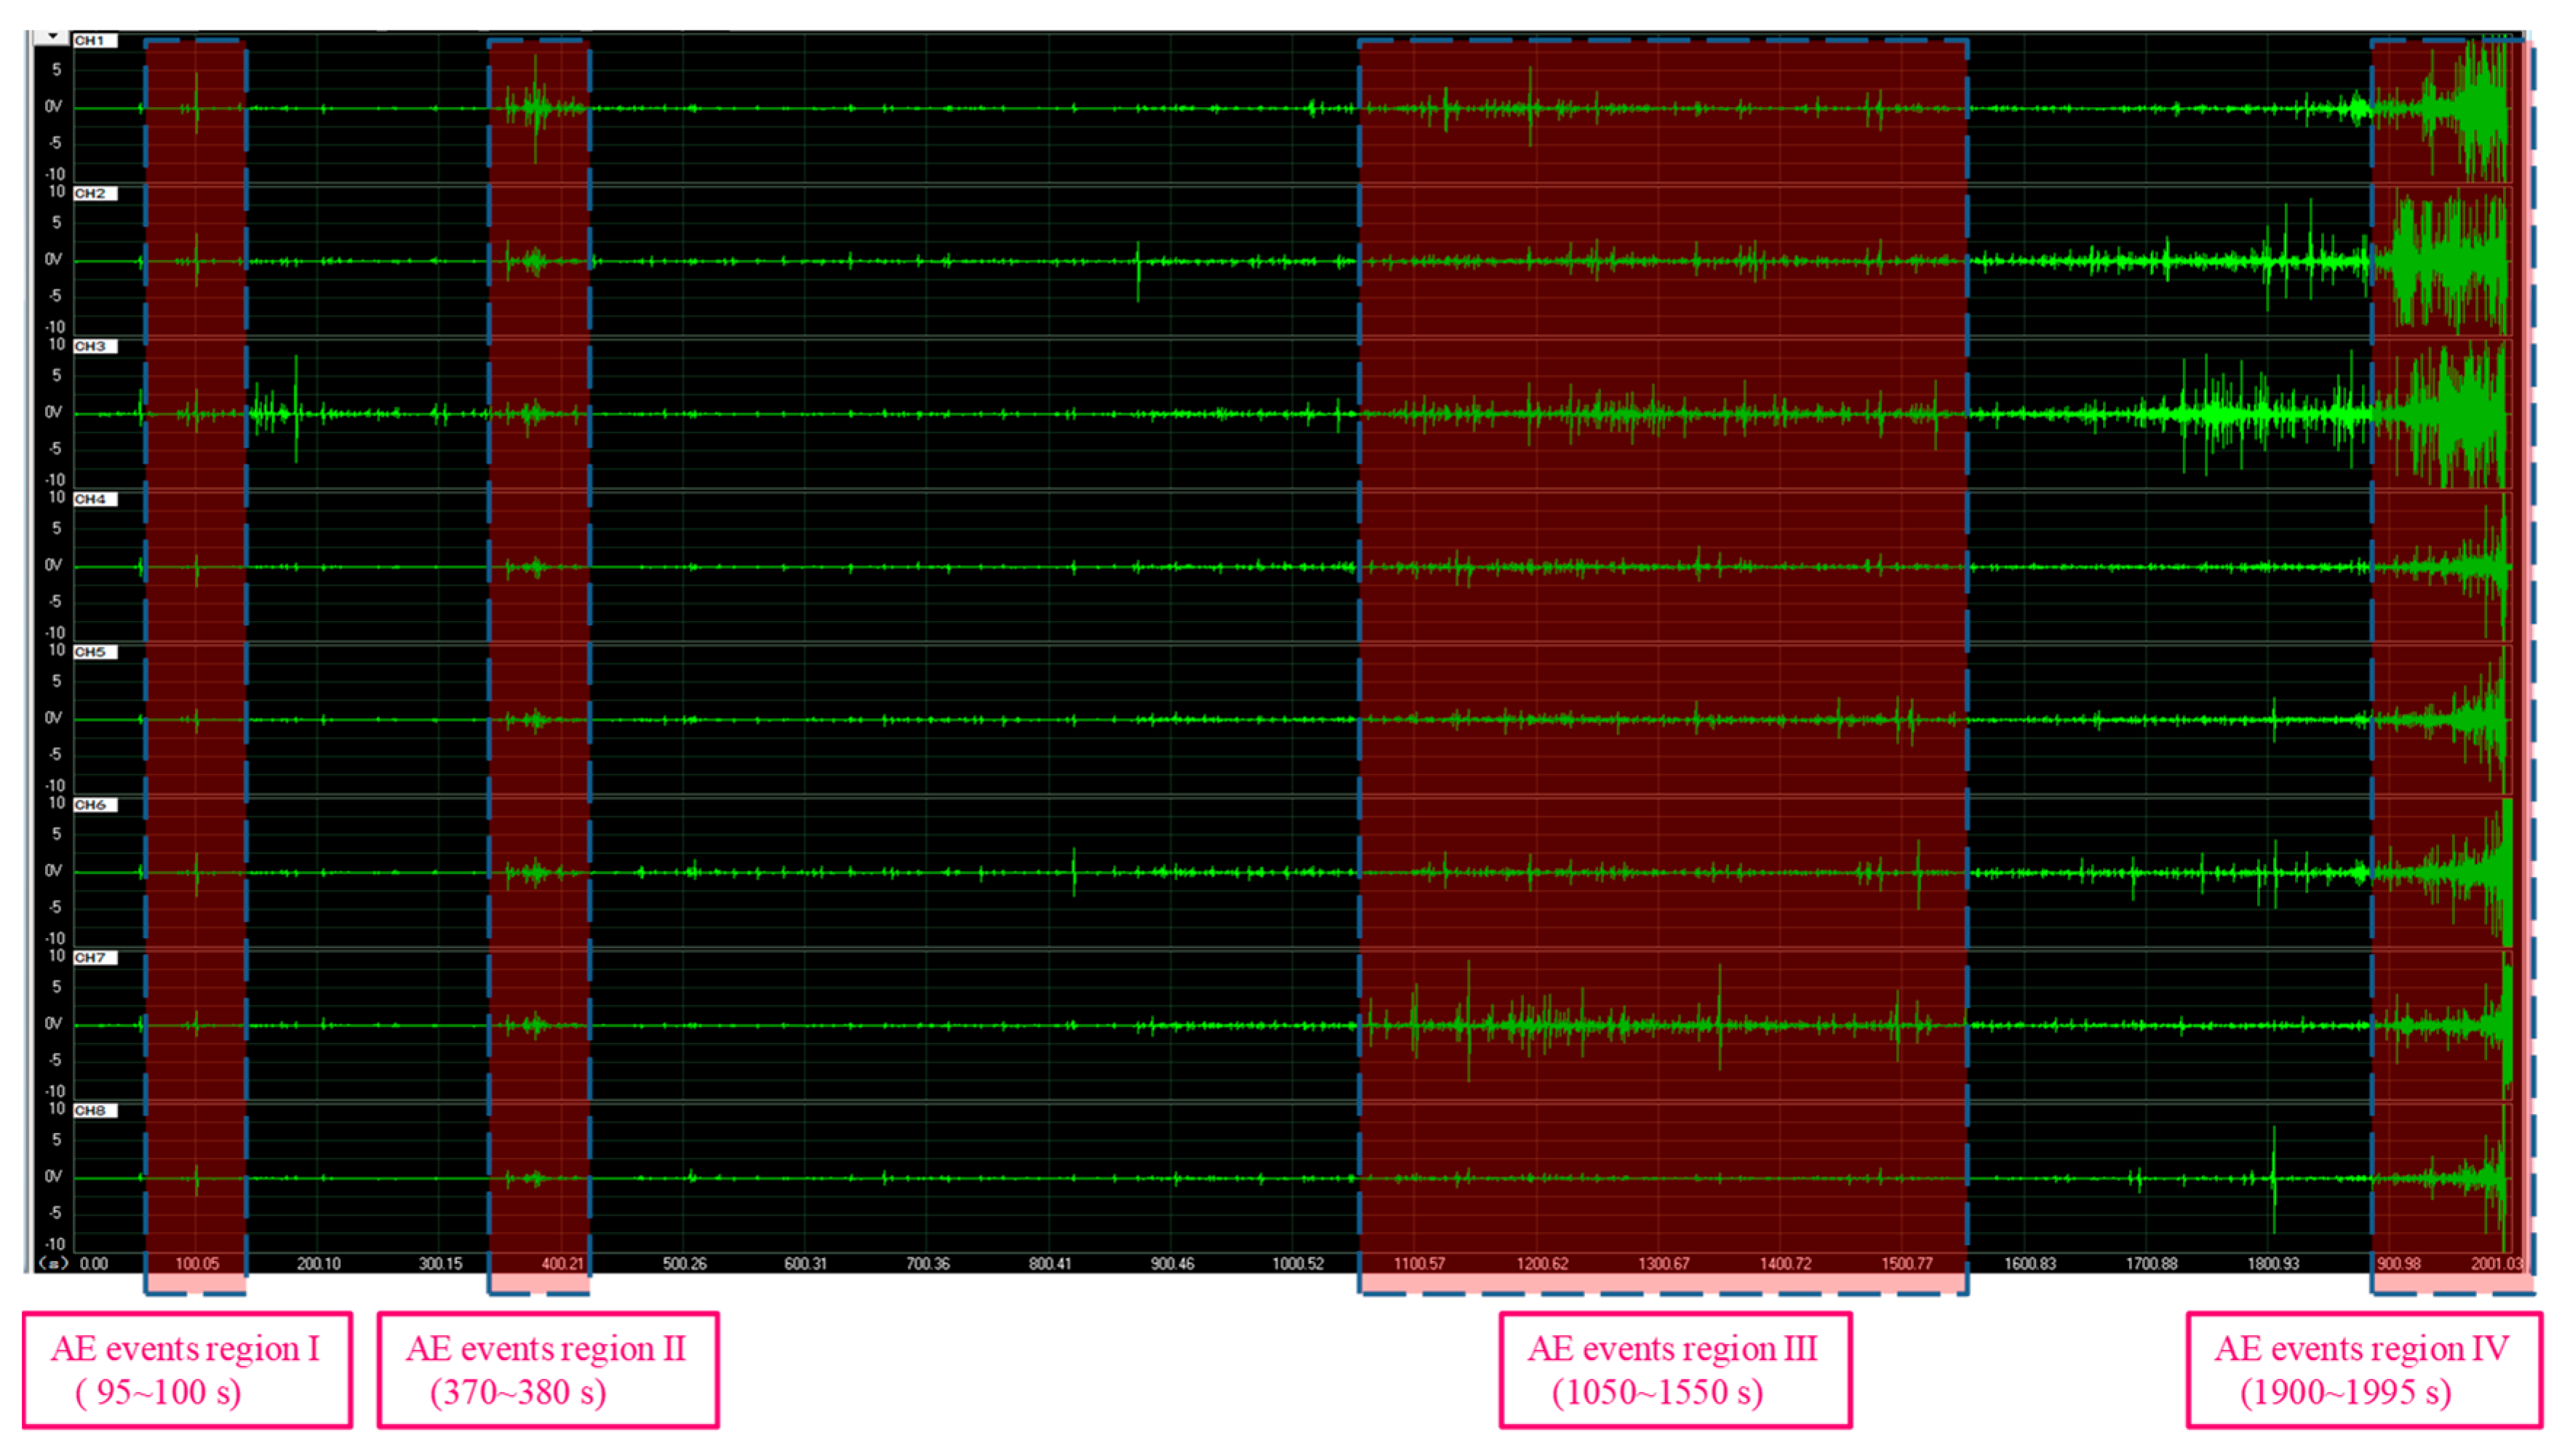
| Time Period | Duration | Number of AE Events |
|---|---|---|
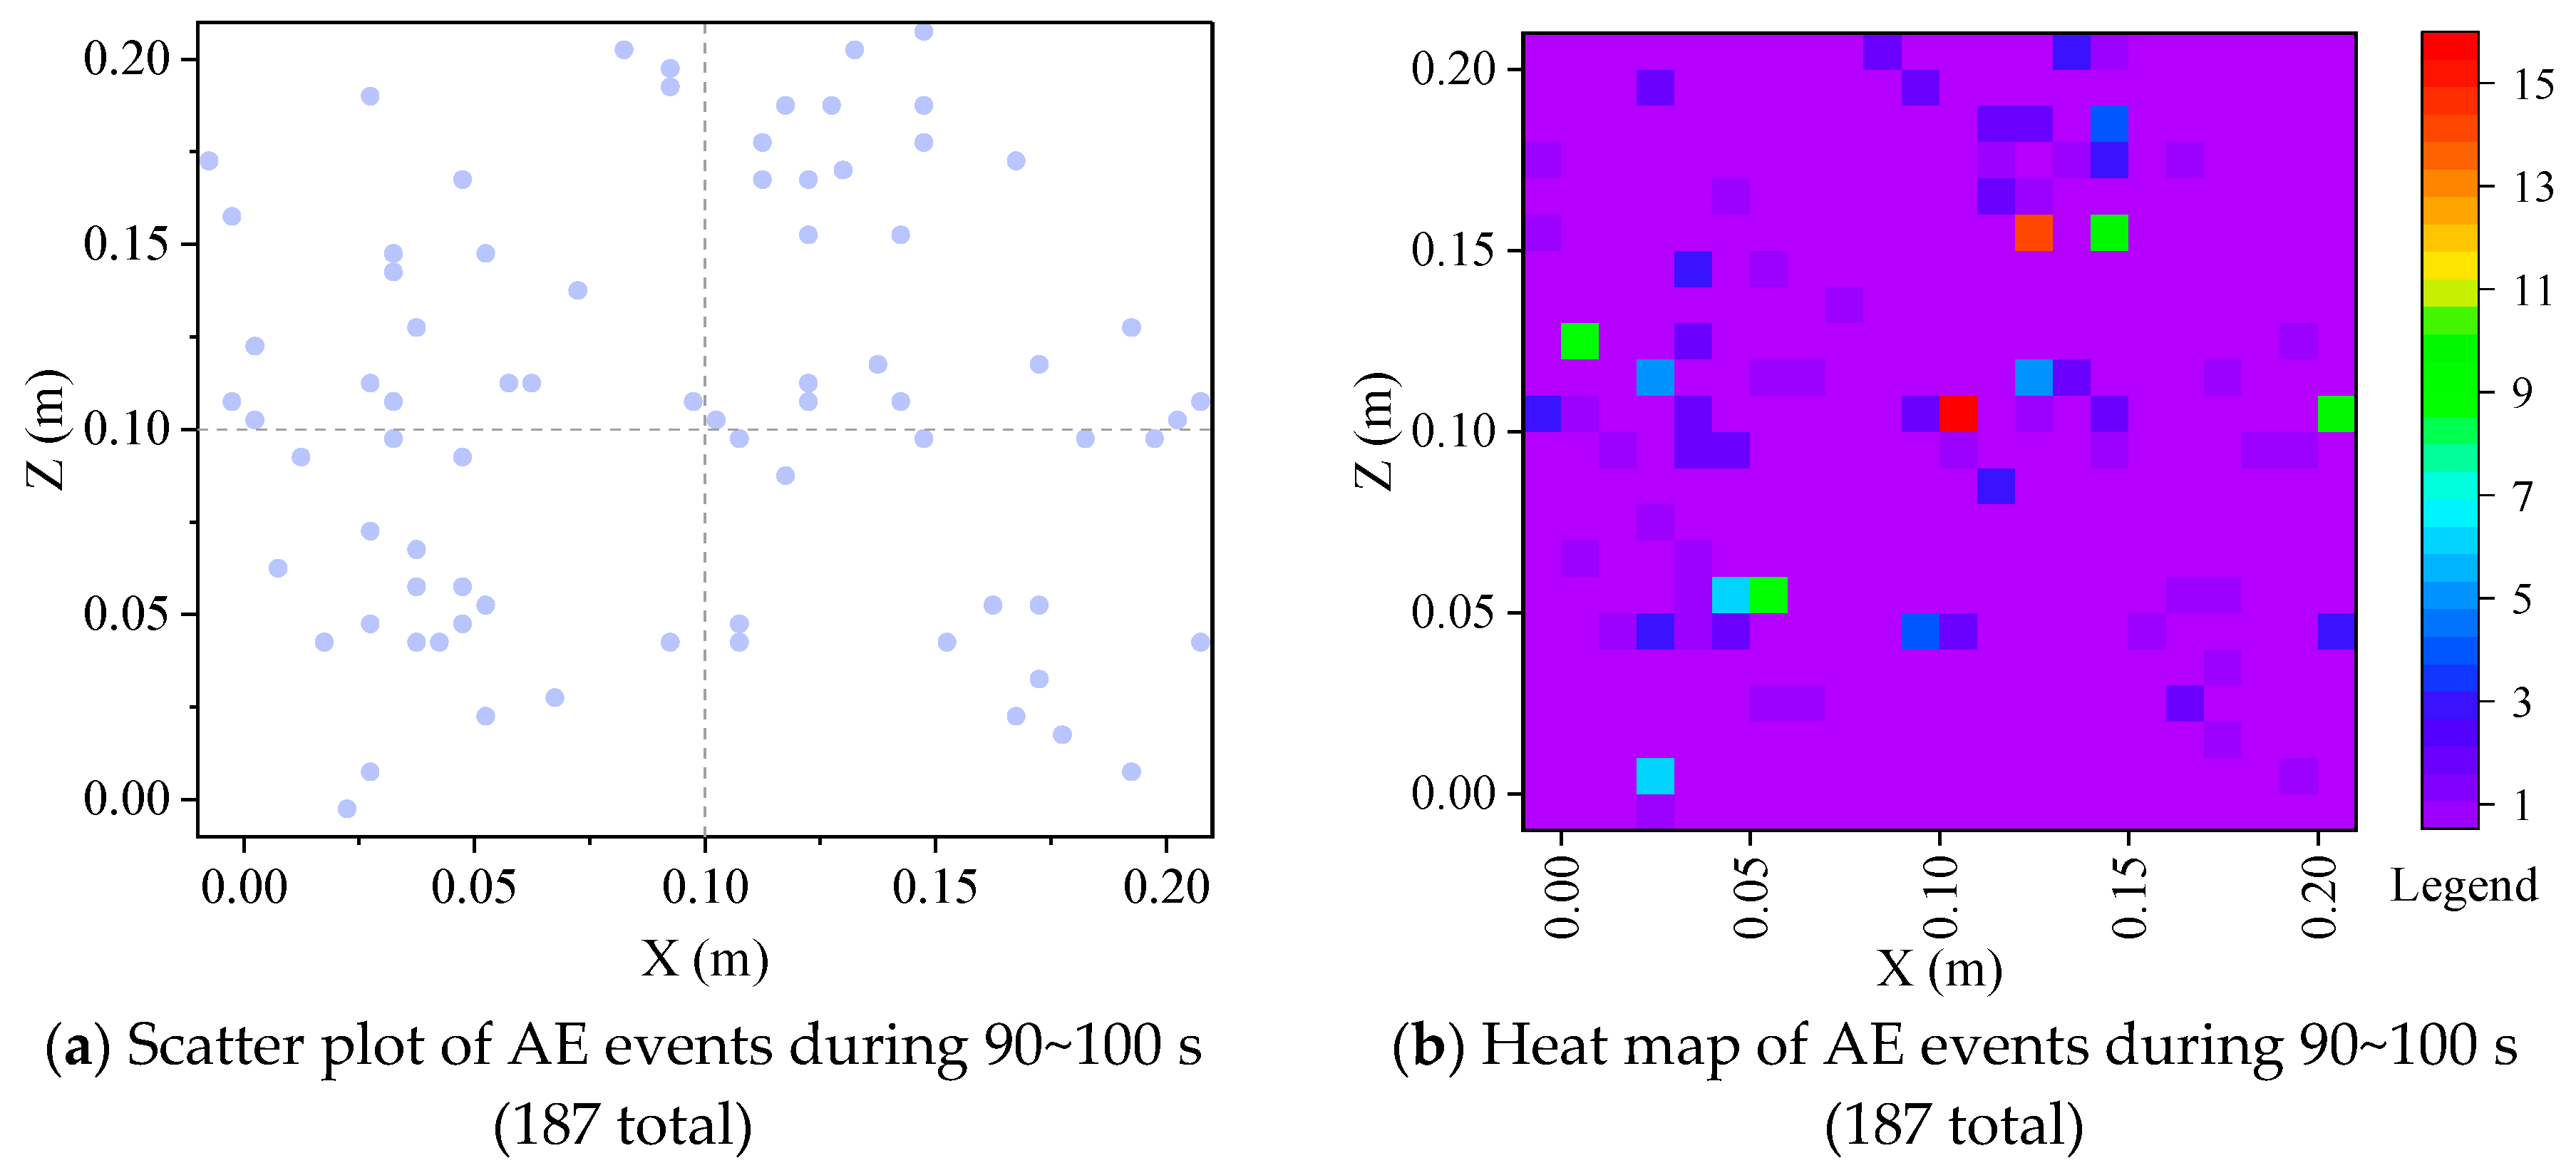
| 90~100 s | 10 | 187 |
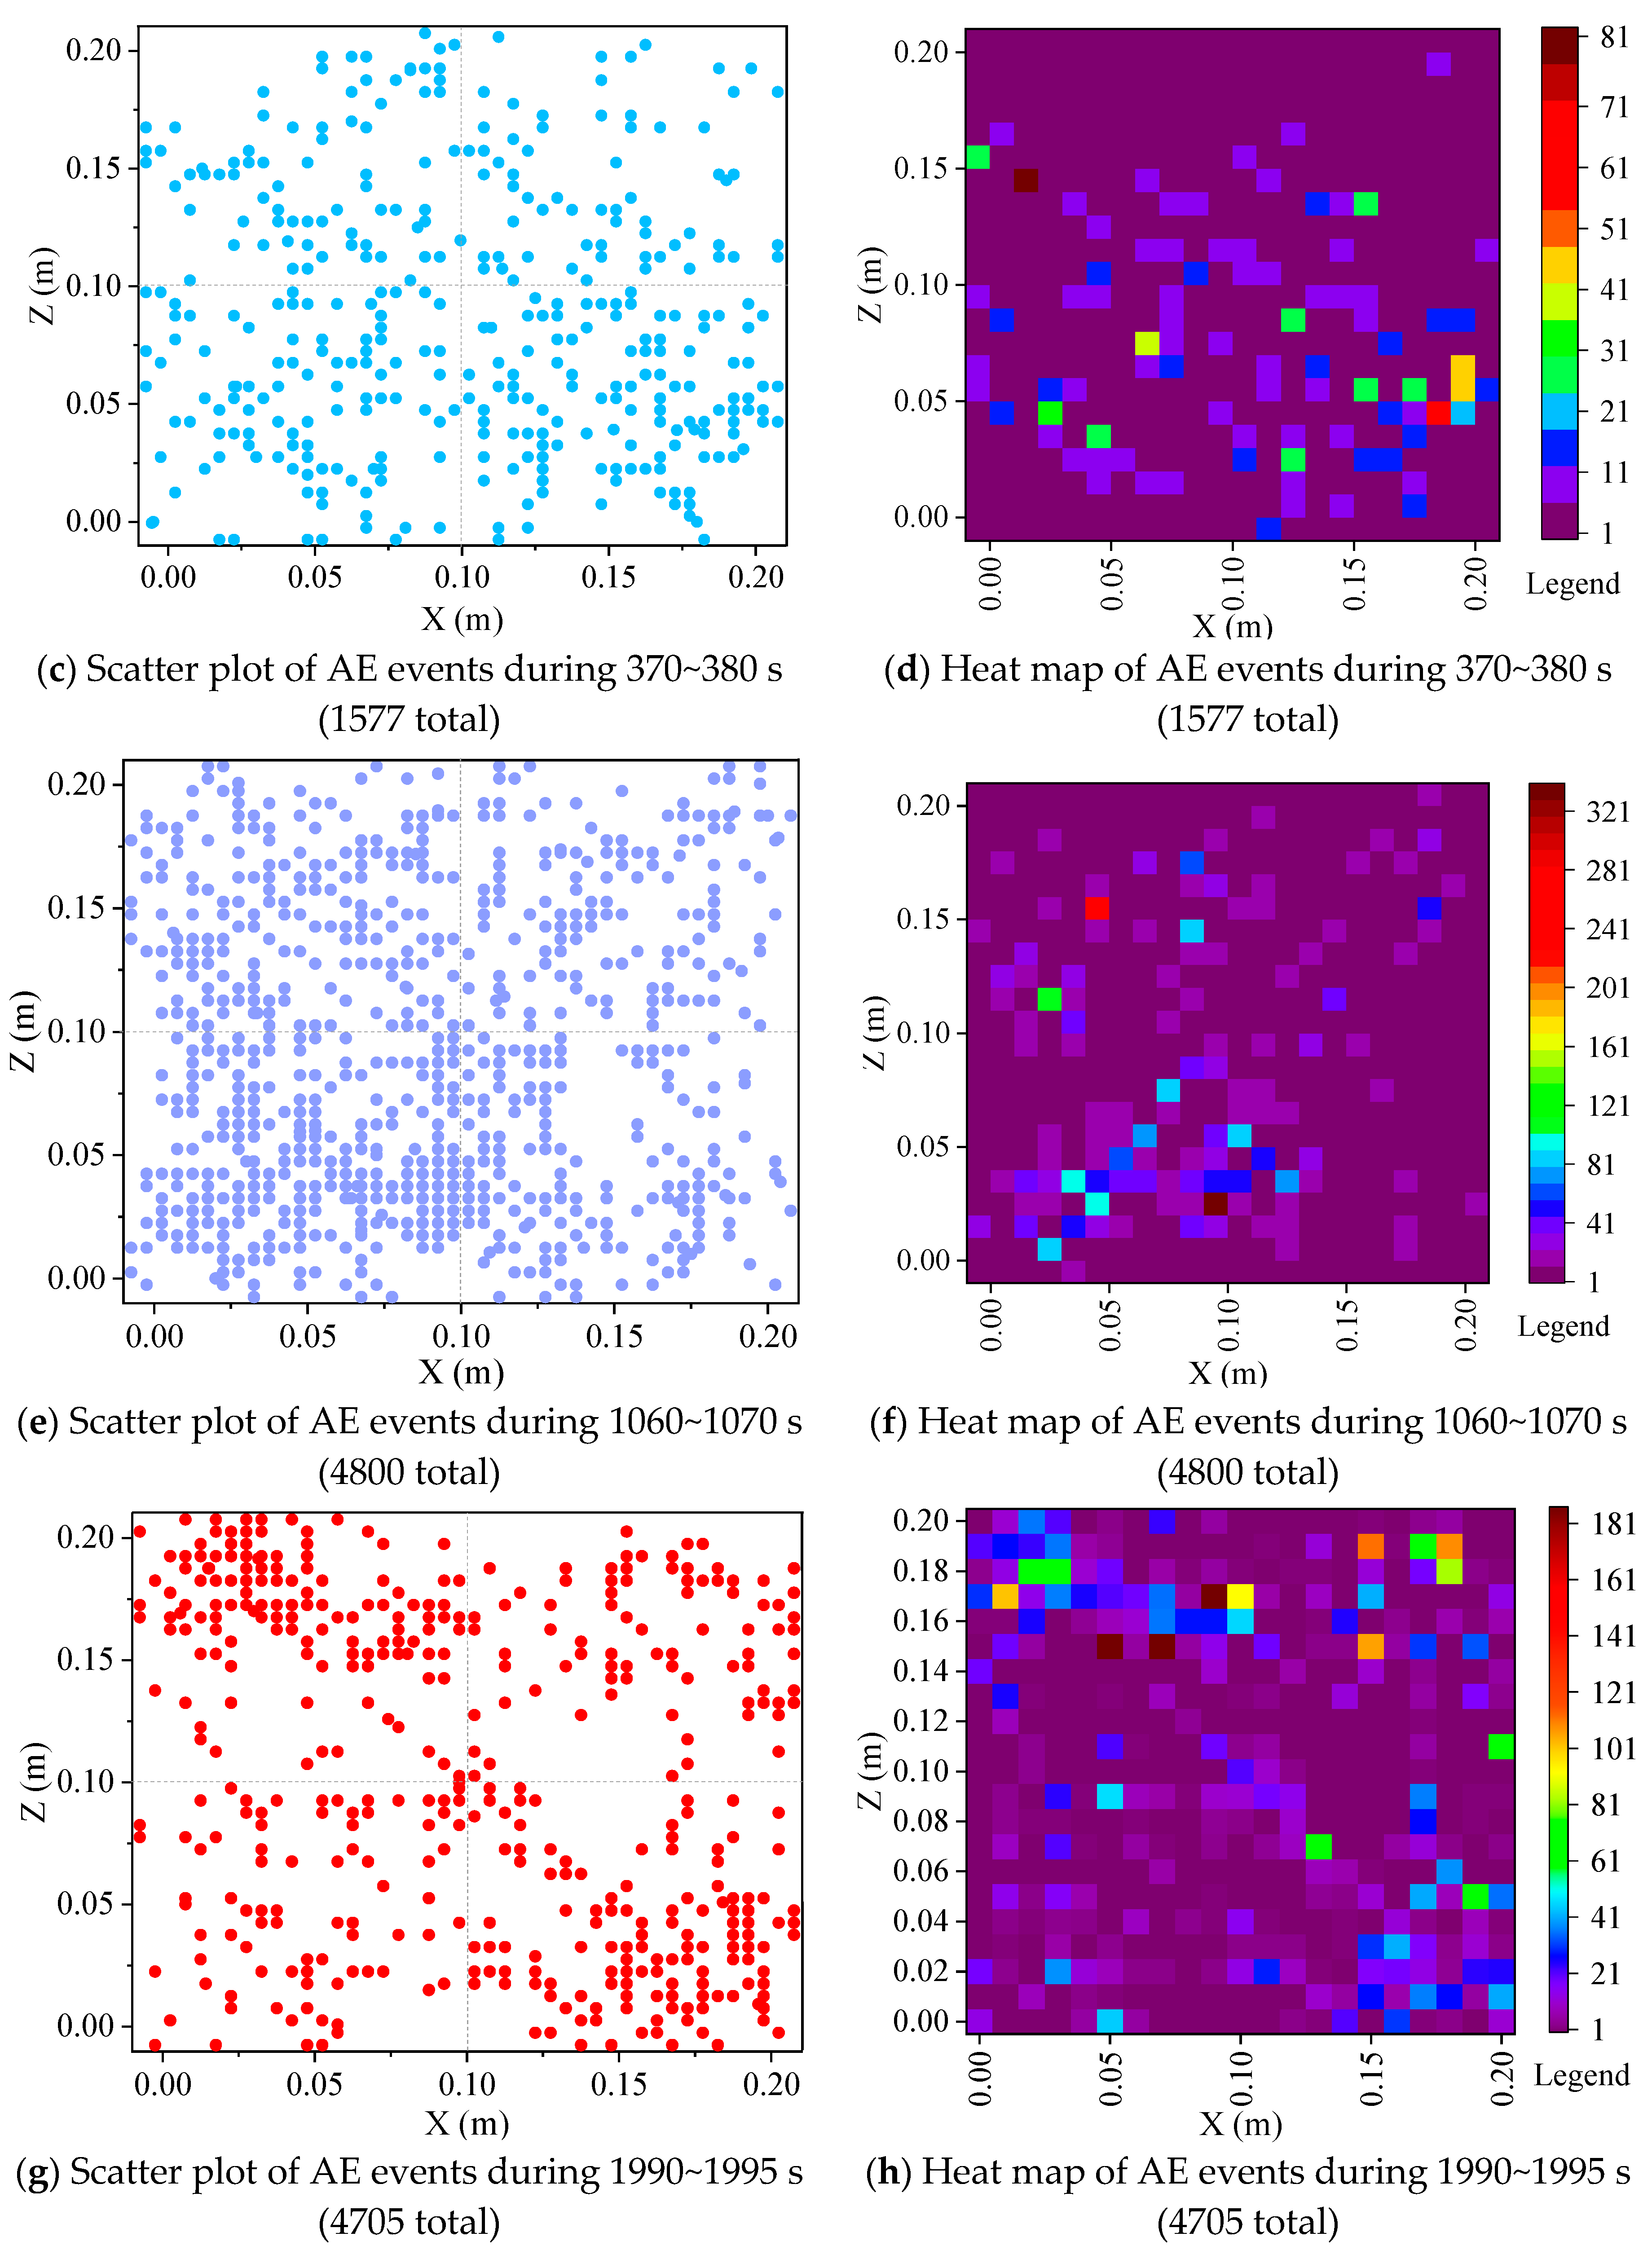
| 370~380 s | 10 | 1577 |
| 1060~1070 s | 10 | 4800 |
| 1990~1995 s | 5 | 4705 |
Disclaimer/Publisher’s Note: The statements, opinions and data contained in all publications are solely those of the individual author(s) and contributor(s) and not of MDPI and/or the editor(s). MDPI and/or the editor(s) disclaim responsibility for any injury to people or property resulting from any ideas, methods, instructions or products referred to in the content. |
© 2024 by the authors. Licensee MDPI, Basel, Switzerland. This article is an open access article distributed under the terms and conditions of the Creative Commons Attribution (CC BY) license (https://creativecommons.org/licenses/by/4.0/).
Share and Cite
Zhang, W.; Yu, J.; Ren, J.; Li, C.; Ma, J. Experimental Study on the Butterfly Shape of the Plastic Zone around a Hole near Rock Failure. Fractal Fract. 2024, 8, 215. https://doi.org/10.3390/fractalfract8040215
Zhang W, Yu J, Ren J, Li C, Ma J. Experimental Study on the Butterfly Shape of the Plastic Zone around a Hole near Rock Failure. Fractal and Fractional. 2024; 8(4):215. https://doi.org/10.3390/fractalfract8040215
Chicago/Turabian StyleZhang, Wenlong, Jiajia Yu, Jianju Ren, Chen Li, and Ji Ma. 2024. "Experimental Study on the Butterfly Shape of the Plastic Zone around a Hole near Rock Failure" Fractal and Fractional 8, no. 4: 215. https://doi.org/10.3390/fractalfract8040215
APA StyleZhang, W., Yu, J., Ren, J., Li, C., & Ma, J. (2024). Experimental Study on the Butterfly Shape of the Plastic Zone around a Hole near Rock Failure. Fractal and Fractional, 8(4), 215. https://doi.org/10.3390/fractalfract8040215