Article

Pore Structure Characterization and Fractal Characteristics of Tight Limestone Based on Low-Temperature Nitrogen Adsorption and Nuclear Magnetic Resonance

1
Institute of Digital Geology and Energy, Linyi University, Linyi 276000, China
2
School of Resources and Environment (College of Carbon Neutrality), Linyi University, Linyi 276000, China
3
School of Petroleum and Natural Gas Engineering, Changzhou University, Changzhou 213164, China
*
Authors to whom correspondence should be addressed.
Fractal Fract. 2024, 8(7), 371; https://doi.org/10.3390/fractalfract8070371
Submission received: 10 May 2024 / Revised: 13 June 2024 / Accepted: 20 June 2024 / Published: 25 June 2024

Abstract

:
Pore structure characterization and fractal analysis have great significance for understanding and evaluating tight limestone reservoirs. In this work, the pore structure of tight limestone, low-temperature nitrogen adsorption (LTNA), and low-field nuclear magnetic resonance (NMR) are characterized, and the fractal dimension of the pore structure of tight limestone is discussed based on LTNA and NMR data. The results indicate that the pores of tight limestone have H3 and H4 types, the pore size distribution (PSD) of the H3 type is a wave distribution ranging from 2 to 10 nm, and the PSD of the H4 type is a unimodal distribution ranging from 2 to 10 nm. The transverse relaxation time (T2) spectrum of tight limestone shows a single peak (DF), double peak (SF), and triple peak (TF), and the ranges for the T2 spectra for micropores, mesopores, and macropores are 0.1 to 10 ms, 10 to 100 ms, and greater than 100 ms, respectively. The LTNA fractal dimension of tight limestone (DL) ranges between 2.4446 and 2.7688, with an average of 2.5729, and the NMR fractal dimensions of micropores (DNMR1), mesopores (DNMR2), and macropores (DNMR3) are distributed between 0.3744 and 1.1293, 2.4263 and 2.9395, and 2.6582 and 2.9989, respectively. Moreover, there is a negative correlation between DL and average pore radius, a positive correlation between DL and specific surface area, and a positive correlation between DNMR2 and DNMR3 and micropore content, while DNMR2 and DNMR3 are negatively correlated with the content of mesopores and macropores.

1. Introduction

Inspired by the economical and efficient development of North American marine tight oil, China began to explore and develop tight oil and gas resources [1,2,3,4,5,6]. In China, tight oil resources are mainly distributed in the Ordos Basin, Sichuan Basin, and Songliao Basin [7,8,9,10,11]. For example, the tight oil resources are abundant in the Taiyuan formation in the Ordos Basin and the Jurassic Da’anzhai Member in the Sichuan Basin, which are the typical lacustrine carbonate tight oil resources [12,13]. The tight limestone reservoir space of the Taiyuan formation is mainly composed of dissolution pores, residual organism cavities, intergranular pores, and microfractures, and the development of such reservoirs is mainly controlled by sedimentary microfacies, quasi-syngenetic karstification, and fractures, whereas the tight limestone reservoirs in the central Sichuan Basin are controlled by dissolution and tectonic processes [14], and the porosity and permeability of tight limestone are related to the calcite content [15].
In the development of tight oil, the accurate pore structure characterization of tight reservoirs is not only a comprehensive understanding of oil storage space but also the basis for its efficient development.
At present, there are many techniques for characterizing the pore structure of tight reservoirs, such as scanning electron microscopy (SEM), X-ray computed tomography (X-CT), high-pressure mercury injection (HPMI), constant-pressure mercury injection (CPMI), low-temperature nitrogen adsorption (LTNA), nuclear magnetic resonance (NMR), and so on. Generally, the HPMI test is prone to making microfractures in rocks due to a high mercury entry pressure [16,17]. At the same time, the CPMI test can only characterize a pore size distribution above 120 nm [18,19]. Tian et al. [15] used SEM to explore the pore structure of tight limestone in the Da’anzhai Member in the Jurassic Ziliujing Formation, central Sichuan Basin. They suggested that multi-type nano- to micro-meter micropores or microfractures develop in tight limestone. Additionally, Volery et al. [20] used SEM to study the factors controlling the difference between microporous and tight facies in the tight limestone of the Urgonian Formation of the French Jura Mountains. Liu et al. [21] analyzed the full-scale distribution map of tight limestone by using capillary pressure curve test data and LTNA experimental data and compared it to NMR data. They found that the main peak of tight limestone pores in the central Sichuan Basin was in the range of 10–50 nm; the pore diameter was 27–967 nm, and the average was 235 nm. However, their study did not explain how to establish a full-scale map. Zhao et al. [22] used a CPMI test to study the pore size distribution characteristics of tight limestone and tight sandstone in the central Sichuan Basin and discussed the fractal characteristics of these two types of rocks. They found that the fractal dimension of tight limestone was greater than the fractal dimension of tight sandstone, indicating that the pore structure of tight sandstone was simpler than that of tight limestone.
In this study, LTNA and NMR were employed to characterize the pore structure and pore size distribution of tight limestone. Furthermore, based on the LTNA and NMR data, the fractal theory was used to calculate the fractal dimensions of tight limestone pores, and the fractal characteristics of tight limestone pores are discussed. These comprehensive results help to reveal the pore space characteristics of the tight limestone reservoirs.

2. Experiment and Samples

2.1. Experimental Samples

In this study, LTNA experiments and NMR experiments were carried out on the 35 cores collected from the typical tight oil areas of SW, China. In the LTNA experiment, the core porosity ranged from 0.89% to 3.47%, with an average of 1.72%. In addition, the permeability was between 0.00079 and 0.25 × 10⁻³ μm2 with an average of 0.03276 × 10⁻³ μm2. In the NMR experiment, the tight limestone core plug porosity ranged from 0.85% to 3.47%, with an average of 1.61%. The core plug permeability was between 0.00098 and 0.435 ×10⁻³ μm2, with an average of 0.08009 × 10⁻³ μm2. Moreover, all these tight limestone cores came from the same research block. It is noteworthy that these cores are typical tight limestones (permeability < 1 × 10⁻³ μm2 and porosity < 10%). According to the previous study, we know that the pores of the tight limestone in the target area can be divided into three types: intragranular pores (Figure 1d), intergranular pores (Figure 1e), and microfractures (Figure 1a–c,f) [23].

2.2. LTNA Experiment

According to the International Union of Pure and Applied Chemistry (IUPAC) definition, micropores have a pore size of less than 2 nm, mesopores are 2–50 nm in size, and macropores are larger than 50 nm in size. For the analysis of the distribution of micropores and mesopores, LTNA was carried out using a USA autosor-6B automatic isothermal adsorption instrument from Quantachrome under a temperature of 77.35 K and a relative pressure of 0.01–1. In the LTNA test, the critical step is to measure the equilibrium pressure (P) and quantity adsorption (V) of nitrogen from a series of given pressures under a constant temperature (T) for generating the isothermal adsorption curve. It can be applied to obtain the specific surface areas, pore diameter, and pore volume of tight samples by using the BET adsorption isotherm [24] and to determine the pore size distribution curve using the BJH model [25,26].

2.3. NMR Experiment

In the NMR experiment, a small RecCore04 low-field NMR core analyzer (Langfang, China)was used, which was independently produced by the Institute of Porous Flow and Fluid Mechanics, Chinese Academy of Sciences. The specific parameters were set as follows: the main frequency was 3.841 MHz, the echo interval time was 600 μs, the waiting time was 3000 ms, the number of echoes was 1024, the number of scans was 64, the gain was 50, and the experimental ambient temperature was 24 °C.

3. Fractal Dimension Calculation Method

We applied the Frenkel–Halsey–Hill (FHH) model proposed by reference [27] to calculate the LTNA fractal dimension of tight limestone (DL).
ln V V 0 = A [ l n ( l n P 0 P ) ] + C
where V is the volume of gas molecules adsorbed under equilibrium pressure P, in cm3/g; V0 is the volume of monomolecular adsorption gas, in cm3/g; P0 is the saturated vapor pressure of gas adsorption, in MPa; P is equilibrium pressure, in MPa; and A and C are the coefficients to be determined, which are obtained by fitting using Equation (1) based on the LTNA data. Furthermore, DL is obtained by Equation (2).
D L = A + 3
In the calculations of the NMR fractal dimensions, we refer to the previous practices [28,29,30,31,32,33,34,35]. First, the relationship between the capillary pressure and the pore radius can be calculated according to the Washburn equation [36]:
p c = 2 σ c o s θ r
where pc is the capillary pressure, in MPa; σ is the surface tension, in N/m; and θ is the contact angle between the water molecules and the surface of the sandstone.
The relationship between the Sv and the pc and pcmin can be calculated according to the equation developed by Chen et al. [35].
S V = ( p c p c m i n ) D 3
where Sv is the volume fraction of pores occupied by a wetting phase when the capillary pressure is equal to Pc and Pcmin is the capillary pressure corresponding to the maximum diameter, in MPa.
The relaxation time T2 can be expressed as follows:
1 T 2 = F s . ρ r
where T2 is relaxation time, in ms; Fs is the geometry factor, and r is the pore diameter. For spherical pores, Fs = 3. For a columnar pipe, Fs = 2.
The relationship between pc and T2 can be calculated as follows.
p c = C 1 T 2
The conversion coefficient C can be expressed as:
C = 2 σ c o s θ F s ρ
where σ is the surface tension, in N/m and θ is the contact angle between the water molecules and the sandstone surface.
Hence, the following can be obtained:
p c m i n = C 1 T 2 m a x
where T2max is maximum relaxation time, in ms.
By substituting Equations (6) and (8) into Equation (4), Equation (9) is obtained:
V c = ( T 2 T 2 m a x ) 3 D
where Vc is the percent of cumulative pore volume with a transverse relaxation time less than T2 in terms of the total pore volume.
Taking the logarithm of both sides of Equation (9), an approximate fractal geometry formula for the NMR T2 spectra can be expressed as follows:
log V c = D 3 log P c D 3 log P c   m i n
where D is the fractal dimension (dimensionless) and Pc min is the capillary pressure related to the largest pore radius, in MPa.

4. Results and Discussion

4.1. LTNA Characterization

The LTNA experiment can quantitatively characterize the pore size distribution and calculate the specific surface area (Ap) of tight limestone. The detailed LTNA test data of the tight limestones are shown in Table 1. Among them, the specific surface area of the rock sample is between 0.11 and 2.06 m2/g, with an average of 0.76 m2/g. Chen et al. [35] measured the specific surface area of shales in southwest China, which was between 7.67 m2/g and 26.33 m2/g. It can be seen that the specific surface area of the tight limestone sample is much smaller than the specific surface area of the shale. In other words, the pore throat structure of the shale is more complex than tight limestone. In addition, the pore radius (ra) of the tight limestone sample is between 8.71 nm and 44.89 nm, with an average of 23.99 nm. Its pore volume (Vc) is between 0.35 and 5.26 mm3/g, with an average of 2.76 mm3/g.
A large number of studies have shown that the shape of the adsorption and desorption curves obtained by LTNA experiments can qualitatively evaluate the pore size distribution of tight rock samples [37,38,39]. At the same time, based on the IUPAC classification criteria, the isothermal adsorption curves of the tight rock samples in this study block can be divided into two categories (Figure 2) [40]. The first type is the H3 hysteresis loop, which mainly includes five rock samples, namely, S3, S4, S8, S11, and S12. In addition, the other 10 tight reservoir rock samples belong to the H4 hysteresis loop. Due to the complexity of tight reservoirs, its pore type is diverse. It can be seen from Figure 3a that the pore radius distribution of the H3 type is mainly between 2 nm and 15 nm. The pore radius of the H4 type is mainly distributed between 1.7 nm and 5 nm (Figure 3b). Simultaneously, H3-type samples have multiple peaks, while H4-type samples have single peaks. This indicates that there is a bimodal type of rock sample (H3) whose micropores are more developed. It is worth noting that the permeability decreases as the average pore radius increases (Figure 4a). This suggests that when the pore space of tight oil rock exists in the form of micropores, although micropores provide reservoir space, they do not contribute much to rock seepage capability. In addition, there is a positive correlation between porosity and pore volume (Figure 4b).

4.2. NMR Characterization

NMR technology has unique advantages for studying the pore structure of tight limestones (e.g., non-destructive testing); it obtains the pore size distribution of the core by detecting the relaxation time (T2 spectrum) of the hydrogen protons in the core with 100% saturated water. In this study, NMR experiments were carried out using 20 tight reservoir cores with 100% saturated formation water. At the same time, according to the NMR test principle, the large pores have a long T2 relaxation time; in turn, the small pores have a short T2 relaxation time. Therefore, we can characterize the pores with a T2 relaxation time between 0.1 ms and 10 ms as micropores; the pores with a T2 relaxation time between 10 ms and 100 ms are characterized as mesopores. Finally, we define pores with a T2 relaxation time greater than 100 ms as macropores.
According to the experimental test results (Figure 5), the tight limestone cores can be divided into three types: the first type only has one peak in the core (DF); the second type has two peaks in the core (SF); and the third type has three peaks in the core (TF). It can be seen from Figure 5 that in the tight limestone core, these three types of cores contain micropores, mesopores, and macropores, and the pore size exhibits a continuous distribution. In addition, we define three different pores (micropores, mesopores, and macropores) in proportions of Ω1, Ω2, and Ω3, respectively. Among them, the calculation method for Ω1, Ω2, and Ω3 is as follows [41]:
Ω 1 = T 2 , m i n T 2,10 S i d S T 2 , m i n T 2 , m a x S i d S × 100 %
Ω 2 = T 2,10 T 2,100 S i d S T 2 , m i n T 2 , m a x S i d S × 100 %
Ω 3 = T 2,100 T 2 , m a x S i d S T 2 , m i n T 2 , m a x S i d S × 100 %
where, Ω1, Ω2, and Ω3 represent the volume ratio of the micropores, mesopores, and macropores, respectively, in %; T2,10 and T2,100 are relaxation times of 10 ms and 100 ms, respectively; T2,min and T2,max are minimum and maximum relaxation times, respectively, in ms; and Si is the amplitude value corresponding to each point on the saturated water T2 curve, in %.
Table 2 shows the calculated values of the volume fraction of each tight limestone core. Figure 6 is a statistical plot of the average proportion of different pore types in three types of cores. It can be seen from Figure 6 that the average proportion of micropores of DF, SF, and TF are 48.55%, 42.19%, and 9.26%, respectively; the average mesopores of the three types of cores are 65.52%, 31.21%, and 3.27%, respectively; and the average proportions of macro holes in the three types of cores are 38.43%, 45.68%, and 15.89%, respectively. It can be seen that the content of mesopores and macropores in TF-type cores is more than 60%; so, the pore development of the TF-type core is better than the other two types of cores.

4.3. Fractal Characterization

The LTNA data were analyzed by the fractal theory; we linearly fitted the ln V/V0 and ln[ln(P0/P)] data. It can be seen from Figure 7 that the correlation curve (R2) of the two types of cores is greater than 0.9, indicating that the tight limestone reservoir core has obvious fractal features. The fractal dimension of LTNA (DL) is between 2.4446 and 2.7688, with an average of 2.5729 (Table 1). At the same time, we calculated the multi-scale fractal dimension of the limestone cores by using NMR data (Table 2). The fractal dimension fitting lines of the three types of cores, namely, DF, SF, and TF, are shown in Figure 8. Among them, the mesopore fractal dimension (DNMR2) of the DF-type tight limestone core is between 2.4263 and 2.8420, with an average of 2.6889, and the macropore fractal dimension (DNMR3) is between 2.6582 and 2.9794, with an average of 2.8875. The mesopore fractal dimension of the SF-type tight limestone core is between 2.6752 and 2.9395, with an average of 2.8156; the macropore fractal dimension is between 2.8701 and 2.9989, with an average of 2.9551. The mesopore fractal dimension of the TF-type tight reservoir core is between 2.5509 and 2.7859, with an average of 2.6519; the macropore fractal dimension is between 2.8111 and 2.9123, with an average of 2.8442. It can be seen that the fractal dimension of macropores in the TF-type core is smaller than that of the other two types of cores; so, the pore structure is relatively simple, and the pore surface is relatively smooth.
Furthermore, we discuss the correlation relationship between the fractal dimension and permeability, porosity, etc. An obvious phenomenon is that there is no specific relationship between the fractal dimension and permeability and porosity in the tight limestone (Figure 9a,b and Figure 10), which is consistent with the results of other scholars [42,43]. In addition, there is a positive correlation between the fractal dimension calculated from the LTNA data and the specific surface (Figure 9c). This indicates that as the specific surface area of tight limestone becomes larger, the complexity of its pore structure becomes higher. In addition, as the fractal dimension increases, the average pore radius of tight limestone shows a decreasing trend (Figure 9d). At the same time, by analyzing the fractal dimension calculated by the NMR data, it can be seen that DNMR2 has a positive correlation with the content of micropores of tight limestone and a negative correlation with the content of mesopores and macropores (Figure 11a). Moreover, DNMR3 also has a positive correlation with the content of micropores of tight limestone and a negative correlation with the content of mesopores and macropores (Figure 11b). In other words, with an increase in the micropore content of tight limestone, its fractal dimension tends to increase as the content of micropores is a significant factor affecting the fractal dimension of tight limestone.

5. Conclusions

In this work, LTNA and NMR were applied to characterize the pore structure of tight limestone, and these experimental data were used to analyze the fractal features of tight limestone, from which the following conclusions can be drawn:
(1)
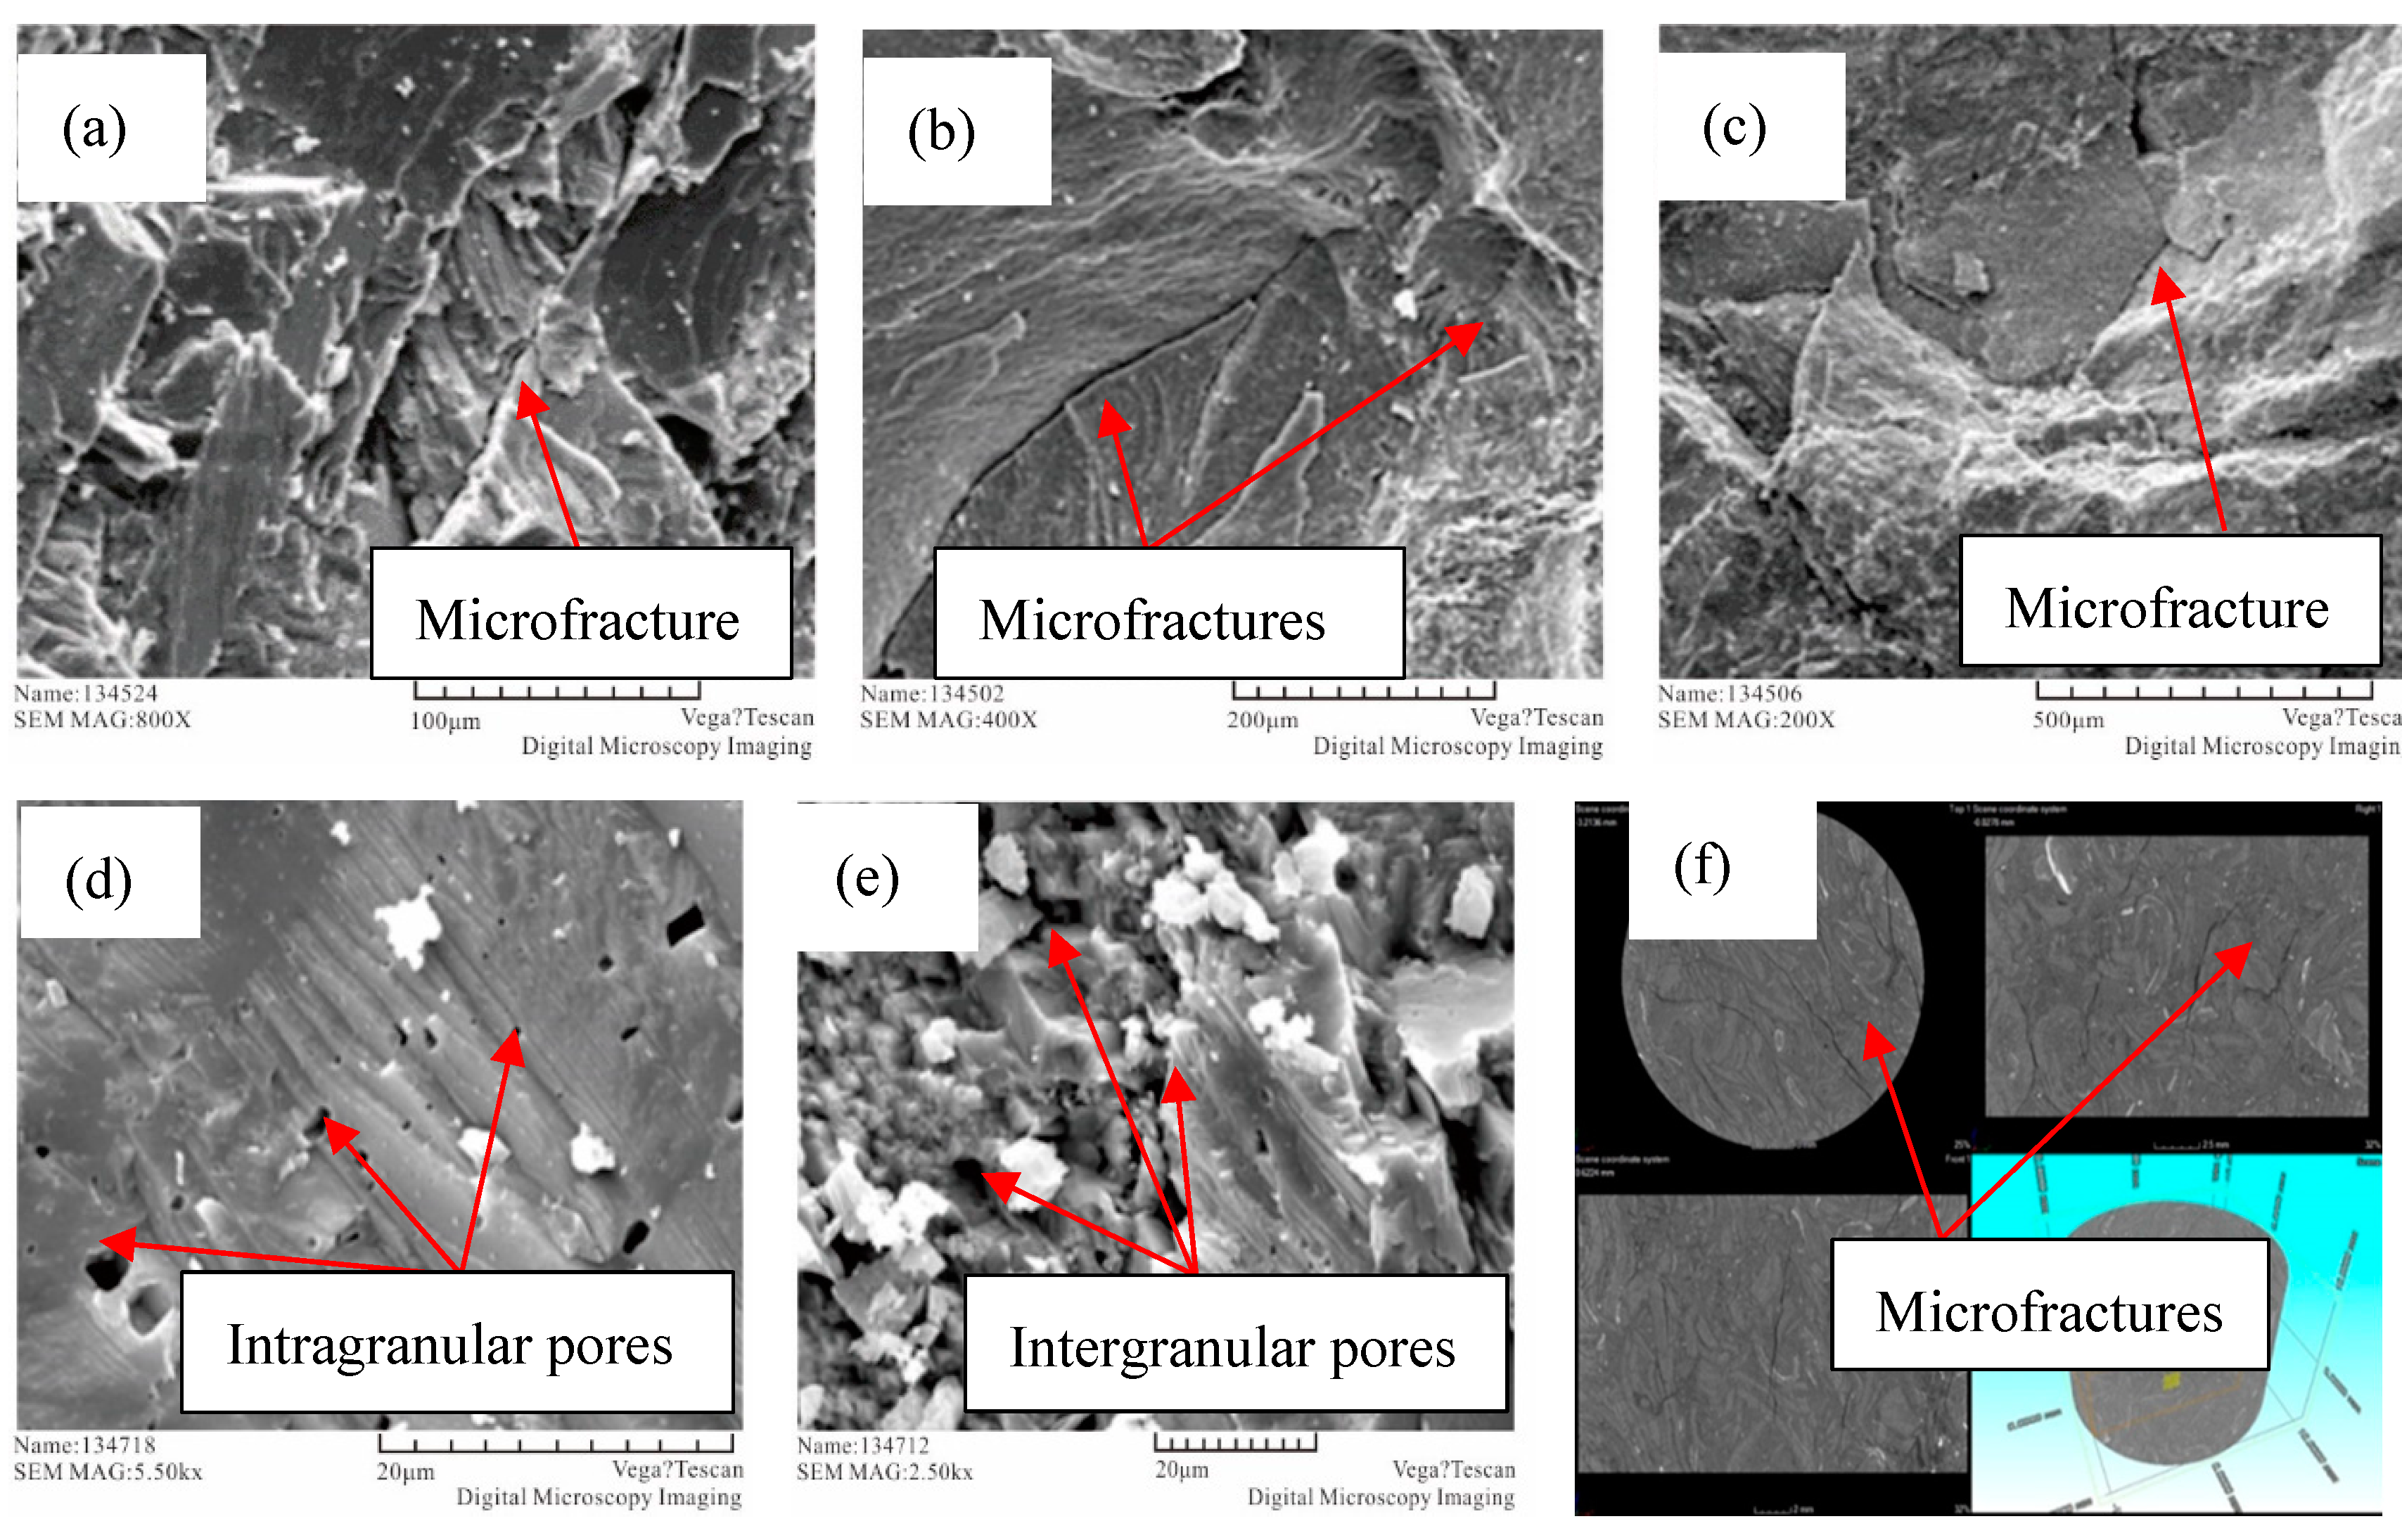
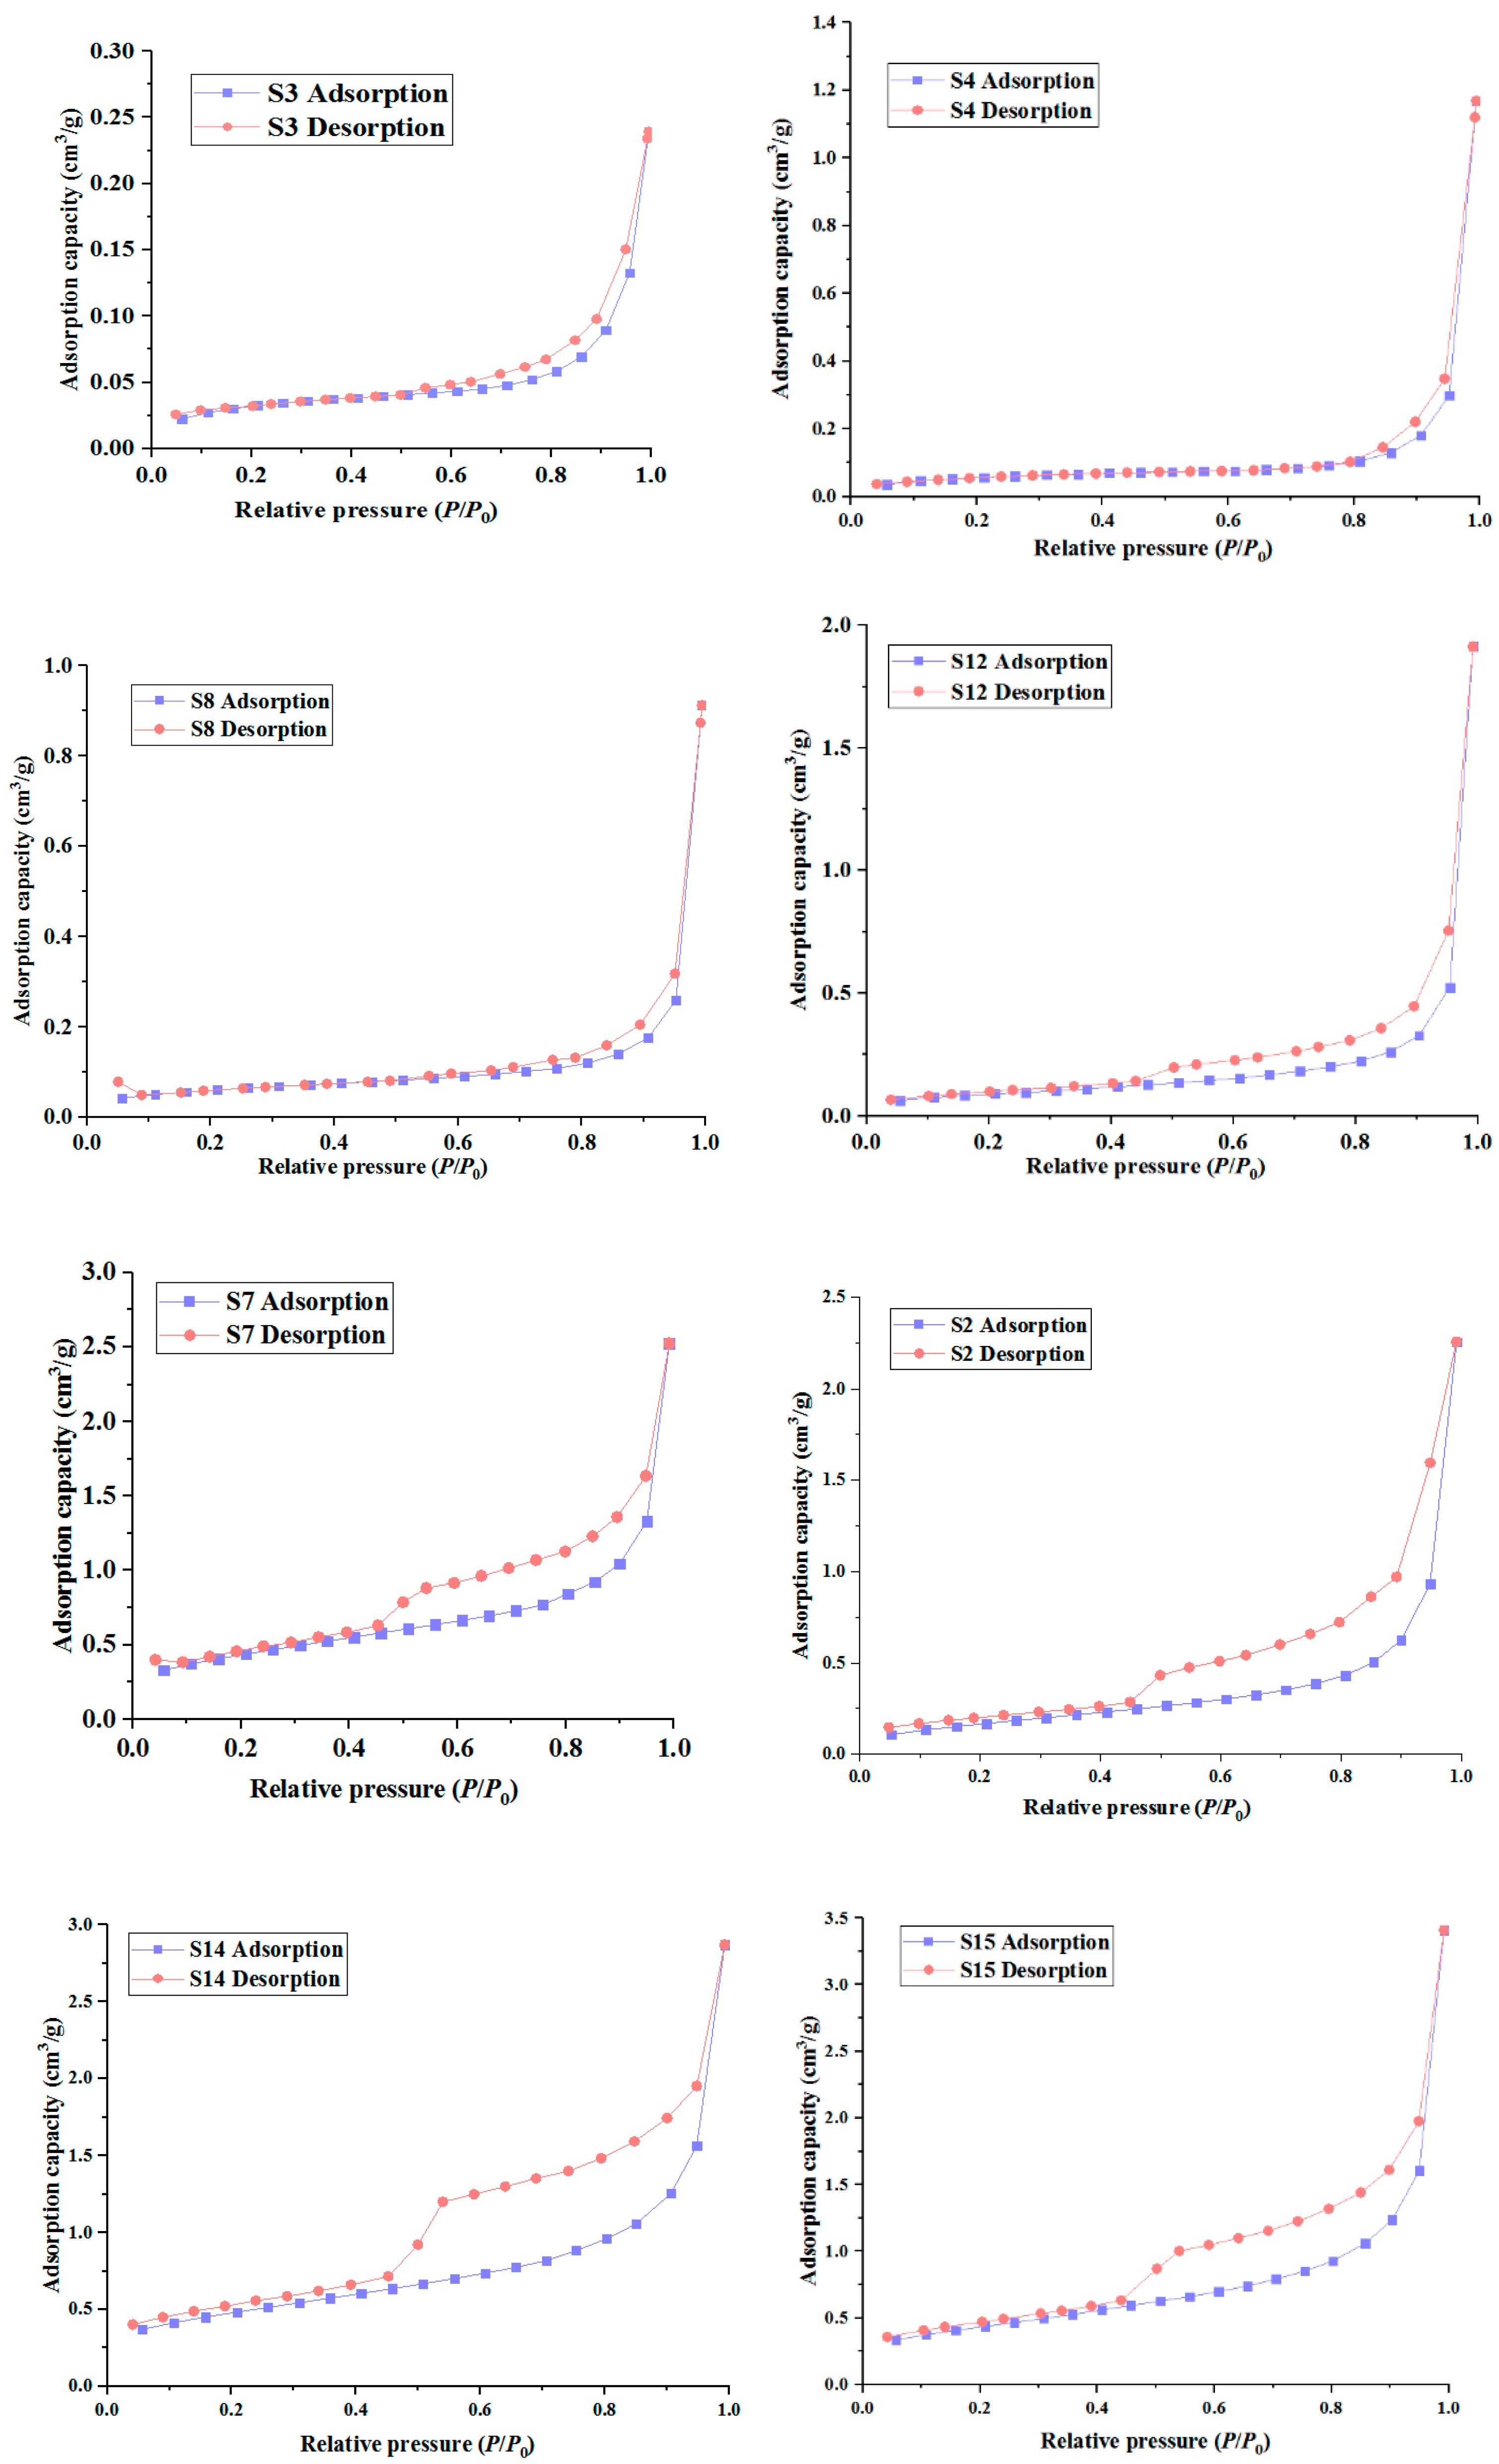
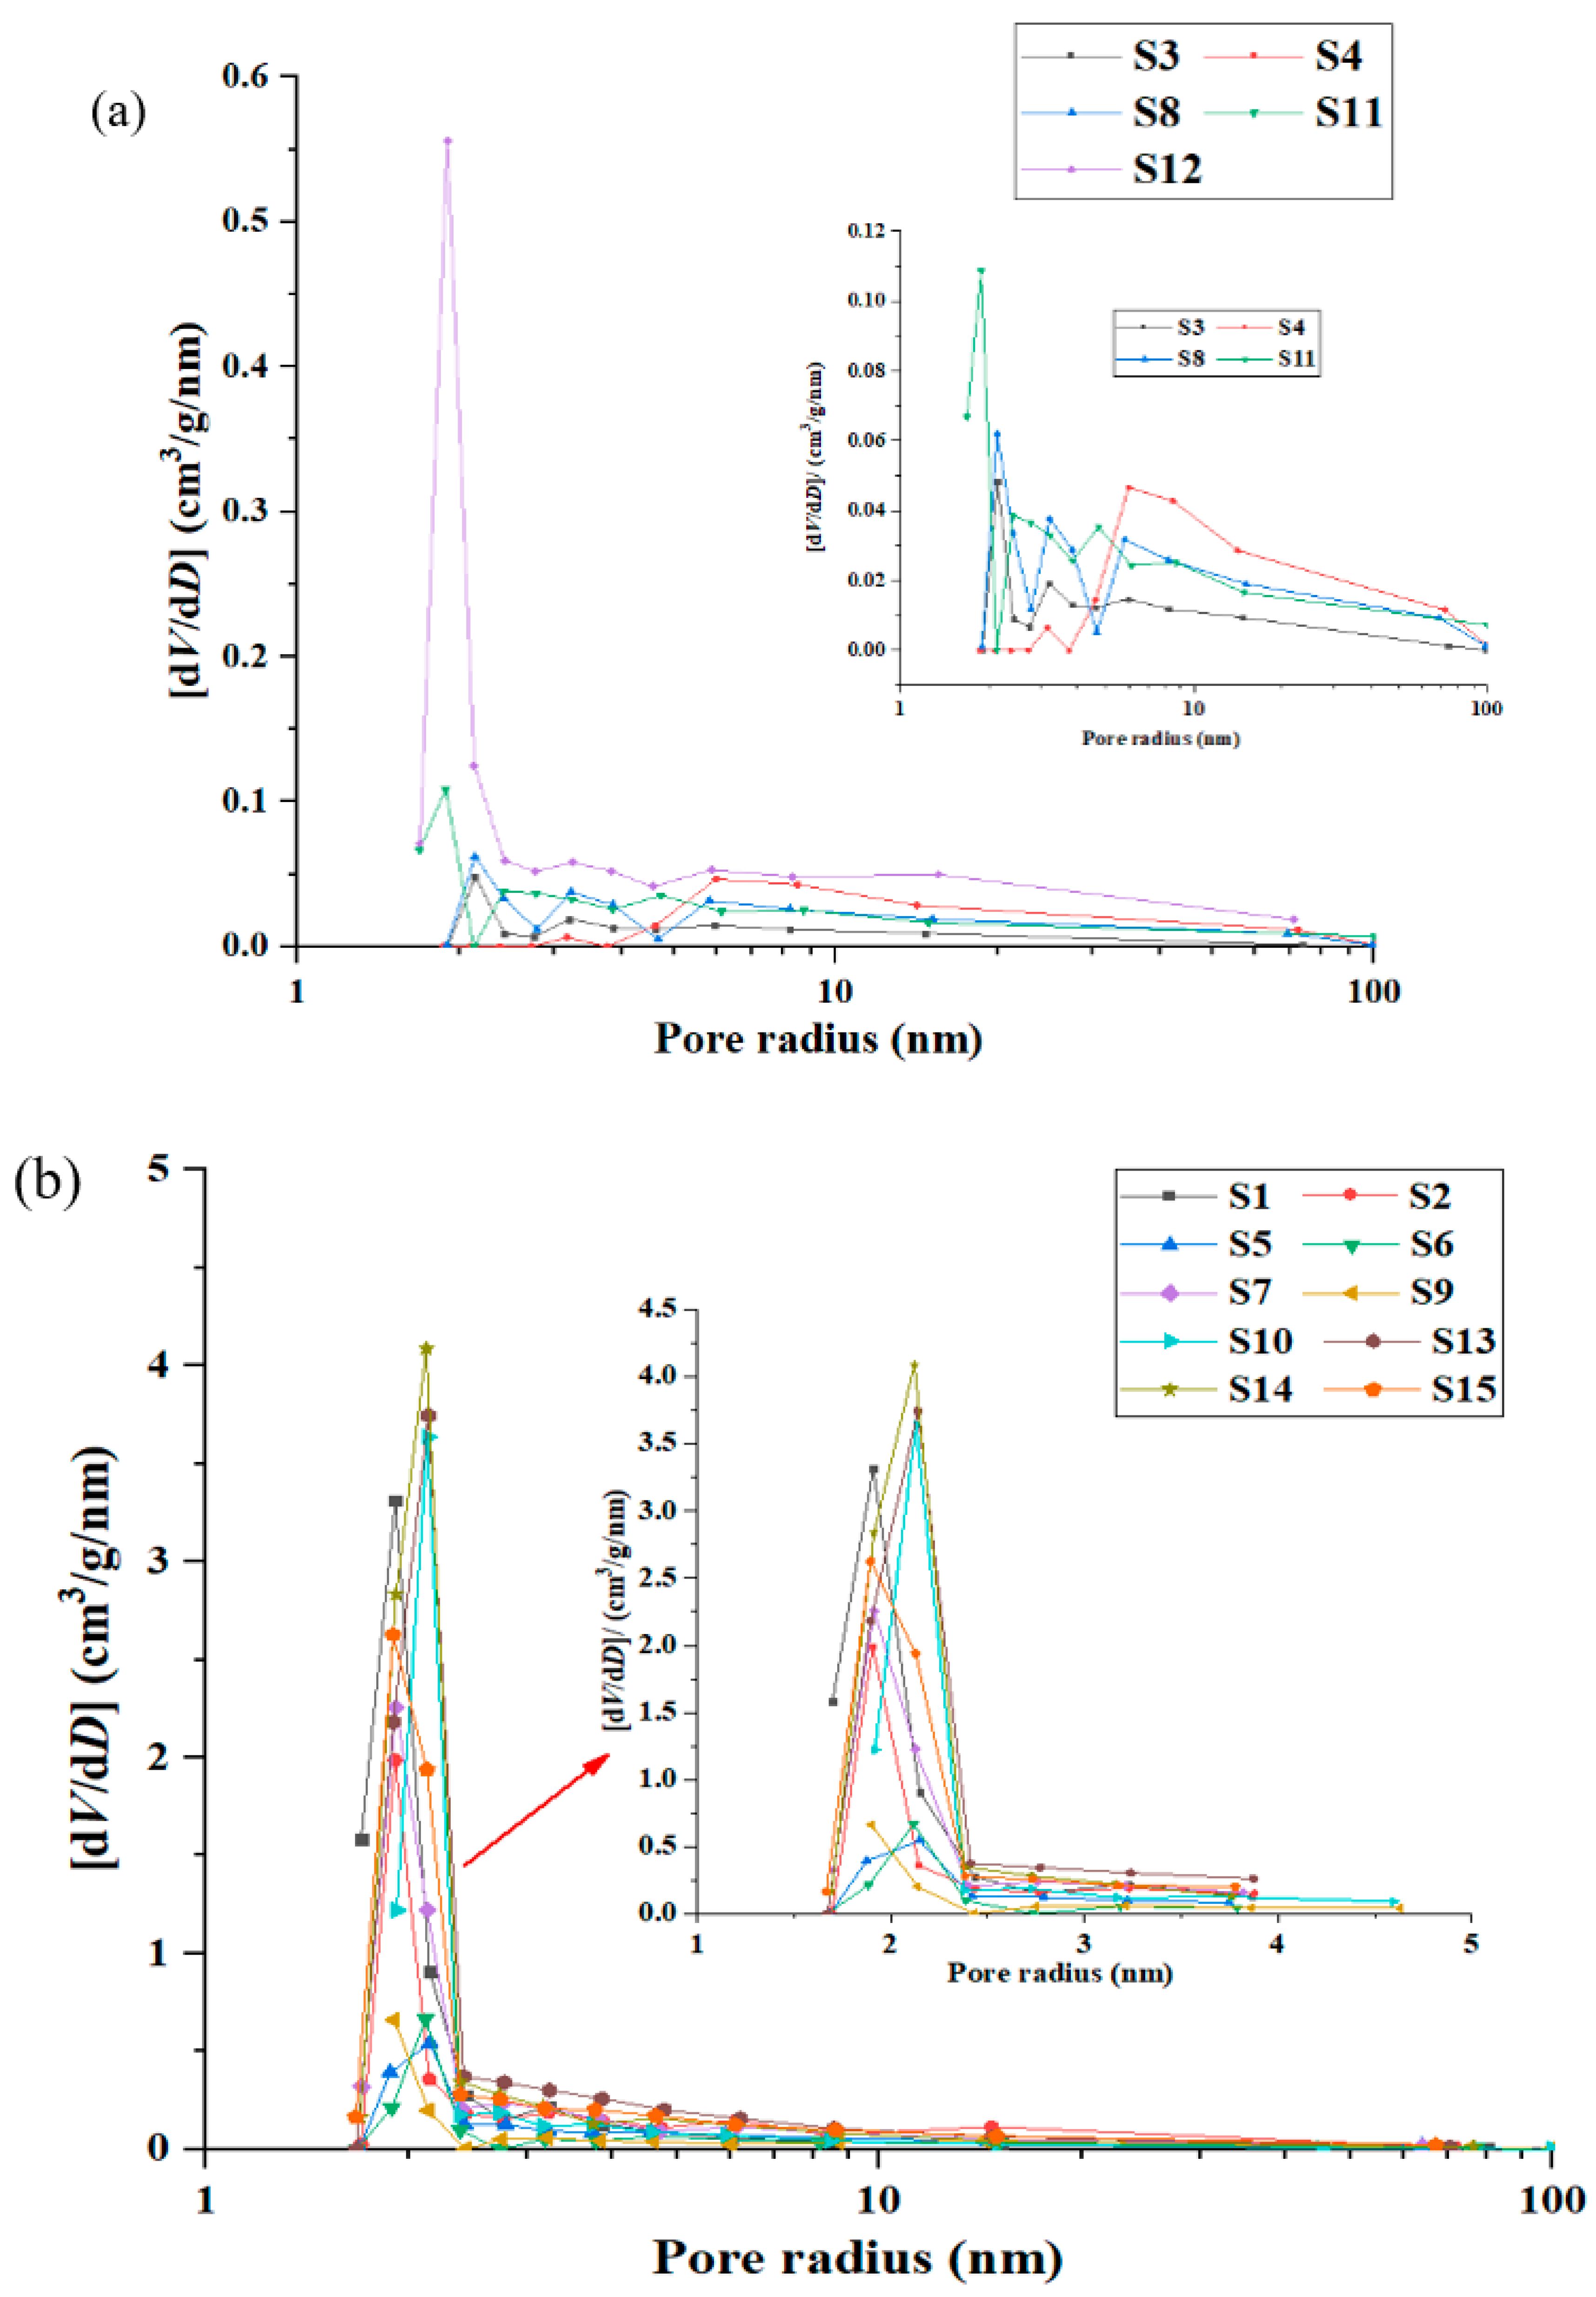
The tight limestones have intergranular pores, intragranular pores, and microfractures. Their LTNA test data indicate that the pores of tight limestone have H3 and H4 types, and the pore radius of tight limestone is between 8.71 nm and 44.89 nm, with an average of 23.99 nm.
(2)
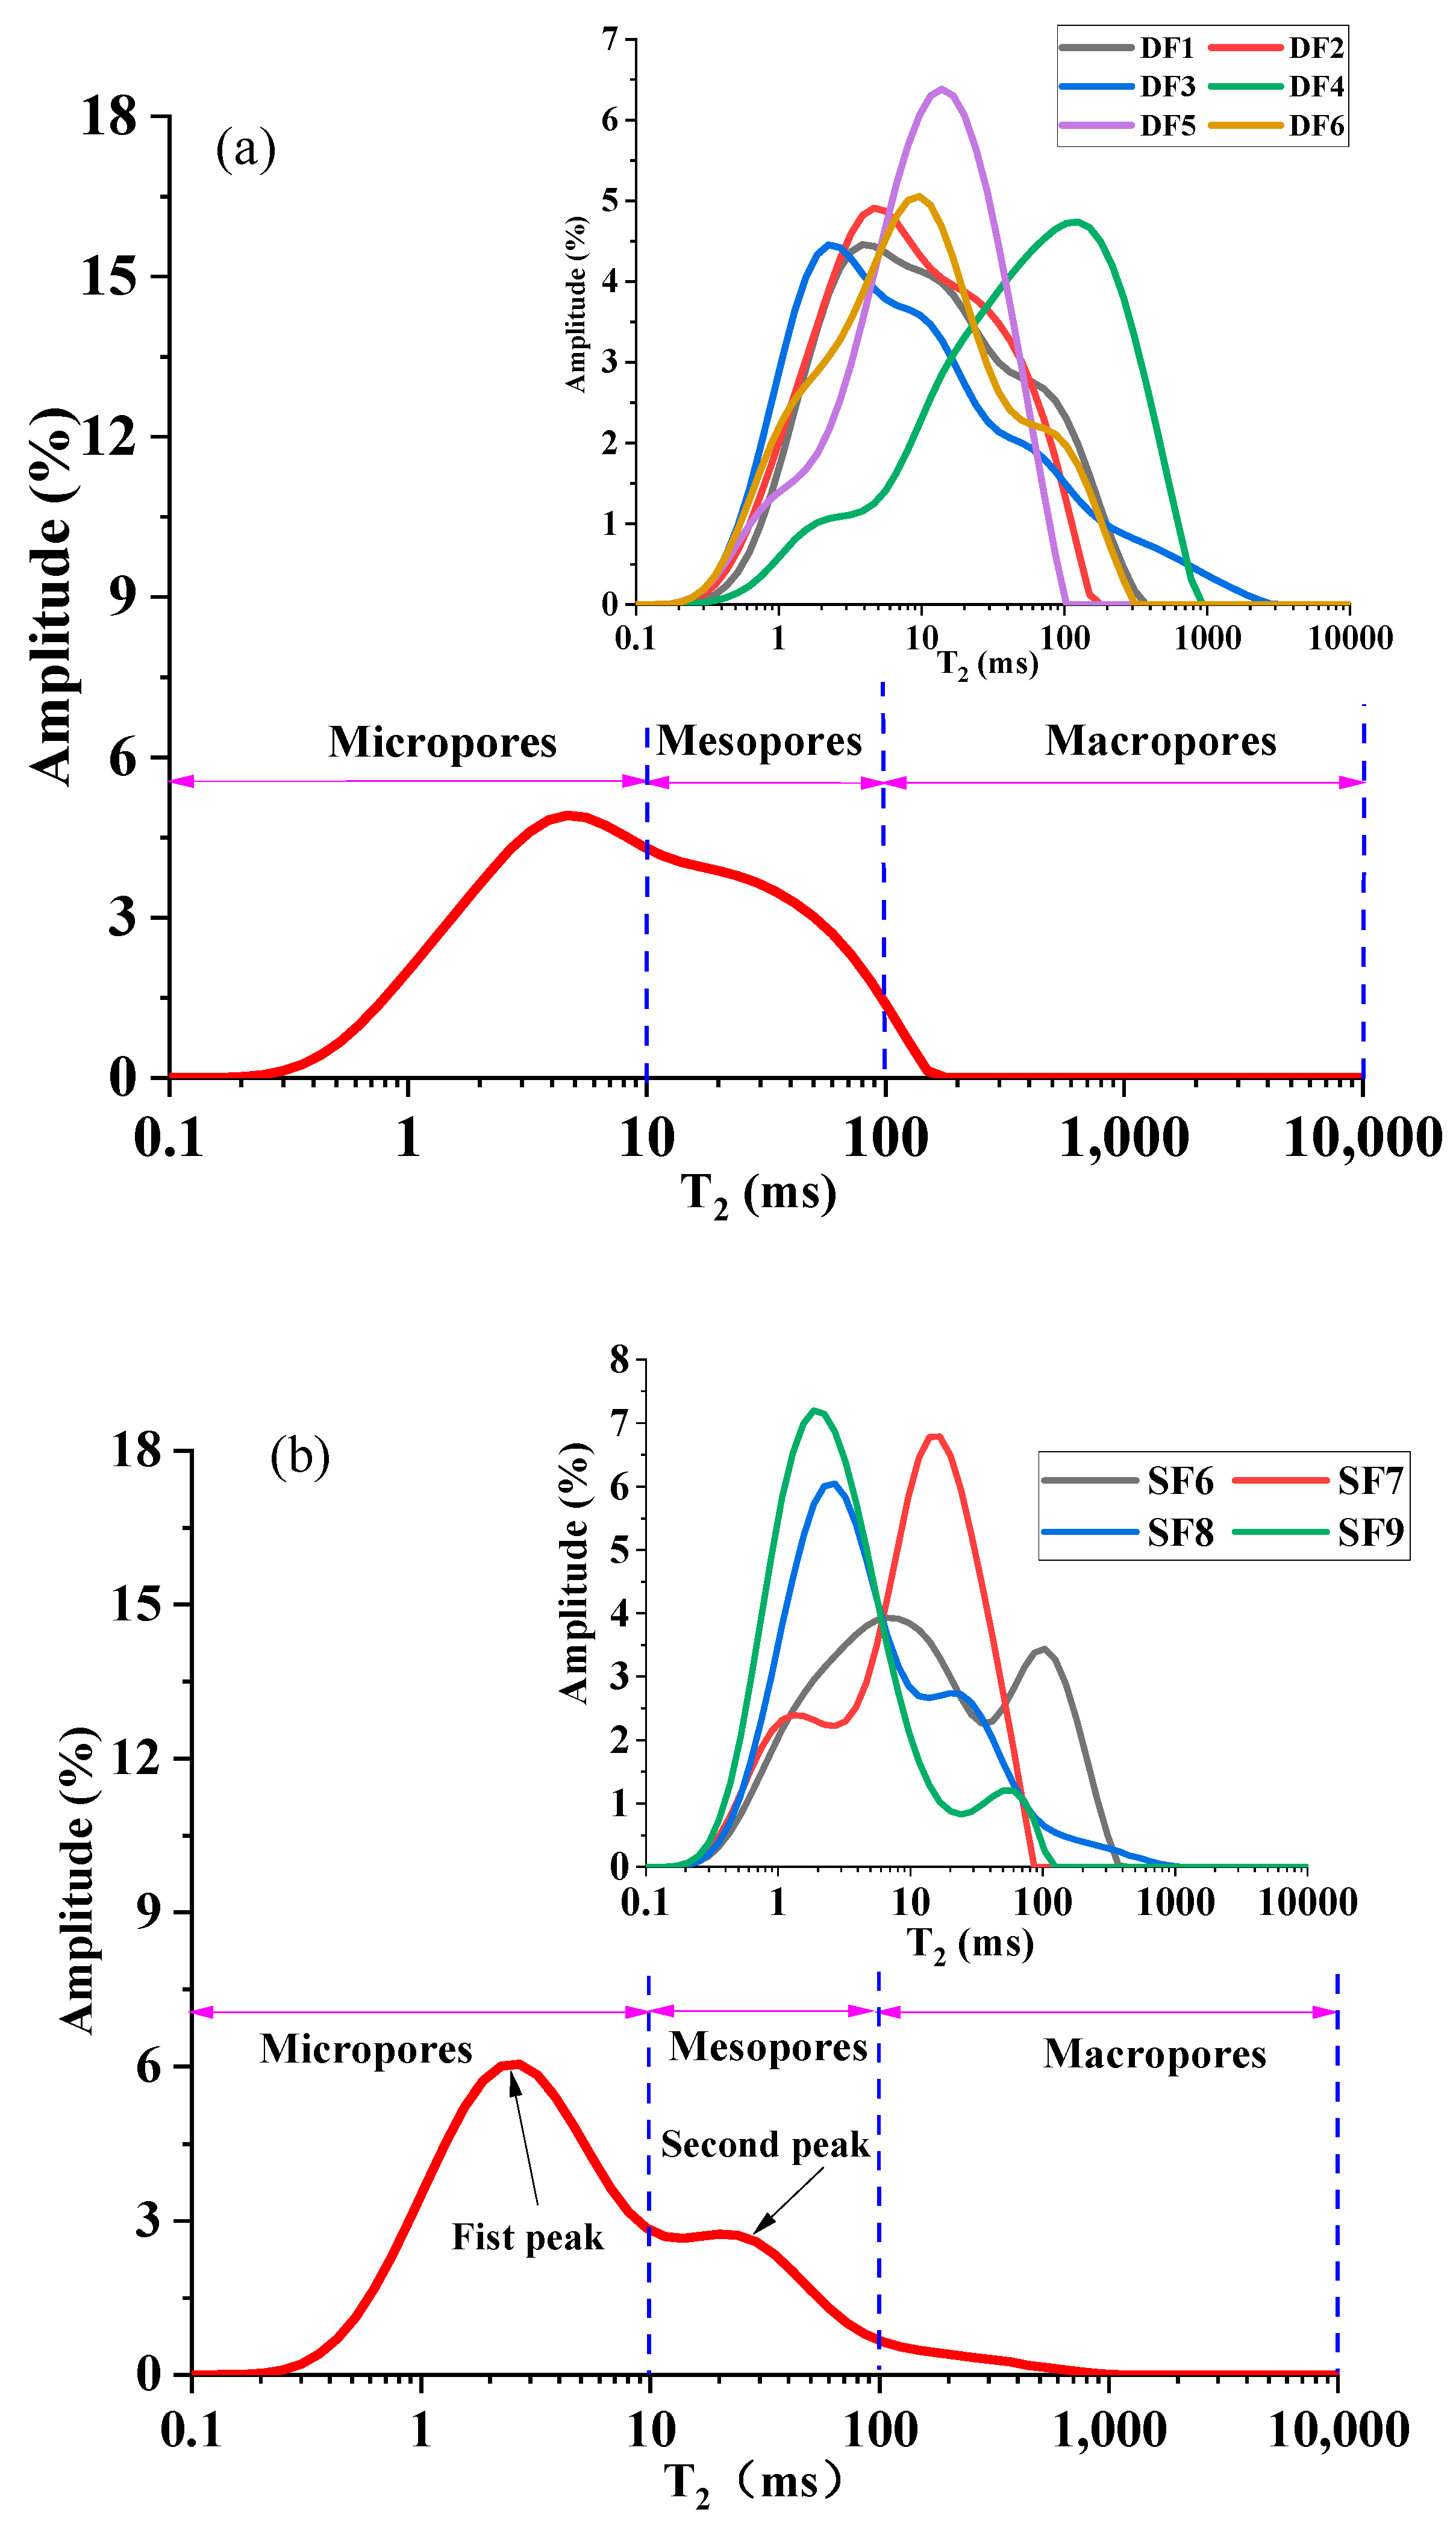
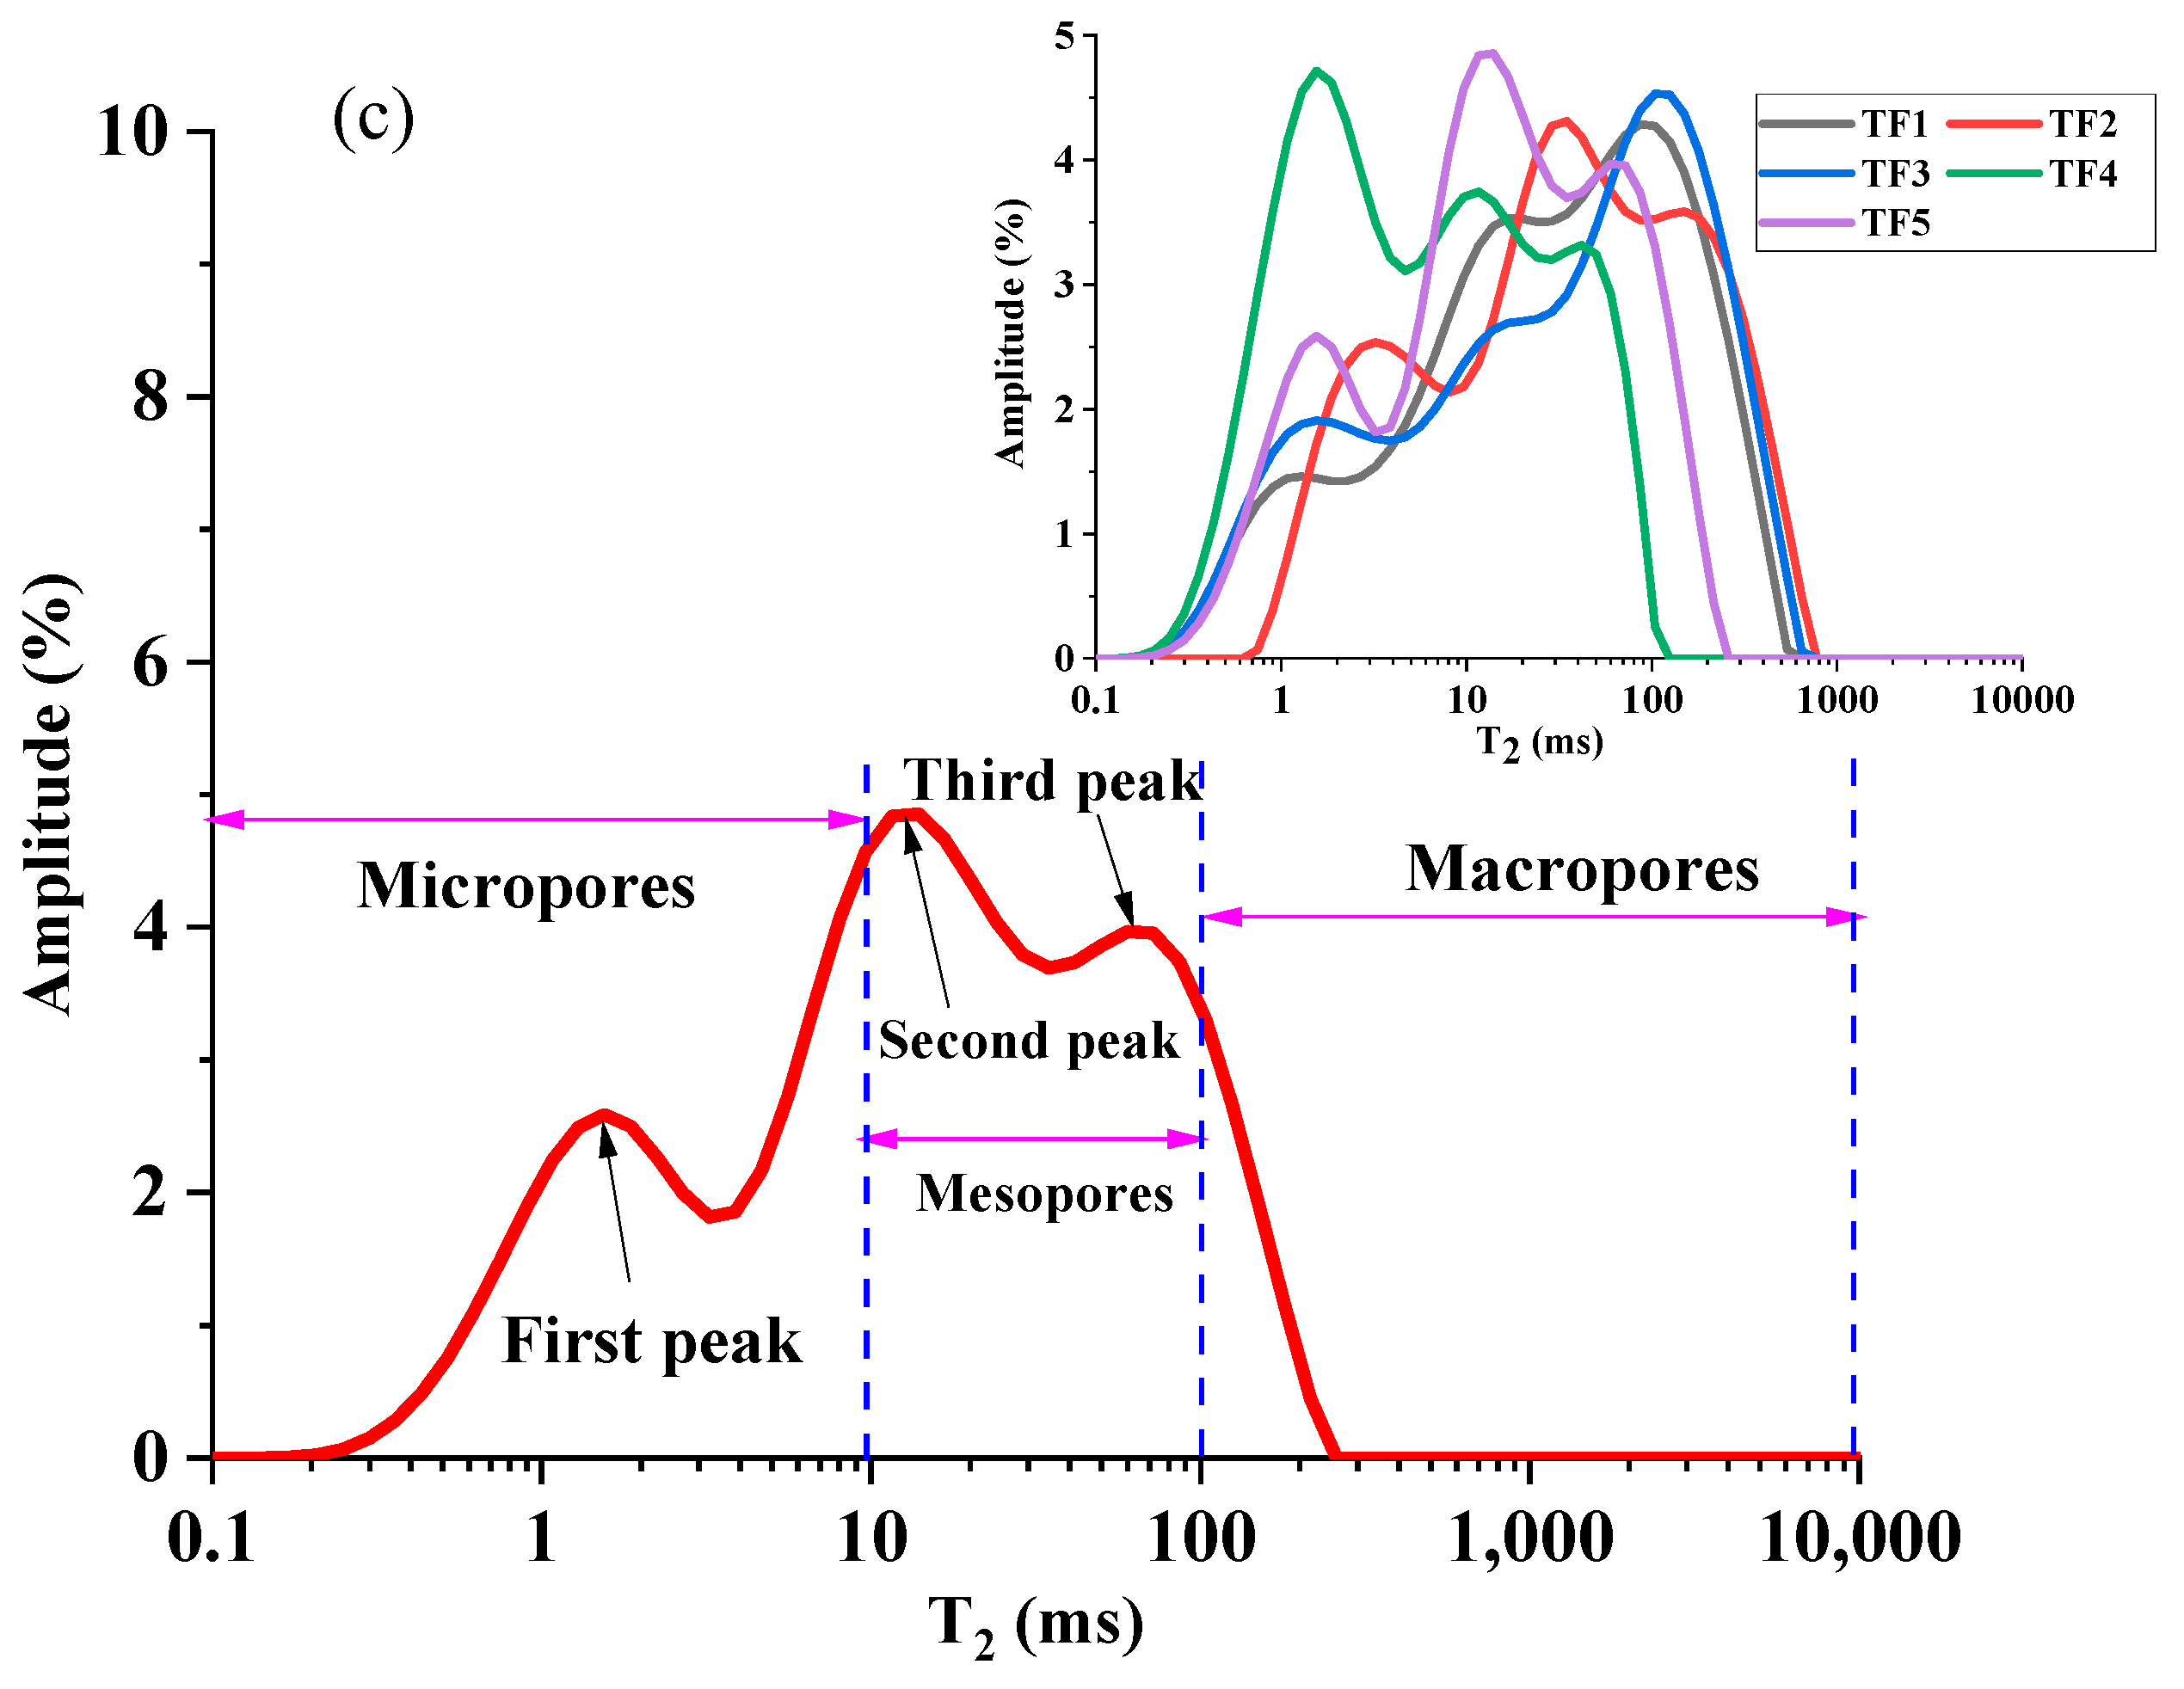
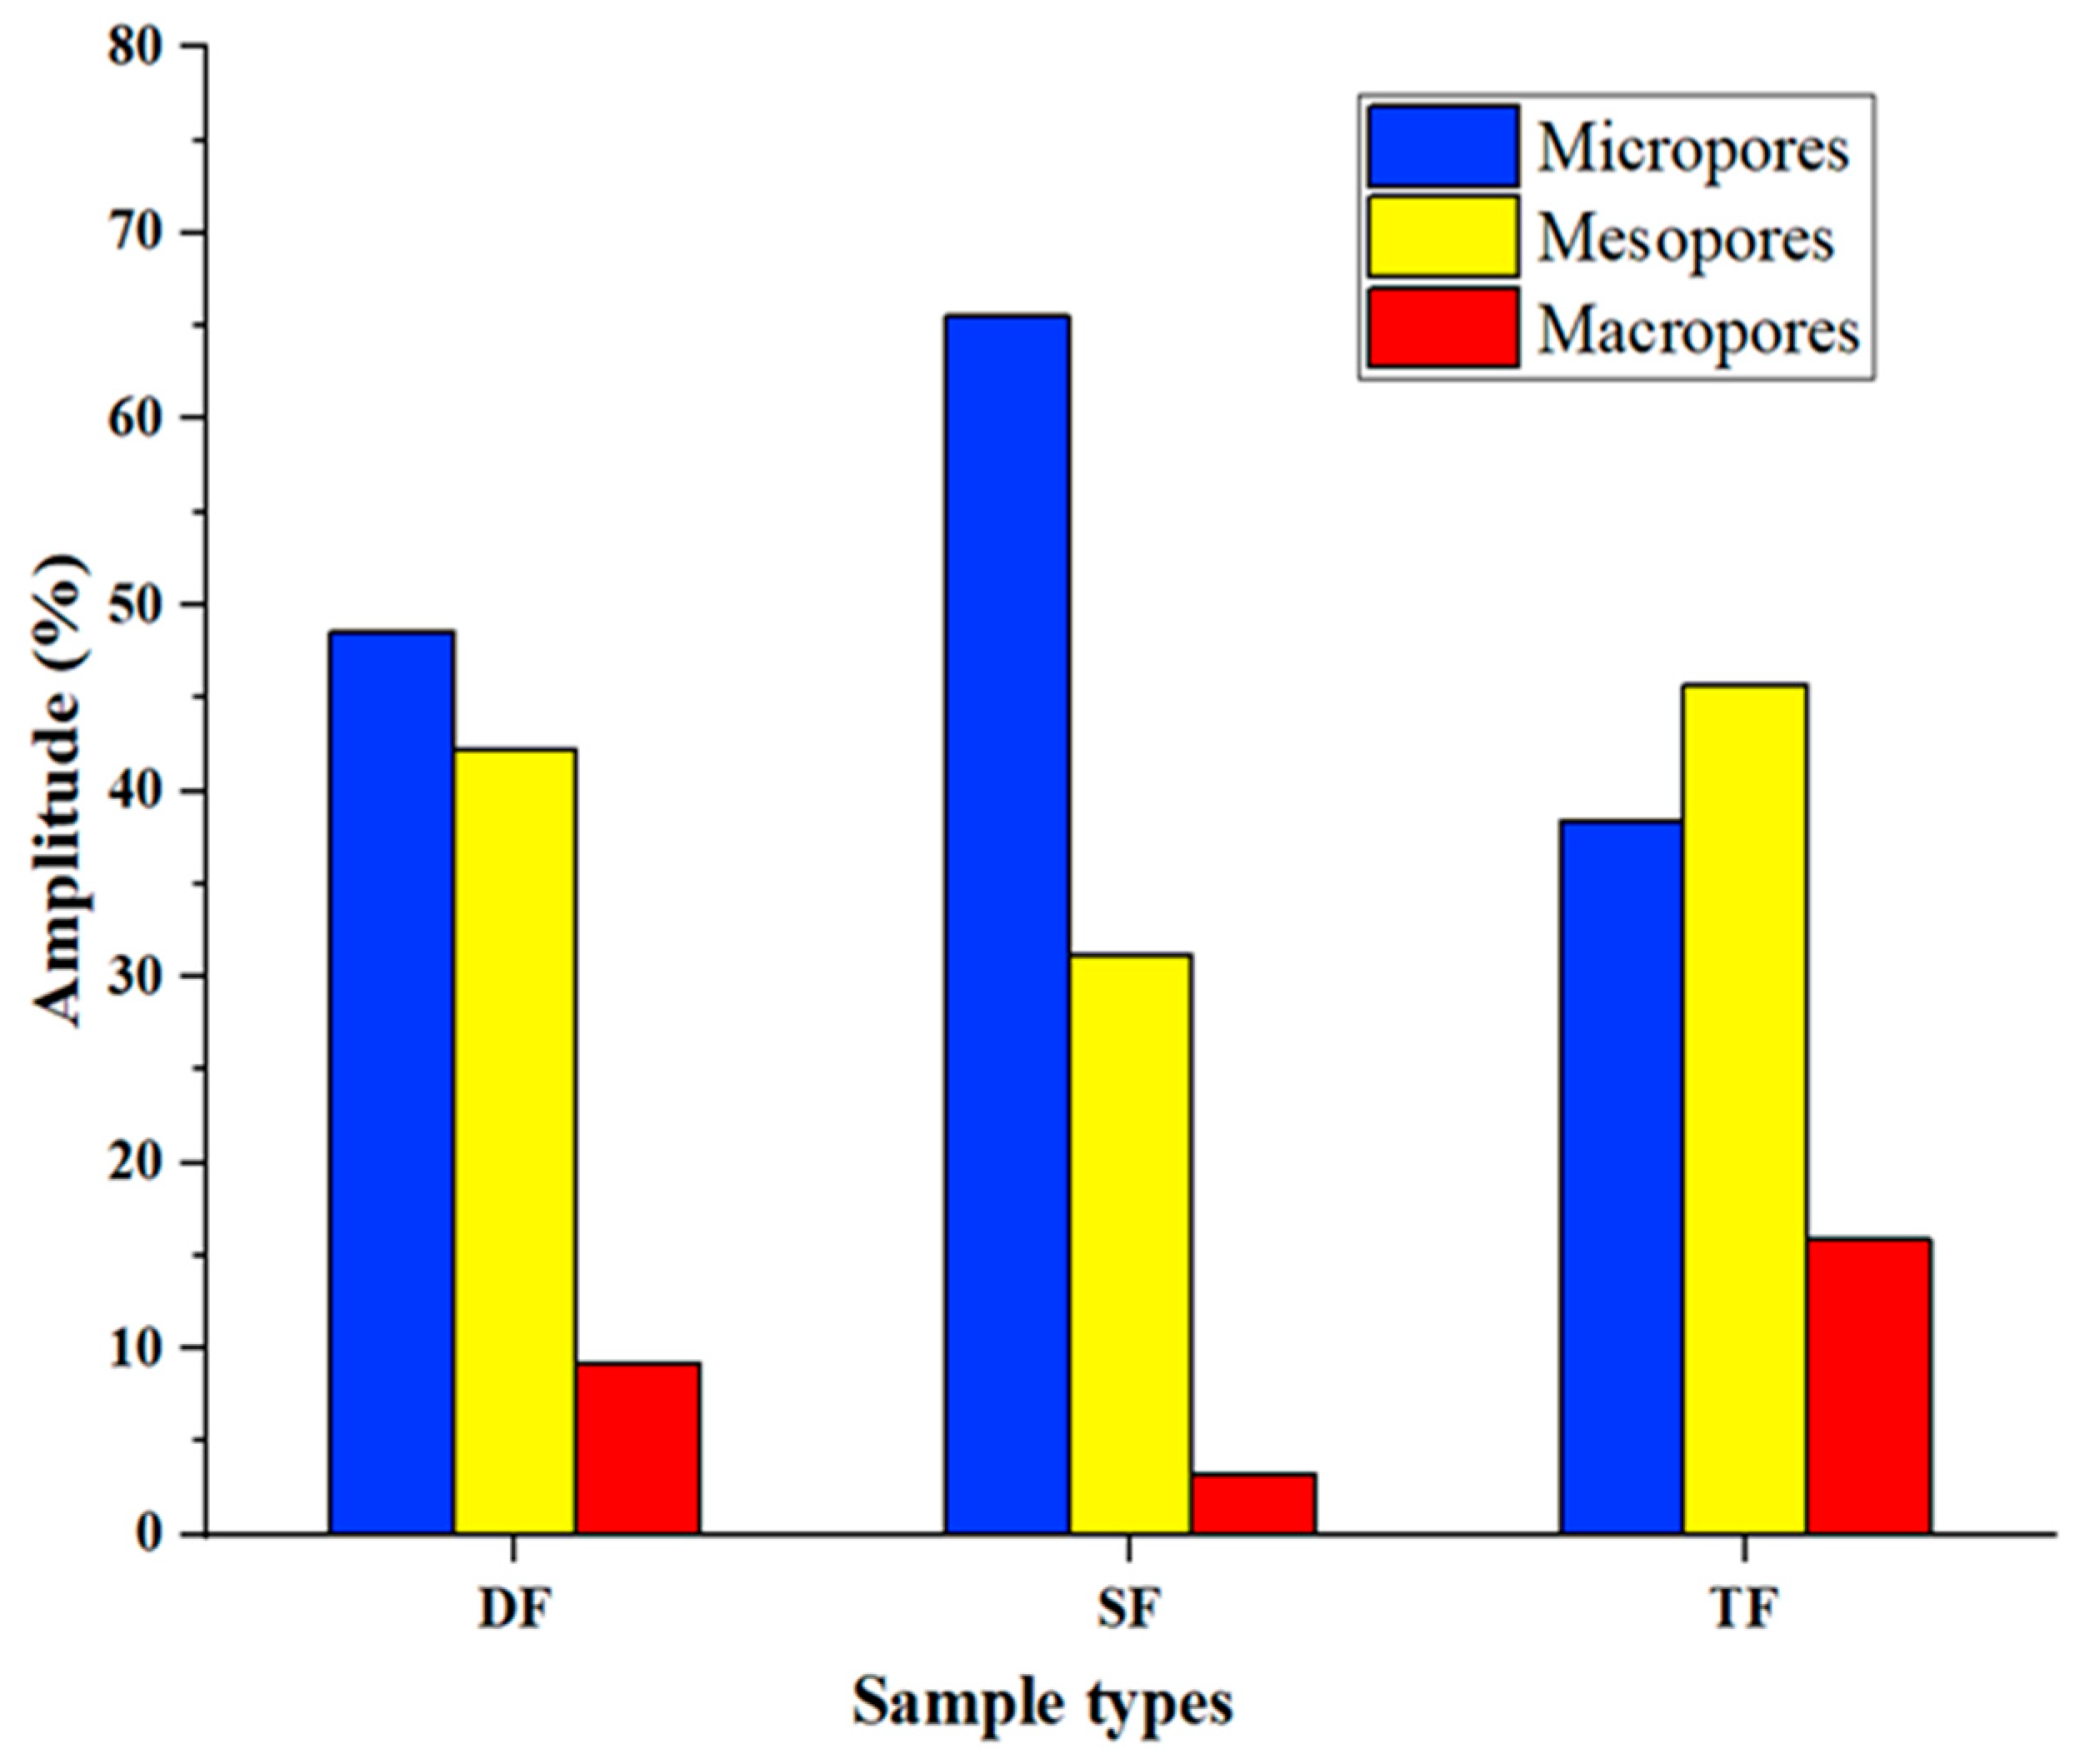
The NMR results of tight limestone show that there are three types of T2 distribution curves, namely, DF, SF, and TF, and the contents of micropores, mesopores, and macropores of the three types of cores are different. Among them, the SF-type tight limestone core has the highest micropore content, with an average of 65.52%. In addition, the average content of macropores in the TF-type tight limestone is 45.68%.
(3)
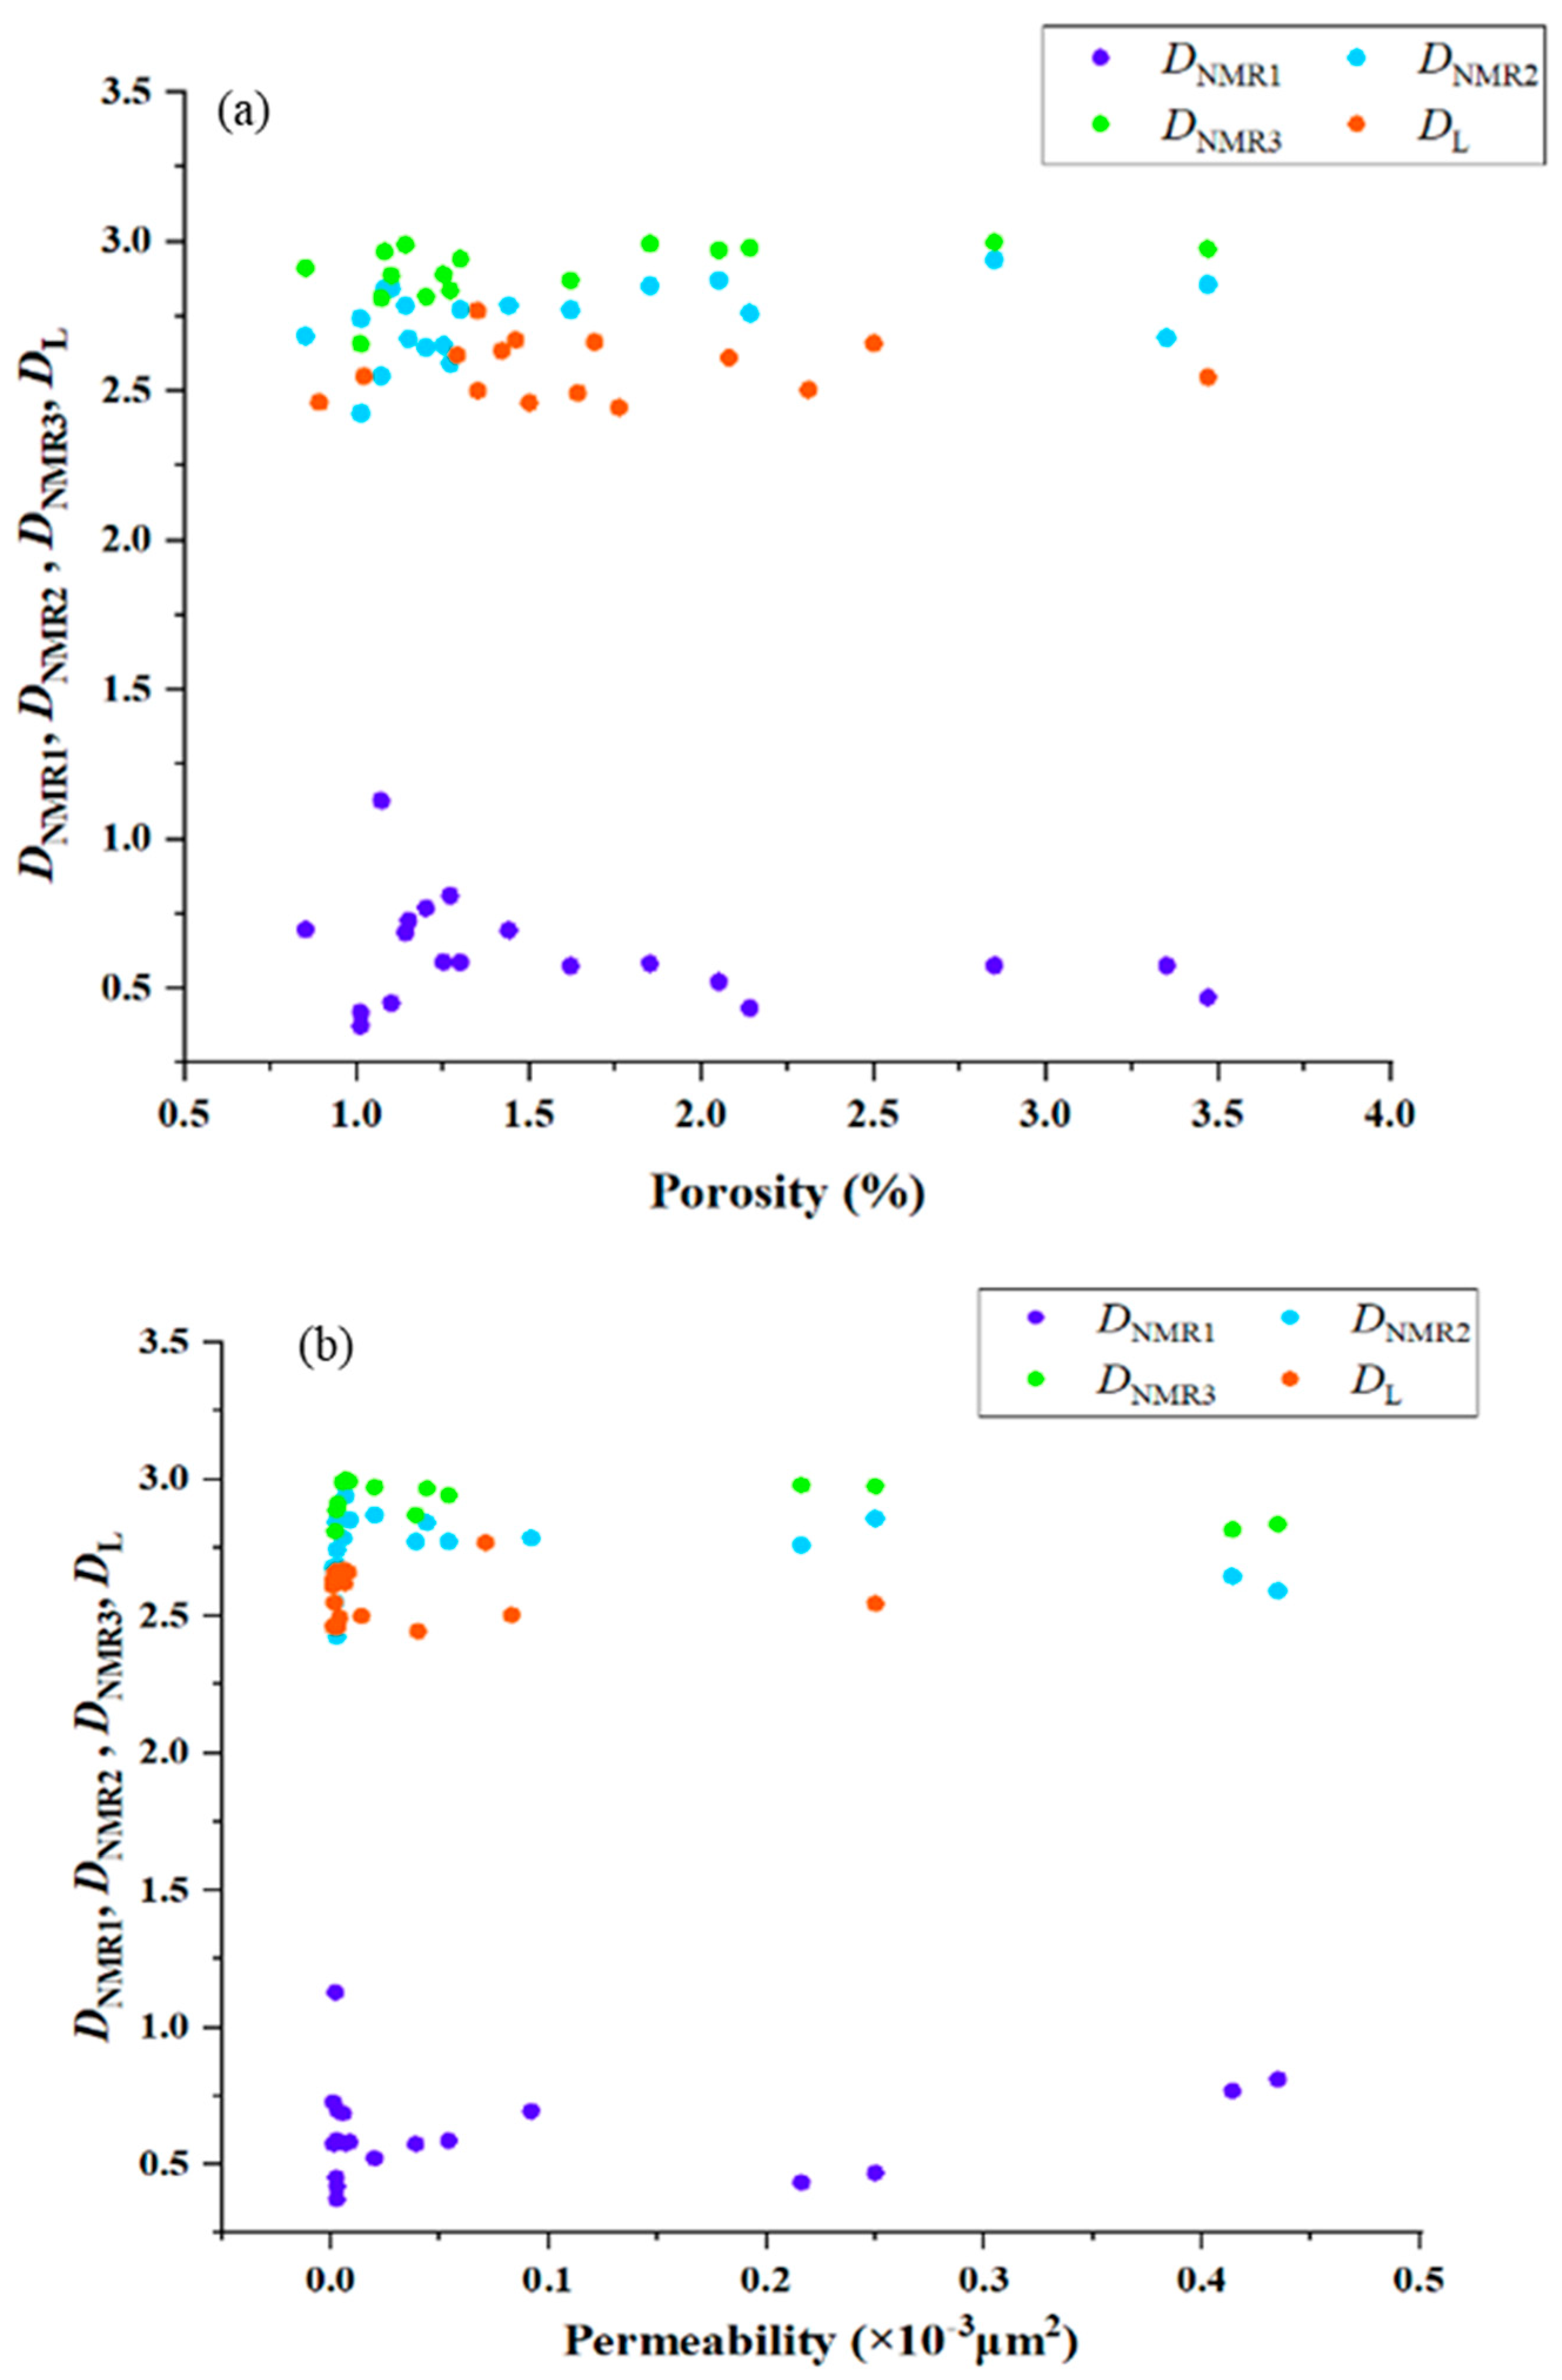
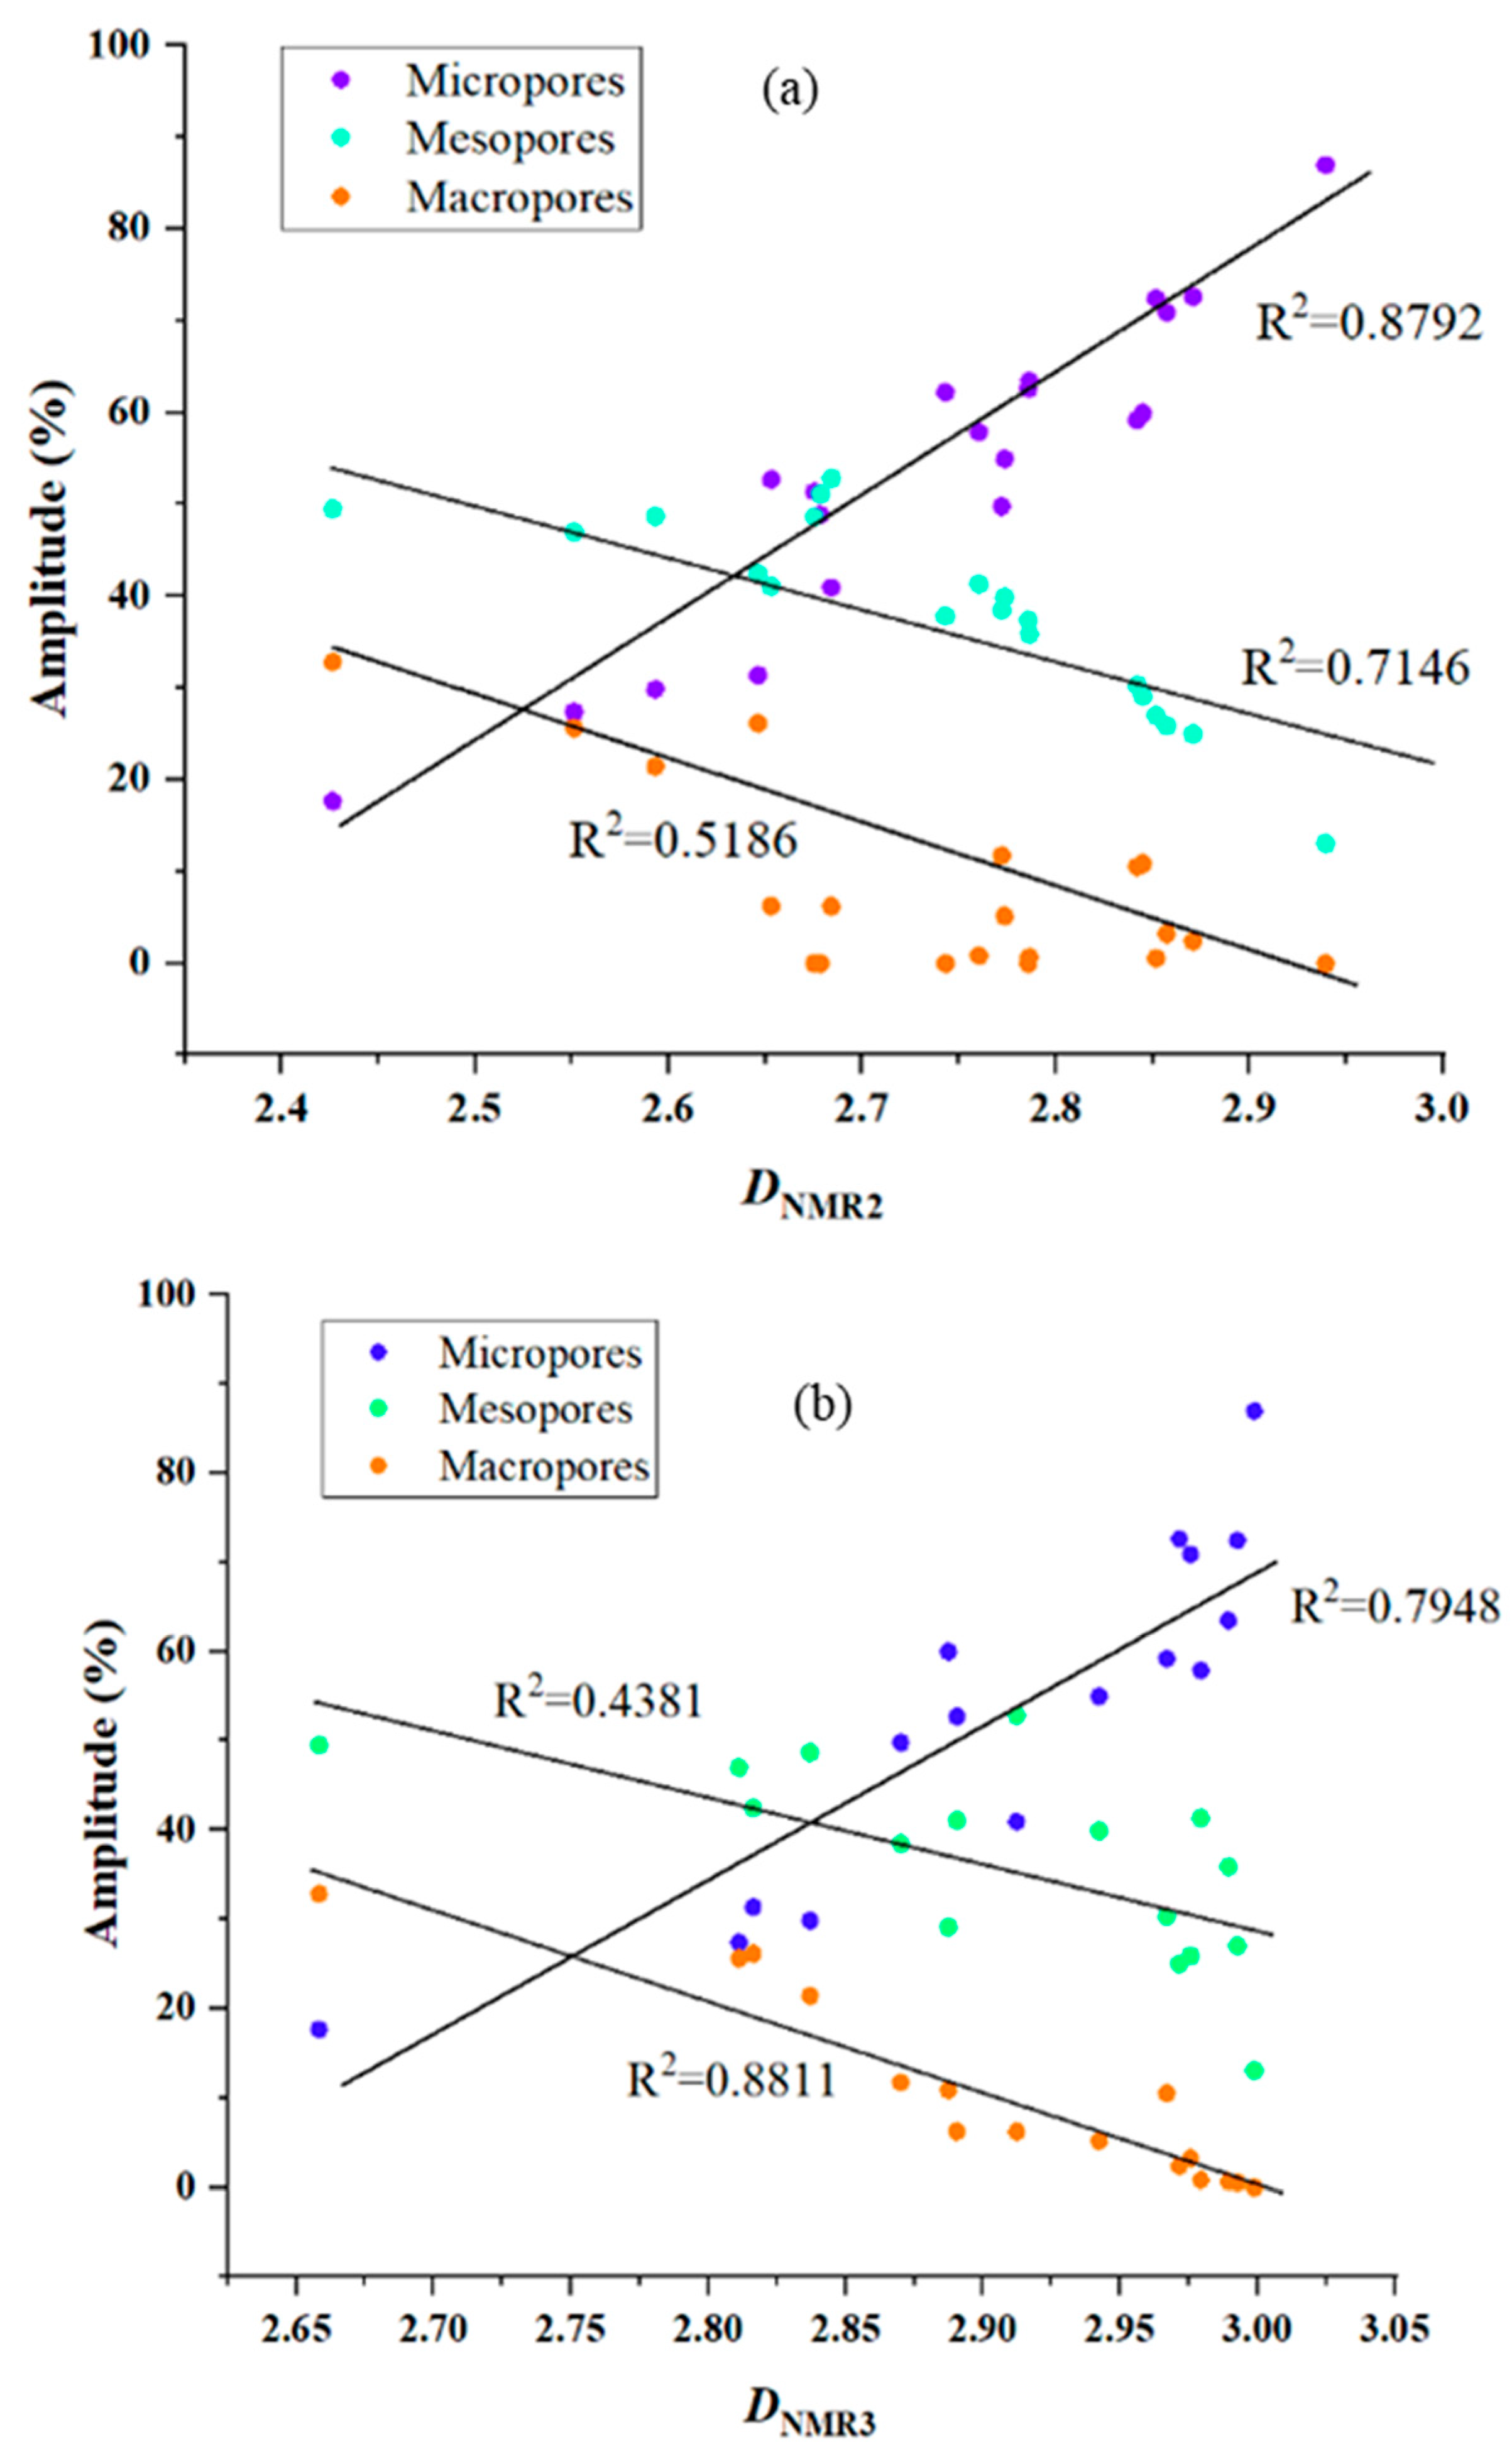
The fractal dimension of LTNA (DL) is between 2.4446 and 2.7688, with an average of 2.5729. There is a good positive correlation between DL and the specific surface area of tight limestone, and there is a good positive correlation between DNMR2, DNMR3, and the content of micropores of tight limestone, which shows that with the increase in micropore content, the surface roughness of the pores in tight limestone is more complex.

Author Contributions

Conceptualization, W.L. and X.Z.; Methodology, W.L., X.Z. and M.L.; Software, X.Z. and M.L.; Validation, W.L. and X.Z.; Formal analysis, W.L., X.Z., M.L. and Y.Z.; Investigation, W.L., X.Z., M.L. and Y.Z.; Resources, W.L. and X.Z.; Data curation, W.L., X.Z., M.L. and Y.Z.; Writing – original draft, W.L., X.Z., M.L. and Y.Z.; Writing – review & editing, W.L., X.Z. and M.L.; Visualization, X.Z. and M.L.; Supervision, W.L.; Funding acquisition, W.L. All authors have read and agreed to the published version of the manuscript.

Funding

This work is funded by the National Science and Technology Major Project (2017ZX05013-001) and the CNPC Innovation Fund (2022DQ02-0102).

Data Availability Statement

The data used to support the findings of this study are available from the corresponding author upon request.

Conflicts of Interest

All authors declare that there are no conflicts of interest in this article.

References

  1. Hughes, J.D. Energy: A reality check on the shale revolution. Nature 2013, 494, 307–308. [Google Scholar] [CrossRef]
  2. Wang, S.; Yu, Y.; Guo, Q.; Wang, S.; Wu, X. New advances in the assessment of tight oil resource in China. Pet. Res. 2017, 2, 1–12. [Google Scholar] [CrossRef]
  3. Hu, S.; Zhu, R.; Wu, S.; Bai, B.; Yang, Z.; Cui, J. Exploration and development of continental tight oil in China. Pet. Explor. Dev. 2018, 45, 790–802. [Google Scholar] [CrossRef]
  4. Zhou, F.; Su, H.; Liang, X.; Meng, L.; Yuan, L.; Li, X.; Liang, T. Integrated hydraulic fracturing techniques to enhance oil recovery from tight rocks. Pet. Explor. Dev. 2019, 46, 1065–1072. [Google Scholar] [CrossRef]
  5. Shen, W.; Li, X.; Lu, X.; Guo, W.; Zhou, S.; Wan, Y. Experimental study and isotherm models of water vapor adsorption in shale rocks. J. Nat. Gas Sci. Eng. 2018, 52, 484–491. [Google Scholar] [CrossRef]
  6. Shen, W.; Song, F.; Hu, X.; Zhu, G.; Zhu, W. Experimental study on flow characteristics of gas transport in micro- and nanoscale pores. Sci. Rep. 2019, 9, 10196. [Google Scholar] [CrossRef] [PubMed]
  7. Sun, Y.; Deng, M.; Ma, S.; Chen, Y.; Yu, L.; Zhang, Y.; Yan, B.; Zhang, Y. Distribution and controlling factors of tight sandstone oil in Fuyu oil layers of Da’an area, Songliao Basin, NE China. Pet. Explor. Dev. 2015, 42, 646–655. [Google Scholar] [CrossRef]
  8. Luo, Y.; Wang, Y.; Liu, H.; Wang, G.; Zhao, Y. Overpressure controlling factors for tectonic fractures in near-source tight reservoirs in the southwest Ordos Basin, China. J. Pet. Sci. Eng. 2019, 188, 106818. [Google Scholar] [CrossRef]
  9. Guo, Q.; Wang, S.; Chen, X. Assessment on tight oil resources in major basins in China. J. Asian Earth Sci. 2019, 178, 52–63. [Google Scholar] [CrossRef]
  10. Yang, Z.; Zou, C.; Hou, L.; Wu, S.; Lin, S.; Luo, X.; Zhang, L.; Zhao, Z.; Cui, J.; Pan, S. Division of fine-grained rocks and selection of “sweet sections” in the oldest continental shale in China: Taking the coexisting combination of tight and shale oil in the Permian Junggar Basin. Mar. Pet. Geol. 2019, 109, 339–348. [Google Scholar] [CrossRef]
  11. Pang, Z.; Tao, S.; Zhang, Q.; Zhang, T.; Yang, J.; Fan, J.; Yuan, M. Enrichment factors and sweep spot evaluation of Jurassic tight oil in central Sichuan Basin, SW China. Pet. Res. 2019, 4, 334–347. [Google Scholar] [CrossRef]
  12. Wang, Y.; Tong, M.; Sun, Y.; Zhang, Y.; Yuan, D. Reservoir and development characteristics of the Da’anzhai tight oil in Sichuan Basin, SW China. Pet. Res. 2019, 4, 212–226. [Google Scholar] [CrossRef]
  13. Cao, J.; Liu, Z.; He, F.; Liu, X.; Deng, W. Analysis of limestone reservoir forming geological conditions of Taiyuan formation in central and eastern Ordos basin. Pet. Geol. Eng. 2022, 36, 41–47. [Google Scholar]
  14. Ni, C.; Yang, J.; Chen, W.; Lin, J.; Hou, G.; Wang, Y. Characteristics and Development Patterns of Tight Limestone Reservoirs: A Case Study of the Daanzhai Formation in the Central Sichuan Basin. Lithol. Reserv. 2015, 27, 38–47. [Google Scholar]
  15. Tian, Z.; Song, X.; Wang, Y.; Ran, Q.; Liu, B.; Xu, Q.; Li, Y. Classification of lacustrine tight limestone considering matrix pores or fractures: A case study of Da’anzhai Member of Jurassic Ziliujing Formation in central Sichuan Basin, SW China. Pet. Explor. Dev. 2017, 44, 234–246. [Google Scholar] [CrossRef]
  16. Zhao, H.; Ning, Z.; Wang, Q.; Zhang, R.; Zhao, T.; Niu, T.; Zeng, Y. Petrophysical characterization of tight oil reservoirs using pressure-controlled porosimetry combined with rate-controlled porosimetry. Fuel 2015, 154, 233–242. [Google Scholar] [CrossRef]
  17. Wu, H.; Zhang, C.; Ji, Y.; Liu, R.; Wu, H.; Zhang, Y.; Geng, Z.; Zhang, Y.; Yang, J. An Improved Method of Characterizing the Pore Structure in Tight oil Reservoirs: Integrated NMR and Constant-Rate-Controlled Porosimetry Data. J. Pet. Sci. Eng. 2018, 166, 778–796. [Google Scholar] [CrossRef]
  18. Zhao, X.; Yang, Z.; Lin, W.; Xiong, S.; Luo, Y.; Wang, Z.; Chen, T.; Xia, D.; Wu, Z. Study on pore structures of tight sandstone reservoirs based on nitrogen adsorption, high-pressure mercury intrusion and rate-controlled mercury intrusion. J. Energy Resour. Technol.-Trans. ASME 2019, 141, 112903. [Google Scholar] [CrossRef]
  19. Zhao, X.; Yang, Z.; Lin, W.; Xiong, S.; Luo, Y.; Liu, X.; Xia, D. Fractal study on pore structure of tight sandstone based on full-scale map. Int. J. Oil Gas Coal Technol. 2019, 22, 123–139. [Google Scholar] [CrossRef]
  20. Volery, C.; Davaud, E.; Durlet, C.; Clavel, B.; Charollais, J.; Caline, B. Microporous and tight limestones in the Urgonian Formation (late Hauterivian to early Aptian) of the French Jura Mountains: Focus on the factors controlling the formation of microporous facies. Sediment. Geol. 2010, 230, 21–34. [Google Scholar] [CrossRef]
  21. Liu, Y.; Zhang, Y.; Wang, Y.; Wang, L. The pore structure of tight limestone—Jurassic Ziliujing Formation, Central Sichuan Basin, China. Appl. Geophys. 2018, 15, 165–174. [Google Scholar] [CrossRef]
  22. Zhao, X.; Yang, Z.; Lin, W.; Xiong, S.; Wei, Y. Characteristics of microscopic pore-throat structure of tight oil reservoirs in Sichuan Basin measured by rate-controlled mercury injection. Open Phys. 2018, 16, 675–684. [Google Scholar] [CrossRef]
  23. Wei, Y. Study on Tight Sandstone Reservoir Characteristics and Development in Sichuan; University of Chinese Academy of Sciences: Beijing, China, 2018. [Google Scholar]
  24. Brunauer, S.; Emmett, P.H.; Teller, E. Adsorption of Gases in Multimolecular Layers. J. Am. Chem. Soc. 1938, 60, 309–319. [Google Scholar] [CrossRef]
  25. Barrett, E.P.; Joyner, L.G.; Halenda, P.P. The Determination of Pore Volume and Area Distributions in Porous Substances. I. Computations from Nitrogen Isotherms. J. Am. Chem. Soc. 1951, 73, 373–380. [Google Scholar] [CrossRef]
  26. Haul, R. Adsorption, surface area and porosity. Z. Phys. Chem. 1969, 63, 220–221. [Google Scholar] [CrossRef]
  27. Naveen, P.; Asif, M.; Ojha, K. Integrated fractal description of nanopore structure and its effect on CH4 adsorption on Jharia coals, India. Fuel 2018, 232, 190–204. [Google Scholar] [CrossRef]
  28. Zhang, Z.; Weller, A. Fractal dimension of pore-space geometry of an Eocene sandstone formation. Geophysics 2014, 79, D377–D387. [Google Scholar] [CrossRef]
  29. Wang, F.; Yang, K.; Cai, J. Fractal characterization of tight oil reservoir pore structure using nuclear magnetic resonance and mercury intrusion porosimetry. Fractals 2018, 26, 1840017. [Google Scholar] [CrossRef]
  30. Lai, J.; Wang, G.; Fan, Z.; Zhou, Z.; Chen, J.; Wang, S. Fractal analysis of tight shaly sandstones using nuclear magnetic resonance measurements. AAPG Bull. 2018, 102, 175–193. [Google Scholar] [CrossRef]
  31. Zheng, S.; Yao, Y.; Liu, D.; Cai, Y.; Liu, Y. Characterizations of full-scale pore size distribution, porosity and permeability of coals: A novel methodology by nuclear magnetic resonance and fractal analysis theory. Int. J. Coal Geol. 2018, 196, 148–158. [Google Scholar] [CrossRef]
  32. Zhang, J.; Deng, H.; Deng, J.; Gao, R. Fractal Analysis of Pore Structure Development of Sandstone: A Nuclear Magnetic Resonance Investigation. IEEE Access 2019, 7, 47282–47293. [Google Scholar] [CrossRef]
  33. Li, C.; Liu, G.; Cao, Z.; Yuan, W.; Wang, P.; You, Y. Analysis of Petrophysical Characteristics and Water Movability of Tight Sandstone Using Low-Field Nuclear Magnetic Resonance. Nat. Resour. Res. 2019, 29, 2547–2573. [Google Scholar] [CrossRef]
  34. Chen, S.; Tang, D.; Tao, S.; Ji, X.; Xu, H. Fractal analysis of the dynamic variation in pore-fracture systems under the action of stress using a low-field NMR relaxation method: An experimental study of coals from western Guizhou in China. J. Pet. Sci. Eng. 2018, 173, 617–629. [Google Scholar] [CrossRef]
  35. Chen, L.; Jiang, Z.; Liu, Q.; Jiang, S.; Liu, K.; Tan, J.; Gao, F. Mechanism of shale gas occurrence: Insights from comparative study on pore structures of marine and lacustrine shales. Mar. Pet. Geol. 2019, 104, 200–216. [Google Scholar] [CrossRef]
  36. Mandelbrot, B.B.; Wheeler, J.A. The fractal geometry of nature. Am. J. Phys. 1998, 51, 468. [Google Scholar] [CrossRef]
  37. Ojha, S.P.; Misra, S.; Tinni, A.; Sondergeld, C.; Rai, C. Pore connectivity and pore size distribution estimates for Wolfcamp and Eagle Ford shale samples from oil, gas and condensate windows using adsorption-desorption measurements. J. Pet. Sci. Eng. 2017, 158, 454–468. [Google Scholar] [CrossRef]
  38. Zhao, P.; Wang, L.; Xu, C.; Fu, J.; Shi, Y.; Mao, Z.; Xiao, D. Nuclear magnetic resonance surface relaxivity and its advanced application in calculating pore size distributions. Mar. Pet. Geol. 2020, 111, 66–74. [Google Scholar] [CrossRef]
  39. Zhao, P.; Wang, X.; Cai, J.; Luo, M.; Zhang, J.; Liu, Y.; Rabiei, M.; Li, C. Multifractal analysis of pore structure of Middle Bakken formation using low temperature N2 adsorption and NMR measurements. J. Pet. Sci. Eng. 2019, 176, 312–320. [Google Scholar] [CrossRef]
  40. Thommes, M.; Kaneko, K.; Neimark, A.V.; Olivier, J.P.; Rodriguez-Reinoso, F.; Rouquerol, J.; Sing, K.S.W. Physisorption of gases, with special reference to the evaluation of surface area and pore size distribution (IUPAC Technical Report). Pure Appl. Chem. 2015, 87, 1051–1069. [Google Scholar] [CrossRef]
  41. Chen, T.; Yang, Z.; Ding, Y.; Luo, Y.; Qi, D.; Lin, W.; Zhao, X. Waterflooding Huff-n-puff in Tight Oil Cores Using Online Nuclear Magnetic Resonance. Energies 2018, 11, 1524. [Google Scholar] [CrossRef]
  42. Sun, W.; Zuo, Y.; Wu, Z.; Liu, H.; Xi, S.; Shui, Y.; Wang, J.; Liu, R.; Lin, J. Fractal analysis of pores and the pore structure of the Lower Cambrian Niutitang shale in northern Guizhou province: Investigations using NMR, SEM and image analyses. Mar. Pet. Geol. 2019, 99, 416–428. [Google Scholar] [CrossRef]
  43. Wang, J.; Cao, Y.; Liu, K.; Gao, Y.; Qin, Z. Fractal characteristics of the pore structures of fine-grained, mixed sedimentary rocks from the Jimsar Sag, Junggar Basin: Implications for lacustrine tight oil accumulations. J. Pet. Sci. Eng. 2019, 182, 106363. [Google Scholar] [CrossRef]
Figure 1. SEM and CT photographs of tight limestone in the study block [23]. (a) SEM image containing microfracture. (b) SEM image containing microfractures. (c) SEM image containing microfracture. (d) SEM image containing intragranular pores. (e) SEM image containing intergranular pores. (f) CT images containing microfractures.
Fractalfract 08 00371 g001
Figure 2. LTNA adsorption–desorption isotherm curve of tight limestone.
Fractalfract 08 00371 g002
Figure 3. Pore volume difference curve of the LTNA of tight limestone. (a) H3 hysteresis loop. (b) H4 hysteresis loop.
Fractalfract 08 00371 g003
Figure 4. Relationship between permeability, porosity, and average pore radius and pore volume. (a) The relationship between permeability and average pore radius. (b) The relationship between porosity and pore volume.
Fractalfract 08 00371 g004
Figure 5. T2 distribution of tight limestone. (a) DF type. (b) SF type. (c) TF type.
Fractalfract 08 00371 g005aFractalfract 08 00371 g005b
Figure 6. Different pore space amplitudes of three types of tight limestone.
Fractalfract 08 00371 g006
Figure 7. Relationship between Ln(V/V0) and Ln[Ln(P0/P)]. (a) fractal dimension of H3 type. (b) fractal dimension of H4 type.
Fractalfract 08 00371 g007
Figure 8. T2 fractal spectrum of tight limestone. (a) fractal dimension of DF5 sample. (b) fractal dimension of SF1 sample. (c) fractal dimension of TF5 sample.
Fractalfract 08 00371 g008
Figure 9. Relationships between DL and the physical parameters of tight limestone. (a) The relationship between DL and permeability. (b) The relationship between DL and porosity. (c) The relationship between DL and specific surface. (d) The relationship between DL and average pore radius.
Fractalfract 08 00371 g009
Figure 10. Intersecting graph of fractal dimension and porosity and permeability. (a) The relationship between porosity and fractal dimension. (b) The relationship between permeability and fractal dimension.
Fractalfract 08 00371 g010
Figure 11. Relationship between the fractal dimension of NMR and different pore amplitudes. (a) The relationship between DNMR2 and pore space amplitudes. (b) The relationship between DNMR3 and pore space amplitudes.
Fractalfract 08 00371 g011
Table 1. LTNA test data of different samples.
SampleDepthLithologyφKApVcraDL
S12514.37~2516.06Limestone1.460.006001.152.8713.252.6698
S22517.56~2519.43Limestone2.310.083000.643.6617.632.5046
S32577.88~2579.35Limestone1.420.000840.110.3523.902.6356
S42579.35~2580.68Limestone1.350.014000.201.7936.042.5007
S52825.99~2827.59Limestone1.760.040000.312.7024.292.4446
S62841.91~2843.56Limestone1.640.004000.251.8827.512.4933
S72666.12~2667.36Limestone1.690.002101.523.6818.592.6648
S82672.69~2674.56Limestone1.020.001600.211.3733.792.5496
S92679.78~2682.04Limestone1.290.006400.391.7726.782.6208
S102857.60~2858.60Limestone1.350.071002.062.248.712.7688
S112874.00~2875.10Limestone0.890.000840.121.6444.892.4628
S122878.25~2879.43Limestone1.500.003000.323.0029.982.4606
S132151.53~2153.70Limestone3.470.250000.924.8115.412.5464
S141723.09~1725.29Limestone2.500.007901.654.4418.012.6604
S151725.29~1727.32Limestone2.080.000791.515.2621.012.6114
Note: φ: porosity, in %; K: permeability, in ×10−3 μm2; Ap: specific surface, in m2/g; Vc: pore volume, in mm3/g; ra: average pore radius, in nm; and DL: fractal dimension (dimensionless).
Table 2. NMR test data of different samples.
SampleLithologyφ/%K/×10−3 μm2DNMR1DNMR2DNMR3Ω1/%Ω2/%Ω3/%
DF1Limestone1.250.002600.58972.65292.890552.7141.056.24
DF2Limestone2.140.216000.43472.76032.979457.8741.300.83
DF3Limestone1.080.044000.62622.84202.967059.1830.3110.51
DF4Limestone1.010.002600.37442.42632.658217.6649.5032.84
DF5Limestone3.350.001100.57692.6783/48.8951.110.00
DF6Limestone1.300.054000.58752.77352.942354.9639.895.15
SF1Limestone2.050.020000.52332.87092.971672.6125.012.38
SF2Limestone1.850.008500.58292.85172.992772.4227.030.55
SF3Limestone1.140.005400.68762.78632.989563.4635.860.68
SF4Limestone1.100.002400.45192.84492.887459.9729.1410.89
SF5Limestone1.010.002600.41992.7429/62.1937.810.00
SF6Limestone1.620.039000.57542.77212.870149.7938.4711.74
SF7Limestone1.150.000980.72862.6752/51.3648.640.00
SF8Limestone3.470.250000.46942.85732.975670.9025.873.23
SF9Limestone2.850.006700.57742.93952.998986.9413.060.00
TF1Limestone1.270.435000.81152.59302.837129.8648.7021.44
TF2Limestone1.070.002001.12932.55092.811127.3846.9925.63
TF3Limestone1.200.414000.77022.64602.816331.3742.4726.16
TF4Limestone1.440.092000.69502.7859/62.6137.390.00
TF5Limestone0.850.003000.69692.68392.912340.9452.836.23
Disclaimer/Publisher’s Note: The statements, opinions and data contained in all publications are solely those of the individual author(s) and contributor(s) and not of MDPI and/or the editor(s). MDPI and/or the editor(s) disclaim responsibility for any injury to people or property resulting from any ideas, methods, instructions or products referred to in the content.

