Article

Multifractal Characteristics of Gain Structures: A Universal Law of Polycrystalline Strain-Hardening Behaviors

1
School of Materials Science and Engineering, Dongguan University of Technology, Dongguan 523808, China
2
Guangdong Provincial Key Laboratory of Extreme Conditions, Dongguan 523803, China
3
School of Physics and Sino-French Institute of Nuclear Engineering and Technology, Sun Yat-sen University, Guangzhou 510275, China
*
Authors to whom correspondence should be addressed.
Fractal Fract. 2024, 8(9), 504; https://doi.org/10.3390/fractalfract8090504
Submission received: 3 July 2024 / Revised: 17 August 2024 / Accepted: 20 August 2024 / Published: 27 August 2024

Abstract

:
The quantitative relationship between material microstructures, such as grain distributions, and the nonlinear strain-hardening behaviors of polycrystalline metals has not yet been completely understood. This study finds that the grain correlation dimension of polycrystals D is universally equal to the reciprocal of the strain-hardening exponent by experimental research and fractal geometry analysis. From a geometric perspective, the correlation dimension of grains is consistent with that of the equivalent plastic strain field, which represents the correlation dimension of the material manifold. According to the definition of the Hausdorff measure and Ludwik constitutive model, the strain-hardening exponent represents the exponent derived from the Dth root of the measure relationship. This universal law indicates that the strain-hardening behaviors are fractal geometrized and that the strain-hardening exponent represents a geometrical parameter reflecting the multifractal characteristics of grain structures. This conclusion can enhance the comprehension of the relationship between microstructure and mechanical properties of materials and highlights the importance of designing materials with non-uniform grain distributions to achieve desired hardening properties.

1. Introduction

Structure–property relationships [1] have long been an important issue in many fields, such as physics [2], chemistry [3], and biology [4]. This is undoubtedly crucial for designing materials with prescribed properties. In materials science, nonlinear strain-hardening ability is a vital mechanical property that reflects the strength, hardness, and plastic deformation capacity of metallic materials. As a performance indicator, the strain-hardening exponent (SHE) characterizes the strain-hardening ability, as defined by a widely accepted constitutive model, the Ludwik constitutive model [5]:
σ = σ s + K ( ε e q p ) n ,
where σ is the equivalent stress; σ s is the Von Mises yield stress; K is the strength coefficient at the initial yielding; ε e q p is the macroscopic equivalent plastic strain (EPS); and n is the SHE. Accordingly, a substantial amount of research has been conducted on how to control the strain-hardening ability of various material systems [6,7,8,9,10]. Although the influence of the grain boundary, as a geometric constraint, on hardening behavior has been broadly recognized [11], the quantitative relationship between the grain boundary and the SHE remains unclear.
According to the gauge theory of dislocations and disclinations [12], the elastic field of a material exhibits the symmetry of Euclidean groups E(3) ( S O ( 3 ) T ( 3 ) ). Meanwhile, plastic deformations (i.e., dislocations and disclinations) can change these symmetries, resulting in the broken symmetry of a system. Therefore, the macroscopic initial yielding of materials in mechanics represents a typical critical phenomenon [13]. When the order parameter is defined as the EPS, the Ludwik constitutive model can be considered to represent the scaling behavior of the critical phenomenon. As is well known, the physical picture describing the phase transition of a system exhibits self-similarity, which is a typical fractal characteristic, near the critical point [14]. To determine scales associated with critical behaviors in an intuitive and easily comprehensible manner, the fractal characteristics of various systems, such as fractal dimensions, have been widely studied [15,16,17]. Based on the above methodology, the simultaneous evolution between surface fractal dimensions of materials and the SHE has been demonstrated [18,19]. The gauge theory of dislocations and disclinations provides an outstanding method for quantitatively describing material plastic deformation, but it does not discuss in depth the structure–property relationship between the material manifold and its properties. Scholars have acknowledged that the investigation of critical phenomena in systems can commence by examining the fractal characteristics of said systems. However, with regard to the hardening behavior exhibited by metallic materials, researchers have thus far only identified the evolutionary correlation between the box dimension of dislocation walls in monocrystal materials and the SHE. A quantitative relationship between the dimension and SHE has not been established, nor has any related research been conducted on polycrystalline materials. Furthermore, the physical nature underlying these relationships should be further explored, even when the factors are identified.
This study aims to establish the quantitative relationship between the fractal dimension and SHE in polycrystalline materials and revealing the physical nature underlying these relationships, given that the grain boundary is the main factor affecting the SHE [11], this study analyzes pure aluminum, copper, and titanium polycrystalline materials and considers unimodal, bimodal, and twinning grain characteristics. Through fractal characteristics analysis, this study investigates the relationship between the grain correlation dimension and SHE for all the considered materials and determines a universal law of polycrystalline strain-hardening behaviors. The results presented in this study allow for geometrization in strain-hardening behaviors and reveal the significance of investigating heterogeneity in polycrystalline materials.

2. Method and Experiment

2.1. Correlation Dimension of Polycrystalline Materials

Initially, the correlation dimension was used to calculate the dimension of the strange attractor of chaotic systems in the phase space [20]. The correlation dimension [21,22,23] denotes a measure of dimensionality of a space occupied by a set of random points, often referred to as a type of fractal dimension. The correlation dimension considers the non-uniformity of the point set. Grassberger and Procaccia [24] proposed fixing a reference point x on the strange attractor and defined Nx(r) as the number of adjacent points centered on point x with a radius r. The number of points within a ball region follows a power–law relationship, which is expressed by:
N x ( r ) r d x ,
where dimension dx corresponds to the pointwise dimension at the location of point x.
All the phase points within the strange attractor constitute a field of pointwise dimensions, and the scale associated with the mean of Nx(r) represents the correlation dimension D of the strange attractor. Thus, it holds that:
N m ( r ) r D .
In fact, the correlation dimension better captures the fractal characteristics of polycrystalline material grains, as evident from its definition. However, previous research in materials science has predominantly relied on the box dimension [18,19], neglecting this more appropriate dimension for describing random point sets. Therefore, this study abstracts each grain to its centroid, as shown in Figure 1a. The point density that corresponds to the grain fineness number is determined by the size, distribution, and configurational complexity of grain boundaries. The correlation dimension characterizes the approximate similarity of systems, which exists in a specific range of scales [20]. As shown in Figure 1b, for polycrystalline materials, the lower bound measure scale of the correlation dimension should equal the maximum grain size ρ; the upper bound denotes the maximum scale of samples or the minimum subsystem scale L, which represents the minimum statistical representative window [25] that describes the macroscopic isotropy of the material with special periodic or quasi-periodic microstructures. Notably, due to the discreteness of grain sizes, the number of grains obtained at different radii should exhibit a stepped distribution, and its mean value needs to be calculated. The correlation dimension of polycrystalline material can be obtained by fitting the slope of a linear approximation to the mean number corresponding to the radius using Equation (3). Therefore, this study selects four radii between the lower (i.e., the average grain size) and upper bounds (i.e., four times the average grain size considering the maximum range of the Electron Backscatter Diffraction (EBSD) image in the considered cases) to obtain the correlation dimension of a material.

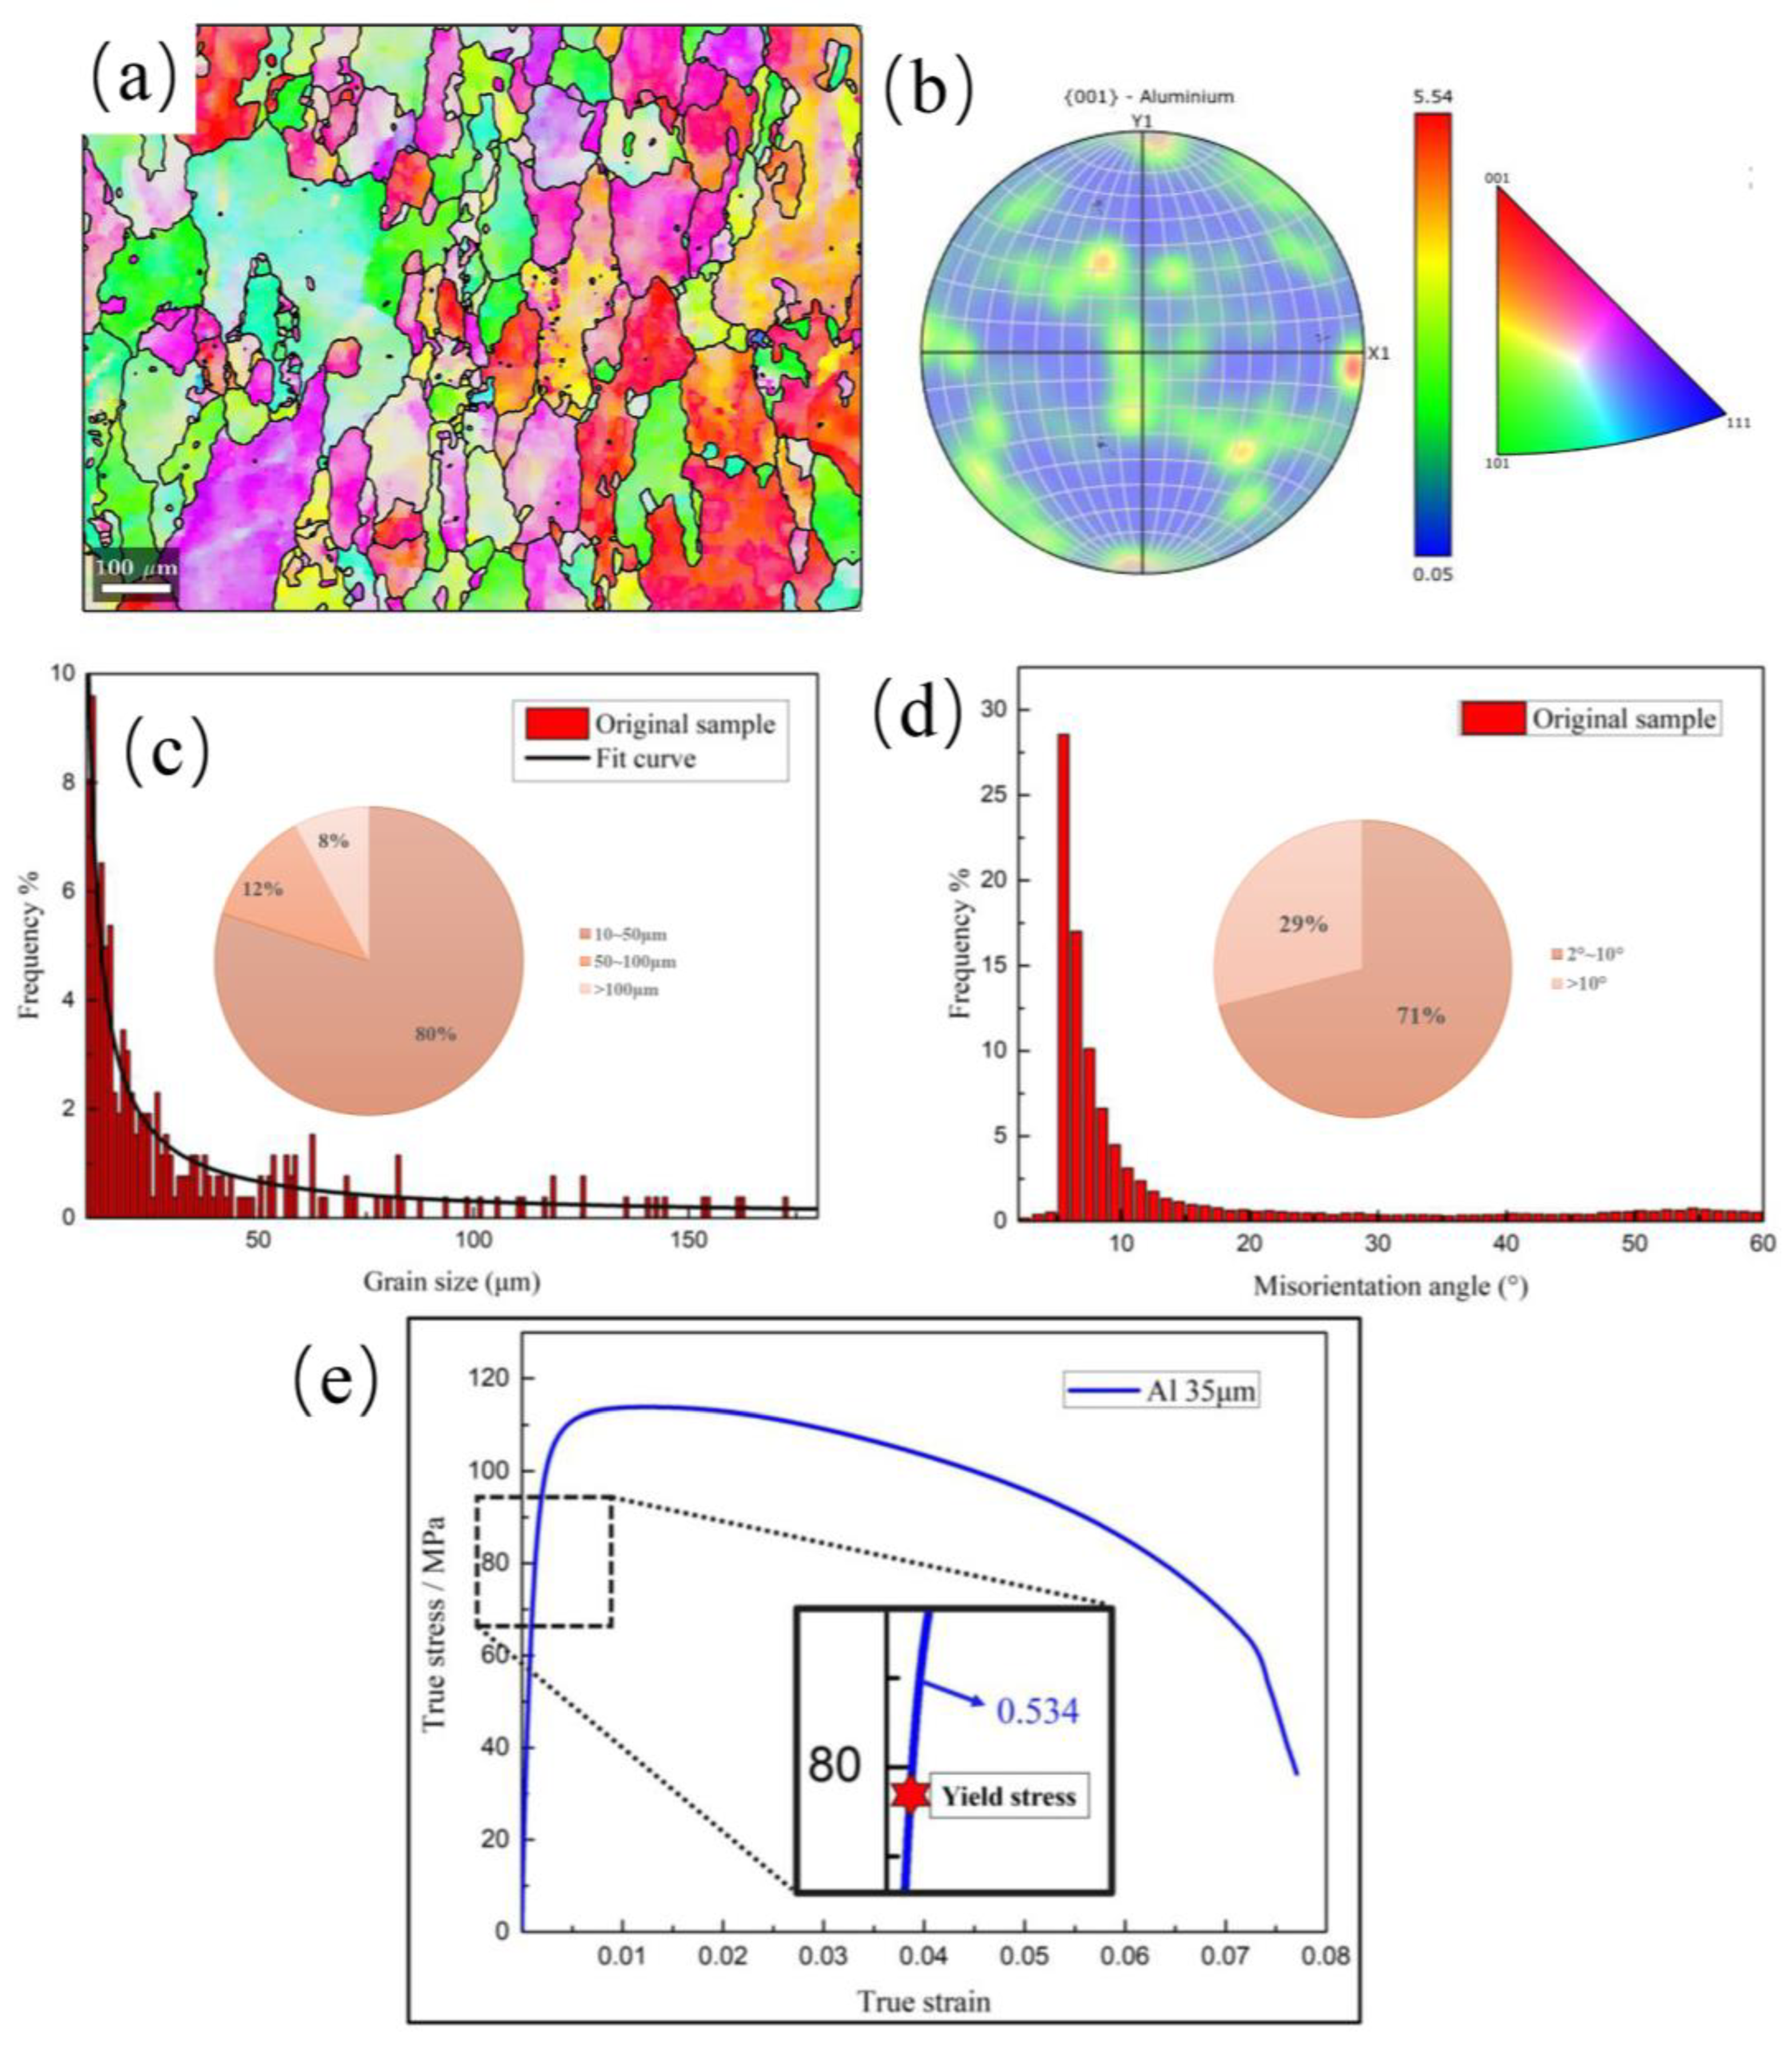
2.2. Results of Al Tensile Experiment

First, an Al sheet specimen was manufactured, and the EBSD image was obtained, as shown in Figure 2a. In Figure 2b, the grain orientation of the Al sheet specimen exhibits a significant degree of randomness, displaying prominent characteristics of isotropy. Consequently, the EBSD image can be regarded as a representative window of the Al sheet specimen, making it a reasonable basis for calculating the correlation dimension. The average grain size of the Al sheet specimen is 35 μm, where the proportion of grains with a size smaller than 50 μm is 80%, whereas larger grains measuring over 100 μm are sparsely distributed, as shown in Figure 2c. The percentage of small-angle grain boundaries exceeds 70%, as shown in Figure 2d. The grain correlation dimension of 1.89, which is shown in Table 1, was obtained for such grain distribution, as shown in Figure 2a, based on the calculation method in Section 2.1.
According to ASTM E8/E8M [29], a standard tensile test for the Al sheet was designed, where the specimen was clamped in the tensile testing machine, Instron 3400. The machine applied tensile force to the specimen at a constant rate (0.5 mm/min) until the specimen fractured. Then, it was conducted to obtain true stress–strain curves, as shown in Figure 2e. The SHE of the Al sheet specimen at the initial yielding, with a value of 0.534, as shown in Table 1, was fitted by the Ludwik constitutive model using Equation (1). After the calculation process, the correlation dimension (1.89) of the Al sheet specimen was almost equal to the SHE’s reciprocal (1.87).
In this paper, we used the Python language to develop a program for obtaining the grain correlation dimension from EBSD images. The following outlines the calculation process for the grain correlation dimension based on EBSD images:
(1)
def load_and_preprocess_image (image_path): Load the EBSD image and convert it to a binary image using Otsu’s binarization method;
(2)
def find_grain_centers (binary_image): Identify the geometric centers of the grains using the skimage.measure library;
(3)
def count_grains_within_radius (centers, scan_points, radius): Use KDTree to calculate the mean number of grain geometric centers N m ( r ) within a specified radius r for each scan point;
(4)
def plot_grains_and_scan (centers, scan_points, radius, counts, image): Plot the geometric centers of the grains and the scan results on the EBSD image using matplotlib;
(5)
Calculate the grain correlation dimension D using Equation (3).

3. Verification

In order to prove that the aforementioned conclusion is not a coincidence, this study calculated the correlation dimensions of Ti (Figure 1b,c in [26]), Cu polycrystals (Figure 2b–d in [27]), and bimodal Ti (Figure 1d in [28]) polycrystals (sheet specimens), considering the effects of different components, grain sizes, grain distributions, and twin boundaries. Given that this study primarily focuses on the scaling behavior at the initial yielding, the initial SHE is determined using engineering stress–strain curves instead of true stress–strain curves, as shown in Figure 3a. The corresponding correlation dimensions are shown in Table 1 and Figure 3b, where d10 and d50 represent the average grain sizes of 10 μm and 50 μm, respectively; t and d represent the characteristic sizes of a material; NTC denotes the calculation result obtained without considering twin boundaries in Cu; and d2.1 is the average grain size of bimodal Ti, being equal to 2.1 μm. The results obtained using the above-presented data are consistent with those obtained for Al.
The calculation results verify that the correlation dimension of grains directly governs the scale of the initial yielding, known as the SHE. It should be noted that twin boundaries have a significant influence on the SHE, and neglecting the contribution of the twin boundaries can lead to an underestimation of the calculated SHE, as shown by the results of Cu in Table 1.
Furthermore, the results obtained for Ti and bimodal Ti clearly demonstrate that the degree of grain refinement does not have a direct correlation with the SHE. Despite a significant variation of five times in the average grain size, the SHE values remain the same. Therefore, similar geometric correlations result in comparable strain-hardening abilities. Furthermore, the pointwise dimension represents the density of grain distributions, and the grains constitute a field of pointwise dimensions; this field exhibits multifractal characteristics. The correlation dimension reflects the average feature of the grain distribution, specifically referring to the grains’ multifractal characteristics. Thus, a universal law of polycrystalline strain-hardening behaviors seems to have been discovered.

4. Discussion

The objective of this paper is to uncover the physical nature of the quantitative relationship between the grain correlation dimension and the SHE in polycrystalline materials. Therefore, the discussion needs to revolve around two key-points: “Relationship between the pointwise dimension and material manifold” and “The equivalence relationship between the correlation dimension of the strength coefficient field and grains”.

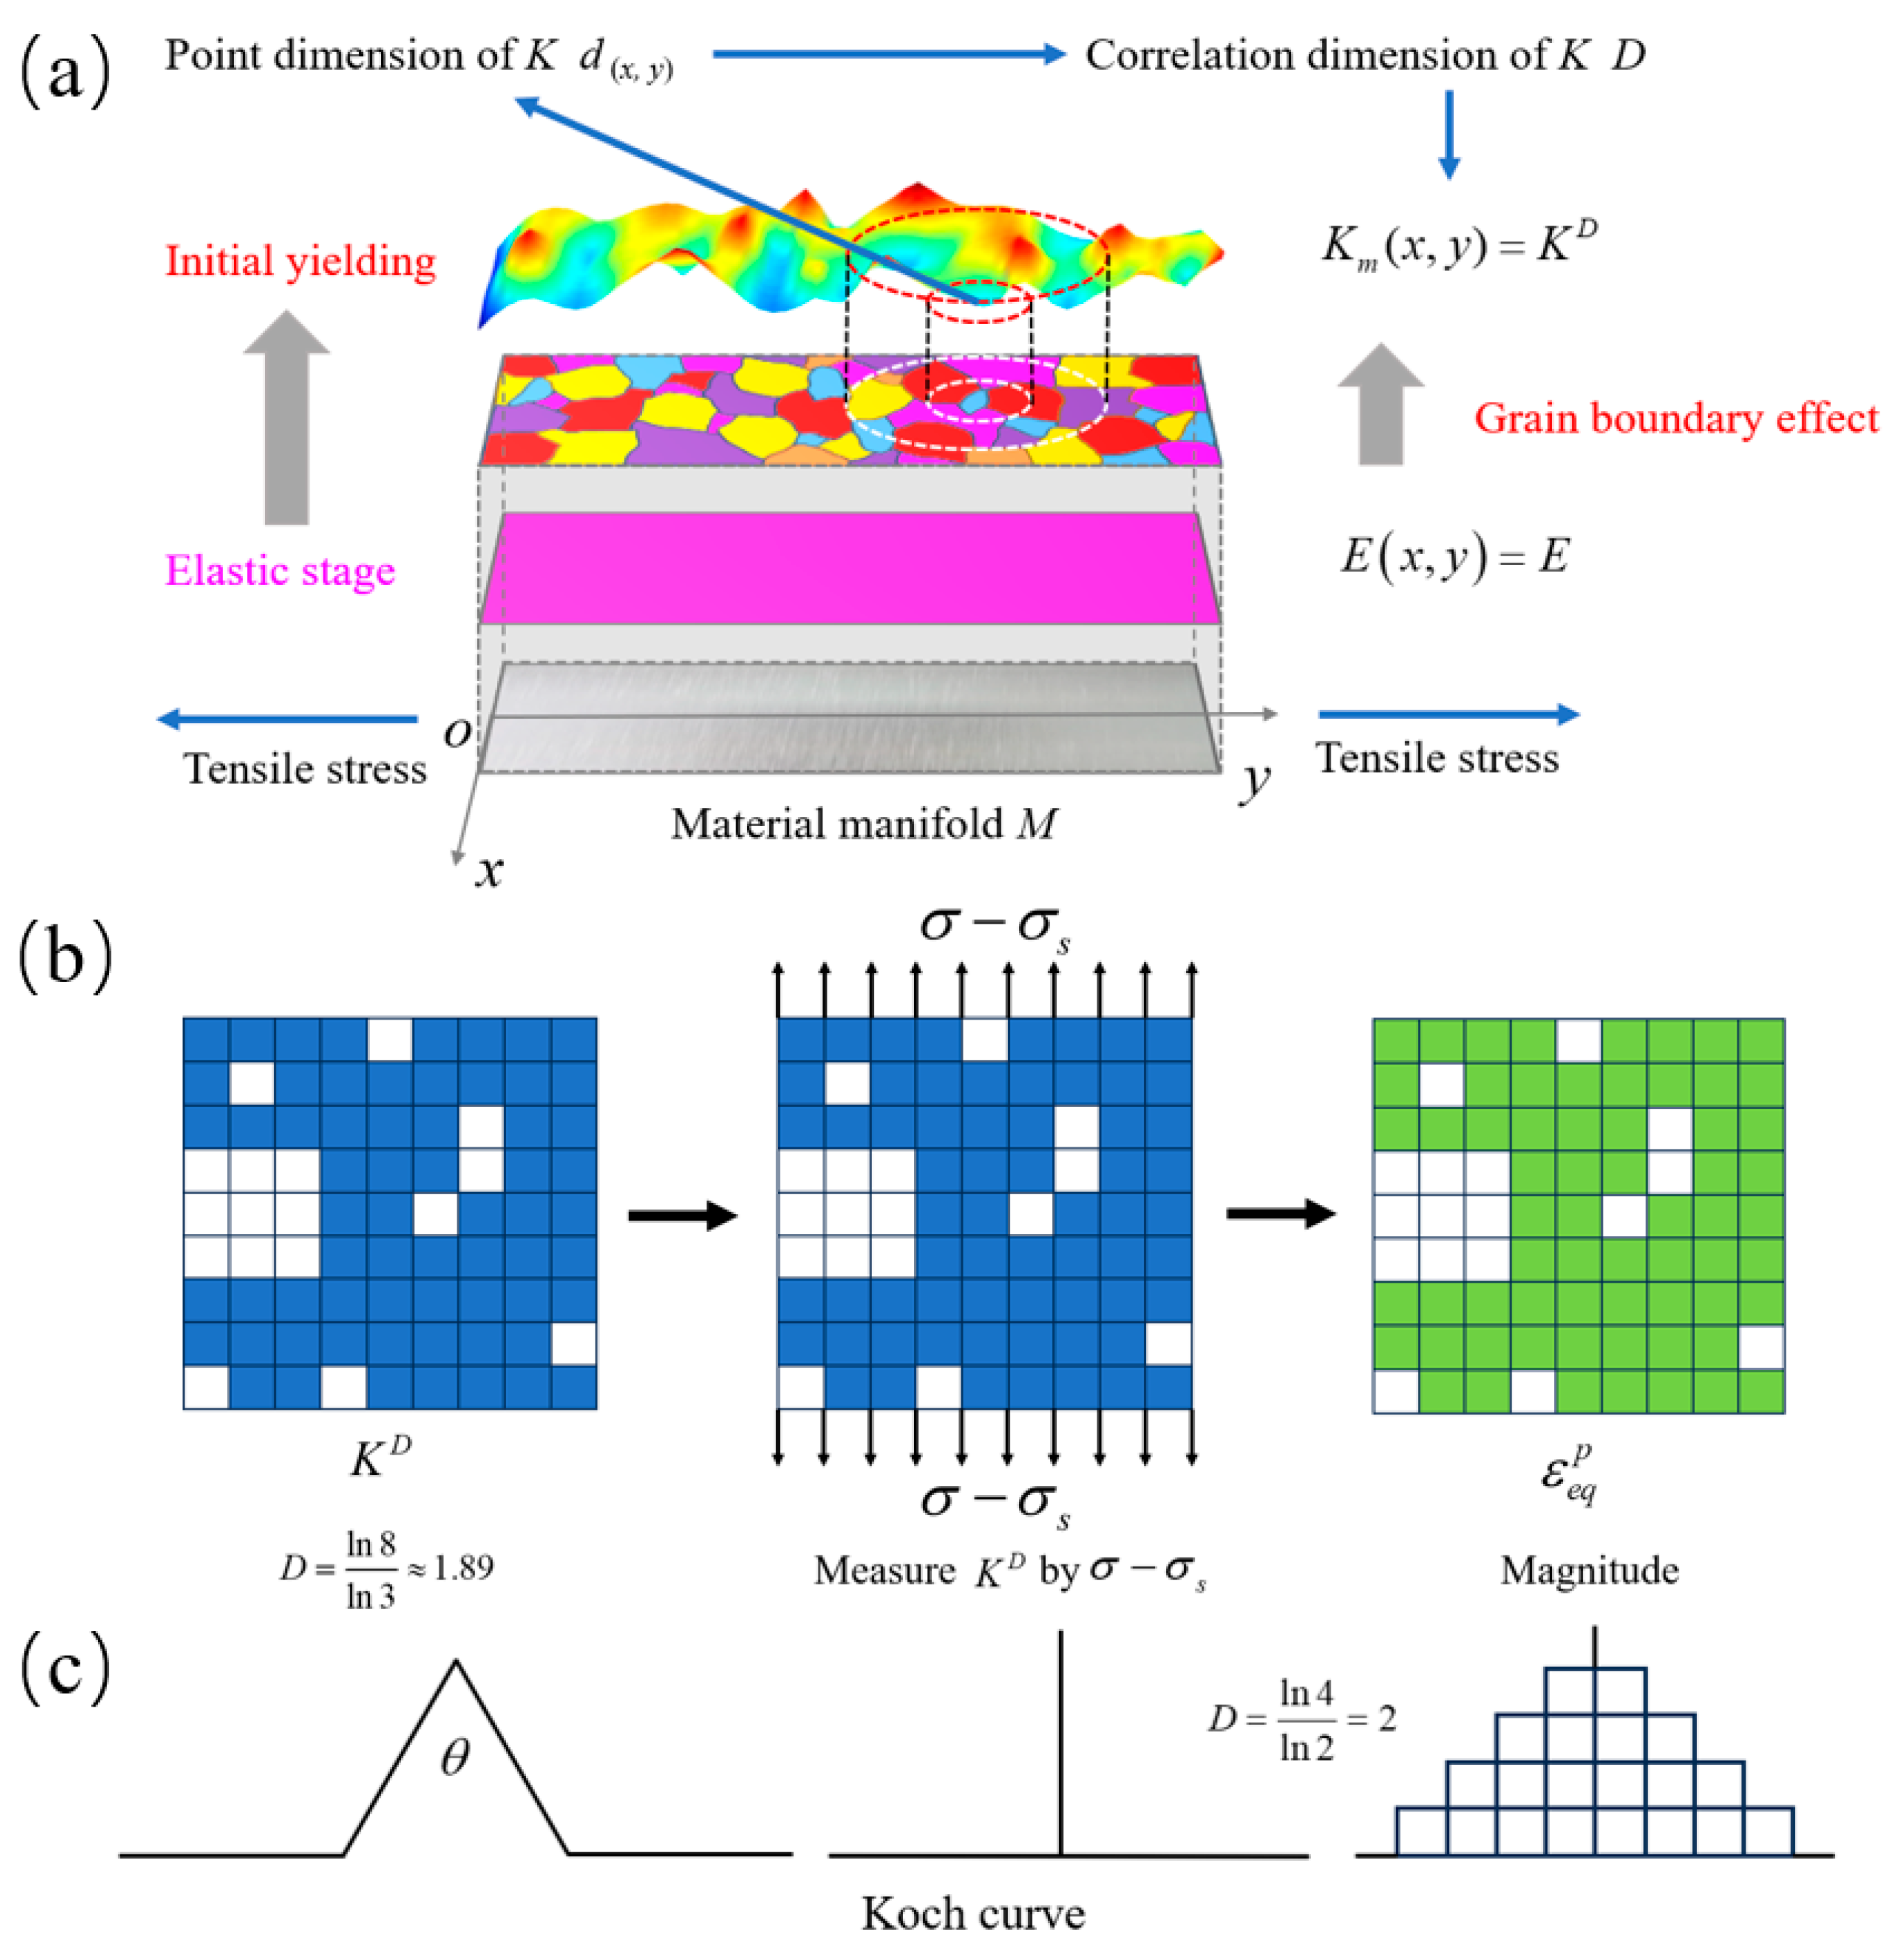
4.1. Relationship between the Pointwise Dimension and Material Manifold

It should be explained why the reciprocal of the grain correlation dimension in polycrystalline pure metals precisely corresponds to the SHE. In fact, plastic deformation is closely related to the material manifold. Furthermore, according to the continuum theory of defect [30], as shown in Equation (4):
{ S i j k = 1 2 ( Γ i j k Γ j i k ) = 1 2 e i j l α l k R i j k l = e q i j e r k l η q r η i j = e j m n α i n , m + κ i j * ,
the tensors of dislocation α l k and disclination density κ i j * are related to the tensors of torsion S i j k and curvature R i j k l of the material manifold, respectively, thus influencing the flatness of the material manifold. In Equation (4), η i j denotes the incompatibility tensor, and Γ i j k corresponds to the affine connection coefficient of the material manifold.
The most crucial geometric quantities in an affine connection space (i.e., the material manifold) include the metric tensor g i j and connection Γ i j k . As shown in Equation (5):
Γ i j k = 1 2 g { i j , k } + S { i j k } + 1 2 Q { i j k } ,
the Q tensor is defined by the covariant derivative of the metric tensor, Q i j k = k g i j , and both the curvature tensor and the torsion tensor are defined by connection coefficients. If Q i j k = 0 , it transforms into a Cartan space. Yavari et al. [31,32] introduced a geometric theory of nonlinear solids with distributed dislocations and a geometric field theory of dislocation mechanics in the Cartan space. As shown in Figure 4, the non-flatness of space is equivalent to the metric distribution in the Cartan space, and the pointwise dimension indicates the metric distribution.

4.2. The Equivalence Relationship between the Correlation Dimension of the Strength Coefficient Field and Grains

As shown in Figure 5a, in the elastic stage, the elastic field E ( x , y ) can be regarded as a flat isometric manifold. At the initial yielding, as a new field, the strength coefficient field K ( x , y ) in Equation (1) is used for characterizing EPSs; that is, the deformation of the intermediate configuration (pure plastic). The presence of grain boundaries restricts the distribution of dislocations and disclinations, particularly affecting the distribution of torsion and curvature tensors within the material manifold. As a result, grain boundaries further determine the pointwise dimensions d ( x , y ) of the material manifold. Thus, the correlation dimension quantifies the influence of grain boundaries on the dimension of the whole material manifold. In this study, D A l s h e e t 1.89 , so the geometric shape with a dimension of 1.89 is selected to explain the relationship between the correlation dimension of the material manifold and the K ( x , y ) field dimension. In Figure 5b, the blue figure represents the K ( x , y ) field manifold with a correlation dimension of 1.89. When the applied load exceeds the yield stress, the measure of K ( x , y ) caused by the stress forms a magnitude field. According to the definition of the Hausdorff measure, the relationship between the EPS, stress, and K ( x , y ) can be defined, as shown in Equation (6):
ε e q p = H δ D ( K ) = inf { i σ i D : { σ i } is   a   δ - cover   of   K   } ,
where δ is the maximum diameter of the stress subset { σ i } , and H δ D ( K ) is the measure of K ( x , y ) .
The stress field constitutes the minimum cover (i.e., the infimum) when measuring the K ( x , y ) field, and the EPSs denote measure magnitudes. Therefore, the manifold of the magnitude field, namely, the EPS field, is represented by a green figure with an identical shape to that of the K ( x , y ) field, as shown in Figure 5b. Thus, both manifolds have equal correlation dimensions. In other words, for small deformations, the correlation dimension of the material manifold is equivalent to the K ( x , y ) field dimension. Next, the Ludwik constitutive model is re-examined. At the initial yielding, as shown in Figure 5b, the K ( x , y ) field is measured using a stress “ruler” of correlation dimension D, obtaining the EPS value. Therefore, in practice, the Ludwik constitutive model can be modified as follows:
( σ σ s ) 1 / n = ε e q p K 1 / n ( σ σ s ) D = ε e q p K D .
The calculated correlation dimension implies the following assumption: the local EPSs are primarily concentrated at the grain center at the initial yielding due to selecting the geometric center of the grain as a reference point for the correlation dimension calculation. The pointwise dimension indicates the density distribution of EPSs around the grain. As shown in Table 1, the hypothesis is better supported by materials with larger grain sizes. Conversely, smaller grains exhibit a weaker constraint effect of grain boundaries on deformation, leading to a concentration of dislocations toward the grain boundaries and consequently resulting in relatively larger errors in the correlation dimension. It should be noted that the correlation dimensions calculated in this study are based on the EBSD images, which constitute a plane. Therefore, the correlation dimension is D ( 1 , 2 ] [33]. When the load increases, the density and magnitude of plastic deformation also increase. Consequently, the correlation dimension will inevitably exceed two, which invalidates the calculation method based on the EBSD images. Further, the material manifold dimension increases with the applied load, whereas the SHE decreases with the applied load due to the reciprocal relationship given in Equation (7). It can be observed that the surface dimensions of specimens (i.e., the material manifold dimensions) are negatively correlated with the SHE [18], which is consistent with the reciprocal relationship between the material manifold dimension and the SHE.
Importantly, the correlation dimension of the elastic field manifold is two, and the correlation dimension of the K ( x , y ) field manifold can also be two. However, the geometric characteristics of the two parameters differ significantly, leading to distinct constitutive models. The direct product of two geometries with different fractal dimensions is A × B , and the fractal dimension of the newly generated geometry satisfies the following relationship [34]:
dim ( A × B ) dim A + dim B .
The fractal theory explains that the dimension of the fractal set resulting from the direct product of two fractal sets does not necessarily equal the sum of the dimensions of the two individual fractal sets. In Equation (8), the equal sign is used when A and B are uniform. The elastic field manifold can serve as a direct product of two lines and thus satisfies the following relationship:
σ 2 = E 2 ε 2 σ = E ε .
However, due to the discreteness and non-uniformity of EPSs, it is not possible to determine a set of uniform fractal geometry to obtain the K ( x , y ) field by direct product, so this study can calculate the measure only according to the obtained correlation dimension:
σ 2 E 2 ( ε e q p ) 2 σ 2 = E 2 ε e q p .
In other words, the geometry with a fractal dimension of two does not necessarily represent a plane, as shown in Figure 5c. Namely, if the correlation dimension of the K ( x , y ) field is two, the dimensions of the generated geometries can be all less than one, according to Equation (8).

5. Conclusions

In summary, the universal law discovered indicates that the multifractal characteristics of grain structures determine the strain-hardening behaviors of polycrystalline materials.
(1) Through the study of EBSD and tensile test curves for several typical pure metal polycrystalline materials, the reciprocal relationship between the correlation dimension of grains, which reflects the grains’ multifractal characteristics, and the SHE is discovered. The nature of this relationship is revealed from the geometric perspective. The plastic deformations induce changes in the metric distribution of the material manifold, and the distribution of the metric determines the pointwise dimension and the correlation dimension of the material manifold. Essentially, the multifractal characteristics of grains reflect the characteristics of the material manifold;
(2) In this study, the local EPSs are assumed to be primarily concentrated at the geometric centers of grains at the initial yielding due to the geometric constraints of grain boundaries. Therefore, the correlation dimension of grains is equivalent to the correlation dimension of the EPS field manifold. According to the definition of the Hausdorff measure and the Ludwik constitutive model, the correlation dimension of the EPS field manifold is consistent with the correlation dimension of the K ( x , y ) field. Consequently, the SHE represents an exponent derived from the Dth root of the redefined Ludwik constitutive model. Moreover, the twin boundaries increase the local EPS density and reduce the correlation dimension of the K ( x , y ) field, thus increasing the SHE;
(3) The above findings indicate that, as a critical phenomenon, the initial yielding or strain-hardening behavior is fractal geometrized. Furthermore, the SHE represents a geometrical parameter reflecting the multifractal characteristics of grains. This conclusion can enhance the comprehension of the relationship between the materials’ microstructure and properties in addition to indicating the importance of designing materials with non-uniform grain distribution, such as core-shell, gradient, and bimodal heterogeneous distributions, to obtain desired hardening properties.

Author Contributions

Conceptualization, M.F., J.C. and Z.H.; methodology, M.F.; validation, M.F., B.C. and Z.H.; investigation, M.F.; resources, M.F.; data curation, M.F.; writing—original draft preparation, M.F.; writing—review and editing, J.C. and Y.H.; visualization, M.F.; supervision, B.W.; project administration, B.W.; funding acquisition, B.W. and J.C. All authors have read and agreed to the published version of the manuscript.

Funding

This work was supported by the National Natural Science Foundation of China (Grant No. 12150001 and 12002401) and Guangdong Provincial Key Laboratory of Extreme Conditions (2023B1212010002).

Data Availability Statement

The original contributions presented in the study are included in the article, further inquiries can be directed to the corresponding authors.

Conflicts of Interest

The authors declare no conflicts of interest.

References

  1. Newnham, R.E. Preface. In Structure-Property Relations; Springer Science & Business Media: Berlin/Heidelberg, Germany, 2012. [Google Scholar]
  2. Hayat, S.; Khan, A.; Ali, K.; Liu, J.B. Structure-property modeling for thermodynamic properties of benzenoid hydrocarbons by temperature-based topological indices. Ain Shams Eng. J. 2024, 15, 102586. [Google Scholar] [CrossRef]
  3. Mahboob, A.; Rasheed, M.W.; Hanif, I.; Amin, L.; Alameri, A. Role of molecular descriptors in quantitative structure-property relationship analysis of kidney cancer therapeutics. Int. J. Quantum Chem. 2024, 124, e27241. [Google Scholar] [CrossRef]
  4. Hasani, M.; Ghods, M. Topological indices and QSPR analysis of some chemical structures applied for the treatment of heart patients. Int. J. Quantum Chem. 2024, 124, e27234. [Google Scholar] [CrossRef]
  5. Hollomon, J.H. Tensile deformation. Aime Trans. 1945, 12, 1–22. [Google Scholar]
  6. Liu, R.; Chen, D.; Ou, M.; Liang, Y. The effect of initial grain size on the strength property of copper with gradient microstructure. J. Mater. Res. Technol. 2023, 24, 407–417. [Google Scholar] [CrossRef]
  7. Huang, C.X.; Hu, W.; Yang, G.; Zhang, Z.F.; Wu, S.D.; Wang, Q.Y.; Gottstein, G. The effect of stacking fault energy on equilibrium grain size and tensile properties of nanostructured copper and copper–aluminum alloys processed by equal channel angular pressing. Mater. Sci. Eng. A 2012, 556, 638–647. [Google Scholar] [CrossRef]
  8. Li, W.T.; Li, H.; Fu, M.W. Interactive effect of stress state and grain size on fracture behaviours of copper in micro-scaled plastic deformation. Int. J. Plast. 2019, 114, 126–143. [Google Scholar] [CrossRef]
  9. Guo, Z.Y.; Cheng, W.L.; Wang, H.X.; Yu, H.; Niu, X.F.; Wang, L.F.; Li, H.; Hou, H. Insight on the correlation between bimodal-sized grain structure and tensile properties of extruded low-alloyed Mg–Sn–Bi–Mn alloy. Mater. Sci. Eng. A 2022, 843, 143128. [Google Scholar] [CrossRef]
  10. Zhang, Z.; Orlov, D.; Vajpai, S.K.; Tong, B.; Ameyama, K. Importance of bimodal structure topology in the control of mechanical properties of a stainless steel. Adv. Eng. Mater. 2015, 17, 791–795. [Google Scholar] [CrossRef]
  11. Callister, W.D.; Rethwisch, D.G. Dislocations and Strengthening Mechanisms. In Materials Science and Engineering: An Introduction; John Wiley & Sons: New York, NY, USA, 2007. [Google Scholar]
  12. Kadić, A.; Edelen, D.G. The Gauge Theory of Defects. In A Gauge Theory of Dislocations and Disclinations; Springer: Berlin/Heidelberg, Germany, 1983. [Google Scholar]
  13. Carpinteri, A.; Chiaia, B. Power scaling laws and dimensional transitions in solid mechanics. Chaos Solitons Fractals 1996, 7, 1343–1364. [Google Scholar] [CrossRef]
  14. Kröger, H. Fractal geometry in quantum mechanics, field theory and spin systems. Phys. Rep. 2000, 323, 81–181. [Google Scholar] [CrossRef]
  15. Suzuki, M. Phase transition and fractals. Prog. Theor. Phys. 1983, 69, 65–76. [Google Scholar] [CrossRef]
  16. Morales, I.O.; Landa, E.; Fossion, R.; Frank, A. Scale invariance, self similarity and critical behavior in classical and quantum systems. J. Phys. Conf. Ser. 2012, 380, 012020. [Google Scholar] [CrossRef]
  17. Zborovský, I. A conservation law, entropy principle and quantization of fractal dimensions in hadron interactions. Int. J. Mod. Phys. A 2018, 33, 1850057. [Google Scholar] [CrossRef]
  18. Vinogradov, A.; Yasnikov, I.S.; Estrin, Y. Evolution of fractal structures in dislocation ensembles during plastic deformation. Phys. Rev. Lett. 2012, 108, 205504. [Google Scholar] [CrossRef]
  19. Yasnikov, I.S.; Vinogradov, A.; Estrin, Y. Dislocation model for the behavior of fractal dimension of the microstructure of a strained solid. Phys. Solid State 2013, 55, 346–352. [Google Scholar] [CrossRef]
  20. Strogatz, S.H. Pointwise and Corrlelation Dimensions. In Nonlinear Dynamics and Chaos: With Applications to Physics, Biology, Chemistry, and Engineering; CRC Press: New York, NY, USA, 2018. [Google Scholar]
  21. Nie, C. Applying correlation dimension to the analysis of the evolution of network structure. Chaos Solitons Fractals 2019, 123, 294–303. [Google Scholar] [CrossRef]
  22. Nie, C. Generalized correlation dimension and heterogeneity of network spaces. Chaos Solitons Fractals 2022, 162, 112507. [Google Scholar] [CrossRef]
  23. Perinelli, A.; Iuppa, R.; Ricci, L. Estimating the correlation dimension of a fractal on a sphere. Chaos Solitons Fractals 2023, 173, 113632. [Google Scholar] [CrossRef]
  24. Grassberger, P.; Procaccia, I. Measuring the strangeness of strange attractors. Phys. D Nonlinear Phenom. 1983, 9, 189–208. [Google Scholar] [CrossRef]
  25. Tang, A.; Liu, H.; Liu, G.; Zhong, Y.; Wang, L.; Lu, Q.; Wang, J.; Shen, Y. Lognormal distribution of local strain: A universal law of plastic deformation in material. Phys. Rev. Lett. 2020, 124, 155501. [Google Scholar] [CrossRef] [PubMed]
  26. Huang, Z.W.; Yong, P.L.; Zhou, H.; Li, Y.S. Grain size effect on deformation mechanisms and mechanical properties of titanium. Mater. Sci. Eng. A 2020, 773, 138721. [Google Scholar] [CrossRef]
  27. Ibrahim, J.S.; Mathew, R.T.; Prasad, M.J.N.V.; Narasimhan, K. Processing and specimen thickness to grain size (t/d) ratio effects on tensile behaviour and microformability of copper foils. Met. Mater. Int. 2022, 28, 2340–2355. [Google Scholar] [CrossRef]
  28. Chong, Y.; Deng, G.; Gao, S.; Yi, J.; Shibata, A.; Tsuji, N. Yielding nature and Hall-Petch relationships in Ti-6Al-4V alloy with fully equiaxed and bimodal microstructures. Scr. Mater. 2019, 172, 77–82. [Google Scholar] [CrossRef]
  29. ASTM E8/E8M-21; Standard Test Methods for Tension Testing of Metallic Materials. ANSI: New York, NY, USA, 2021.
  30. Bilby, B.A.; Bullough, R.; Smith, E. Continuous distributions of dislocations: A new application of the methods of non-Riemannian geometry. Proc. R. Soc. Lond. Ser. A Math. Phys. Sci. 1955, 1185, 263–273. [Google Scholar]
  31. Yavari, A.; Goriely, A. Riemann–Cartan geometry of nonlinear dislocation mechanics. Arch. Ration. Mech. Anal. 2012, 205, 59–118. [Google Scholar] [CrossRef]
  32. Sozio, F.; Yavari, A. A Geometric Field Theory of Dislocation Mechanics. J. Nonlinear Sci. 2023, 33, 83. [Google Scholar] [CrossRef]
  33. Li, J.; Ostoja-Starzewski, M. Fractals in elastic-hardening plastic materials. Proc. R. Soc. A Math. Phys. Eng. Sci. 2010, 2114, 603–621. [Google Scholar] [CrossRef]
  34. Falconer, K. Products of fractals. In Fractal Geometry: Mathematical Foundations and Applications; John Wiley & Sons: New York, NY, USA, 2007. [Google Scholar]
Figure 1. (a) Definition of the grain pointwise dimension; (b) properties of the grain pointwise dimension.
Fractalfract 08 00504 g001
Figure 2. Results of Al tensile experiment: (a) the EBSD images; (b) the grain orientation; (c) the grain size distribution; (d) the misorientation angle; (e) the tensile true strain–stress curves.
Fractalfract 08 00504 g002
Figure 3. Pure metallic polycrystalline materials [26,27,28]: (a) engineering stress–strain curves and initial SHE values; (b) correlation dimensions.
Fractalfract 08 00504 g003
Figure 4. The relationship between the pointwise dimension and the metric distribution.
Fractalfract 08 00504 g004
Figure 5. Geometrization of the initial strain-hardening exponent (SHE): (a) the effect of grain boundaries on material manifolds; (b) the schematic diagram for the measure of the K ( x , y ) field with fractal geometry by stress; (c) two-dimensional special geometry.
Fractalfract 08 00504 g005
Table 1. The correlation dimension and SHE.
MaterialTypeSHE1/SHED
Al (this work)d350.5341.871.89
Ti [26]d100.5271.901.83
d500.5121.951.98
Cu [27]d20 t3500.6391.561.58
d20 t1000.6321.581.60
d27 t1000.6041.661.68
NTCd27 t1001.81
Bimodal Ti [28]d2.10.5201.921.83
Disclaimer/Publisher’s Note: The statements, opinions and data contained in all publications are solely those of the individual author(s) and contributor(s) and not of MDPI and/or the editor(s). MDPI and/or the editor(s) disclaim responsibility for any injury to people or property resulting from any ideas, methods, instructions or products referred to in the content.

