Article

Experimental Study on the Impact of High-Frequency Vibration Excitation on Coal Fracturing

by
Lei Zhang
,
Xufeng Wang
* and
Zhijun Niu
Jiangsu Engineering Laboratory of Mine Earthquake Monitoring and Prevention, School of Mines, China University of Mining and Technology, Xuzhou 221116, China
*
Author to whom correspondence should be addressed.
Fractal Fract. 2024, 8(9), 546; https://doi.org/10.3390/fractalfract8090546
Submission received: 22 August 2024 / Revised: 9 September 2024 / Accepted: 17 September 2024 / Published: 19 September 2024
(This article belongs to the Special Issue Applications of Fractal Analysis in Underground Engineering)

Abstract

:
The ultrasonic vibration rock-breaking method has been successfully applied to hard rock due to its high efficiency and controllable energy, providing a novel approach for the development of a more efficient, intelligent, safe, and environmentally friendly reconstruction method for coal and rock reservoirs. By subjecting the rock to ultra-high frequency (>15 kHz) vibration load, rapid fatigue damage can be induced within a short period of time, thereby enhancing the extent of cracking in hard rock. In order to investigate the impact of high-frequency vibration excitation on coal cracking, this study conducted exploratory tests using an independently designed ultrasonic vibration excitation system. These tests were combined with nuclear magnetic resonance (NMR) and permeability measurements to compare and analyze the pore fracture structure and permeability changes in coal samples under resonant and non-resonant conditions. Additionally, multifractal characteristics of the coal samples were investigated. The results demonstrate that high-frequency vibration excitation leads to significant expansion of micropores and mesopores in coal samples. Moreover, there is a strong exponential relationship between coal porosity/permeability and excitation time. After 40 s of stimulation, both porosity and permeability increase by 32.4% and over 8400%, respectively; these increases are five times higher for resonance-state compared to non-resonance-state conditions. Furthermore, water-saturated coal samples exhibit multifractal characteristics in their NMR T2 spectrum distribution, and multifractal parameters ΔD(q)and Δα show positive correlations with the proportion of mesoporous/macropores but negative correlations with the proportion of micropores; conversely, Δf shows an opposite trend relative to pore proportions. The pore structure of coal exhibits intricate multi-scale characteristics, and the heterogeneity at various scales is quantified through multifractal analysis. This study confirms the feasibility of utilizing high-frequency vibration excitation for cracking coal rocks while also providing valuable insights for further expanding its application.

1. Introduction

The utilization of coal-bed methane presents a significant opportunity for China to address its energy needs [1,2] given the substantial presence of coal in its energy structure and the abundance of coal-bed methane resources within coal seams. Efficient extraction and utilization of this resource can contribute to mitigating China’s oil and gas energy shortage, reducing greenhouse gas emissions, and minimizing the risk of underground gas outburst disasters [3,4]. Overcoming the challenge posed by low permeability in coal seams is crucial for achieving effective exploitation of coalbed gas resources.
The primary approach to enhancing the recovery rate of coalbed methane involves artificially modifying the coal–rock structure, expanding the fracture distribution within the coal seam, improving pore connectivity, and establishing pathways for efficient transportation of coalbed methane, thereby increasing reservoir permeability [5,6,7]. Extensive research has been conducted by scholars worldwide on techniques for inducing cracking in coal seams, yielding remarkable outcomes. Commonly employed methods to augment coal seam permeability include deep hole pre-cracking blasting [8,9], hydraulic fracturing [10], and hydraulic slotting [11]. While these approaches can enhance the efficiency of extracting coalbed methane, they also possess certain limitations. For instance, deep hole blasting necessitates stringent construction requirements and presents challenges in controlling blast effects; moreover, its application scope is becoming increasingly restricted due to stricter regulations on explosive control. Hydraulic fracturing requires substantial water usage and introduces chemical anti-reflect agents into fracturing fluids that may contaminate groundwater resources; additionally, proppants are required to maintain fracture apertures.
The extraction method of hydraulic fracturing, commonly known as fracking, poses a range of significant long-term risks including water consumption, chemical pollution, challenges in wastewater treatment, groundwater contamination, induced seismic activity, air pollution, and disruption to ecosystems. These risks not only impact current environmental health, but also have the potential to persist for decades and affect both natural systems and human societies. Consequently, it is imperative to explore alternative technologies that prioritize environmental sustainability.
Ultrasonic vibration rock-breaking technology is primarily utilized for the precise and concentrated crushing processing of brittle and hard materials, such as ceramics. Some scholars have incorporated this method into hard rock crushing. Zhao [12] designed an experimental device for ultrasonic vibration excitation and analyzed the microscopic failure characteristics of granite using an electron microscope scanner, revealing that high-frequency vibration facilitates the propagation of micro-cracks in the rock. Han [13] discovered that under ultrasonic vibration excitation, the degree of rock damage is inversely proportional to its depth, while the extent of damage is directly proportional to the amplitude. Yin [14] investigated how changes in static load influence the mechanical properties of granite and found that there exists an optimal static load which significantly weakens rock strength through ultrasonic vibration. Zhou [15] monitored the test vibration amplitude of granite under ultrasonic vibration excitation and observed that maximum displacement occurred during the resonance state, accelerating the crack growth rate. Zhang [16], utilizing nuclear magnetic resonance, explored micropore development characteristics in brittle red sandstone stimulated by ultrasonic vibrations and concluded that high-frequency vibrations promote the expansion of primary pores as well as the generation of new pores within rocks. Additionally, Zhang [17], based on CT scan results, conducted three-dimensional reconstruction analysis on micro-pore fracture structure at different stages of ultrasonic vibration excitation to qualitatively and quantitatively characterize its impact on rocks.
In summary, ultrasonic high-frequency vibration load induces remarkable rock cracking effects without generating any pollutants during the process. This technology exhibits extensive prospects for industrial applications, particularly in promoting the green and sustainable development of coal mines and other energy resources. By enhancing resource exploitation efficiency, reducing operational costs, and improving safety and environmental friendliness, this technology plays a crucial role in various areas such as coal-bed methane mining, gas extraction, prevention and control of coal mine water damage, auxiliary hydraulic fracturing techniques, and integration of intelligent mining equipment.
Currently, most experimental research focuses on brittle and dense hard rocks; however, considering that coal formations are characterized by softness and highly developed porosity, further investigation is required to explore the potential of ultrasonic vibration excitation in enhancing cracking and reflection in such coal-rock masses. To address this gap in knowledge, this study employs a self-developed ultrasonic vibration excitation testing device to conduct exploratory tests while integrating nuclear magnetic resonance and permeability analyses. The aim is to elucidate the evolution characteristics of pore damage and fracture structures within coal samples under ultrasonic vibration excitation conditions, as well as to validate the feasibility of this approach.

2. Materials and Methods

2.1. Establishment of the Particle Flow Model

The coal samples selected for this study were obtained from the mining area in East Yunnan, China. Prior to commencing the study, mechanical tests were conducted on these coal samples, which included uniaxial compressive testing, uniaxial tensile testing, and shear testing. Figure 1 illustrates the processed coal samples used for mechanical testing, with each sample conforming to the ISRM standard [18]. The failure condition of a representative coal sample is depicted in Figure 2. Detailed results of the mechanical parameters are presented in Table 1 (compressive strength) and Table 2 (tensile strength). The average compressive strength of the coal samples was determined as 8.03 MPa, while their average tensile strength measured 0.82 MPa. Additionally, an internal friction angle of approximately 21.8° was observed, along with a cohesion force of approximately 6.59 MPa.
When subjected to continuous high frequency vibration, the coal sample exhibits the following internal response [19]:
H = 1 ( 1 ( f f 0 ) 2 ) 2 + ( 2 n f f 0 ) 2
where H represents the amplitude amplification factor of the coal sample, f represents the excitation frequency of the vibration system, and f0 represents the natural frequency of the coal sample itself. n denotes the damping ratio. As is evident from the aforementioned formula, when the excitation frequency closely matches that of the coal sample’s natural frequency, its amplitude increases significantly; thus, it is imperative to consider resonance’s impact on the results. Given that the test system’s excitation frequency remains constant, achieving resonance necessitates altering only the natural frequency of the coal sample. Assuming an ideal elastic body for a coal sample, we can calculate its natural frequency using this formula:
2 π f 0 = k m
where k represents the stiffness of the specimen and m represents its mass. It can be observed that the natural frequency is inversely proportional to the quality of the coal sample. The natural frequency test method for coal samples is illustrated in Figure 3. A force hammer is employed to strike the coal sample, generating self-attenuating vibrations. Dynamic acquisition instruments and acceleration sensors are utilized to collect time–domain vibration signals from the coal sample, which are then subjected to Fourier transform using modal processing software to obtain frequency–domain signals. The peak value on this curve corresponds to the natural frequency of the coal sample.
Figure 4 presents testing results for natural frequencies of standard-sized coal samples, revealing a natural frequency of approximately 4500 Hz under these dimensions while considering a minimum excitation frequency of 15 kHz for our testing system. To enhance the natural frequency, reducing the size of coal samples becomes necessary. Finally, when employing a test coal sample with a diameter of 25 mm and a height of 30 mm (as shown in Figure 5), we achieve a close match between its natural frequency and that generated by our testing system.

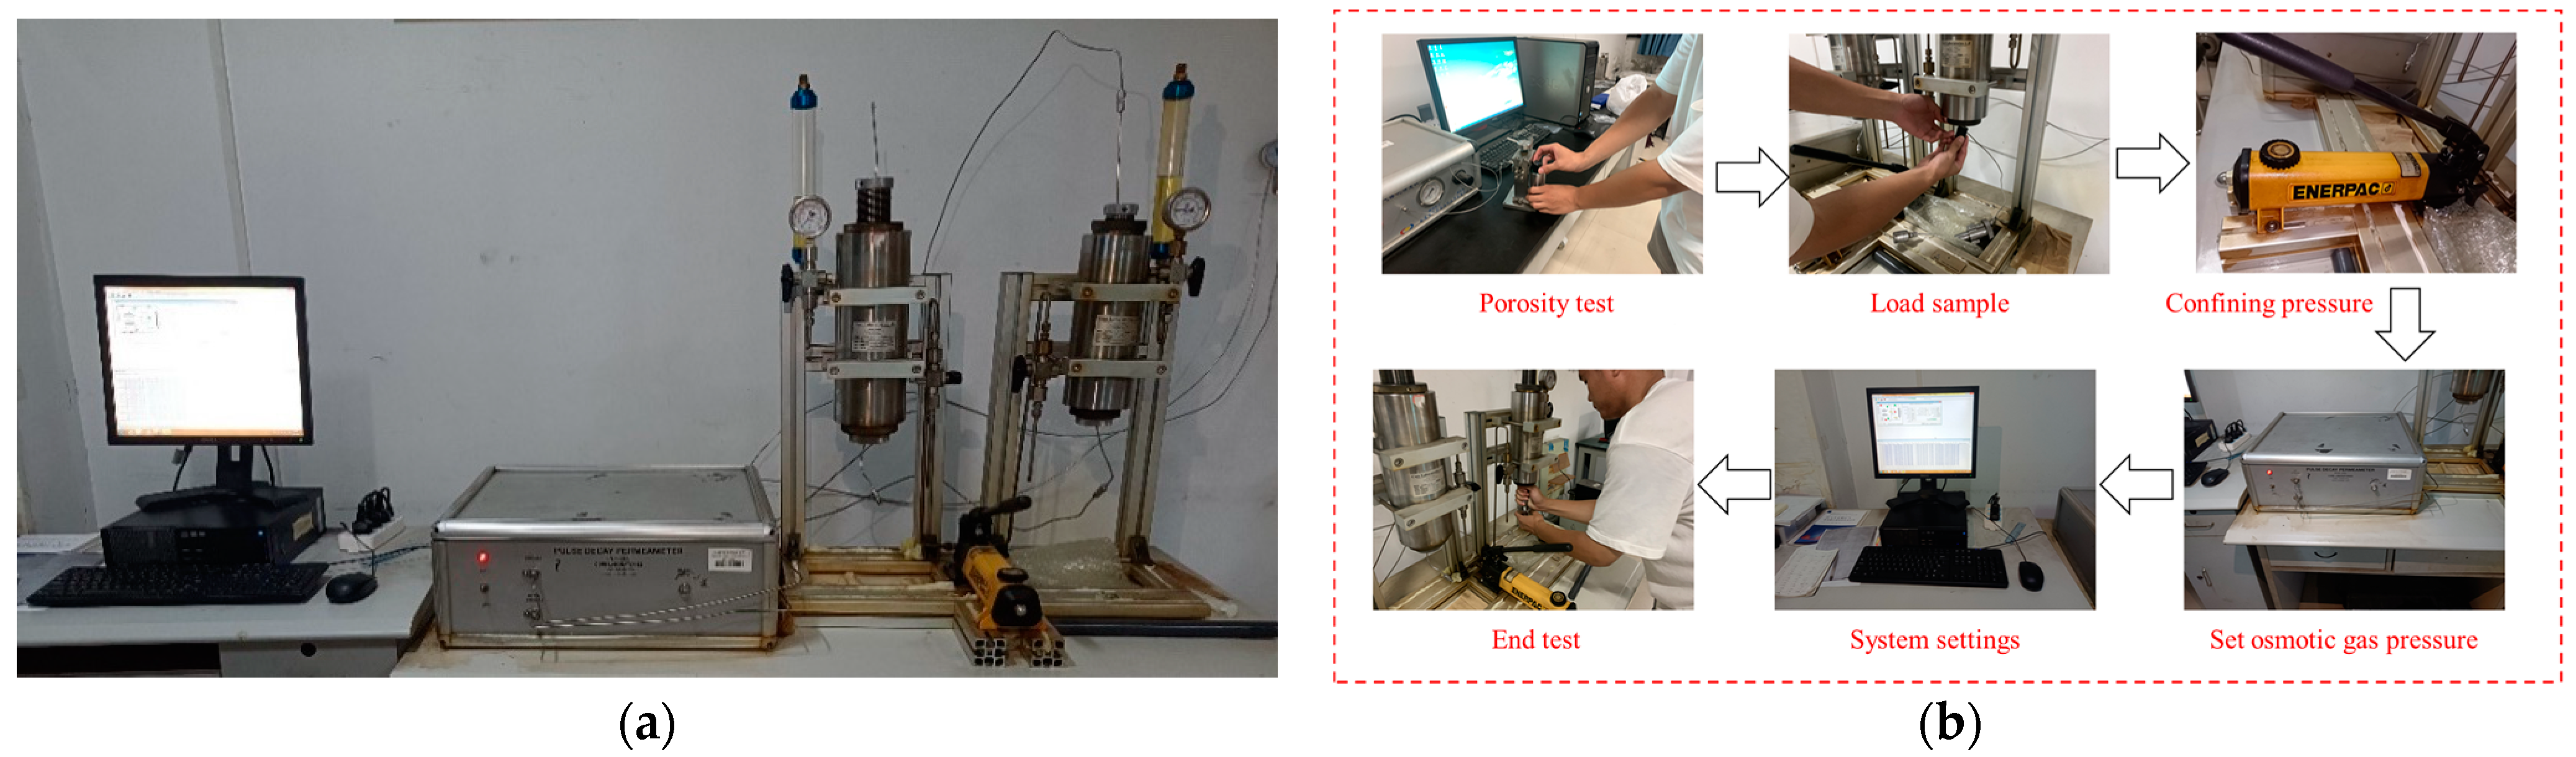
2.2. Experimental Equipment and Procedures

A coal sample system for ultrasonic vibration excitation was developed (as shown in Figure 6), comprising an ultrasonic generator that converts mains electricity into high-frequency alternating current signals, an oscillator that transforms the electrical signals into high-frequency mechanical vibrations, a tool head connected to the oscillator for acting on the coal sample, and an air compressor providing static load to maintain continuous contact between the tool head and the coal sample. The system parameters are presented in Table 2.
The pore characteristics of coal samples were analyzed using the MiniMR12-15H-I nuclear magnetic resonance system from China University of Mining and Technology, as depicted in Figure 7. This system comprises several key components: a vacuum water-filling device capable of accommodating coal samples up to 120 × 400 (mm) in size, with a maximum water filling pressure of 60 MPa and an adjustable vacuum pressure range of 0–0.1 MPa; a low-field NMR instrument with a sampling frequency up to 200 kHz; and an electric blast drying oven operating at a voltage of 220 V, reaching temperatures as high as 300 °C. Prior to testing, the coal sample was saturated for 24 h, after which the NMR instrument detected the presence of hydrogen atoms (1H) within the water-saturated rock sample. The transverse relaxation time (T2) serves as an indicator of pore size within the sample. A larger T2 value suggests greater quantities of hydrogen atoms within pores and, thus, larger pore sizes, enabling the calculation of pore volume based on the number of hydrogen atoms.
The permeability test was conducted at the Key Laboratory of Coalbed Methane, Ministry of Education, China University of Mining and Technology. The PDP-200 pulsed attenuation gas Krantler permeability meter, manufactured by Corelab in the United States (Houston, TX, USA), was utilized to determine the coal sample’s permeability under different excitation stages (Figure 8a). During operation, N2 served as the filling medium with a maximum overlying pressure capability of 70 MPa for the coal sample holder. The instrument’s measurement range spanned from 0.00001 MD to 10 mD. Considering the actual burial depth of the coal seam, a gas permeability pressure of 0.2 MPa and a confining pressure of 12.5 MPa were set at the inlet end during testing. The main test process is shown in Figure 8b.

3. Results

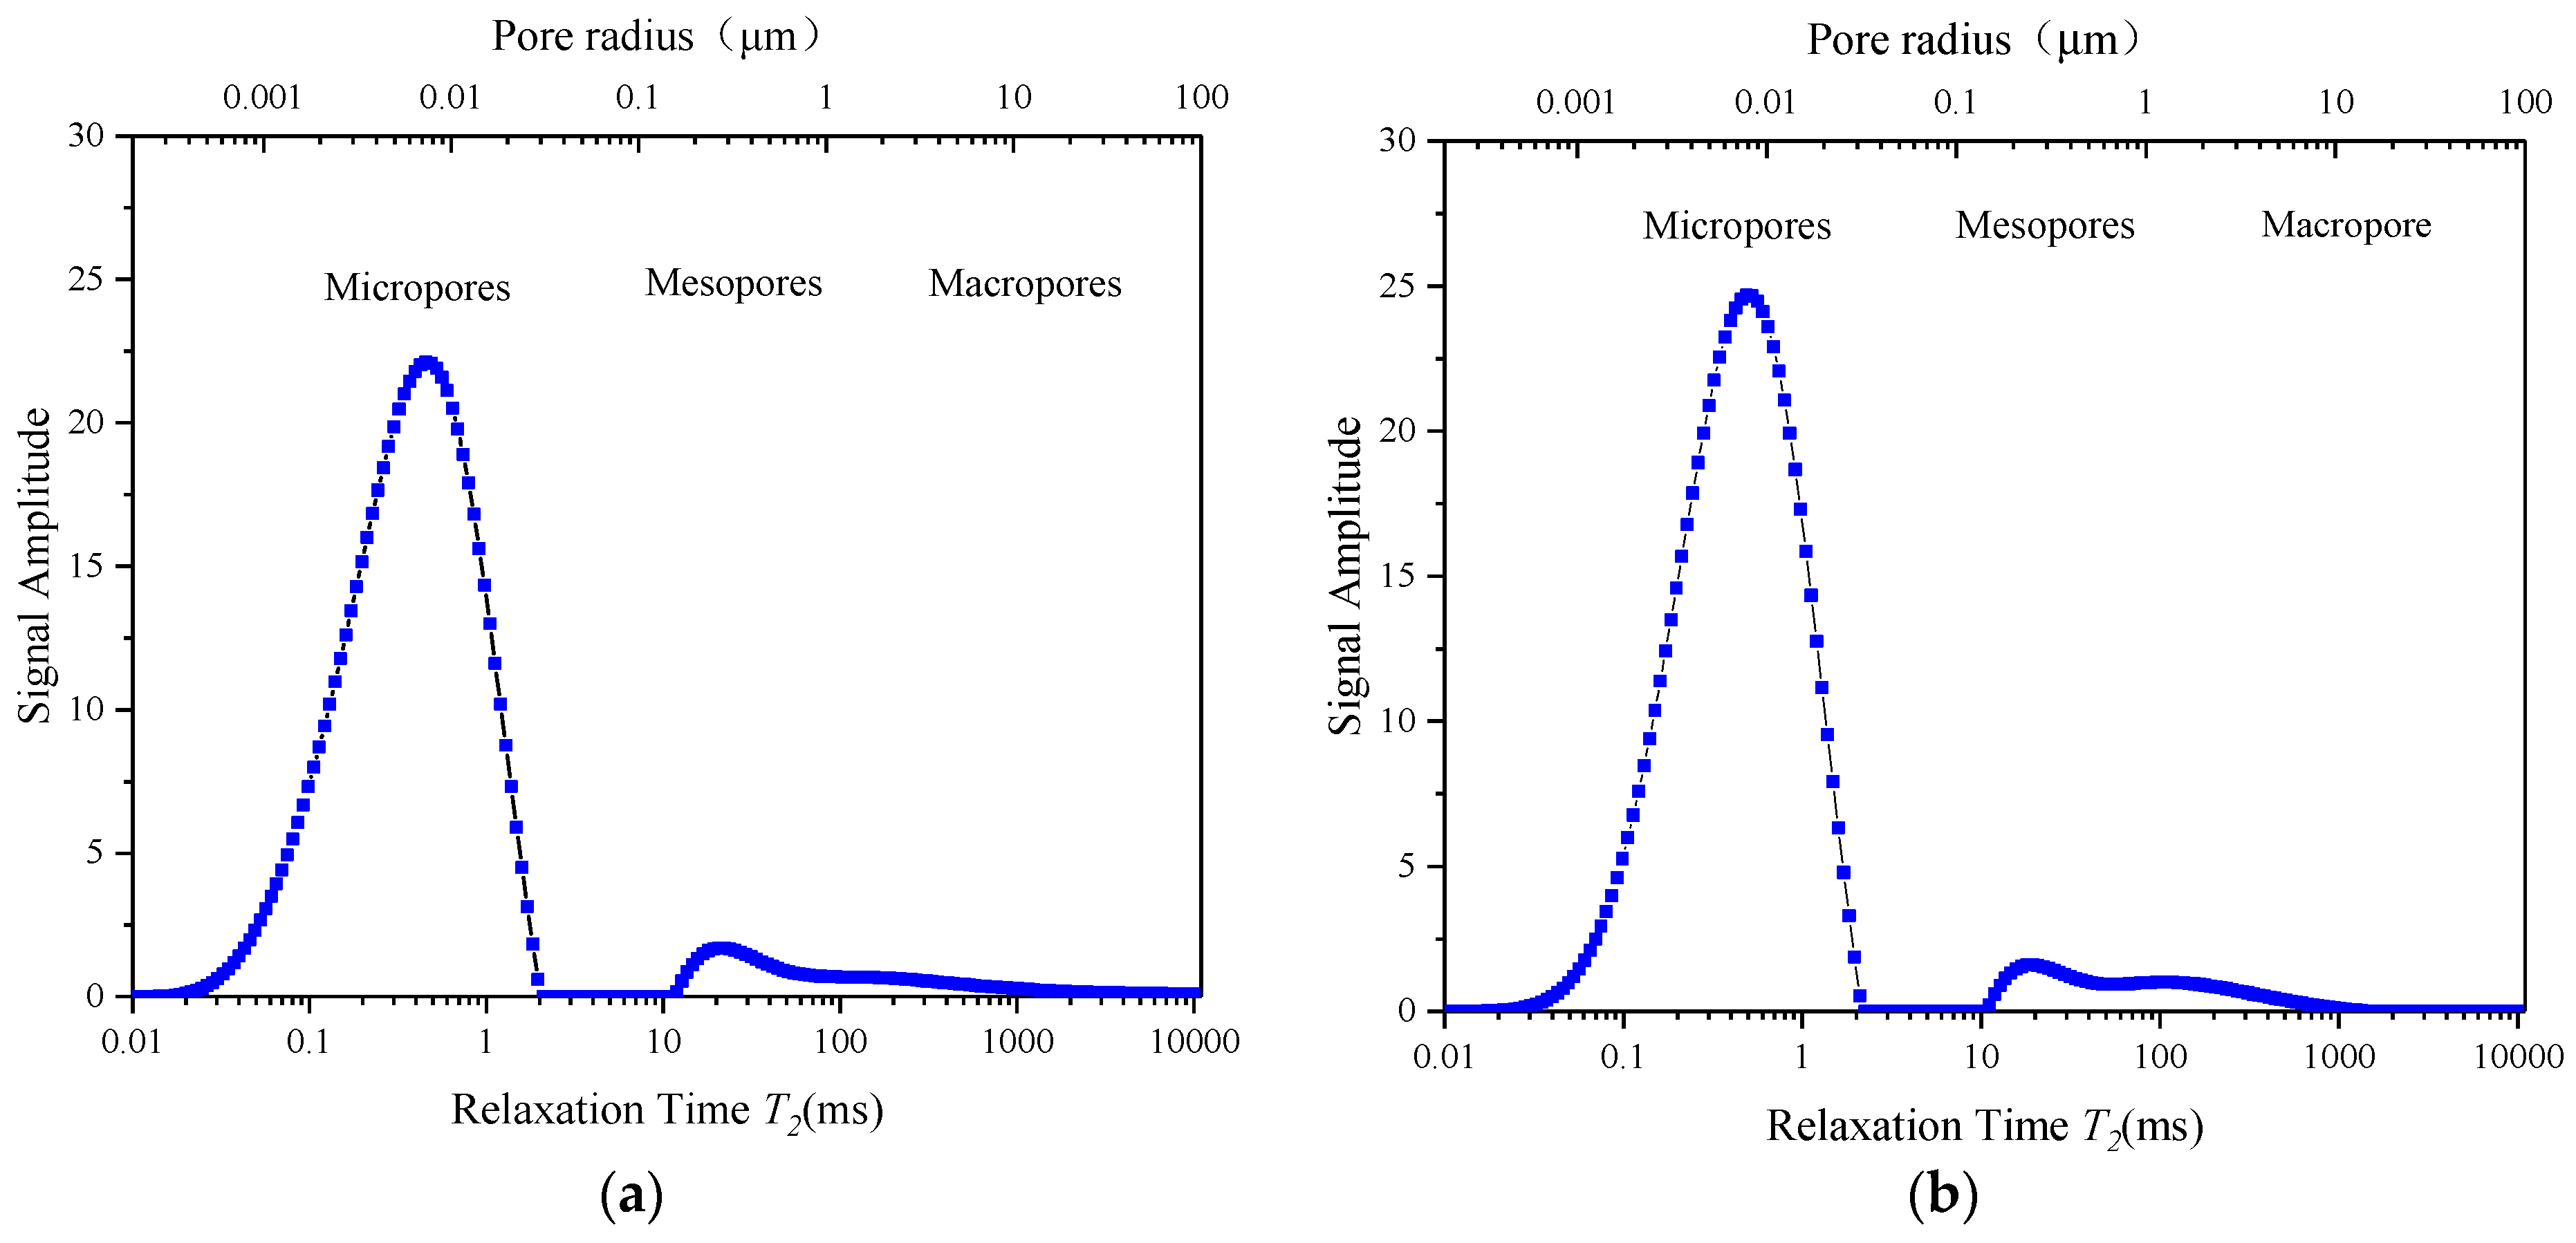
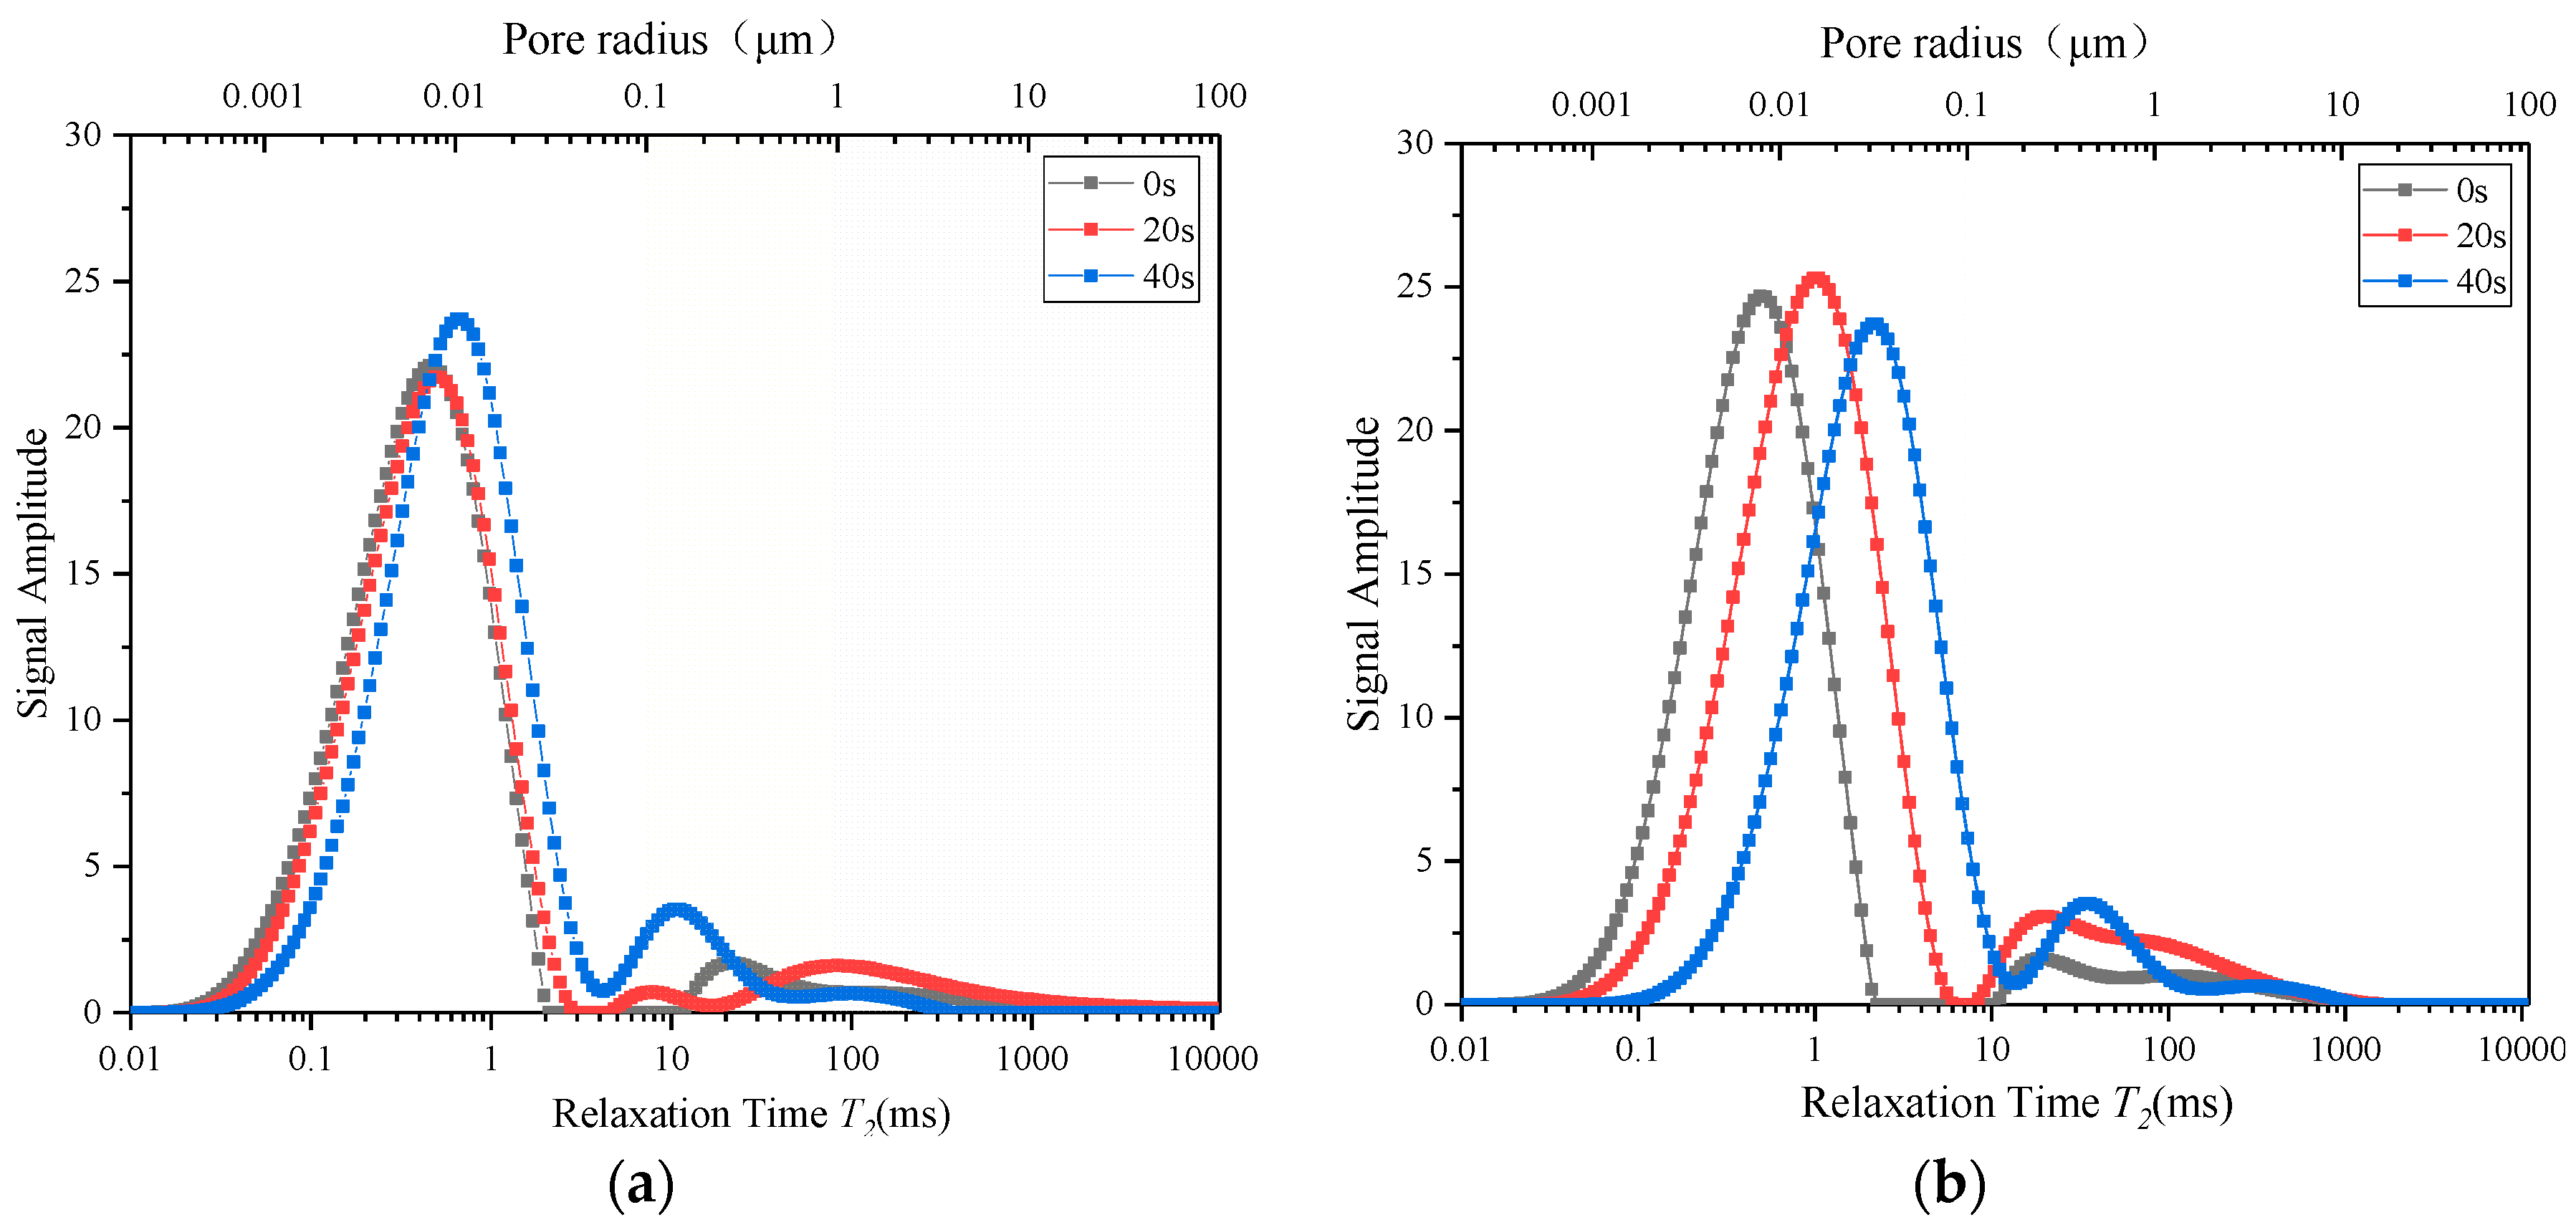
3.1. Evolution of NMR T2 Spectra of Coal Samples Under Ultrasonic Vibration

The phenomenon of magnetic resonance occurs between hydrogen protons and an applied magnetic field in the presence of a low-frequency magnetic field. The strength of the resonance signal and its decay rate (relaxation rate) can serve as indicators for the hydrogen proton content within the sample’s pores. Moreover, the relaxation time T2 is directly proportional to the aperture size r, with their relationship expressed as follows [20,21]:
T 2 = r p c
where p and c represent the signal strength and pore shape factor, respectively. The degree of continuity in T2 spectrum signals reflects the level of connectivity in the microscopic pore structure, thereby enabling measurement of the rock sample’s microscopic pore structure information based on the distribution of the nuclear magnetic resonance T2 spectrum.
Before subjecting the coal samples to ultrasonic vibration excitation treatment, the T2 spectra was obtained through nuclear magnetic resonance testing, and coal samples H1 and H2 were selected for comparative analysis. In their initial state, the NMR T2 spectra of both coal samples are depicted in Figure 9. The T2 distribution curves of the two coal samples exhibit similar shapes, with porosities measuring 4.452% and 4.629%, respectively, indicating a high degree of similarity in pore structure distribution between them. Based on pore size classification into micropores (<0.1 μm), mesopores (0.1 μm~1 μm), and macropores (>1 μm), it is observed that at the initial state, the T2 spectrum distribution primarily displays a bimodal pattern characterized by two distinct peaks located within the micropore and medium pore regions, correspondingly. Furthermore, there is clear separation between these two peaks, suggesting poor internal pore connectivity within the sample.
The T2 spectrum of the H1 sample in a non-resonant state (vibration frequency 20 kHz) under different excitation times is depicted in Figure 10a. Following 20 s of vibration excitation, the spectral peaks within the original micropore and mesopore regions of the T2 spectrum curve for the H1 coal sample shifted towards larger pores, while a new spectral peak emerged between the initial main peak and the secondary peak. This observation indicates that high-frequency vibration excitation generally expands the internal pore structure of the coal sample. Notably, some micropores exhibited significant expansion, leading to the formation of new mesopores. After 40 s of stimulation, there was further pronounced shifting in the T2 spectral curve, accompanied by enhanced signals from newly generated third spectral peaks. Additionally, more micropores transformed into medium-sized pores and contributed to a continuous T2 spectral curve with flattened peaks under ultrasonic vibration stimulation. These findings suggest that pore sizes become more uniformly distributed due to ongoing expansion within the coal sample’s pores; furthermore, pore connectivity significantly improves without any observed presence of micropores. Some localized macropores propagate and form large macroscopic cracks, which result in detachment or fragmentation of specific blocks within the coal sample. Consequently, water storage space diminishes, leading to decreased signal intensity at corresponding regions on the spectral peak curve. The change in T2 spectrum curve for H2 samples under an excitation frequency of 15 kHz (resonance state) is illustrated in Figure 10b. In comparison with H1 coal samples, it can be observed that T2 spectrum curves for H2 coal samples under resonance conditions display more pronounced rightward deviations.
The T2 spectral curve exhibits three peaks, namely, peak 1, peak 2, and peak 3, which are sequentially defined from left to right. Peak 1 predominantly represents the micropore region in the coal sample. Therefore, variations in the proportion of peak 1 reflect changes in the number of micropores present. Figure 11 illustrates alterations in the proportions of each peak for both coal samples. Following a vibration excitation period of 40 s, under non-resonance and resonance states, respectively, there was a reduction in the proportion of peak 1 by approximately 2.72% and 18.23%. These findings indicate that pore expansion activity is more pronounced when coal samples are subjected to resonance conditions.

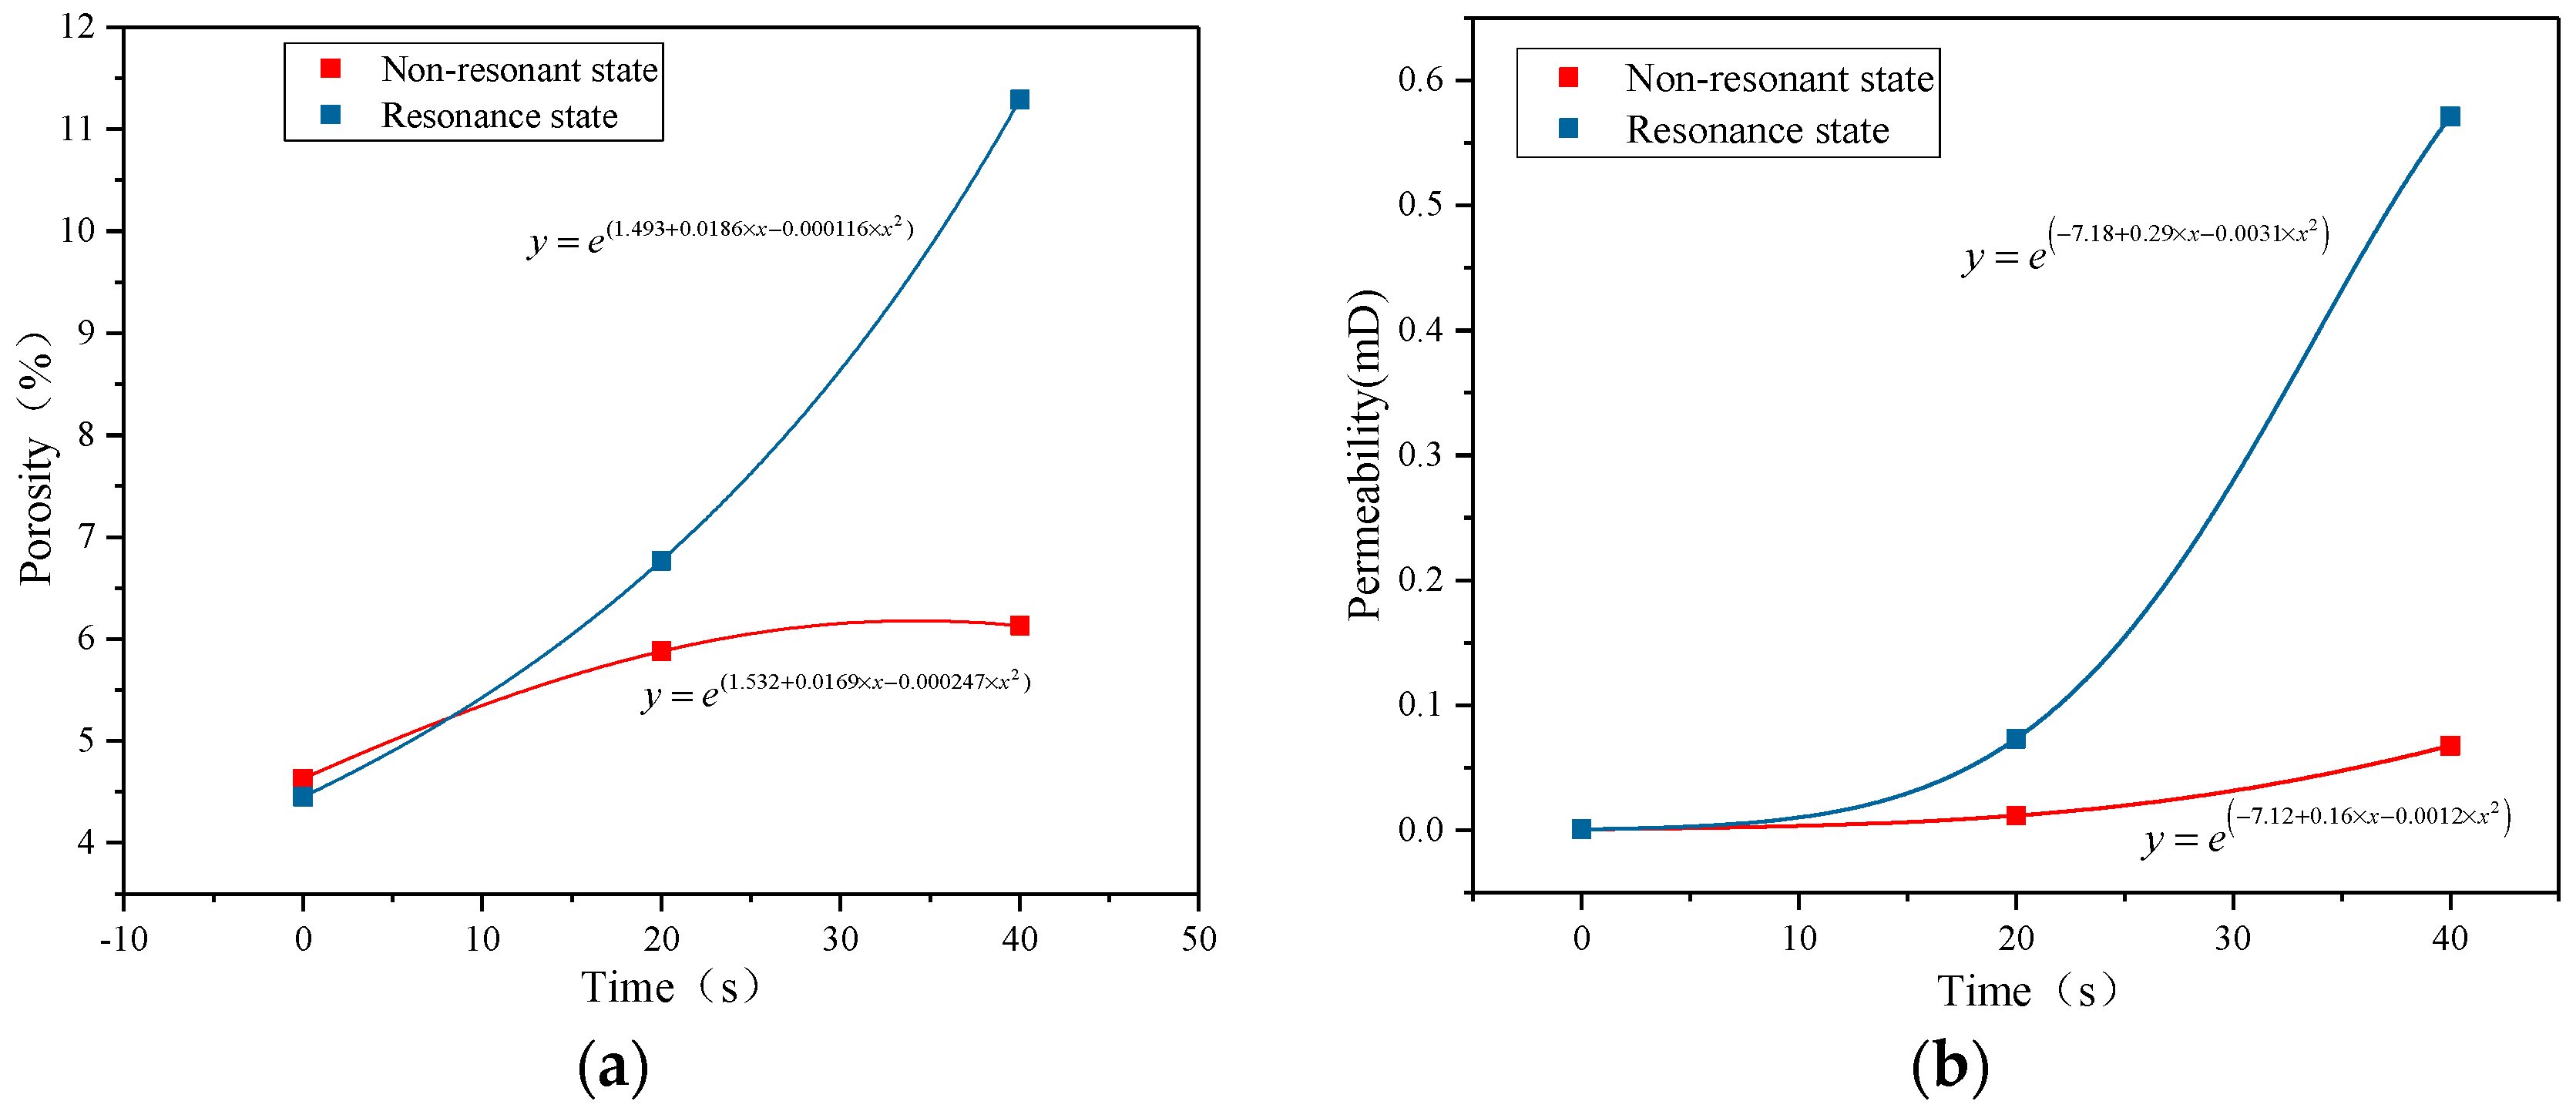
3.2. Evolution of Porosity and Permeability of Coal Samples under Ultrasonic Vibration Excitation

The changes in porosity of coal samples under resonance and non-resonance conditions are illustrated in Figure 12a. High-frequency vibration excitation promotes continuous pore development and increases porosity, exhibiting a strong exponential relationship with time. Conversely, under non-resonance conditions, the growth rate of porosity gradually decreases. After 40 s of stimulation, the H1 coal sample achieved a porosity of 6.129%, indicating an increase rate of 32.4%. In contrast, under resonance conditions, the growth rate of porosity continued to rise significantly. With the same duration of excitation, the H2 coal sample exhibited a porosity growth rate reaching 153.6%, nearly five times higher than that observed under non-resonance conditions, thus highlighting the pronounced effect of resonance on pore development in coal samples. The permeability variations in coal samples under the two states are illustrated in Figure 12b. Both the H1 and H2 samples exhibited a consistent trend in permeability changes, which demonstrated a robust exponential relationship with excitation time. In the initial state, the permeabilities of H1 and H2 samples were measured as 0.000805 mD and 0.000761 mD, respectively. Following a stimulation time of 40 s, the permeabilities of these two coal samples increased by 0.0677 mD and 0.571 mD, correspondingly. Remarkably, ultrasonic vibration induced an increase in coal sample permeability by orders of magnitude, while resonance further amplified this effect by nearly 8.4 times compared to non-resonance conditions, indicating enhanced development of internal pores and fractures within the coal samples that significantly strengthened interpore connectivity.

3.3. Multifractal Characterization of Pore Structure in Coal Samples

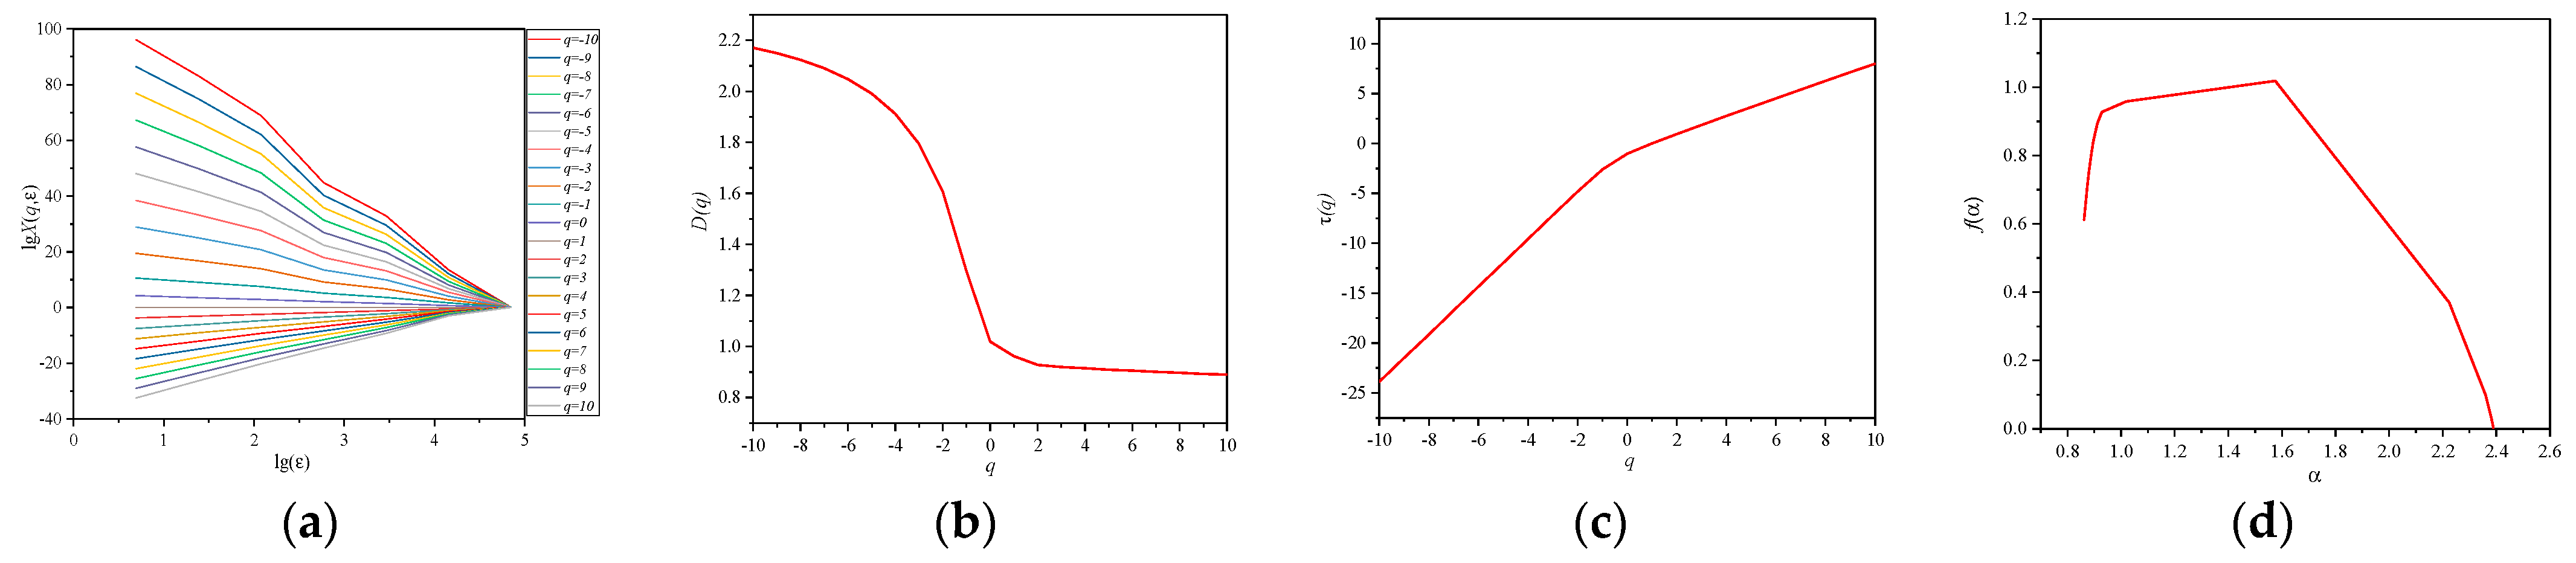
3.3.1. Multifractal Theory Based on NMR

The multifractal theory has been proven to be effective in characterizing the pore structure characteristics of coal and rock at various scales by employing a specific scale box for target segmentation and calculating the probability of occurrence within each box. In this study, the T2 spectrum of coal samples was normalized and accumulated to obtain the distribution sequence of transverse relaxation time and pore volume ratio. The relaxation time range is denoted as ε, which is divided into N(ε) parts, and subsequently, the distribution probability for each segment set accounting for the distribution sequence is calculated as follows [22]:
P i ( ε ) = M i ( ε ) i = 1 N ( ε ) M i ( ε )
where Mi(ε) represents the cumulative value of NMR T2 spectral data within the i th segment set, and the relationship between the probability measure of the probability distribution associated with the i th segment set and the relaxation time range ε is as follows [23]:
P i ( ε ) ε α i
The singular intensity αi represents the distribution density of the i-th data set, while Nα(ε) denotes the number of segmentation sets with the same singular intensity α at scale ε, which can be expressed as [23]:
N α ( ε ) ε f ( α )
The multifractal spectrum, denoted as f(α), represents the frequency of occurrence of singular intensity α in all segment sets. To accurately capture the multifractal characteristics, we define the partition function as follows [23]:
N α ( ε ) ε f ( α )
where q denotes the step distance, −∞ ≤ q ≤ +∞, and τ(q) represents the mass function, which is defined as follows:
τ ( q ) = lim ε 0 lg X ( q , ε ) lg ε
The generalized multifractal dimensions are as follows [24]:
D ( q ) = { τ ( q ) 1 q = 1 q 1 lg i = 1 N ( ε ) P i ( ε ) q lg ε , q 1 i = 1 N ( ε ) P i ( ε ) lg P i ( ε ) lg ε , q = 1
According to the Legendre transformation, the following formula can be derived [24]:
{ f ( α ) = q α ( q ) τ ( q ) α ( q ) = d τ ( q ) d q
where α~f(α) represents a multifractal spectrum reflecting the non-uniform distribution of multifractals. The fractal characteristics of the data are characterized by extracting α(q), f(α), and Δα from the multifractal spectrum, where Δα = αmaxαmin denotes the spectral width. Here, αmax and αmin correspond to the maximum and minimum values of singular intensity, respectively. According to multifractal theory, singular intensity α reflects the scale characteristics of the fractal set. A larger value of α indicates lower probability and greater dispersion in the fractal probability measure. In this paper, Δα signifies differences between pores of varying sizes. The parameter Δf = fmax) − fmin) in the multifractal spectrum reflects variations in macropore versus small pore numbers, with Δf > 0 indicating a dominant role played by the macropore.
According to the multifractal theory, we conducted a multifractal analysis of the nuclear magnetic resonance T2 spectrum of red sandstone. The calculation process involved normalizing the NMR T2 spectrum and obtaining the cumulative distribution curve of red sandstone porosity. We then segmented this curve using boxes with different scales ε and obtained relationship curves between partition function and scale at various step intervals [qmin, qmax]. The mass index τ(q) was determined by fitting the lgX(q,ε) ~ lgε curve slope. Finally, we calculated f(α) and α values at all steps and scales to obtain the multifractal spectrum.

3.3.2. Multifractal Characteristics

After normalizing the T2 spectrum data of the saturated coal sample, the step range (q) was set to −10~10 with a step size of 1, and multifractal calculations were performed using MATLAB 2021 software programming. Figure 13 illustrates the T2 spectral fractal curve. Figure 13a displays the distribution function curve in a log–log coordinate system. It can be observed from the figure that the lgX(q,ε)~ lgε curve can be approximated as a straight line, indicating a linear correlation and demonstrating good scale invariance across different scales. This further suggests that red sandstone exhibits distinct multifractal characteristics, reflecting its non-uniform pore distribution. Figure 13b,c depict the generalized fractal dimension spectrum D(q)~q and mass function spectrum τ(q)~q, respectively. When q is not equal to 1, these spectra satisfy Formula 9, which establishes their relationship. Lastly, Figure 13d presents the multifractal spectrum f(α)~α, which describes local perspectives on multifractals.
The uneven distribution of pore structure in coal samples imparts multifractal characteristics to rock samples, indicating a certain correlation between pore structure and multifractal parameters. Ultrasonic vibration excitation induces changes in the fractal characteristics of coal samples, which are influenced by alterations in the pore structure. The generalized fractal spectrum and multifractal spectrum of rock samples H1 and H2 were calculated after ultrasonic vibration excitation at different stages, as depicted in Figure 14. The value of the fractal spectrum initially increased and then decreased with an increase in the singularity index α. In the initial stage, both H1 and H2 samples exhibited relatively close spectral widths Δα (1.288 for H1 and 1.216 for H2), suggesting minimal differences in internal pore structures between these two samples with similar multifractal characteristics. Analysis of T2 spectral curves reveals that both the H1 and H2 samples’ internal pore distribution encompassed micropores to large pores, exhibiting high homogeneity with a fractal dimension closer to 1, signifying simple fractal characteristics. At this stage, corresponding Δf values for both samples were negative (−0.611 for H1 and −0.688 for H2), indicating predominance of micropores and mesopores within the coal samples’ internal structure.
The spectral widths Δα and Δf in the multifractal spectrum were utilized to depict the heterogeneous characteristics of pore distribution within the rock. The analysis parameters and corresponding pore ratios for both samples at different loading stages were extracted and summarized in Table 3. Figure 14 illustrates the fitting curves depicting variations in pore ratios of micropores, mesopores, and macropores with changes in multifractal parameters.
Figure 14 illustrates the fitting curves depicting variations in pore ratios of micropores, mesopores, and macropores with changes in multifractal parameters. The proportion of mesopores and macropores in samples increased with the increase in ΔD(q), while the proportion of micropores exhibited an opposite trend. The Dmax value corresponding to small q values primarily reflects the fractal characteristics of the large pore structure, thus showing a positive correlation with the content of large pores and a negative correlation with the content of micropores. When q > 0, the generalized fractal spectrum curves for each rock sample essentially coincided; therefore, variations in pore proportions with multifractal ΔD(q) followed a similar trend as that observed for Dmax. With increasing Δα, there was a gradual decrease in micropore proportion and an accompanying increase in mesopore and macropore proportions. as Δf increased, there was an increase in micropore proportion, but a decrease in mesopore and macropore proportions.
The process of enhancing the permeability of coal and rock through ultrasonic vibration cracking not only involves the formation of macroscopic fissures, but also influences the microscopic pore structure. High-frequency ultrasonic vibrations can stimulate the propagation of microcracks in coal rock, particularly affecting the propagation and connectivity of existing pores and microcracks. Under the influence of ultrasonic vibration, there are changes in the pore structure of coal, leading to local stress concentration, which results in new crack formation and expansion of original pores. This phenomenon is closely associated with multifractal theory: cracks and pores generated by ultrasonic waves exhibit more intricate distribution characteristics, which can be better quantified and characterized through multifractal analysis. Multifractal theory enables capturing the distribution characteristics of these pores and fractures at various scales. In this study, we employ multifractal theory to quantitatively describe alterations in pore structure before and after ultrasonic vibration on coal and rock, providing a foundation for predicting the impact of ultrasonic vibration on increasing their permeability.

4. Discussion and Conclusions

In this study, we conducted an ultrasonic high-frequency vibration excitation test on coal samples and combined it with nuclear magnetic resonance and permeability tests to analyze the evolution characteristics of internal pores and permeability in resonant and non-resonant states of coal samples. Furthermore, we revealed the fracture effect of coal and rock under high-frequency vibration excitation. Based on these findings, we analyzed the multifractal characteristics of pore structure in coal samples, leading to the following main conclusions:
(1)
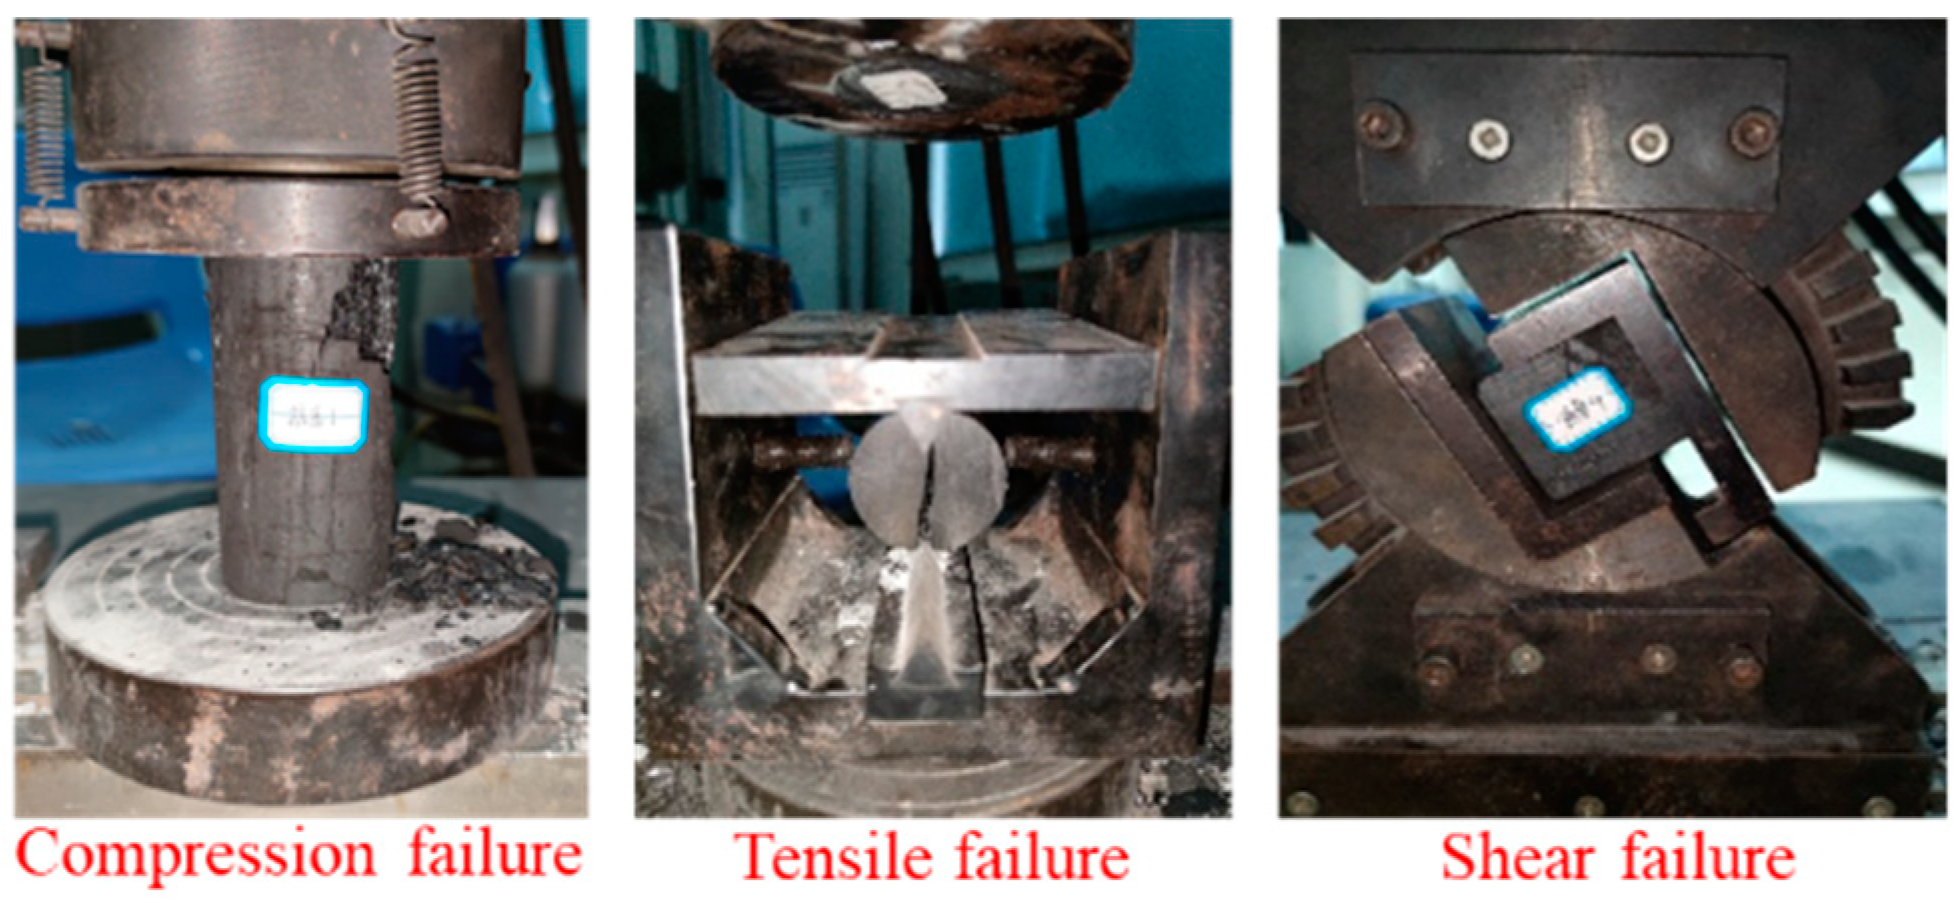
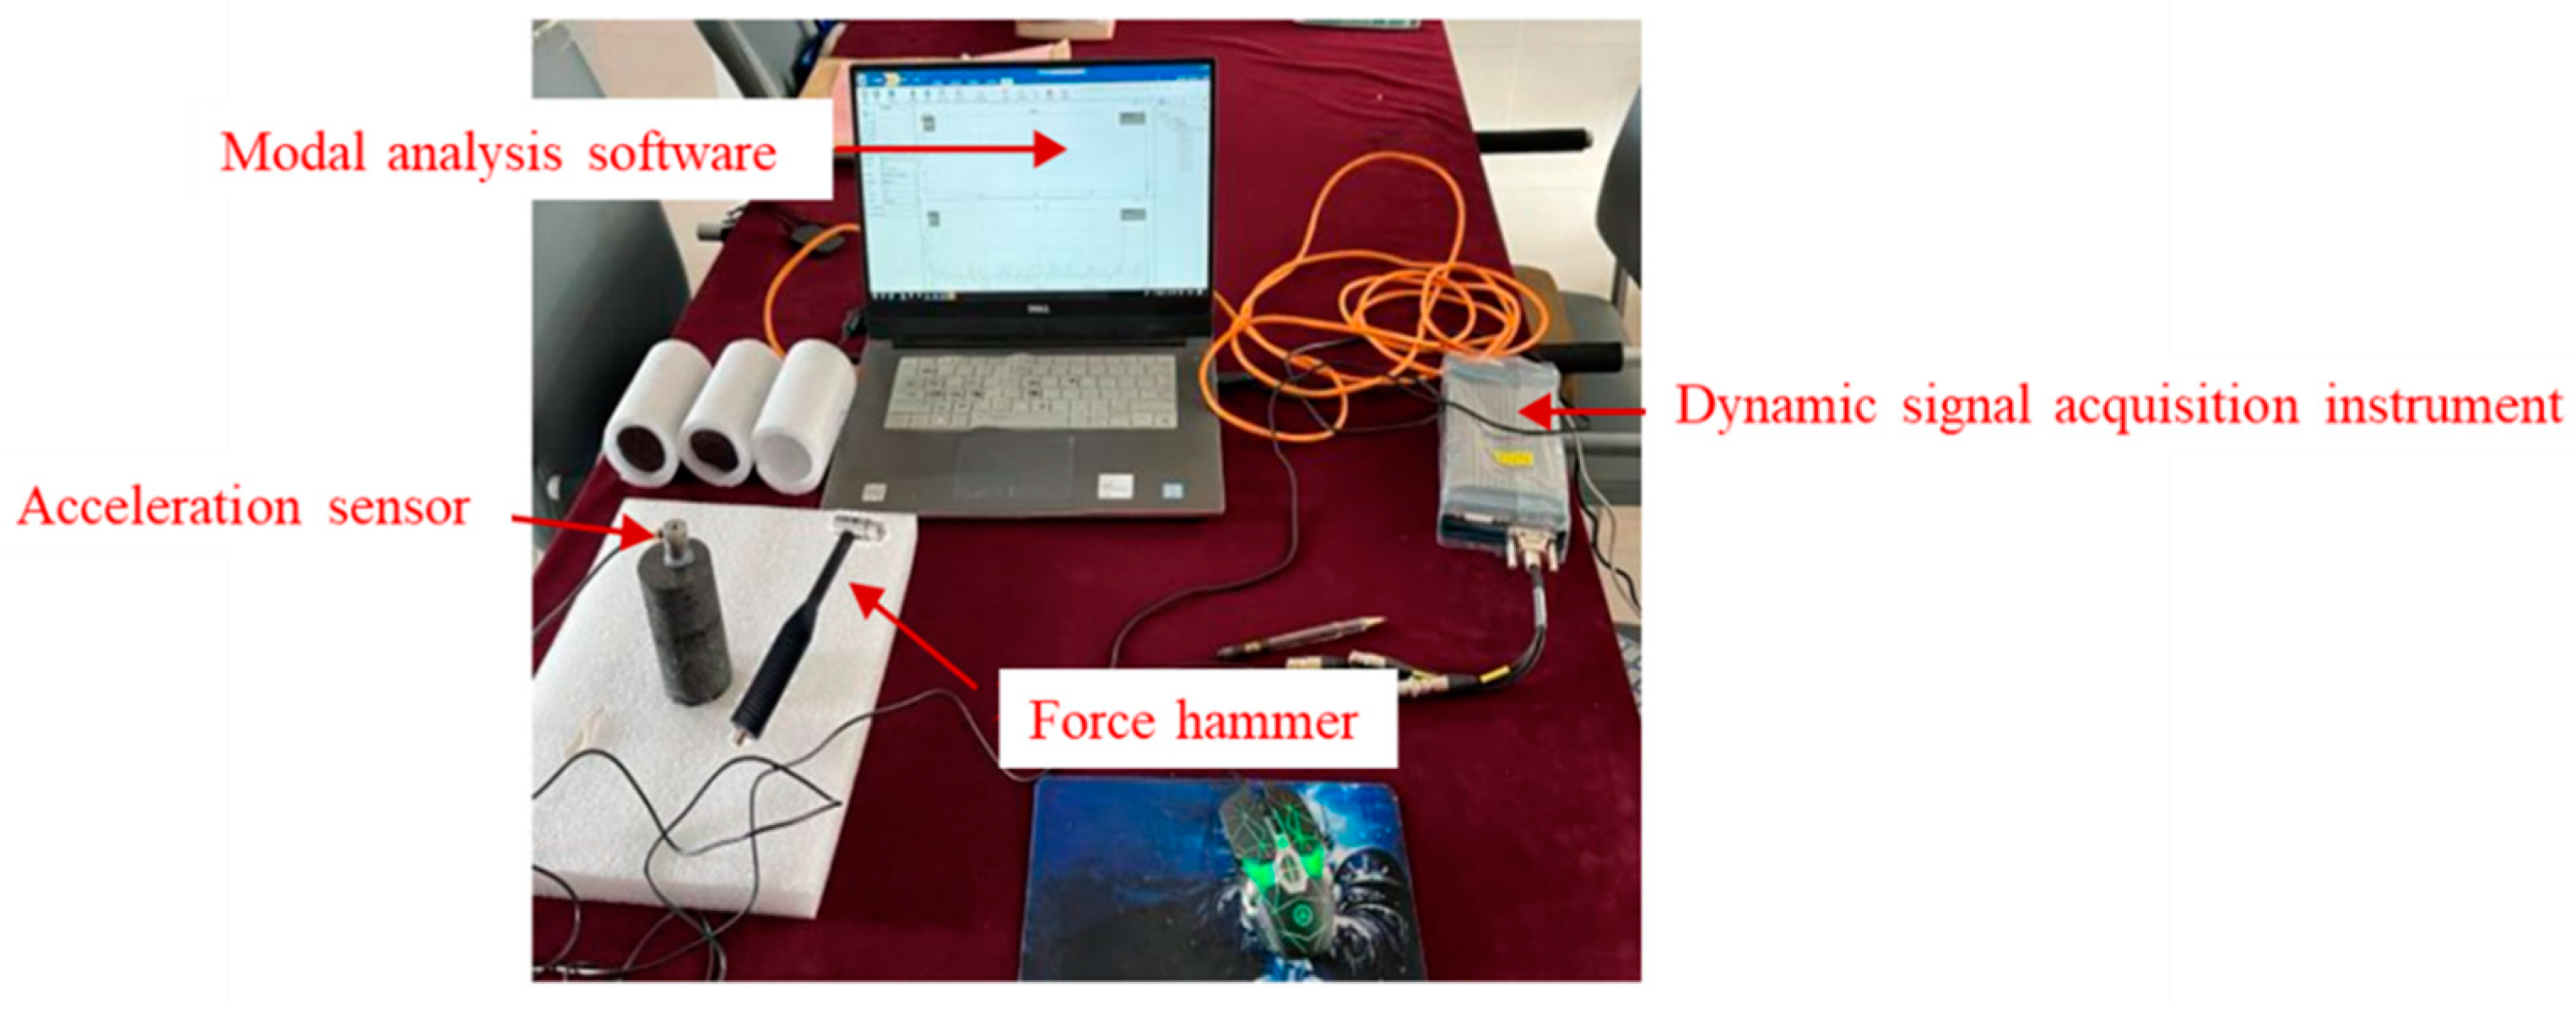
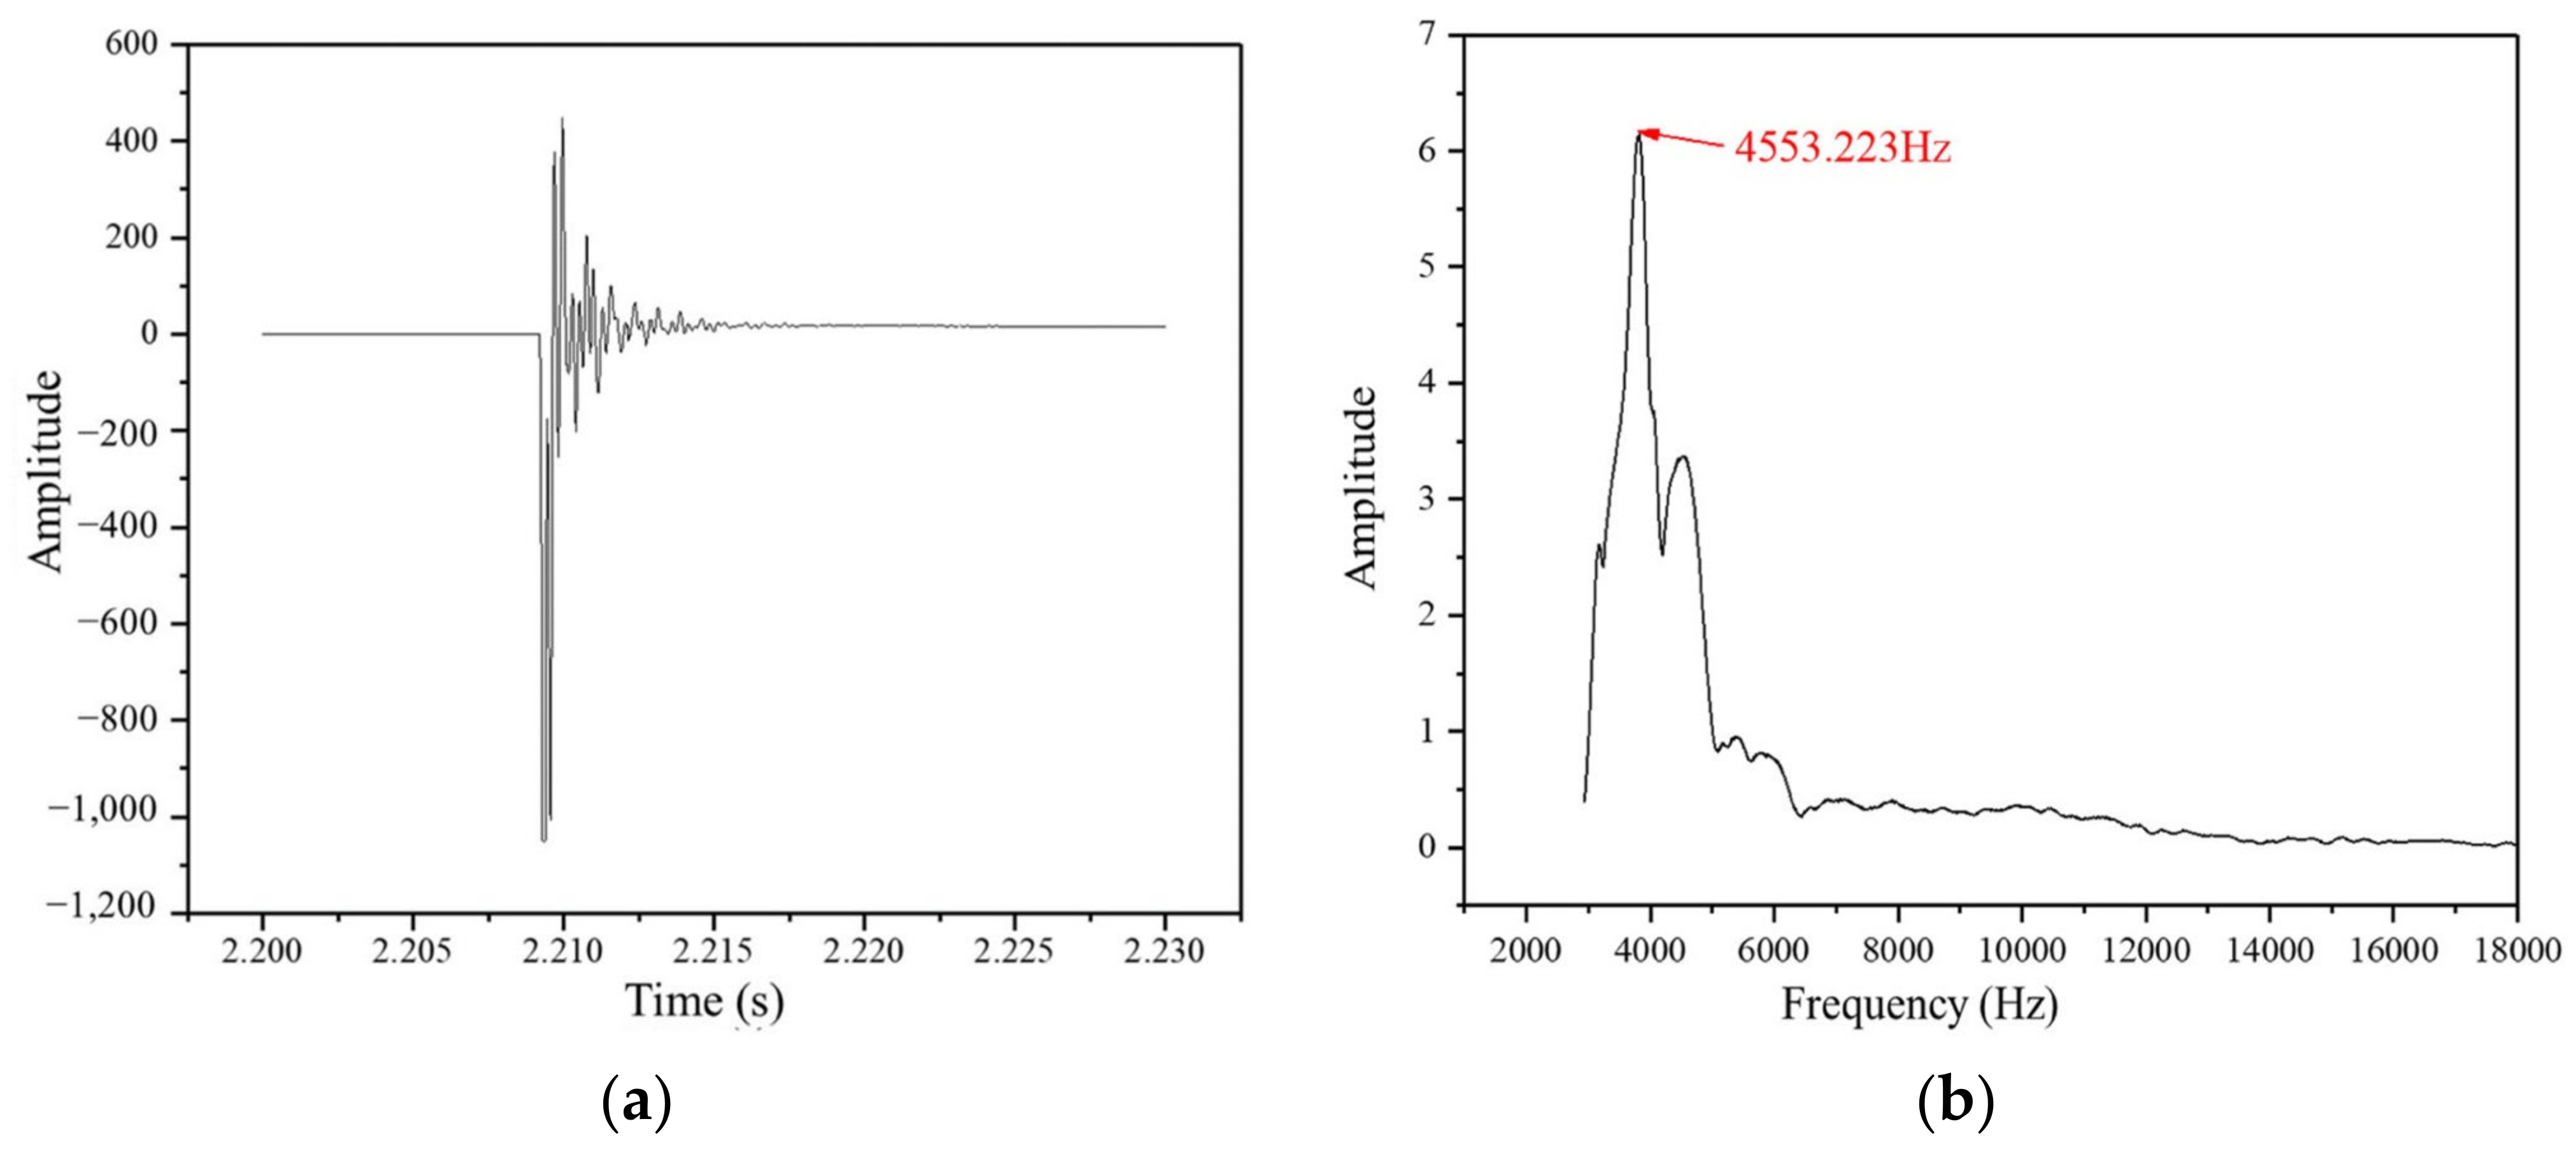
The natural frequency of a coal sample is inversely proportional to its mass. By adjusting the size of a cylindrical coal sample to have a diameter of 25 mm and height of 30 mm, we determined that its natural frequency reaches 15 kHz, enabling resonance under vibration system excitation.
(2)
High-frequency vibration stimulation promotes the development of micropores and mesopores in the coal sample, with porosity and permeability showing positive correlation with stimulation time index. Within 40 s of excitation, porosity increased by at least 32.4%, while permeability increased by more than two orders of magnitude.
(3)
At an equal exciting time (40 s), the resonance state exhibited increments in porosity and permeability that were 5 times and 8.4 times higher than those observed in the non-resonance state, respectively. Seepage behavior and cracking efficiency were significantly enhanced during the resonance state compared to the non-resonance state.
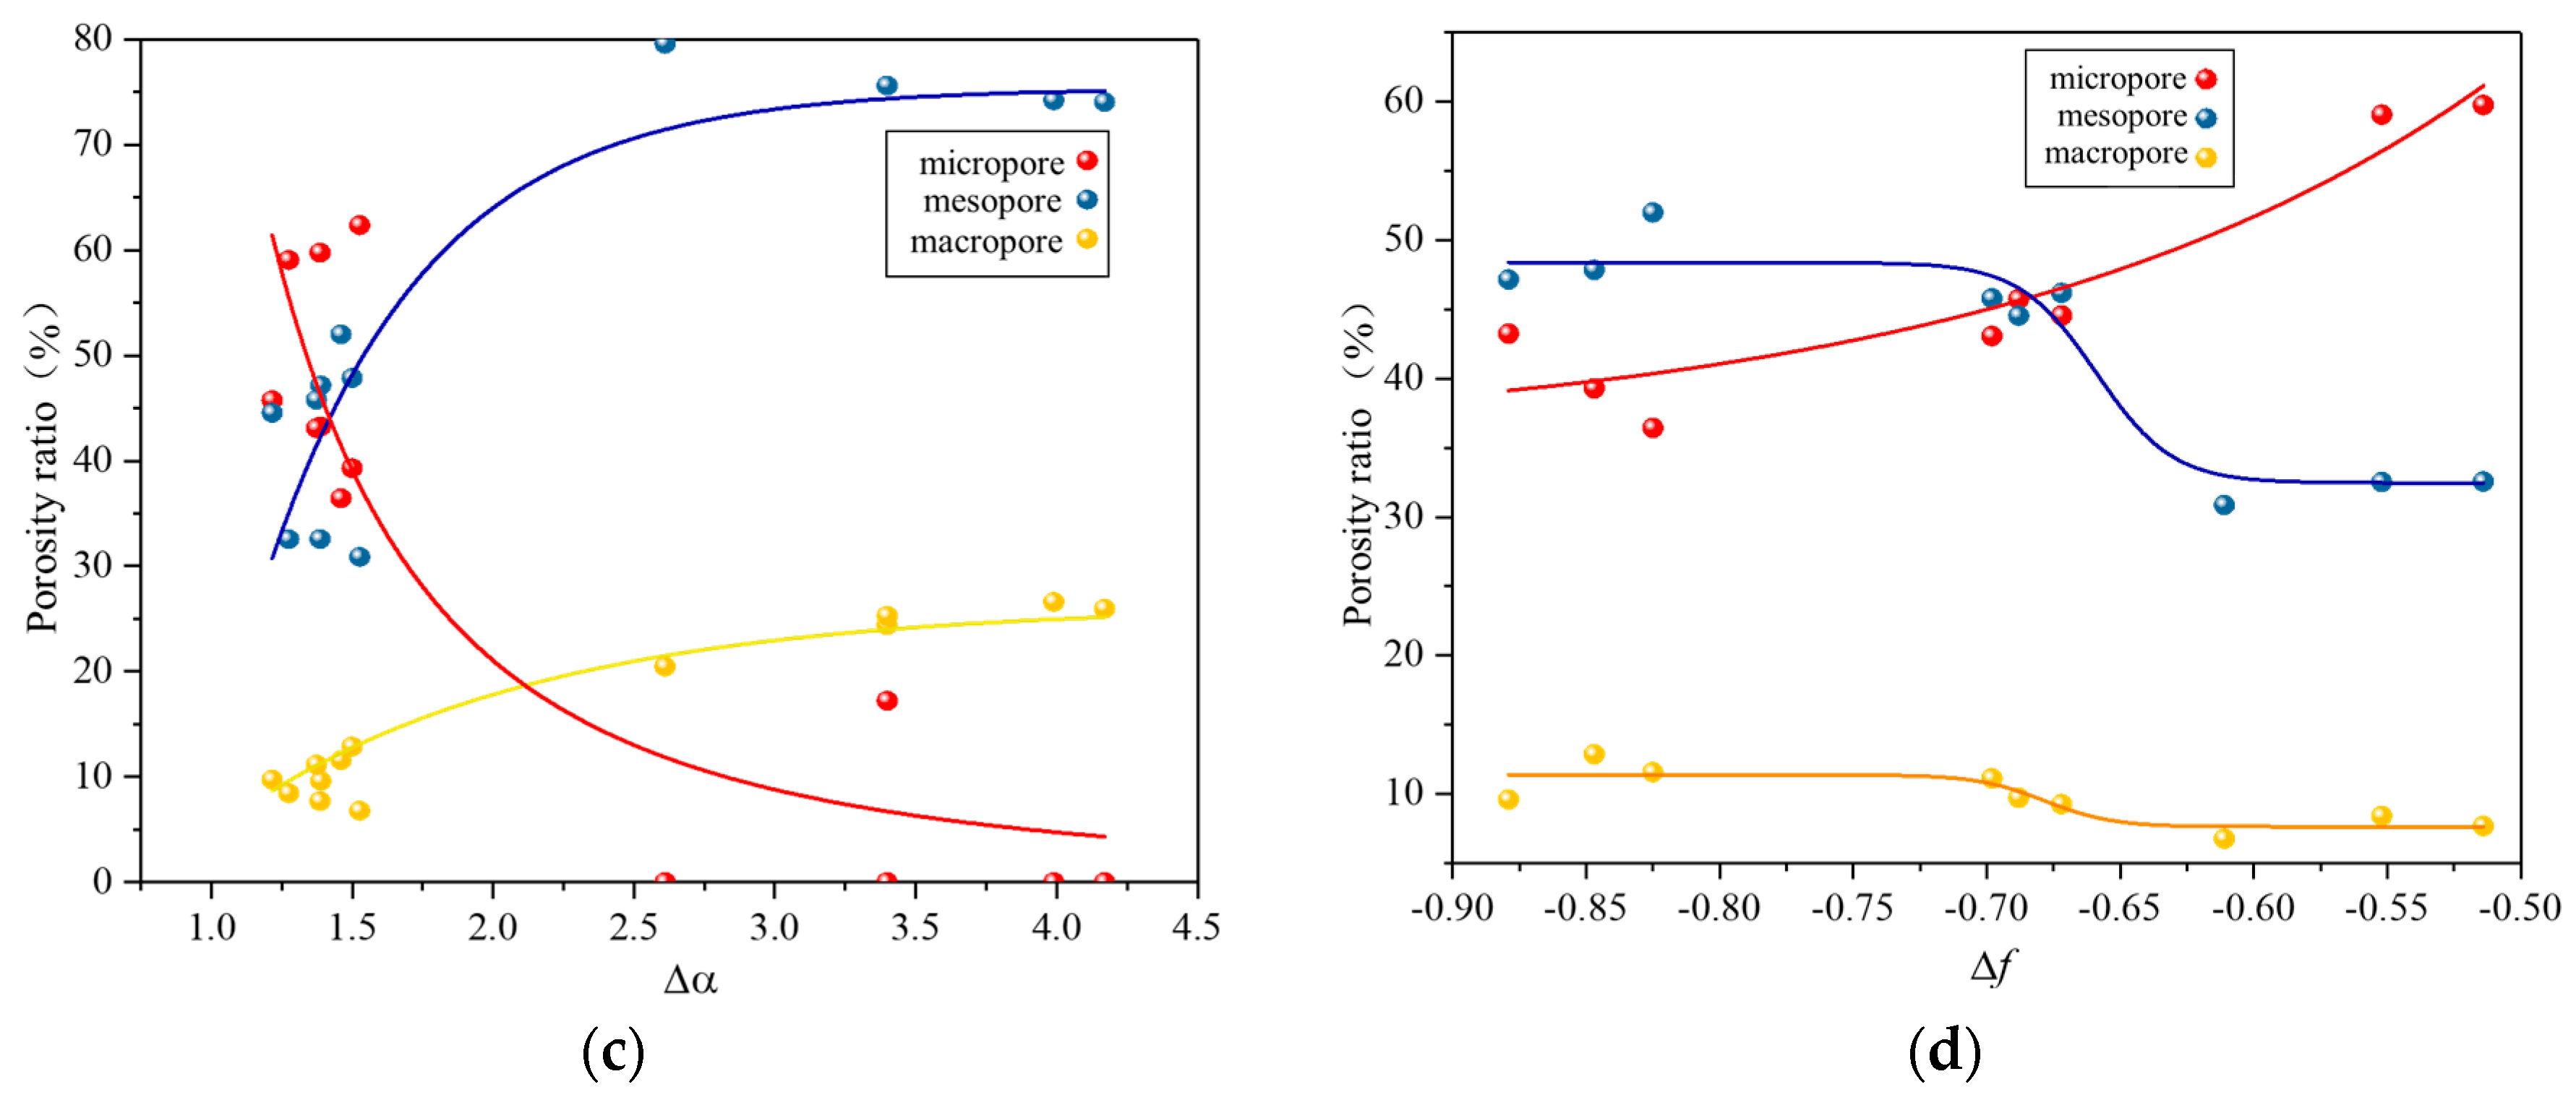
(4)
Multifractal parameters can effectively reflect pore size distribution characteristics in coal samples while characterizing complexity within their distribution patterns; ΔD(q)and Δα are directly mesopores as well as macropores, but are inversely proportional to micropores proportionally; conversely, Δf exhibits opposite trends.
This study validates the feasibility of employing ultrasonic vibration excitation method for coal cracking and permeability enhancement, albeit solely considering the influence of a single parameter (vibration frequency) on test outcomes. Further investigations are warranted to elucidate the mechanism underlying the impacts of other variable factors, such as physical properties and sizes of coal samples and vibration system parameters (amplitude, static load), on coal sample cracking efficacy. Future research should comprehensively consider multiple factors to identify optimal parameter matching schemes that maximize media cracking penetration effect, facilitate equipment upgrades, and promote engineering applications of this method

Author Contributions

Conceptualization, X.W.; Software, Z.N.; Formal analysis, L.Z.; Investigation, L.Z.; Resources, Z.N.; Data curation, X.W.;Writing—original draft, L.Z.;Writing—review & editing, L.Z.; Visualization, Z.N. All authors have read and agreed to the published version of the manuscript.

Funding

This research was funded by the Fundamental Research Funds for the Central Universities (2023QN1005), the National Natural Science Foundation of China (52404150, 52374146, 51874282, 52404), and the Six Talent Peaks Project in Jiangsu Province (GDZB-052).

Data Availability Statement

Data are contained within the article.

Acknowledgments

Great appreciation goes to the editorial board and the reviewers of this paper.

Conflicts of Interest

The authors declare no conflict of interest.

References

  1. Zhang, S.; Zhang, D.; Feng, G.; Chi, M.; Bar-Cohen, Y. Modelling method of heterogeneous rock mass and DEM investigation of seepage characteristics. Geomech. Geophys. Geo-Energy Geo-Resour. 2024, 10, 46. [Google Scholar] [CrossRef]
  2. Zhu, D.; Yu, B.; Wang, D.; Zhang, Y. Fusion of finite element and machine learning methods to predict rock shear strength parameters. J. Geophys. Eng. 2024, 21, 1183–1193. [Google Scholar] [CrossRef]
  3. Fan, Z.; Fan, G.; Zhang, D.; Zhang, L.; Zhang, S.; Liang, S.; Yu, W. Optimal Injection Timing and Gas Mixture Proportion for Enhancing Coalbed Methane Recovery. Energy 2021, 222, 119880. [Google Scholar] [CrossRef]
  4. Fan, Z.; Fan, G.; Zhang, D. Representation of mining permeability and borehole layout optimization for efficient methane drainage. Energy Rep. 2021, 7, 3911–3921. [Google Scholar] [CrossRef]
  5. Gao, R.; Kuang, T.; Meng, X.; Huo, B. Effects of ground fracturing with horizontal fracture plane on rock breakage characteristics and mine pressure control. Rock Mech. Rock Eng. 2021, 54, 3229–3243. [Google Scholar] [CrossRef]
  6. Gao, R.; Bai, D.; Yu, B.; Tai, Y.; Meng, X.; Zhang, W. Ground fracturing of multi-strata for strong ground pressure control in extra-thick coal seams with hard roofs: Numerical simulation and case study. Eng. Fract. Mech. 2024, 303, 110129. [Google Scholar] [CrossRef]
  7. Fan, Z.; Fan, G.; Zhang, D. Permeability and Energy Evolution Characteristics of Heterogeneous Coal and Rock Mass. Nat. Resour. Res. 2021, 30, 4493–4514. [Google Scholar] [CrossRef]
  8. Zhao, D.; Wang, M.; Gao, X. Study on the technology of enhancing permeability by deep hole presplitting blasting in Sanyuan coal mine. Sci. Rep. 2021, 11, 20353. [Google Scholar] [CrossRef] [PubMed]
  9. Cai, F.; Liu, Z. Intensified extracting gas and rapidly diminishing outburst risk using deep-hole presplitting blast technology before opening coal seam in shaft influenced by fault. Procedia Eng. 2011, 26, 418–423. [Google Scholar]
  10. Guo, C.; Feng, Q.; Ma, T.; Wang, S.; Zhou, R.; Wang, B. Coupled flow-geomechanics studies on the role of hydrofracturing and secondary fracturing in CO2-enhanced coalbed methane. Energy Explor. Exploit. 2021, 39, 1622–1639. [Google Scholar] [CrossRef]
  11. Zou, Q.; Liu, H.; Jiang, Z.; Wu, X. Gas flow laws in coal subjected to hydraulic slotting and a prediction model for its permeability-enhancing effect. Energy Sources Part A-Recovery Util. Environ. Eff. 2021, 2021, 1936692. [Google Scholar] [CrossRef]
  12. Zhao, D.; Zhang, S.; Wang, M. Microcrack Growth Properties of Granite under Ultrasonic High-Frequency Excitation. Adv. Civ. Eng. 2019, 2019, 3069029. [Google Scholar] [CrossRef]
  13. Han, J.; Zhao, D.; Zhang, S.; Zhou, Y. Damage Evolution of Granite under Ultrasonic Vibration with Different Amplitudes. Shock Vib. 2022, 2022, 8975797. [Google Scholar] [CrossRef]
  14. Yin, S.; Zhao, D.; Zhai, G. Investigation into the characteristics of rock damage caused by ultrasonic vibration. Int. J. Rock Mech. Min. Sci. 2016, 84, 159–164. [Google Scholar] [CrossRef]
  15. Zhou, Y.; Tang, Q.; Zhang, S.; Zhao, D. The Mechanical Properties of Granite under Ultrasonic Vibration. Adv. Civ. Eng. 2019, 2019, 9649165. [Google Scholar] [CrossRef]
  16. Zhang, L.; Wang, X.; Wang, J.; Yang, Z. Mechanical characteristics and pore evolution of red sandstone under ultrasonic high-frequency vibration excitation. AIP Adv. 2021, 11, 055202. [Google Scholar] [CrossRef]
  17. Zhang, J.; Zhang, L.; Wang, X.; Niu, Z.; Yang, Z. Influence of High-Frequency Ultrasonic Vibration Load on Pore-Fracture Structure in Hard Rock: A Study Based on 3D Reconstruction Technology. Materials 2024, 17, 1127. [Google Scholar] [CrossRef]
  18. Bieniawski, Z.; Bernede, M. Suggested methods for determining the uniaxial compressive strength and deform-ability of rock materials. Int. J. Rock Mech. Min. Sci. Geomech. Abstr. 1979, 16, 138–140. [Google Scholar] [CrossRef]
  19. Li, W.; Yan, T.; Li, S.; Zhang, X. Rock fragmentation mechanisms and an experimental study of drilling tools during high-frequency harmonic vibration. Pet. Sci. 2013, 10, 205–211. [Google Scholar] [CrossRef]
  20. Wang, F.; Yang, K.; Cai, J. Fractal characterization of tight oil reservoir pore structure using nuclear magnetic resonance and mercury intrusion porosimetry. Fractals-Complex Geom. Patterns Scaling Nat. Soc. 2018, 26, 1840017. [Google Scholar] [CrossRef]
  21. Xu, H.; Fan, Y.; Hu, F.; Li, C.; Yu, J.; Liu, Z.; Wang, F. Characterization of pore throat size distribution in tight sandstones with nuclear magnetic resonance and high-pressure mercury intrusion. Energies 2019, 12, 1528. [Google Scholar] [CrossRef]
  22. Ferreiro, J.; Wilson, M.; Vázquez, E. Multifractal description of nitrogen adsorption isotherms. Vadose Zone J. 2009, 8, 209–219. [Google Scholar] [CrossRef]
  23. Vázquez, E.; Ferreiro, J.; Miranda, J.; González, A. Multifractal analysis of pore size distributions as affected by simulated rainfall. Vadose Zone J. 2008, 7, 500–511. [Google Scholar] [CrossRef]
  24. Halsey, T.; Jensen, M.; Kadanoff, L.; Procaccia, I.; Shraiman, B. Fractal measures and their singularities: The characterization of strange sets. Phys. Rev. A Gen. Phys. 1986, 33, 1141–1151. [Google Scholar] [CrossRef] [PubMed]
Figure 1. Coal samples for mechanical testing.
Fractalfract 08 00546 g001
Figure 2. Failure characteristics of coal samples.
Fractalfract 08 00546 g002
Figure 3. Natural frequency testing system.
Fractalfract 08 00546 g003
Figure 4. Natural frequency test results of coal sample with diameter of 50 mm and height of 100 mm: (a) time–domain signal; (b) frequency–domain signal.
Fractalfract 08 00546 g004
Figure 5. Coal samples with diameter of 50 mm and height of 100 mm.
Fractalfract 08 00546 g005
Figure 6. High-frequency vibration testing system.
Fractalfract 08 00546 g006
Figure 7. Nuclear magnetic resonance system testing system.
Fractalfract 08 00546 g007
Figure 8. (a) Permeability test device; (b) permeability testing procedure.
Fractalfract 08 00546 g008
Figure 9. NMR T2 spectra of two coal samples: (a) H1; (b) H2.
Fractalfract 08 00546 g009
Figure 10. Evolution of T2 spectrum curves of three rock samples: (a) H1; (b) H2.
Fractalfract 08 00546 g010
Figure 11. Proportion of each peak area of samples under different excitation times: (a) H1; (b) H2.
Fractalfract 08 00546 g011aFractalfract 08 00546 g011b
Figure 12. Evolution of sample porosity and permeability in resonant and non-resonant states: (a) porosity; (b) permeability.
Fractalfract 08 00546 g012
Figure 13. (a) Logarithmic curve of partition function and scale; (b) generalized fractal dimension spectrum; (c) mass function spectrum; (d) multifractal spectrum.
Fractalfract 08 00546 g013
Figure 14. The correlation between pore proportion and multifractal parameters: (a) Dmax; (b) ΔD(q); (c) Δα; (d) Δf.
Fractalfract 08 00546 g014aFractalfract 08 00546 g014b
Table 1. Results of the compressive and tensile strength testing.
SamplesD/mmH/mmCompressive Strength/MPa
Y149.42102.717.31
Y250.12100.8410.64
Y350.62101.546.14
SamplesD/mmH/mmTensile strength/MPa
SL149.1325.220.79
L249.5824.720.99
L349.7024.876.69
Note: D—Diameter; H—Height.
Table 2. Testing system parameters.
Frequency/kHzAmplitude/μmStatic Load/MPaLoad Area/mm2Power/kW
15.20700~1176.71.5
Table 3. Multifractal characteristic parameters of samples under different vibration excitation stages.
SamplesTimePorosity Ratio (%)DmaxDminΔD(q)ΔαΔf
MicroporeMesoporeMacropore
H1043.2447.159.613.3260.8882.4381.388−0.879
4044.5546.189.274.2300.8913.3393.399−0.672
8036.4351.9911.583.8490.8722.9771.460−0.825
H2045.7444.549.723.8760.8972.9791.216−0.688
4043.0845.7911.133.8900.8952.9951.373−0.698
8039.2947.8412.873.8970.8893.0081.499−0.847
Disclaimer/Publisher’s Note: The statements, opinions and data contained in all publications are solely those of the individual author(s) and contributor(s) and not of MDPI and/or the editor(s). MDPI and/or the editor(s) disclaim responsibility for any injury to people or property resulting from any ideas, methods, instructions or products referred to in the content.

