Article

Degradation Characteristics of Coal Samples Under the Dry–Wet Cycle Action of Acidic, High-Salinity Solutions: Experimental Study and Fractal Analysis

1
School of Resources and Safety Engineering, University of Science and Technology Beijing, Beijing 100083, China
2
School of Resource Environment and Safety Engineering, University of South China, Hengyang 421001, China
3
Shunde Innovation School, University of Science and Technology Beijing, Foshan 528399, China
*
Author to whom correspondence should be addressed.
Fractal Fract. 2025, 9(4), 221; https://doi.org/10.3390/fractalfract9040221
Submission received: 6 March 2025 / Revised: 26 March 2025 / Accepted: 30 March 2025 / Published: 1 April 2025

Abstract

:
Uniaxial compression tests were conducted on coal samples subjected to different dry–wet cycling treatments to investigate the damage and degradation mechanisms of coal samples under the dry–wet cyclic action of acidic, high-salinity solutions. The damage process of the coal samples was monitored in situ using acoustic emission (AE). The degradation evolution of the mechanical parameters and macroscopic failure modes with the number of cycles was analyzed. Based on the AE ringing parameters, the RA-AF distribution and the AE fractal dimension’s variation characteristics were studied. Additionally, scanning electron microscopy (SEM) was used to observe the microstructure of the coal samples. The results showed that with the increase in the number of dry–wet cycles, both the peak strength and elastic modulus of the coal samples exhibited varying degrees of degradation, and the failure mode gradually shifted from tensile failure to shear failure. AE ringing counts decreased progressively, while the proportion of shear cracks based on the RA-AF classification increased. At the same time, the mean AE fractal dimension of the coal samples increased, and the fractal dimension decreased with an increase in AE ringing counts. The sharp drop in fractal dimensions could serve as an early warning signal for a major failure in the coal samples. Furthermore, under the influence of dry–wet cycling in acidic, high-salinity solutions, defects such as pores and cracks in the microstructure of the coal samples became more pronounced, and the degradation effect continuously intensified.

1. Introduction

As coal resources in the central and eastern regions of China gradually deplete, the western areas have become the primary coal suppliers [1,2]. The “coal-rich, water-poor” geological characteristic is typical of these western regions [3,4]. Underground reservoirs, as an innovative water resource management method, have become an effective pathway for the efficient use and rational storage of water resources [5,6]. The reserved coal pillars are the primary structural components of the underground reservoir dam, and their stability plays a critical role in ensuring the safe operation of the reservoir. During the operation of the coal pillar dam, it is not only affected by mining pressure but also subject to long-term repeated immersion in mine water. Under such dry–wet cyclic conditions, both the surface and internal structure of the coal body experience varying degrees of damage and degradation, posing a threat to the stability of the reservoir dam. Additionally, mine water in the western mining areas is characterized by significant variations in water content and high salinity, with high concentrations of corrosive ions such as salts and acids [7]. Under these conditions, the degradation mechanism of the coal pillar dam in an ion-rich environment becomes more complex. Therefore, studying the mechanical properties and damage mechanisms of coal samples under the dry–wet cyclic action of acidic, high-salinity solutions is crucial for the design and stability protection of coal mine underground reservoirs.
In recent years, scholars both domestically and internationally have conducted extensive research on the physicomechanical properties of coal under interaction with water. Li et al. [8] performed longitudinal wave velocity tests on coal samples with varying porosities and water contents, finding that the wave velocity increased with increasing water saturation but decreased with increasing porosity. Perera et al. [9] compared the mechanical properties of saturated and dry coal samples and found that water can reduce the strength of coal samples. Poulsen et al. [10] studied the strength attenuation characteristics of coal samples and conducted a numerical study on the degradation of coal pillars in a water-saturated state by measuring the mechanical parameters of coal samples with different moisture contents. Vishal et al. [11] studied the crack propagation characteristics of coal samples under water saturation and found that the brittleness of coal decreases when saturated with water and that the crack initiation process is prolonged.
Chen et al. [12] conducted uniaxial compression tests on coal samples with different water contents and loading rates, observing that all mechanical parameters decreased with increasing water content and loading rates. Yang et al. [13] analyzed the energy evolution of coal samples with different water contents during impact splitting and found that water in the internal pores of saturated coal accelerated the destruction of the samples. A series of studies have also explored the damage characteristics of rocks under dry–wet cycles and chemical solutions. Liu et al. [14], Abdilor et al. [15], Ozbek [16], and Huang et al. [17] performed static compression tests on sandstone, molten limestone, and mudstone after dry–wet cycles. Their results showed that with an increase in the number of cycles, the mass, porosity, water content, P-wave velocity, uniaxial compressive strength, and triaxial compressive strength of the rock samples all decreased to varying extents. Scholars have also studied the damage characteristics of rocks from various perspectives, such as the water pH value (pH) [18,19], ion concentration [20], water temperature [21], and flow rate [22,23]. For example, Huo Runke et al. [24] analyzed the impact of acidic solutions with different pH values on the mechanical parameters of sandstone, finding that lower pH values resulted in more significant degradation effects on the sandstone. Gong et al. [25] studied the mechanical properties of red sandstone with pre-existing cracks after chemical hydration and analyzed the influence of different chemical solutions on the mechanical properties of sandstone. From the above studies, it is evident that current research has not fully clarified the damage mechanism of coal samples under dry–wet cycling, especially under the combined action of dry–wet cycles and chemical solutions, and further exploration is required.
AE technology, as a non-destructive testing method, has been widely applied to study rock damage and failure [26,27]. By analyzing AE signals during the damage process of rocks, it is possible to gain deeper insights into the crack development and damage characteristics of coal and rock during fracture [28]. Wen et al. [29] studied the AE characteristics of sandstone with different water contents under uniaxial compression, finding that higher water content resulted in fewer and more delayed AE ringing counts. Ran et al. [30] investigated the proportion of shear cracks in coal samples under uniaxial multi-stage cyclic loading, considering initial damage, and found that as initial damage increased, the proportion of shear cracks also increased. Additionally, fractal theory has been increasingly applied in the study of AE characteristics. Gao et al. [31] studied the fractal characteristics of AE during the fracture process of coal samples with varying water contents, establishing a relationship between fractal dimensions and mechanical response characteristics. Tang et al. [32] investigated the AE fractal features during uniaxial compression of coal and rock at different dip angles, finding that the fractal dimension increased with increasing dip angle. In summary, AE technology and fractal analysis can effectively reflect the degree of damage to rocks, but the application of fractal theory in the mechanical properties of coal samples under the combined action of dry–wet cycles and chemical solutions remains limited, and research is scarce on the AE characteristics of coal samples under the dry–wet cycling action of acidic, high-salinity solutions.
In conclusion, there is limited research on the degradation mechanisms, AE characteristics, and fractal features of the AE parameters of coal samples under the combined action of dry–wet cycles and chemical solutions. Therefore, this study aims to investigate the degradation of mechanical properties and the damage mechanisms of coal samples under the dry–wet cycling action of acidic, high-salinity solutions by conducting uniaxial compression tests. The study explores the failure modes of coal samples under dry–wet cycles, analyzes AE counting characteristics, and reveals the fractal features of AE counts based on fractal theory. Furthermore, the study discusses the damage evolution mechanisms of the microstructure of coal samples under dry–wet cycling. The findings of this study are of significant importance for the stability and mechanical behavior of underground reservoir dams in western mining areas.

2. Methods

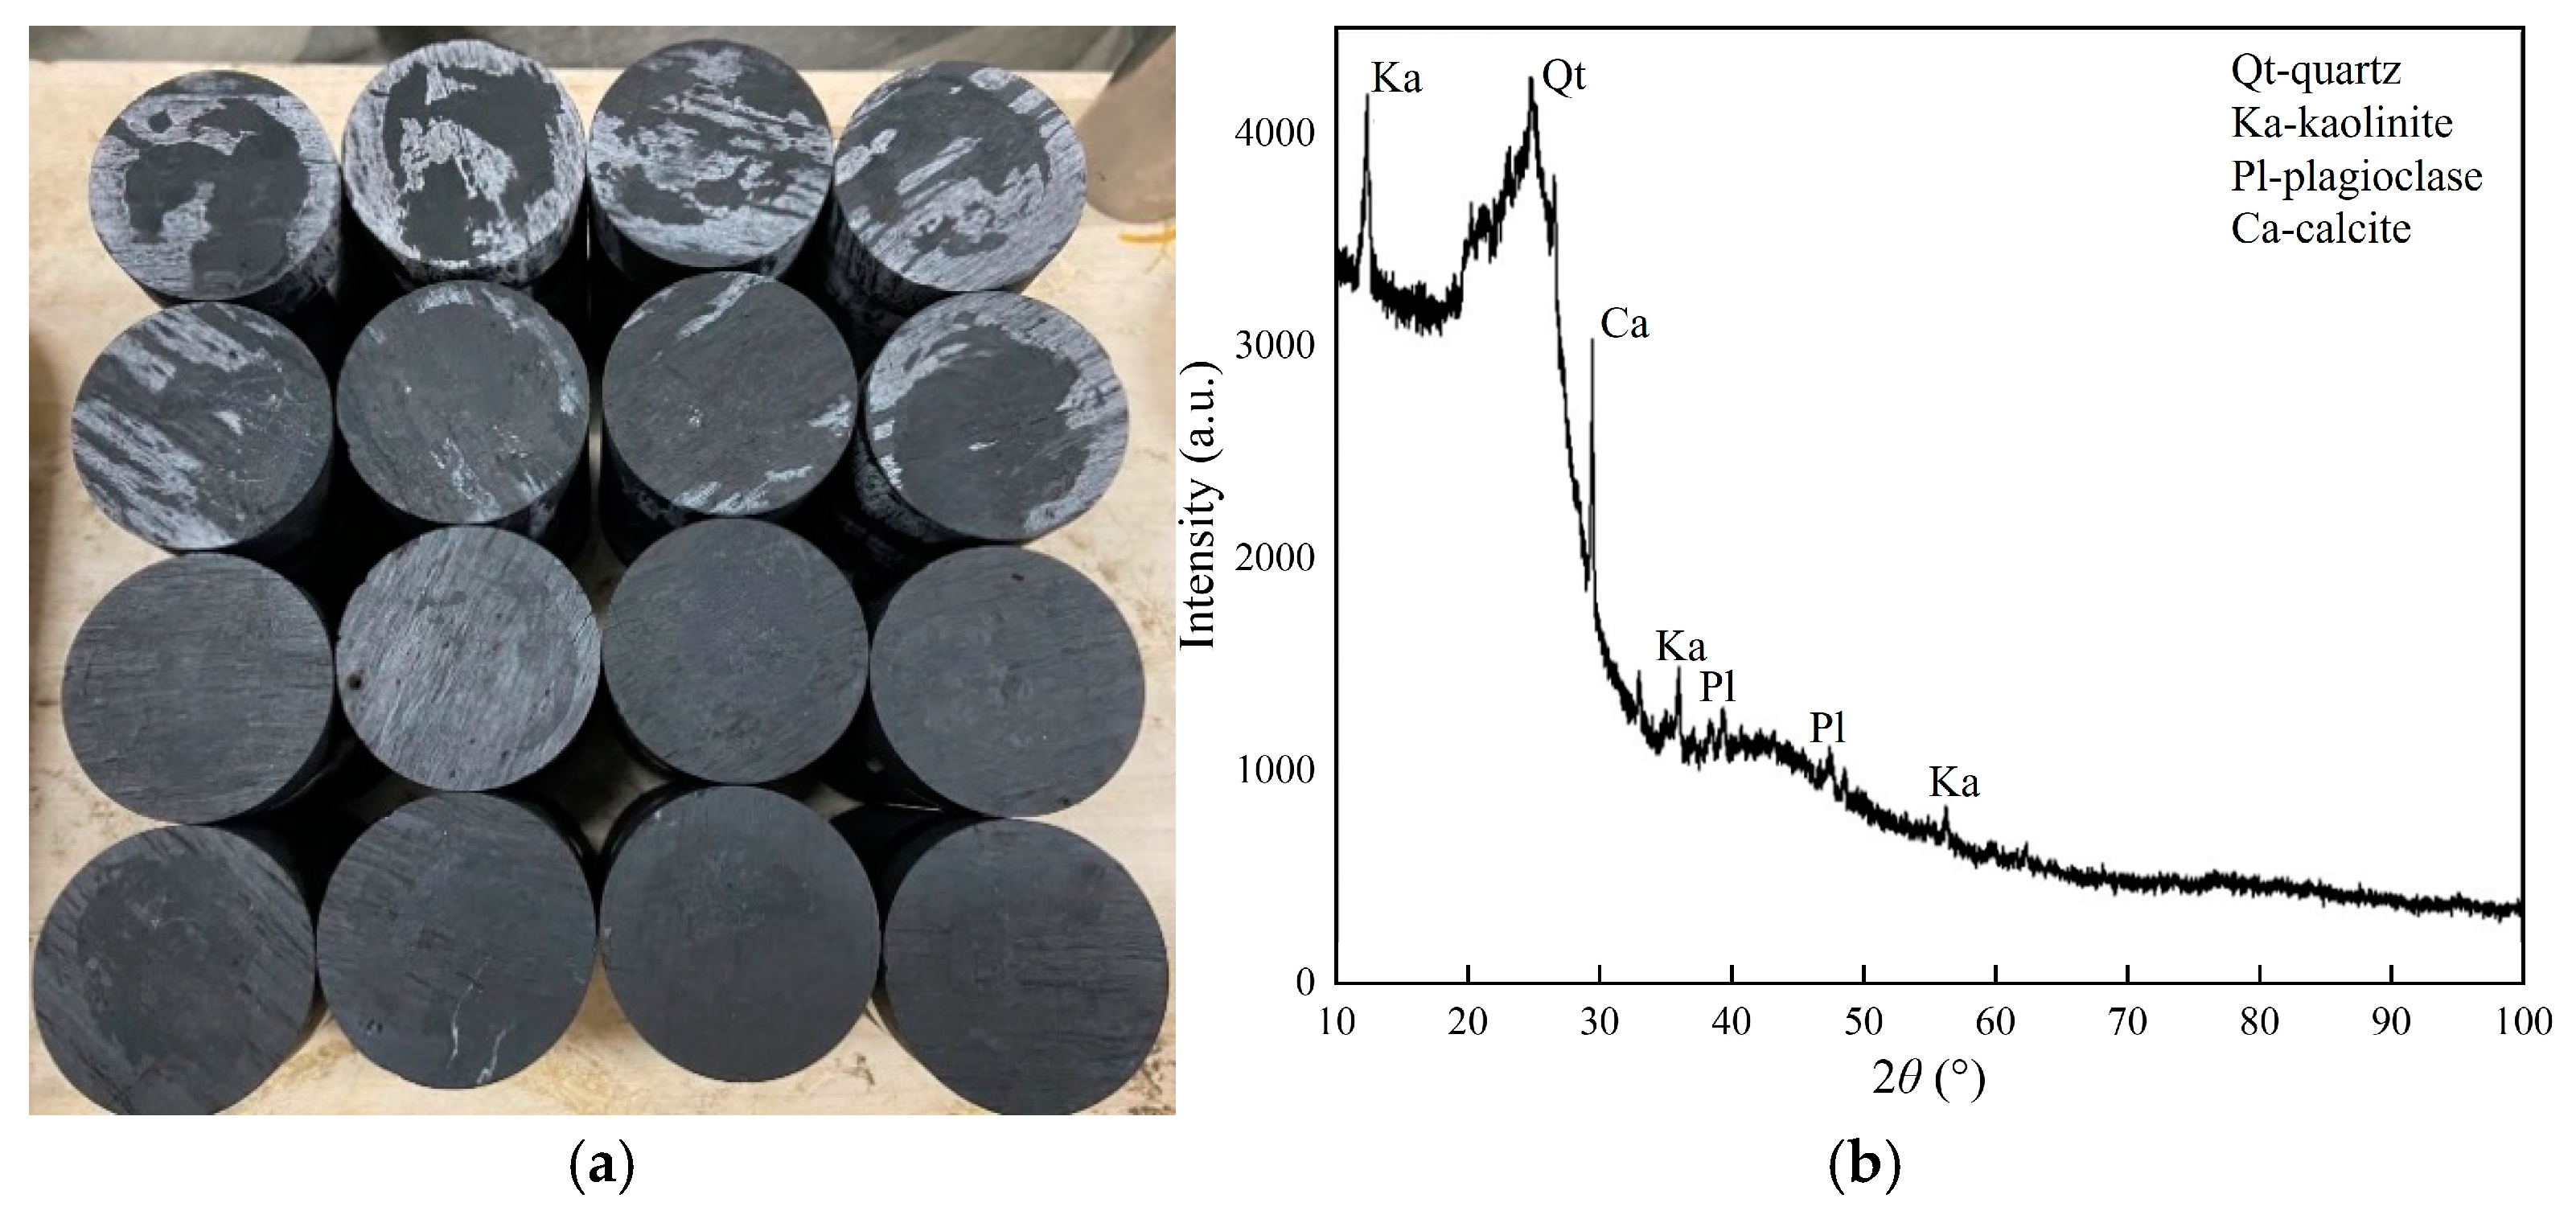
2.1. Sample Preparation

The coal samples used in this study were obtained from the Lingxin Coal Mine in Ningxia, China. To ensure sample homogeneity, all samples were drilled from the same region. The samples were processed into standard cylindrical specimens with dimensions of 100 mm × 50 mm (height × diameter) according to the recommendations of the International Society for Rock Mechanics, as shown in Figure 1a. The X-ray diffraction results of the coal samples, shown in Figure 1b, indicate that the primary components are kaolinite, plagioclase, calcite, and quartz. The measured longitudinal wave velocity of the coal samples predominantly ranged between 1.79 and 2.11 km/s.

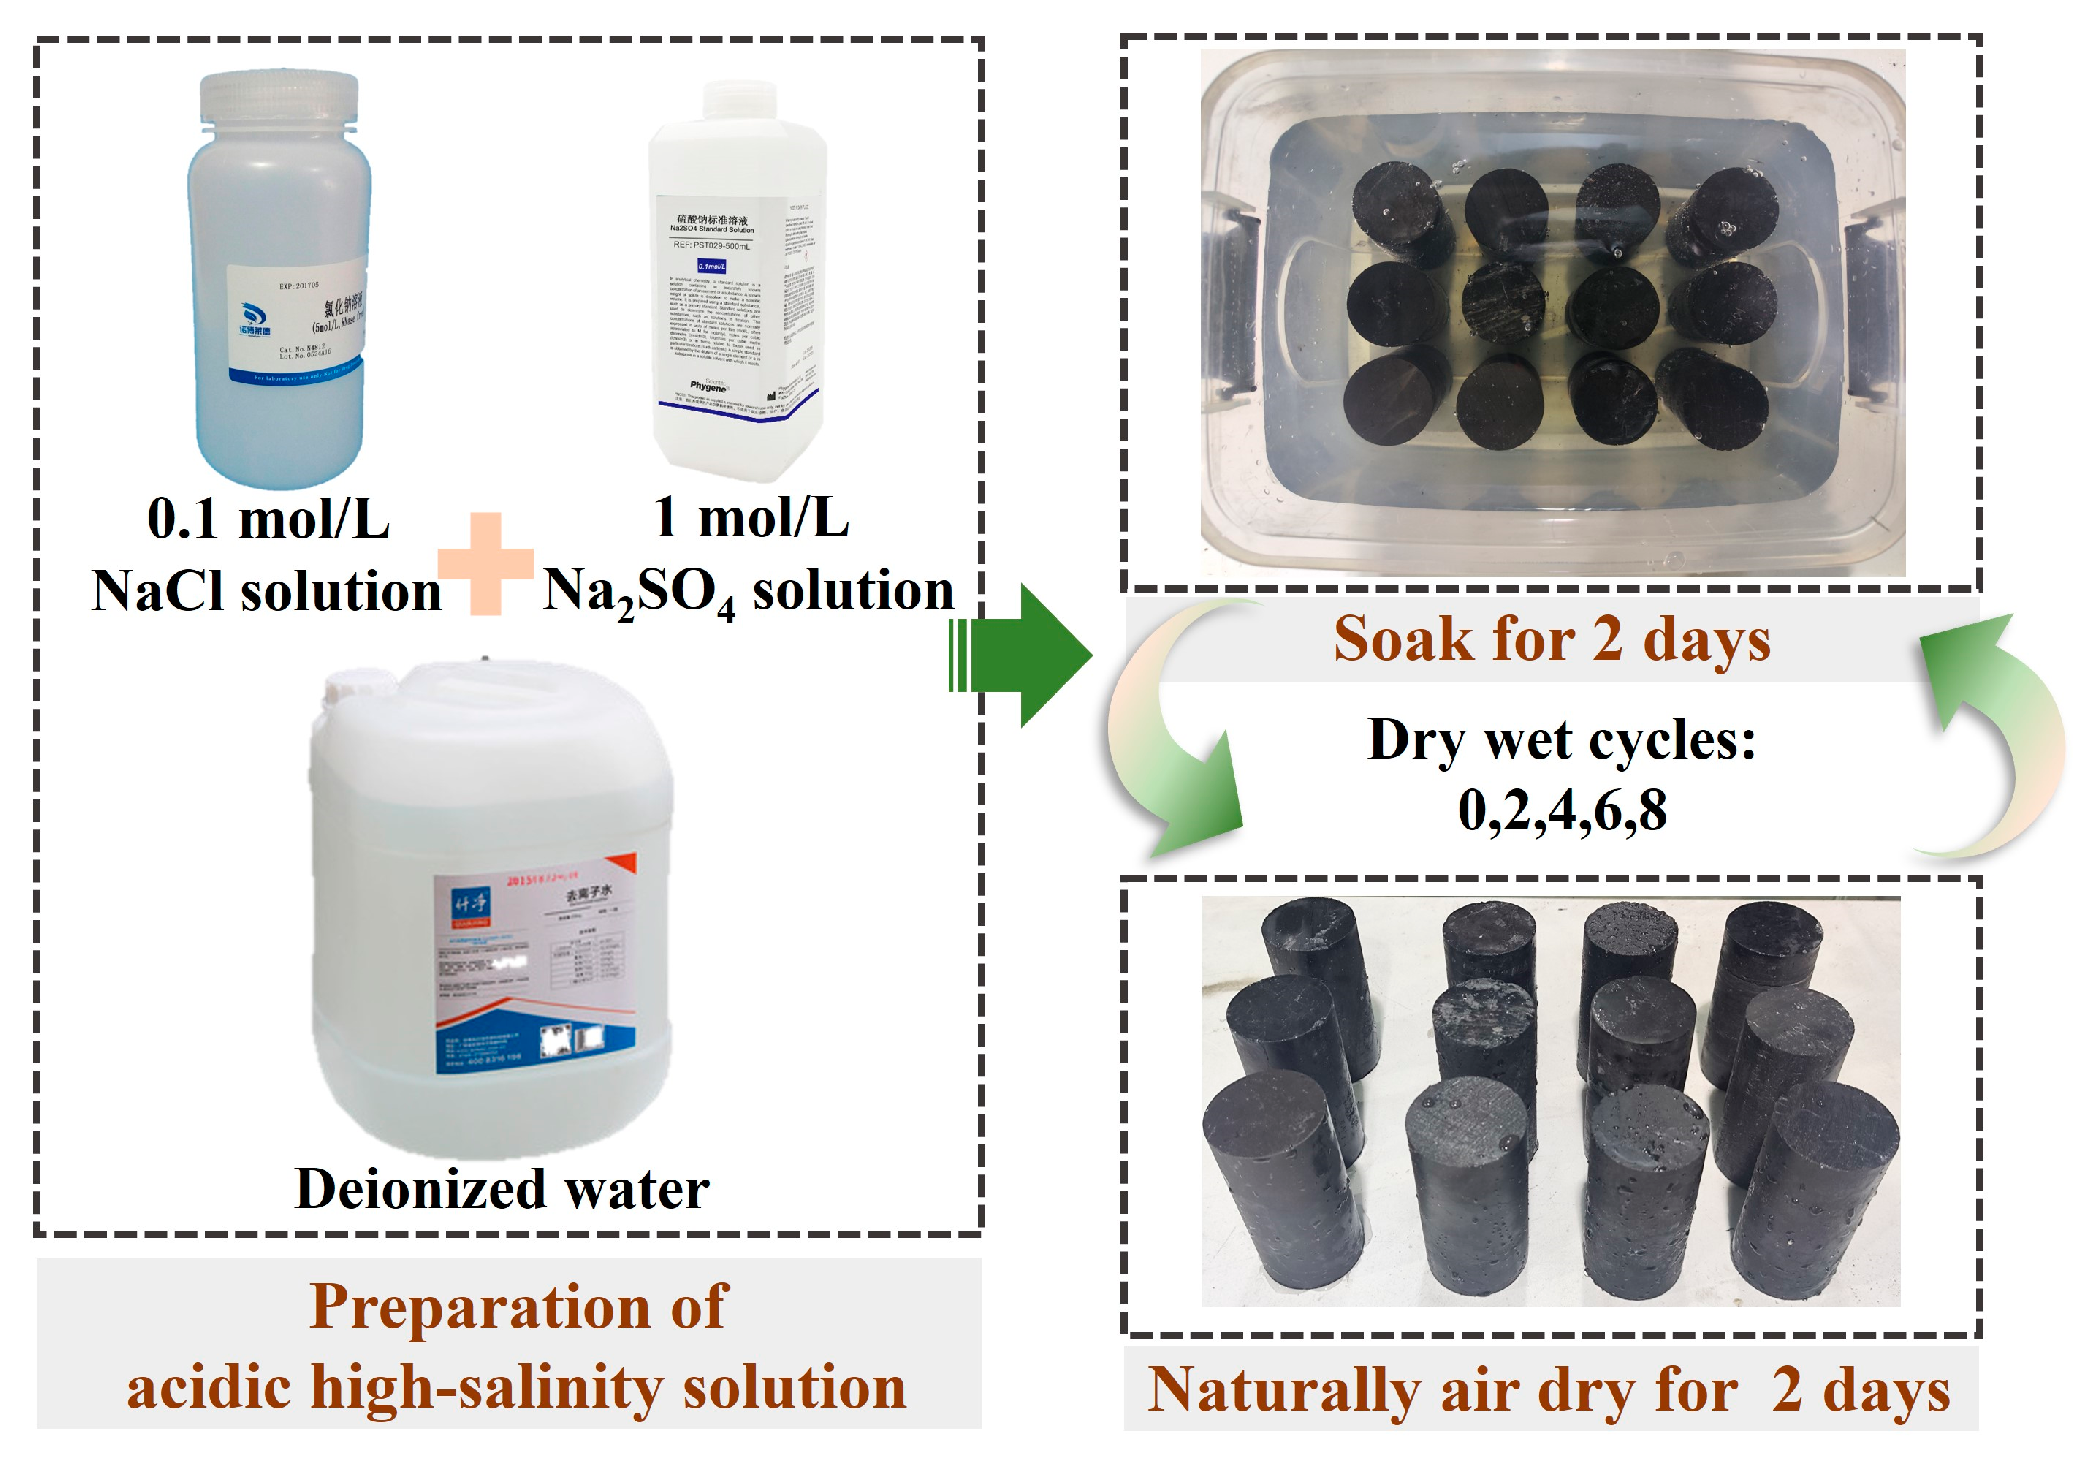
2.2. Experimental Method and Procedure

During coal mining, groundwater interacts with sulfur-containing mineral deposits and salt-bearing rock layers in the coal-bearing strata, leading to an increase in the ion composition and concentration in mine water. Groundwater samples from the Lingxin mining area were collected and analyzed using inductively coupled plasma emission spectrometry, ion chromatography, and gravimetric methods. The main components of the water samples are shown in Table 1. The mine water primarily contains ions such as Na+, Ca2+, Mg2+, K+, SO42−, OH, and Cl, with Na+, SO42−, and Cl being the dominant ions, classifying it as acidic, high-salinity mine water [33]. This study focuses on the impact of different dry–wet cycling frequencies on the damage to coal samples under acidic, high-salinity solutions. Due to time constraints, the experiment accelerated the physical and chemical effects of the solution on the coal samples by increasing the acidity and ion concentration of the solution, which is a commonly used treatment method [34,35,36]. Therefore, NaCl and Na2SO4 solutions, along with deionized water at pH = 7, were used to prepare the acidic, high-salinity solutions for immersing the coal samples. The concentrations of NaCl and Na2SO4 solutions were 0.1 mol/L and 1 mol/L, respectively.
In this dry–wet cycle simulation experiment, the method of water immersion followed by natural air drying was used to simulate the real operating conditions of an underground saltwater reservoir in a coal mine. One dry–wet cycle is designed to last 4 days, where the coal sample is immersed in the solution for 2 days and then removed to air-dry for 2 days in a shaded area naturally. The samples were divided into five groups, with the dry–wet cycles applied at 0, 2, 4, 6, and 8 cycles, respectively. A schematic diagram of the dry–wet cycle process is shown in Figure 2.

2.3. Equipment

The uniaxial compression tests were conducted using the MTS 815 electro-hydraulic servo mechanical system, with a maximum axial load capacity of 2700 kN. The data acquisition frequency for stress and strain was set at 5 Hz. AE signals were collected using the PCI-2 AE acquisition system. The preamplifier gain was set to 40 dB, with a threshold value preset at 35 dB, and the sampling accuracy was 40 MHz. The experimental system is shown in Figure 3.
During the experiment, a preload was applied with a loading rate of 0.1 kN/s. Once the preset stress was reached, the control was switched to axial displacement, with a loading rate of 0.02 mm/min, until the end of the test. Acoustic emission monitoring was conducted synchronously throughout the entire process. The temperature was maintained around 25 °C, and the relative humidity was approximately 50%.
During uniaxial compression, the coal sample experiences damage and failure, generating elastic waves that rapidly propagate from the interior of the sample to the surface. This results in slight vibrations that are detected by the AE sensors. Figure 4 illustrates the main characteristic parameters of AE signals. AE signals are typically characterized by ringing counts. During the loading process, elastic waves generated by the release of strain energy from internal damage within the coal sample are captured by the AE sensors once they exceed the preset threshold value. The number of times the signal surpasses the threshold within the duration is recorded as an AE ringing count for one AE event. The total AE count for each AE event is accumulated as the cumulative AE count.

3. Results

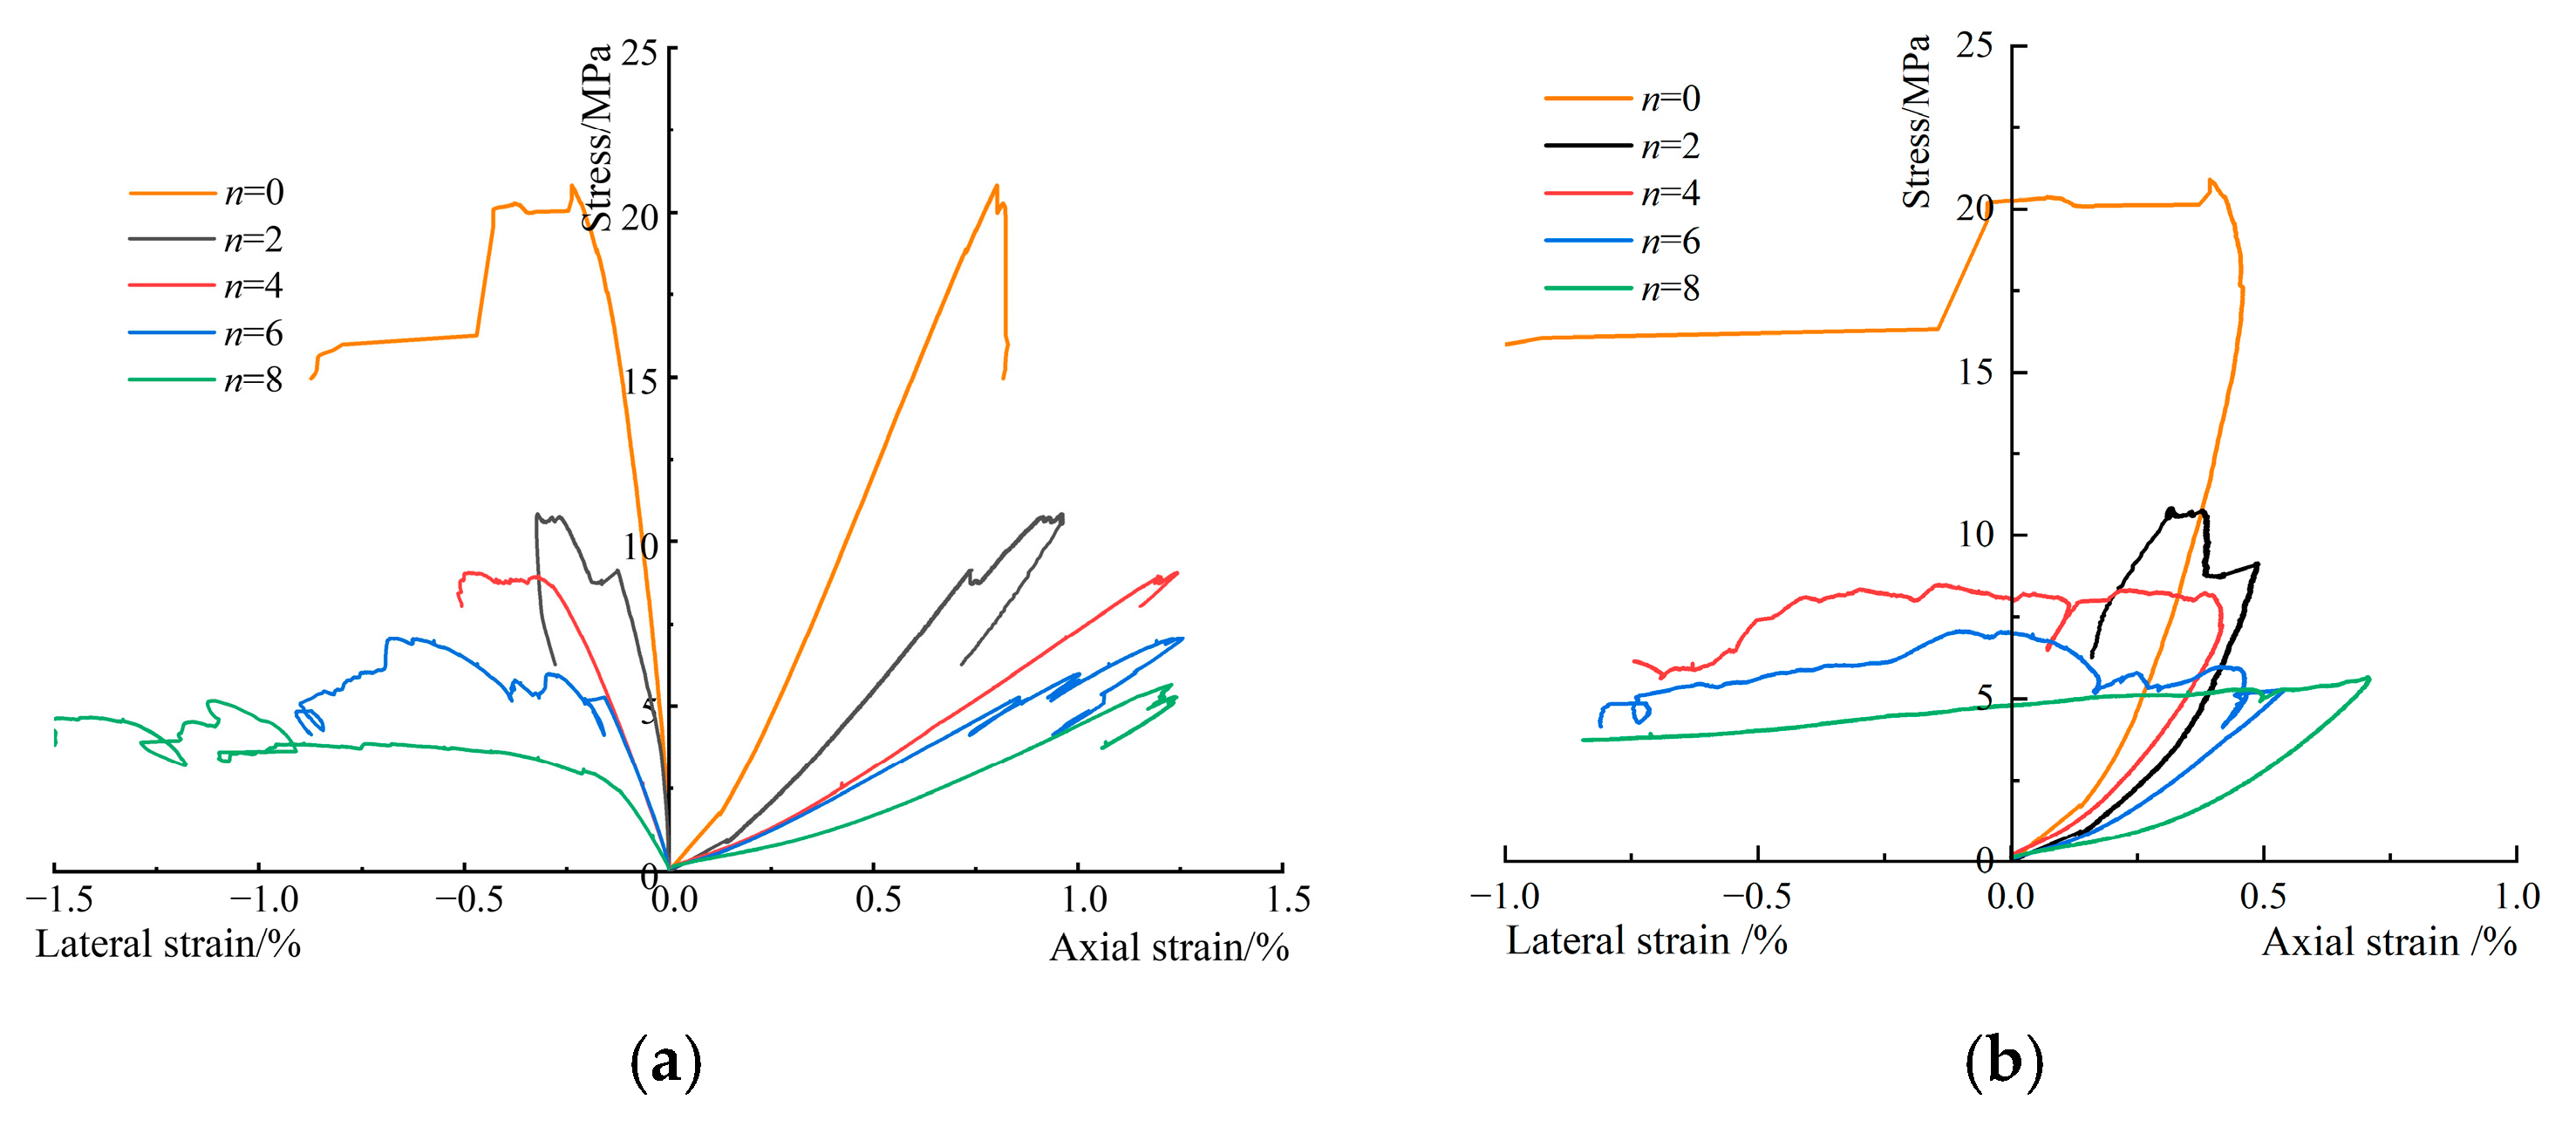
3.1. Stress–Strain Characteristics

Figure 5 presents the stress–strain curves of coal samples under different numbers of wet–dry cyclic treatments, including axial strain, radial strain, and volumetric strain.
From Figure 5, it can be observed that the stress–strain curve of the specimen can be divided into five stages: pore compaction stage, linear elastic deformation stage, stable crack propagation stage, unstable crack propagation stage, and post-failure stage [37,38,39,40], as shown in Figure 5a.
(1)
Pore Compaction Stage: In the initial loading phase, microcracks and pores within the coal sample are compressed and closed, causing the stiffness to gradually increase. The axial stress–strain curve exhibits an upward curvature with an increasing slope (dσ/dε > 0, d2σ/d2ε > 0). Deformation during this stage is irreversible. The initial damage varies with the number of cycles; with increasing cycle numbers, the damage becomes more severe, and internal initial pores increase, resulting in an extension of the compaction stage.
(2)
Linear Elastic Deformation Stage: After most of the initial microcracks and pores are compacted, axial pressure continues to increase, and the specimen enters the linear elastic stage. In this stage, the stress–strain relationship is linear (dσ/dε = 0, d2σ/d2ε = 0). The length and closure degree of internal cracks differ for samples subjected to varying numbers of cycles, leading to variations in the duration of the linear elastic stage.
(3)
Stable Crack Propagation Stage: After the linear elastic deformation stage ends, with continued axial pressure increase, localized stress concentration occurs at the tips of internal microcracks. When the intensity of this stress concentration exceeds the cracking strength, the microcracks begin to develop and propagate stably.
(4)
Unstable Crack Propagation Stage: As the microcracks propagate and coalesce, plastic deformation increases. The specimen’s load-bearing capacity gradually approaches its limit, and the stress–strain curve begins to curve downward, with a decreasing slope (dσ/dε > 0, d2σ/d2ε < 0). During this stage, the stress–strain curve exhibits a stress drop due to crack propagation. As the specimen nears its peak stress, internal cracks develop rapidly, leading to eventual failure.
(5)
Post-Failure Stage: After the peak stress, the specimen retains a certain residual strength, which is provided by the friction between the irregularly shaped fracture surfaces. Since this uniaxial compression test adopts a circumferential displacement-controlled loading method, when the specimen fractures, it undergoes volume expansion, causing a sudden increase in circumferential displacement that exceeds the preset loading rate. To maintain the loading rate, the testing machine releases pressure, resulting in a rebound of axial strain. After stabilization, continued loading leads to a gradual reduction in the specimen’s load-bearing strength due to the formation of internal fracture surfaces.

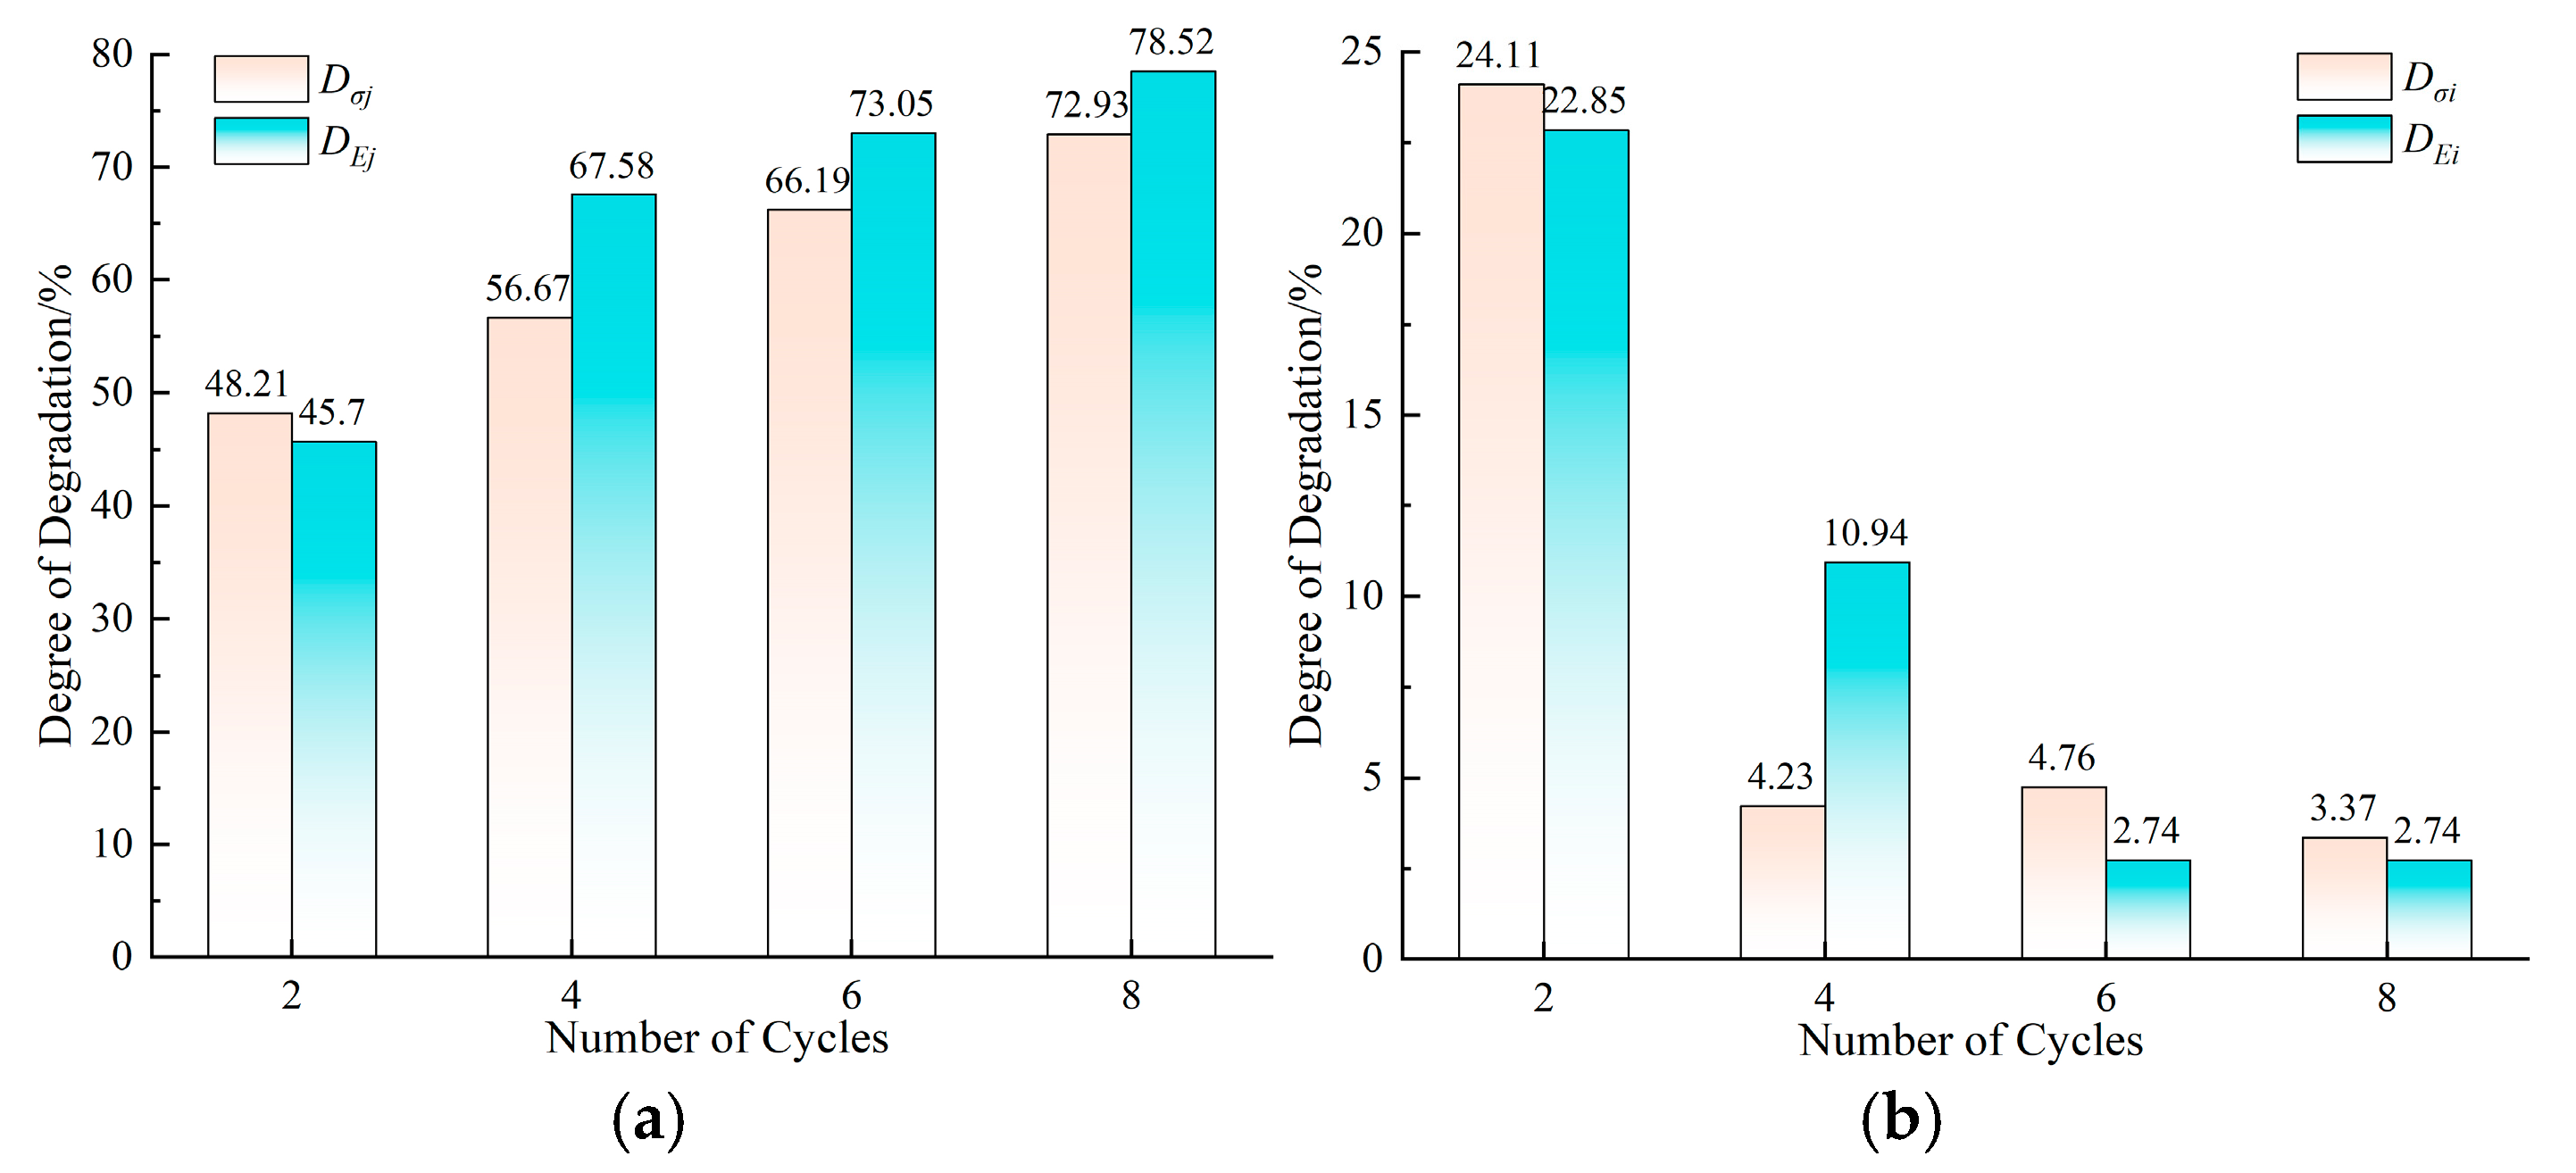
3.2. Strength and Deformation Parameters

To investigate the effect of the number of wet–dry cycles on the mechanical properties of the specimen, the peak strength total degradation coefficient Dσj and the average degradation coefficient per cycle Dσi, as well as the total degradation coefficient of the elastic modulus DEj and the average degradation coefficient per cycle DEi, are defined. The calculation formulas are as follows:
D σ j = σ 0 σ j σ 0 × 100 %                               D σ i = D σ j D σ j 1 n i                        
D E j = E j E 0 E 0 × 100 %                               D E i = D E j D E j 1 n i                        
where σ0 and σi represent the peak strength of the coal sample in the initial state and after completing the i-th stage of the wet–dry cycles, respectively; E0 and Ei represent the elastic modulus of the coal sample in the initial state and after completing the i-th stage of the wet–dry cycles, respectively; and ni denotes the number of wet–dry cycles in the i-th stage.
The mechanical parameters of the coal sample were calculated based on Formulas (1) and (2), as shown in Table 2.
As shown in Table 2, wet–dry cycling has a significant impact on the mechanical parameters of coal rock. At 0, 2, 4, 6, and 8 cycles, the peak strengths of the coal samples are 20.91 MPa, 10.83 MPa, 9.06 MPa, 7.07 MPa, and 5.66 MPa, respectively. Compared to the natural state, they decreased by 48.21%, 56.67%, 66.19%, and 72.93%, respectively. The elastic moduli are 2.56 GPa, 1.39 GPa, 0.83 GPa, 0.69 GPa, and 0.55 GPa, respectively, which represent decreases of 45.70%, 67.58%, 73.05%, and 78.52% compared to the natural state. With the increase in the number of wet–dry cycles, both the peak strength and elastic modulus of the coal sample under acidic, high-salinity solutions show a downward trend. However, the reduction in the elastic modulus is greater than that in the peak strength, indicating that wet–dry cycling has a more significant effect on the deformation characteristics of the coal sample than on its strength. The coal sample undergoes more noticeable softening due to wet–dry cycling.
Figure 6 shows the variation in the total degradation coefficient and the average degradation coefficient per cycle for the peak strength and elastic modulus at each degradation stage. From Figure 6a, it can be observed that both the total degradation coefficients for peak strength and elastic modulus increase with the number of cycles. This is related to the accumulation of internal damage in the coal sample after wet–dry cycling. Figure 6b also shows that the single-cycle degradation coefficients are largest after two cycles, at 24.11% and 22.85%, respectively, indicating that in the early stages of wet-dry cycling, the acidic, high-salinity solution causes more significant internal damage to the coal sample.

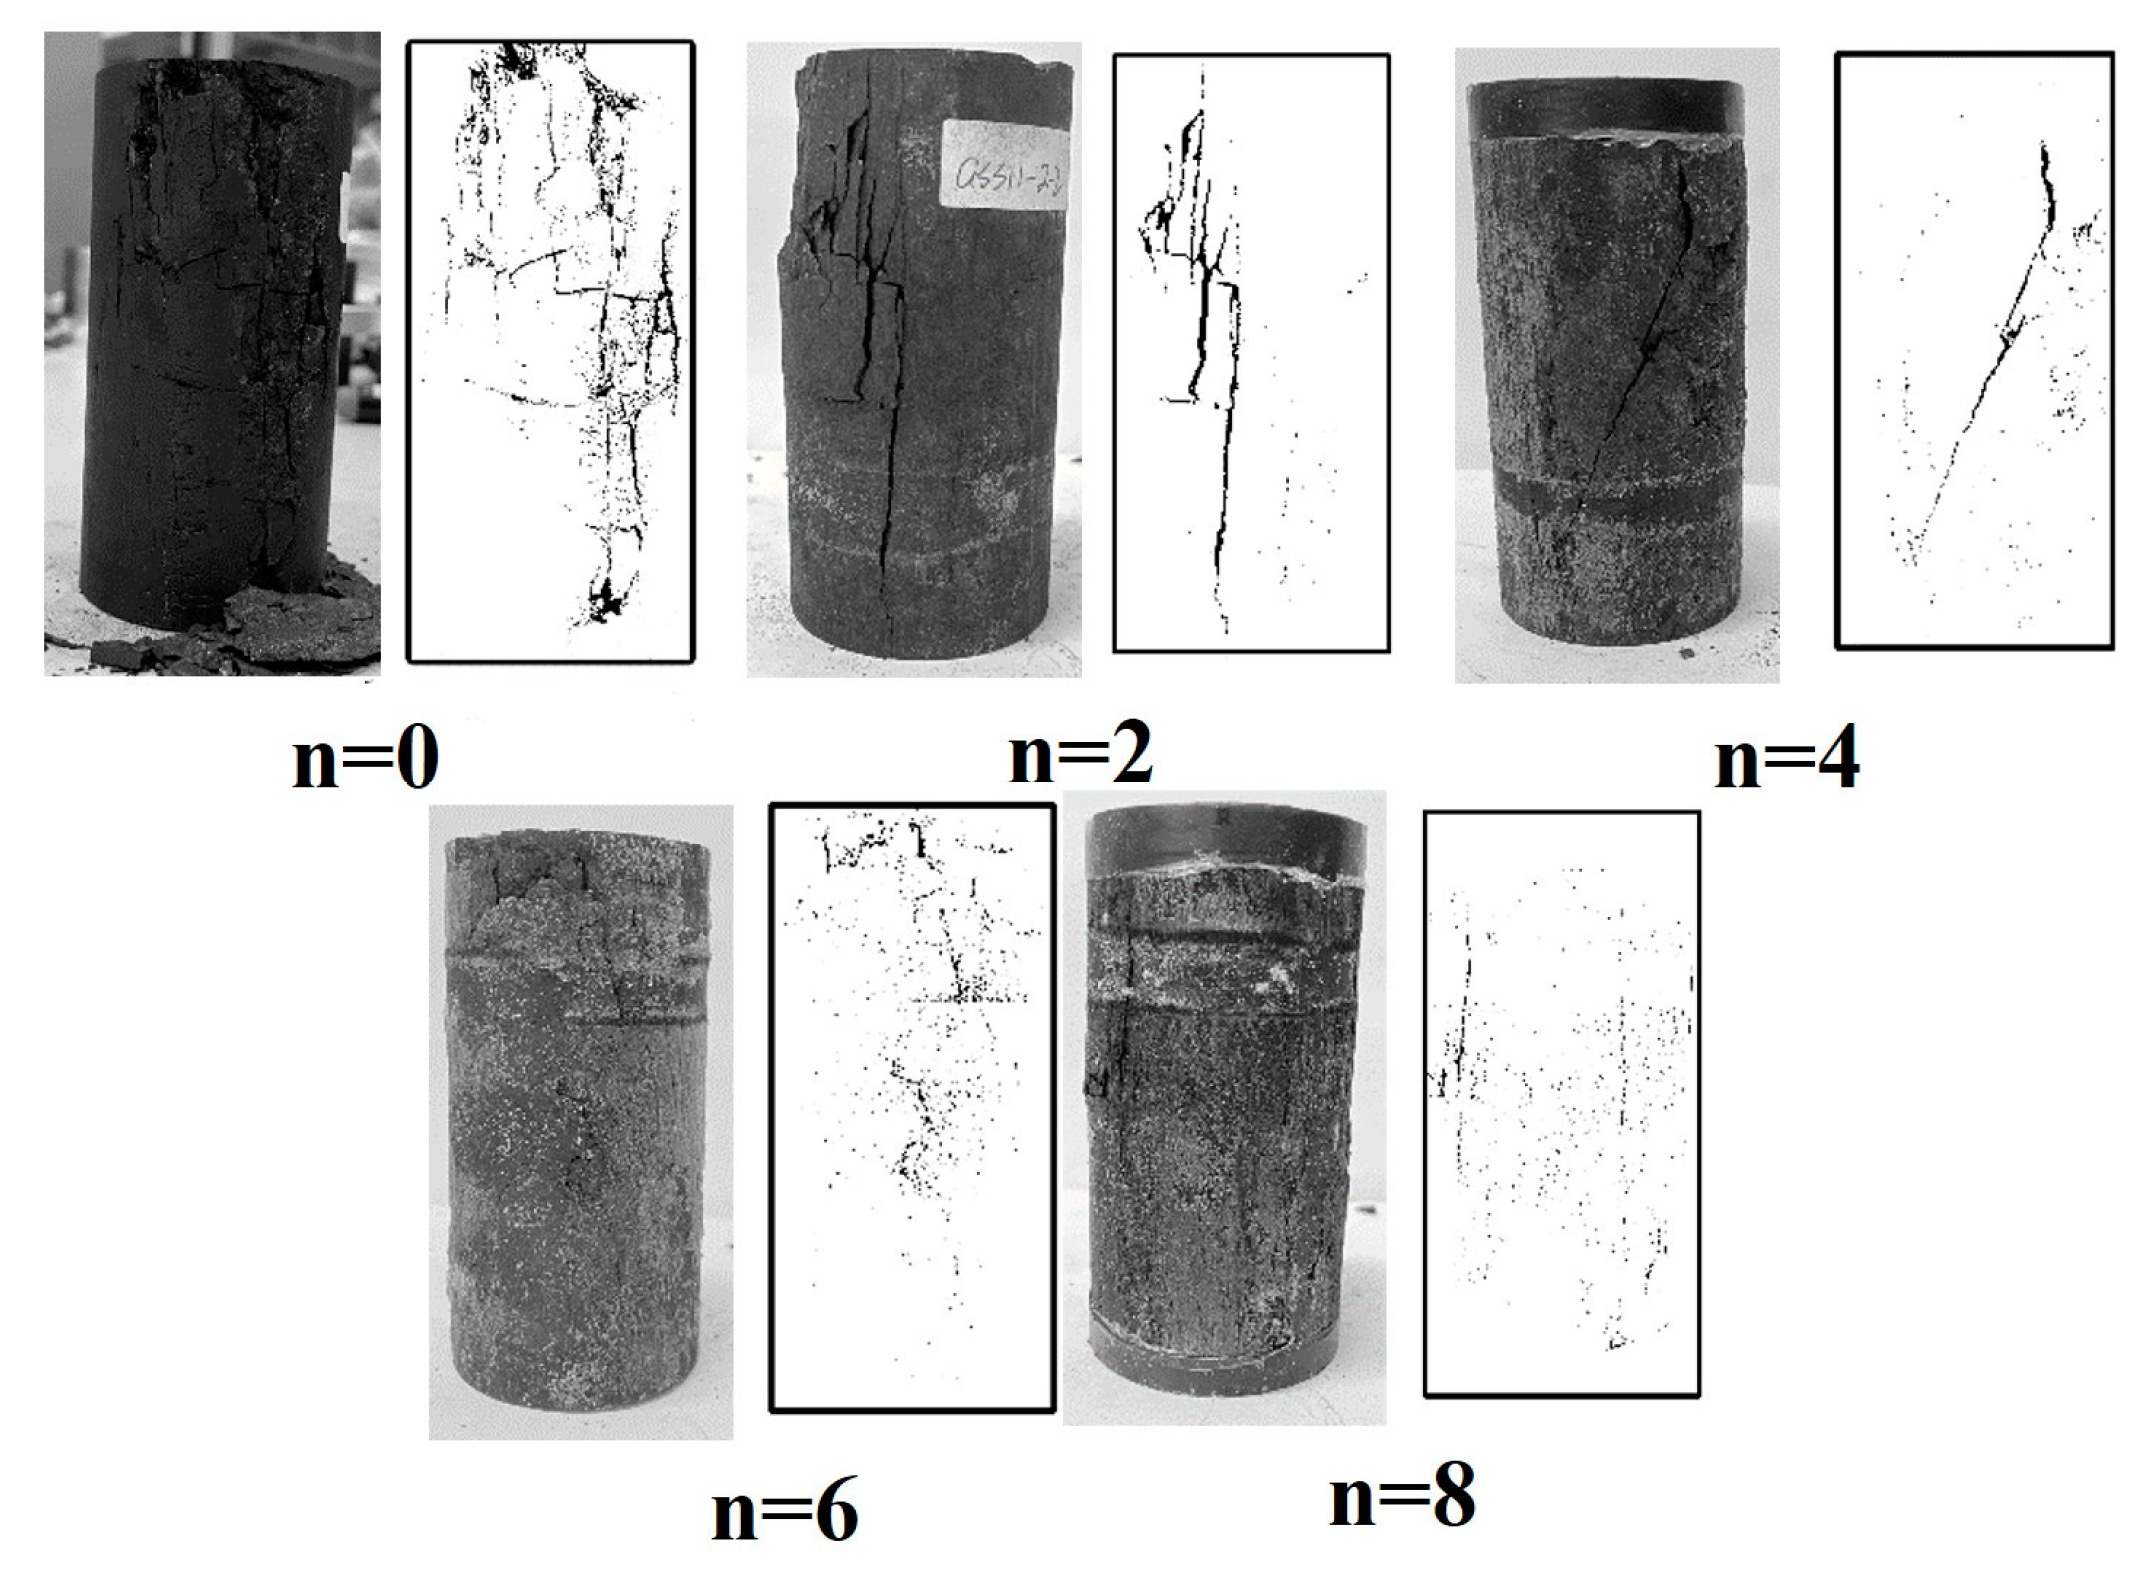
3.3. Destruction Mode
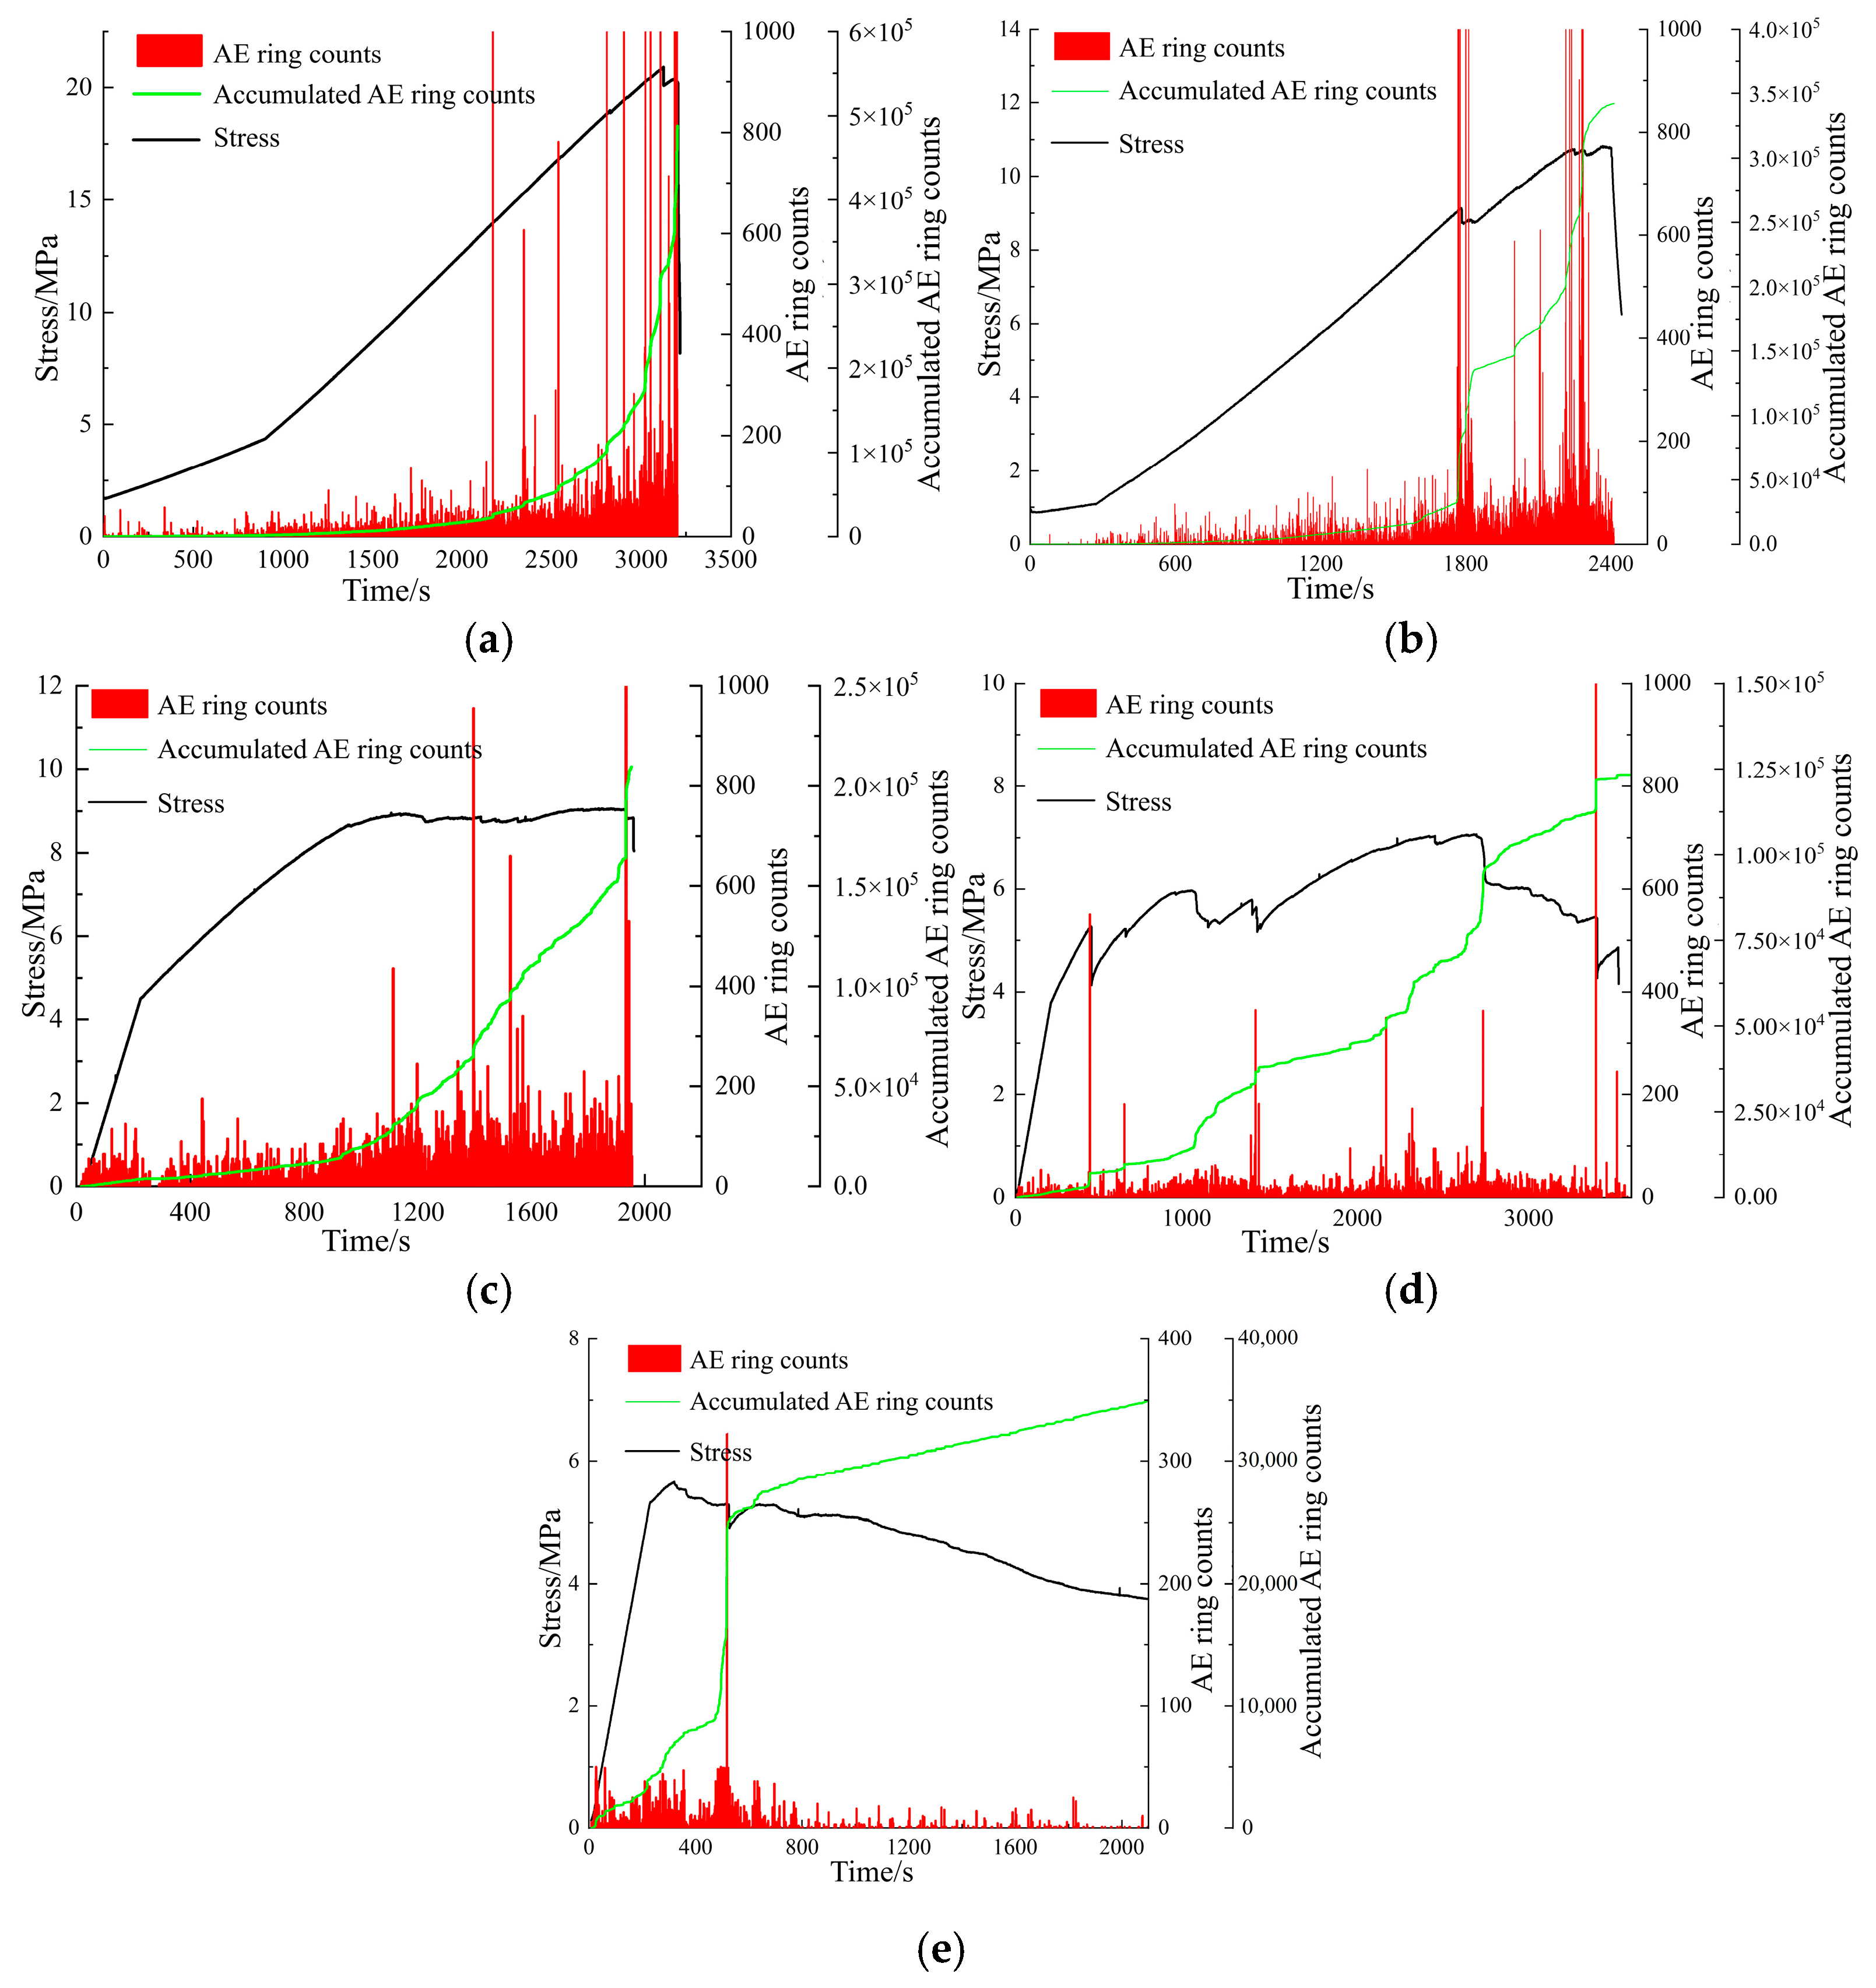
Figure 7 shows the failure modes of coal samples after different numbers of wet–dry cycles. It can be observed that the number of wet–dry cycles has a significant impact on the failure mode of the coal samples. In the early stages of wet–dry cycling, the coal samples mainly exhibit tensile failure, with strip-like cracks and fracture surfaces parallel to the direction of the maximum principal stress, extending from the top to the bottom. The failure in the natural state is the most severe. As the number of wet-dry cycles increases, the specimen gradually transitions to shear failure, with cracks progressively extending away from the direction of the maximum principal stress. During loading, no significant sounds are heard, and the sounds during failure become increasingly dull and mixed. In the later stages of wet–dry cycling, there are no noticeable sounds. This indicates that under the influence of wet–dry cycles, the brittle failure of the coal sample gradually weakens, and plasticity increases to some extent. This is due to the internal minerals of the coal sample being subjected to varying degrees of corrosion and dissolution, leading to the expansion of microcracks and a reduction in the frictional forces between the cracks. As a result, microcracks are more likely to slip during loading, leading to shear failure.

3.4. AE Results

Figure 8 shows the variation in the ringing count and cumulative ringing count of coal samples subjected to different numbers of wet–dry cycles in an acidic, high-salinity solution over time. The AE count trends of all the coal samples are generally similar and exhibit distinct stages. In the initial compaction and elastic stages, the AE counts are relatively low, with the cumulative AE count curve remaining fairly stable, indicating minimal internal damage to the specimen. During the crack stable propagation stage, AE counts become more active and dense as new cracks begin to form inside the specimen, and the internal structural damage gradually increases. In the unstable crack propagation stage, AE counts increase significantly, with larger peak jumps appearing. The cumulative count curve also shows intermittent sharp increases, indicating that internal damage becomes more pronounced, with localized cracks coalescing, resulting in a rapid increase in overall damage and the release of strain energy, producing a large number of AE events. At the moment of specimen failure, the AE count increases exponentially and reaches its peak, with the cumulative count curve rising nearly vertically, indicating a massive release of energy at the point of failure. In the post-peak stage, the AE counts of some specimens remain at a high level due to residual load-bearing capacity after failure, with particle sliding and misalignment causing higher AE activity.
Moreover, the number of wet–dry cycles has a notable effect on the AE signals in each stage. As the number of wet–dry cycles increases, the initial damage in the coal sample intensifies, and the AE counts during failure gradually decrease. Correspondingly, the cumulative AE counts also show a downward trend. Specifically, in the natural state (n = 0), the final cumulative count of the coal sample is 487,816, while at n = 2, 4, 6, and 8 cycles, the cumulative counts are 342,155, 209,470, 123,465, and 35,096, respectively, representing reductions of 29.86%, 38.78%, 41.06%, and 71.57%. This indicates a significant decrease in cumulative counts in the later stages of wet–dry cycling, which macroscopically manifests as a progressively duller sound during failure. It can also be observed that with an increasing number of wet–dry cycles, specimens begin to exhibit varying degrees of post-peak behavior, further highlighting the softening effect of wet–dry cycling on the coal samples.

4. Discussion

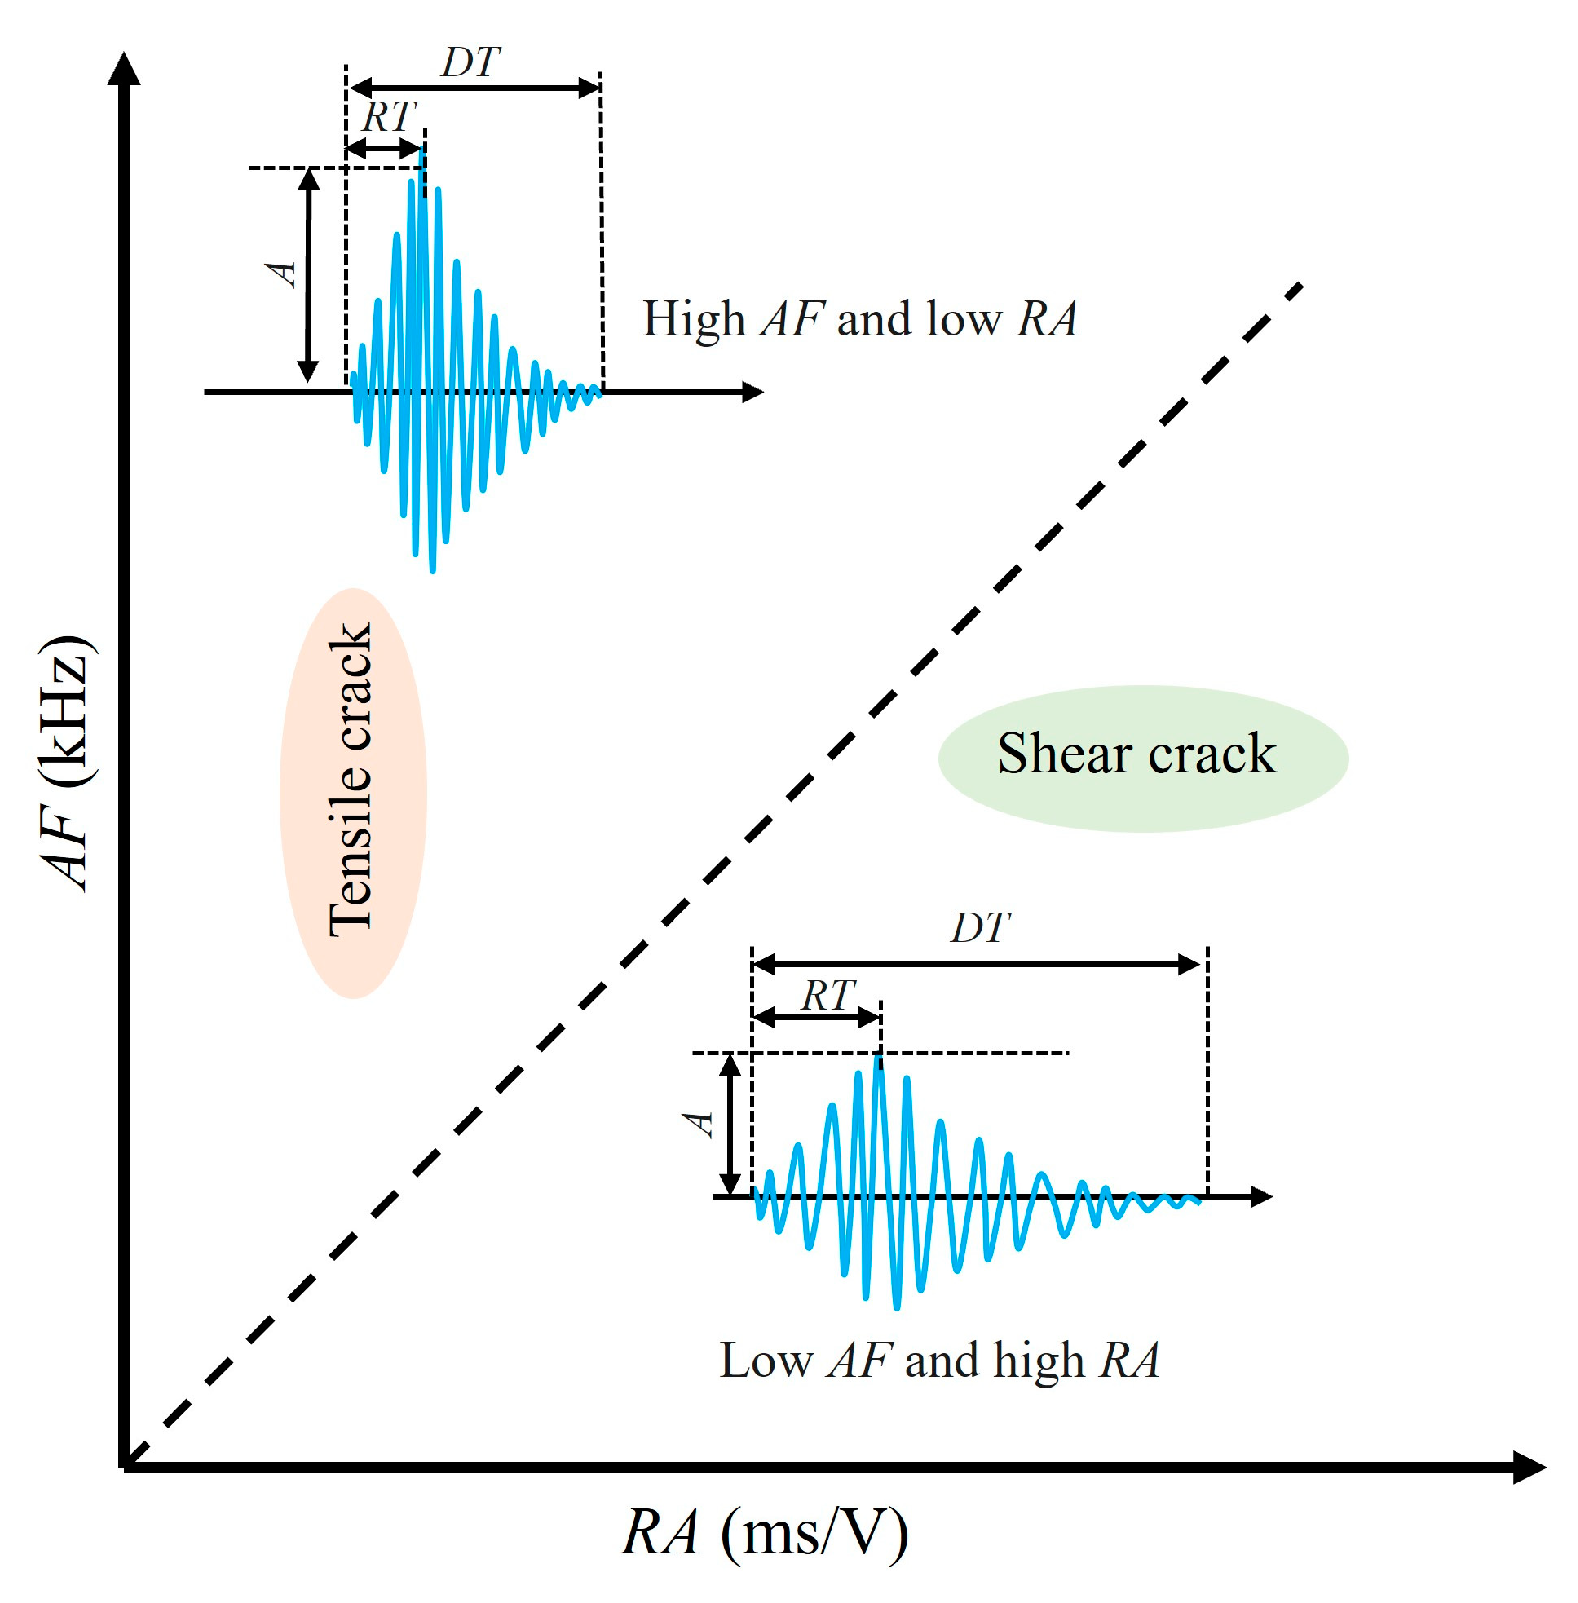
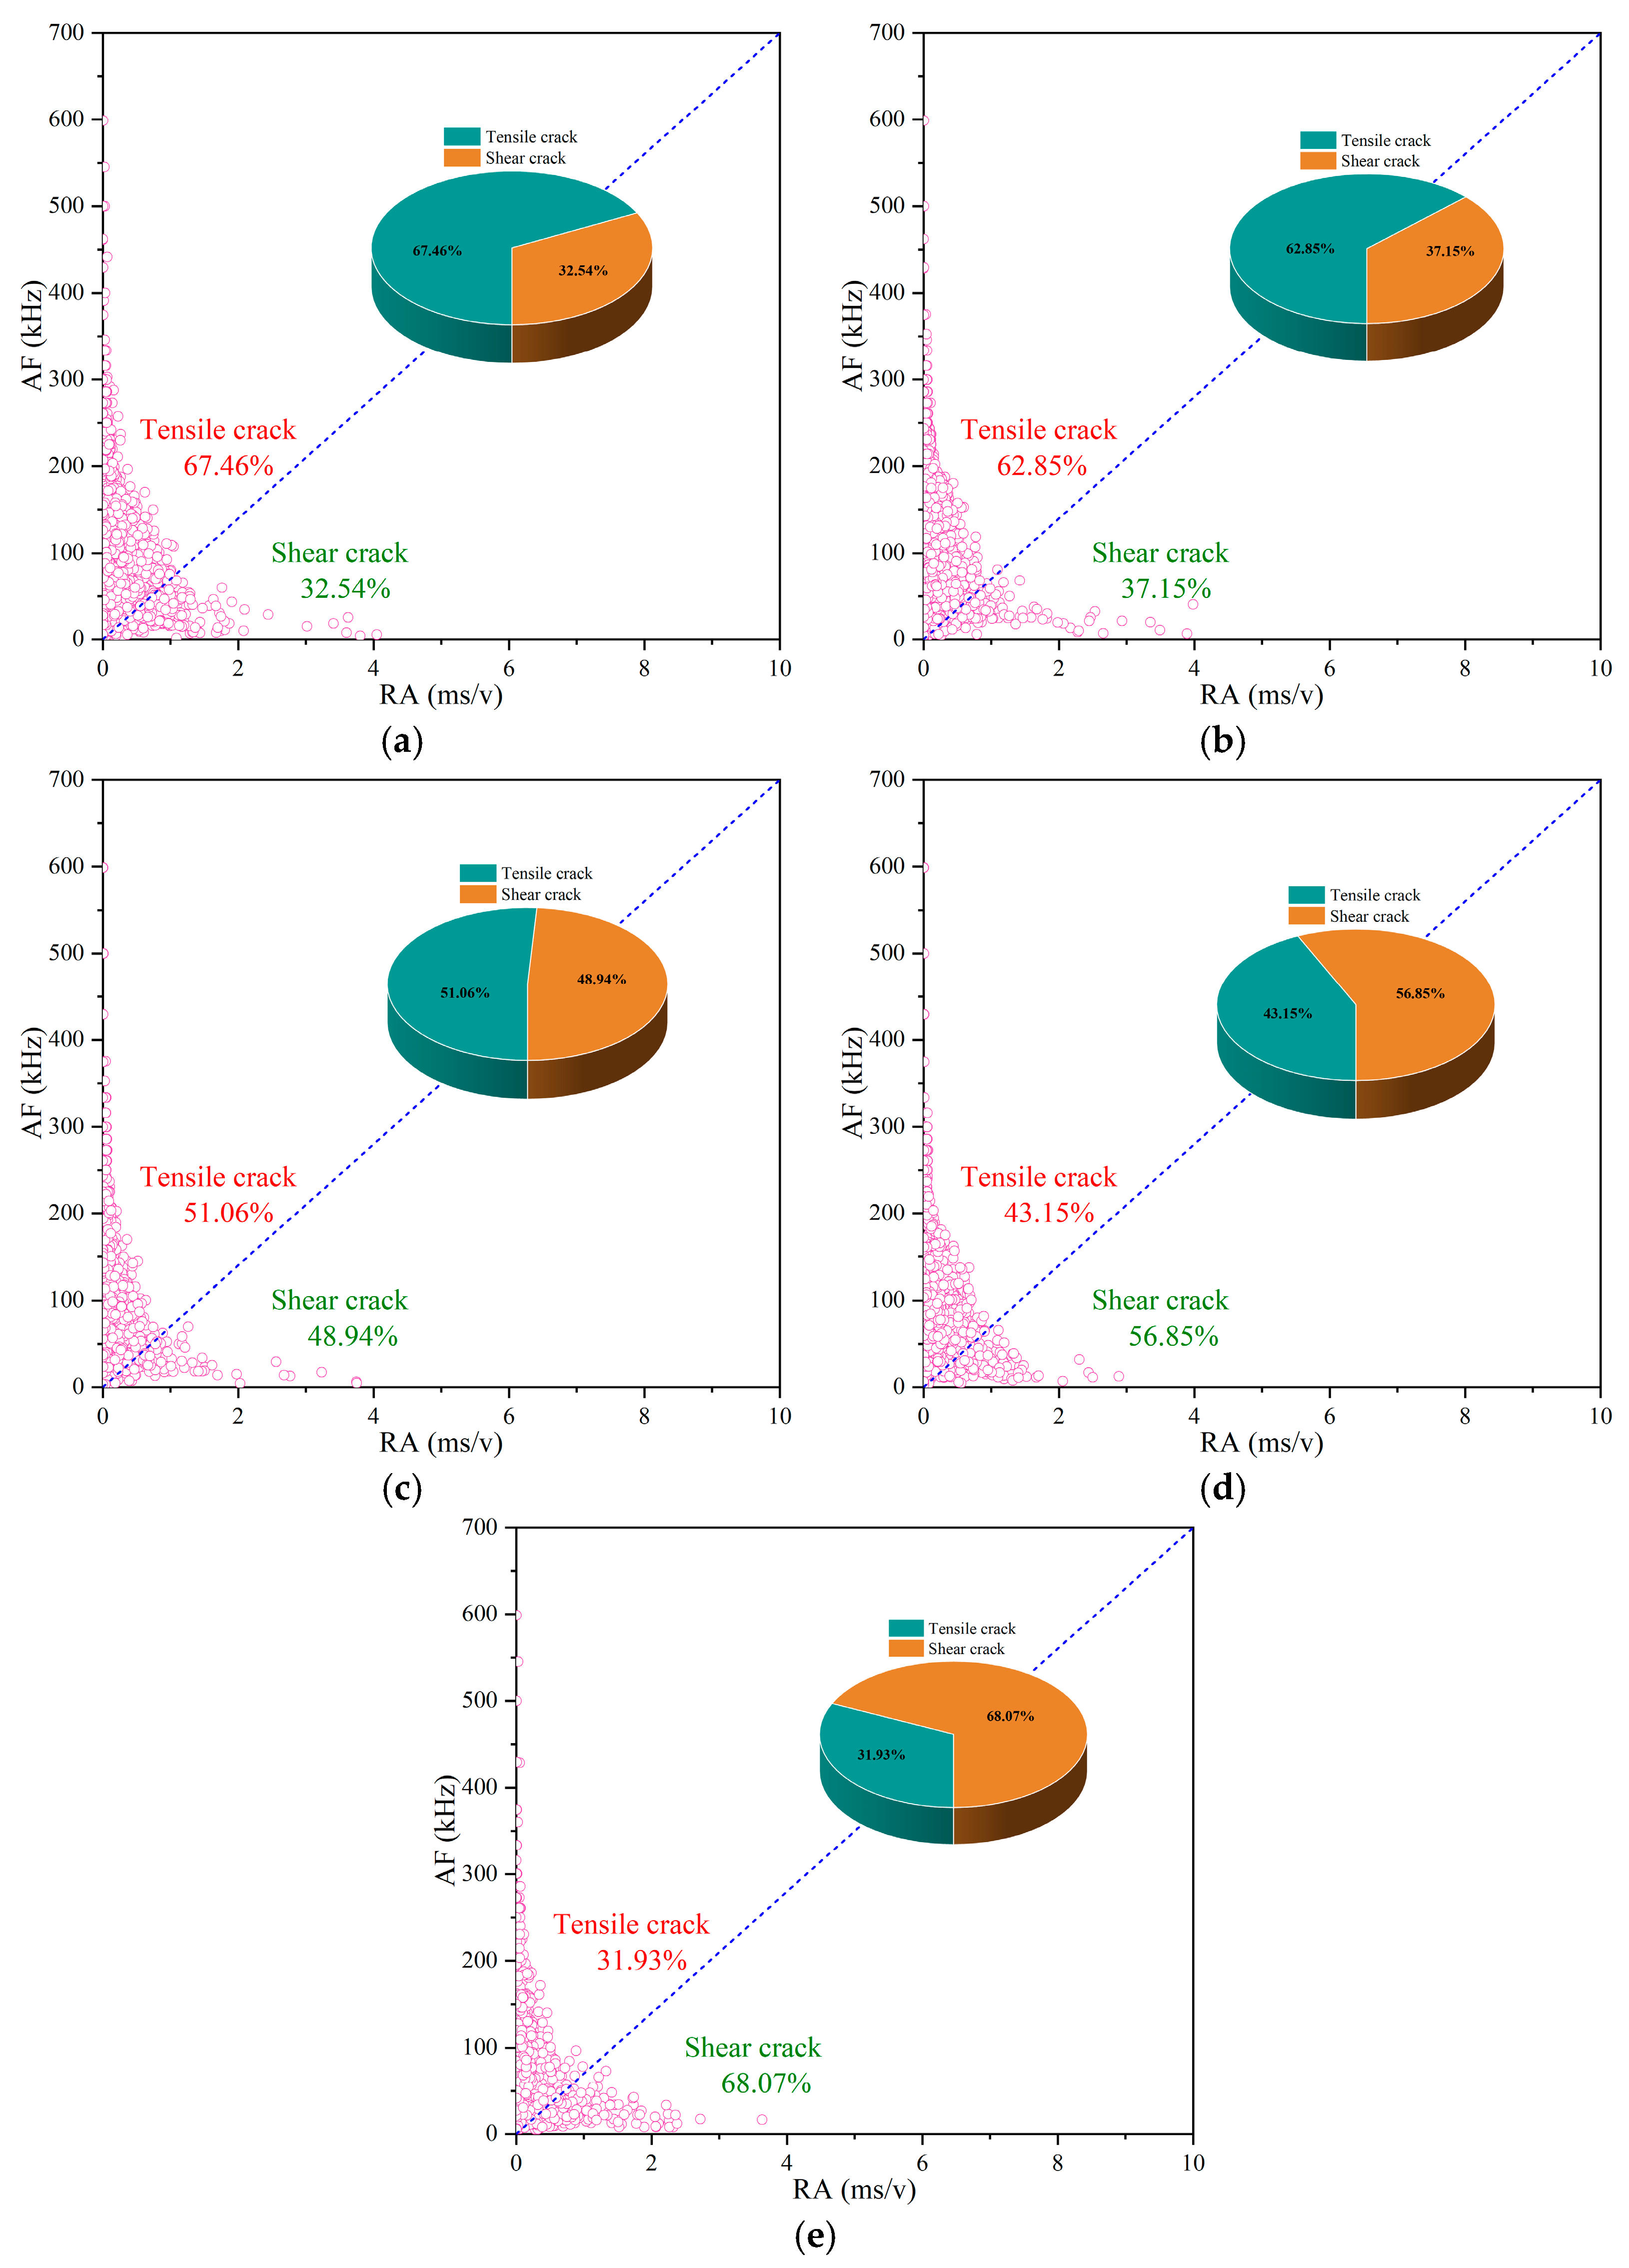
4.1. The RA-AF Distribution Based on AE

During rock mechanics testing, the waveform of AE changes in response to damage and failure, exhibiting different characteristics. Under tensile failure, longitudinal waves are generated, which are characterized by a short duration and high frequency. Under shear failure, transverse waves are produced, with longer rise times and lower frequencies [41]. The use of the average frequency (AF) and rise angle (RA) distribution to distinguish between the failure modes in the rock loading process has been widely applied in rock mechanics research. Tensile cracks are characterized by high AF and low RA, while shear cracks display the opposite characteristics [42]. (See Figure 9).
Figure 10 shows the crack classification of coal samples under different numbers of wet–dry cycles. From the figure, it can be seen that the failure modes of the specimens vary with the number of wet–dry cycles. The proportion of tensile cracks at 0, 2, 4, 6, and 8 cycles is 67.46%, 62.85%, 51.06%, 43.15%, and 31.93%, respectively. As the number of wet–dry cycles increases, the proportion of shear cracks begins to rise, and the failure mode of the coal sample shifts from being dominated by tensile failure to being dominated by shear failure. This is consistent with the macroscopic failure modes of the coal samples. Under the erosion and degradation of the acidic, high-salinity solution, the extension of cracks is primarily dominated by shear failure due to sliding actions.

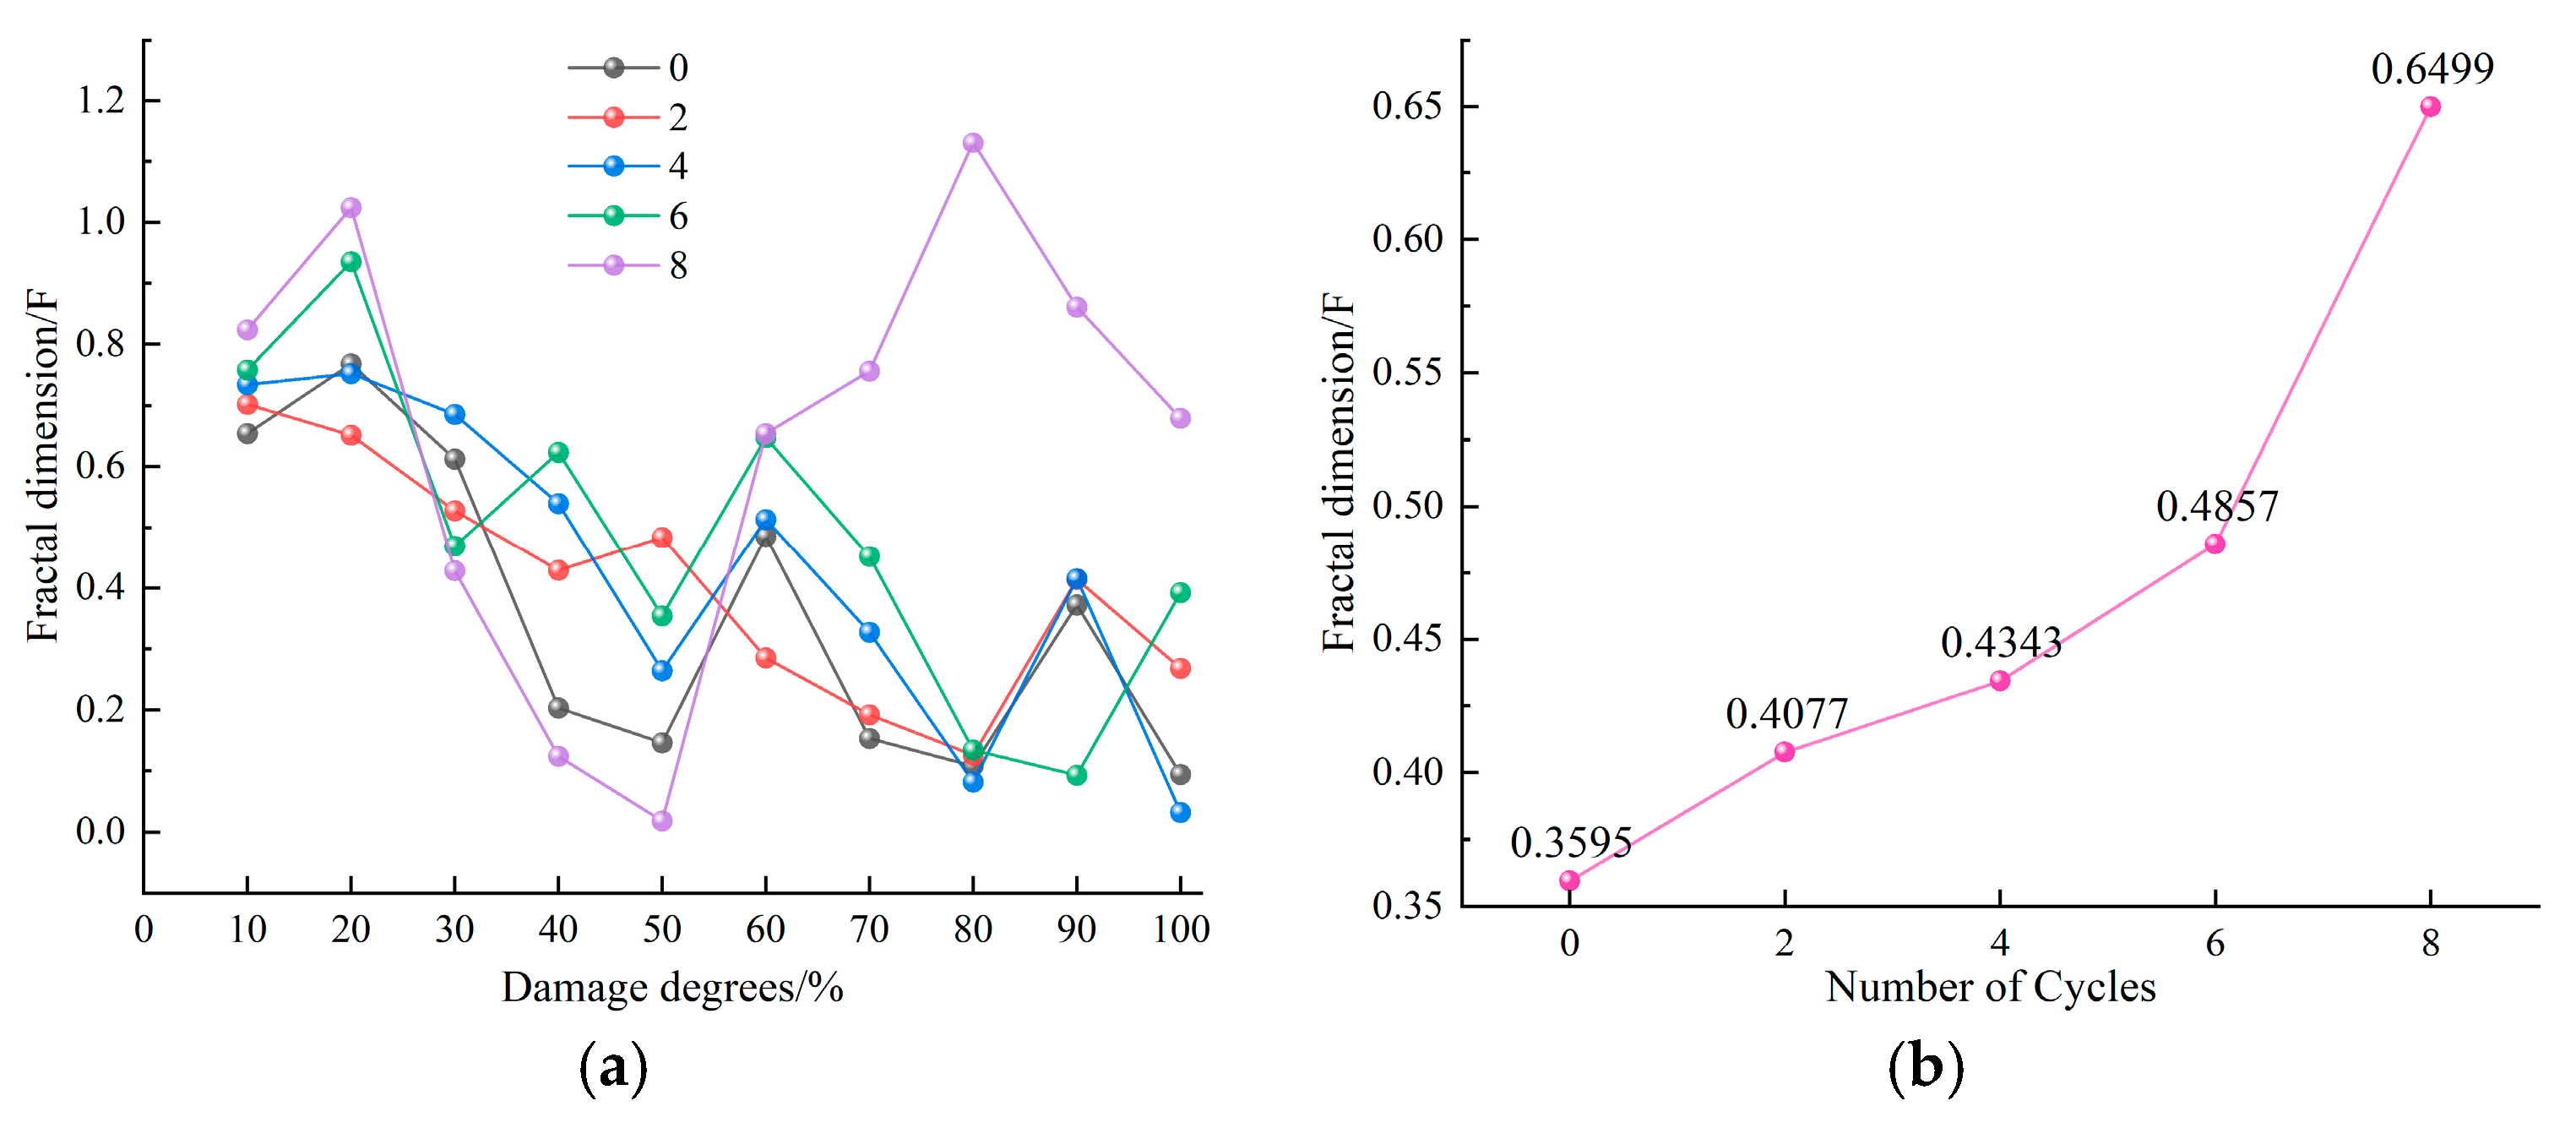
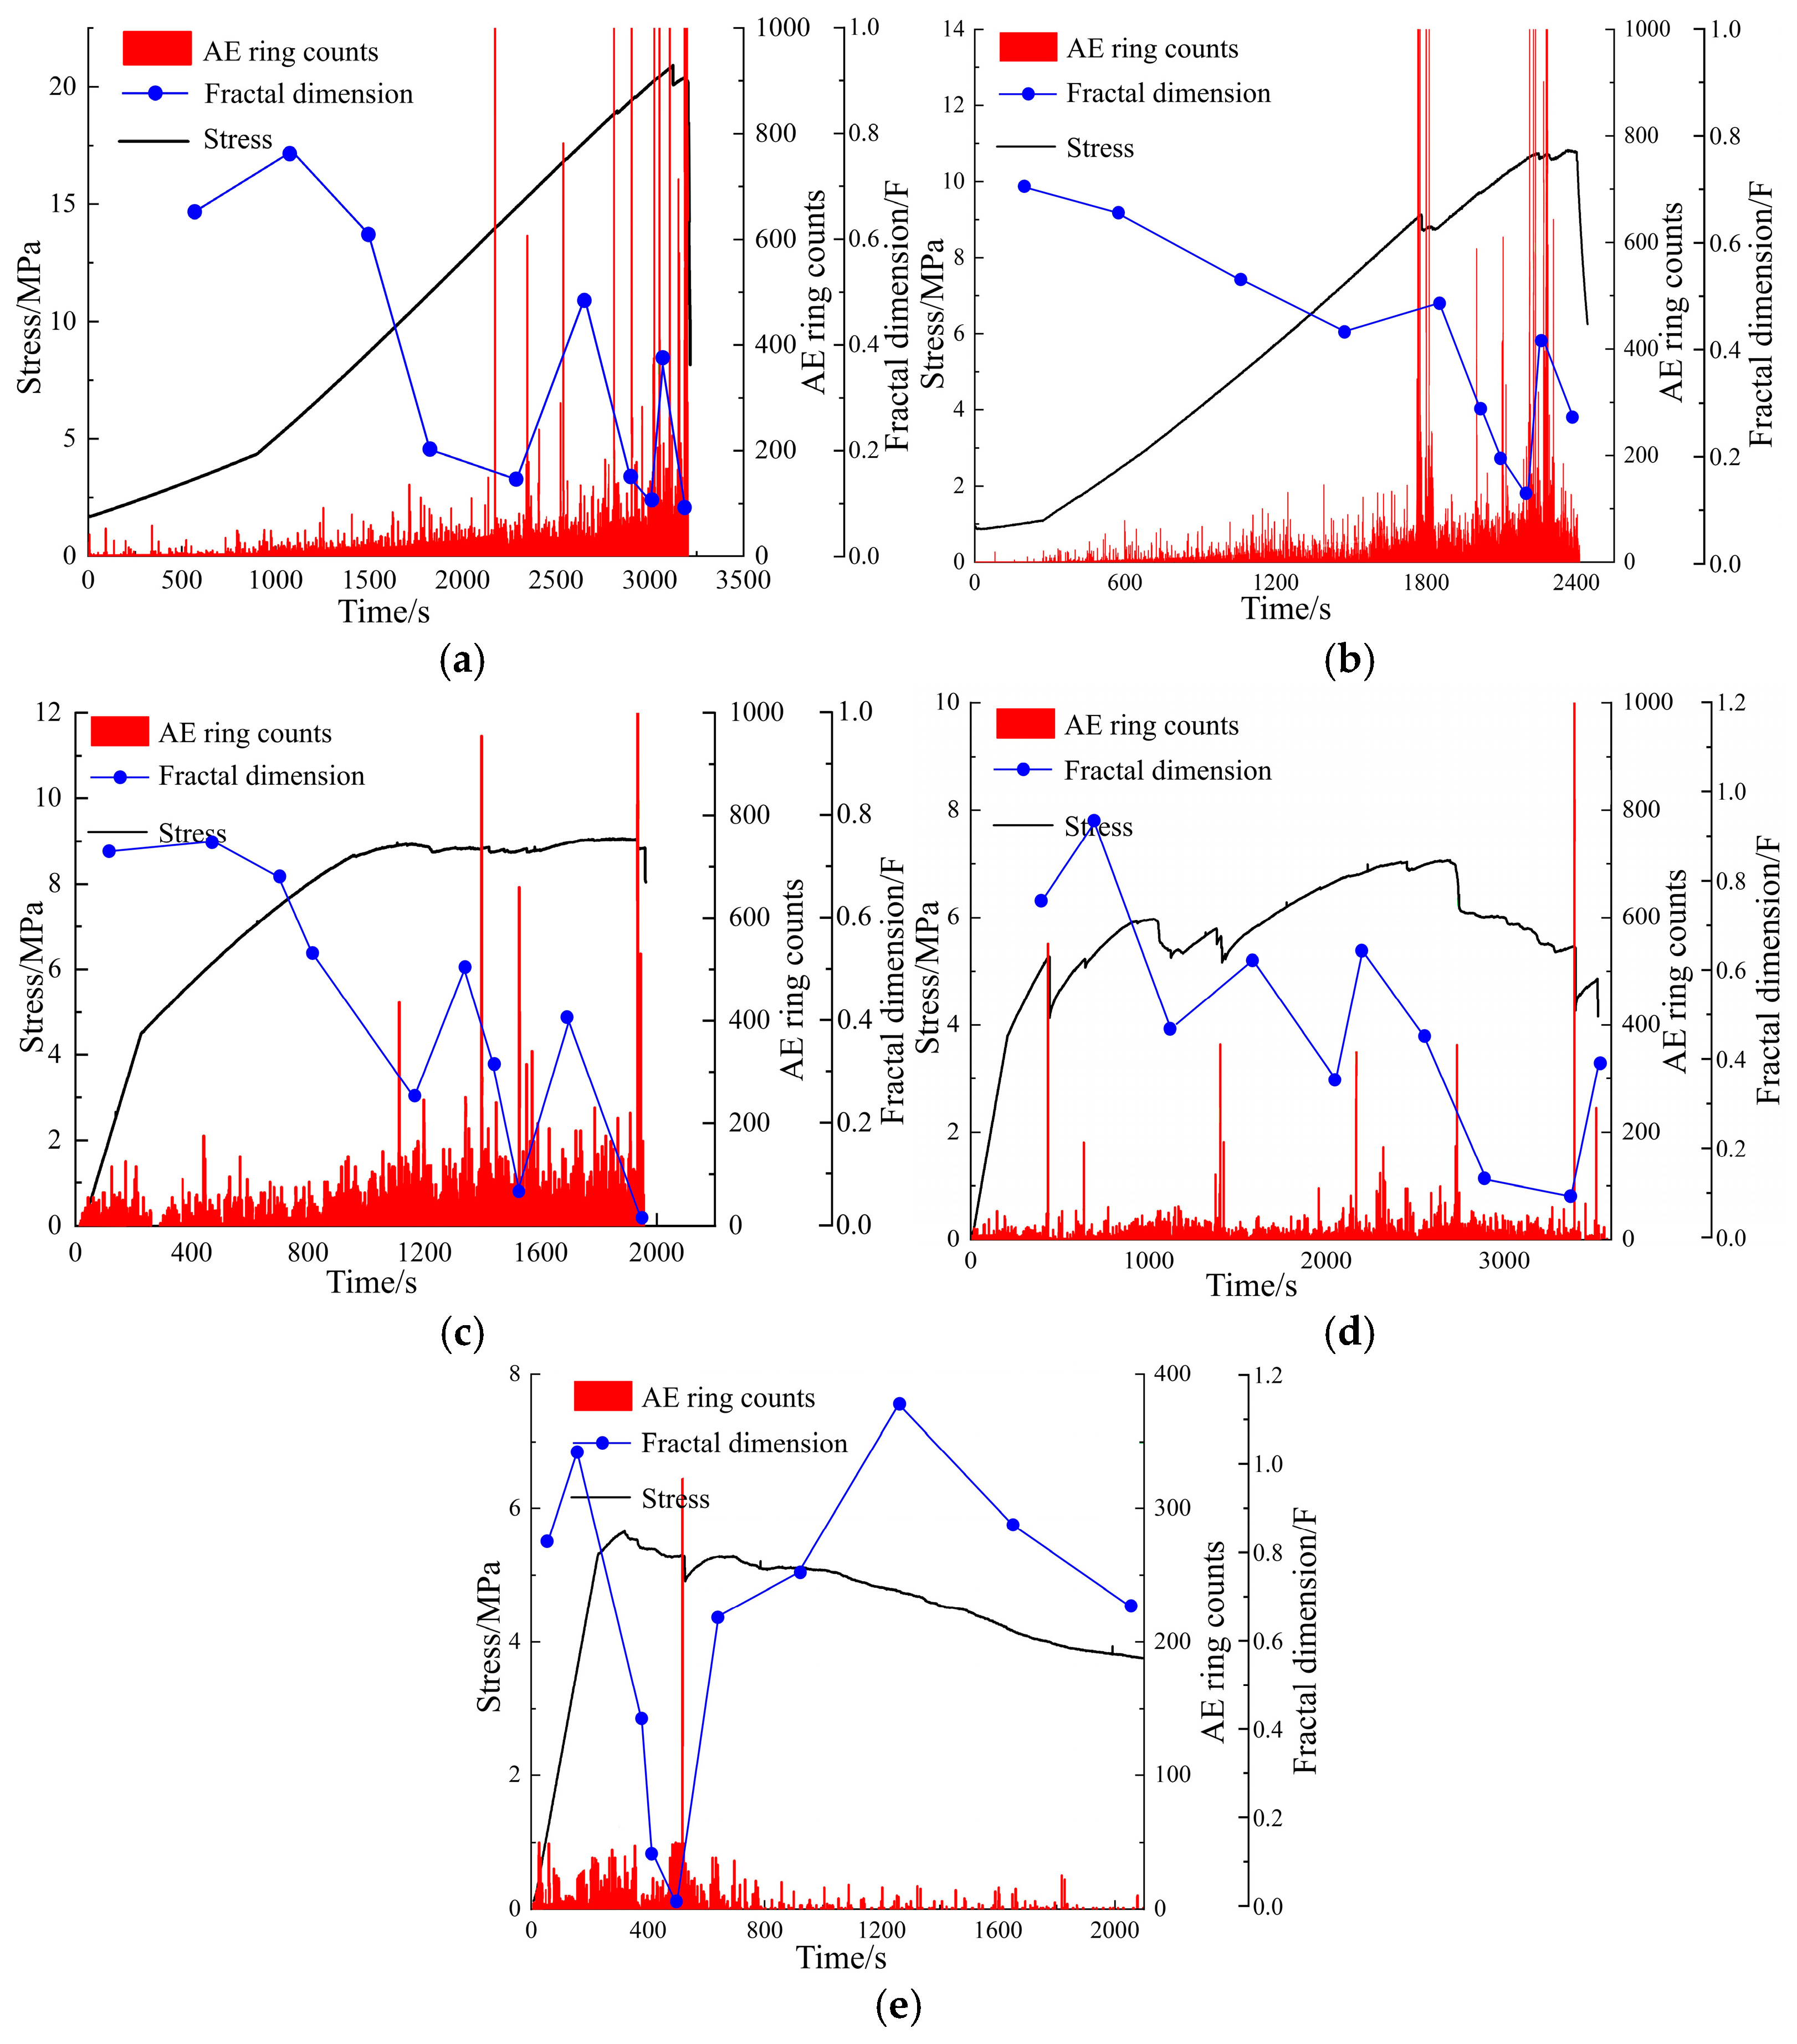
4.2. Fractal Characteristics of AE

The time step for each cycle was based on the model reaching static equilibrium. Fractal theory, established in the mid-20th century, has been widely applied and significantly developed. As a mathematical theory for describing objects with self-similarity and complex structures, it provides an effective approach to the study of rock mechanics [43]. During rock uniaxial compression, acoustic emission signals exhibit certain discreteness and nonlinearity, displaying fractal characteristics with self-similarity in both time and space [44]. Therefore, using fractal theory to study the heterogeneity and instability of acoustic emission signals can reveal the changes at different stages of rock failure, offering a way to provide early warnings for rock fracture damage.
The correlation dimension is one of the most widely used methods for calculating fractal dimensions. It is based on the G-P (Grassberger and Procaccia) algorithm for calculating the correlation dimension, which was proposed in 1983 [45]. The calculation is carried out using the acoustic emission count sequence as the data set. Each acoustic emission count sequence corresponds to a sequence set with a capacity of i; that is,
M i = m 1 , m 2 , , m i
where mi represents the parameters of the AE.
According to Formula (3), a j-dimensional phase space (where j < i) can be constructed. The number j is treated as a vector in the j-dimensional space and is represented as
N 1 = m 1 , m 2 , , m j
Taking j as the next spatial vector, a total of X = ij + 1 vectors are formed. The corresponding function is
C r = 1 X 2 x = 1 X y = 1 X θ r N x N y
where θ is the step function, defined as
θ a = 0   a 0 1   a 0
where Nx and Ny are the vectors x and y, respectively, and r is the given scale. The calculation of r is as follows:
r = t 1 X 2 x = 1 X y = 1 X N x N y
where t is the scaling function, which takes values with a gradient of 0.2, starting from 0.2 and increasing up to 1.4. The corresponding correlation dimension is then calculated for each value of t [46].
The determined value of r corresponds to a correlation function C(r), which is plotted on a double-logarithmic coordinate system. A univariate linear regression is then performed, and the slope of the resulting regression function represents the fractal dimension. The calculation is as follows:
D = lim r ln C r ln r
The AE ringing count sequences of coal samples under different numbers of wet–dry cycles were subjected to phase space reconstruction and correlation dimension calculation using MATLAB (https://ww2.mathworks.cn/products/matlab.html). The fractal dimensions at various stages of damage for each specimen were obtained, as shown in Table 3.
Figure 11 illustrates the evolution of the fractal dimension of the coal samples under varying cycle counts. As shown in Figure 11a, there are differences in the AE fractal dimensions of the coal samples at different damage levels, although the evolution processes of all the samples are generally similar. As the damage level increases, the fractal dimension follows a pattern that can be roughly divided into the following stages: initial increase (0–20%)—continuous decrease (20–50%)—fluctuating oscillations (50–80%)—reaching the minimum value (80–100%). From Figure 11b, it is evident that with an increase in the number of wet–dry cycles, the average fractal dimension of the coal samples also increases correspondingly. This trend is consistent with the reduction in AE ring counts observed during the tests. As the number of wet–dry cycles increases, the failure mode of the coal sample transitions from tensile failure to shear failure. The decrease in AE counts and the increase in the fractal dimension, along with its rate of change, are consistent with the shift in the sample’s damage behavior.
Figure 12 illustrates the evolution of stress, AE ring counts, and fractal dimensions. As shown in the figure, there is a certain degree of coordination in the dynamic evolution of stress, AE ring counts, and fractal dimensions. In the early stages of stress loading, ring counts are relatively low, while the corresponding fractal dimension remains high. As the stress increases and approaches the peak stress, the ring counts increase, while the fractal dimension decreases, reaching its minimum value. Therefore, the continuous decrease in the fractal dimension can be considered an indication of the progressive failure process of the coal sample, while a sudden drop in the fractal dimension serves as an early warning signal for the major failure of the coal sample.

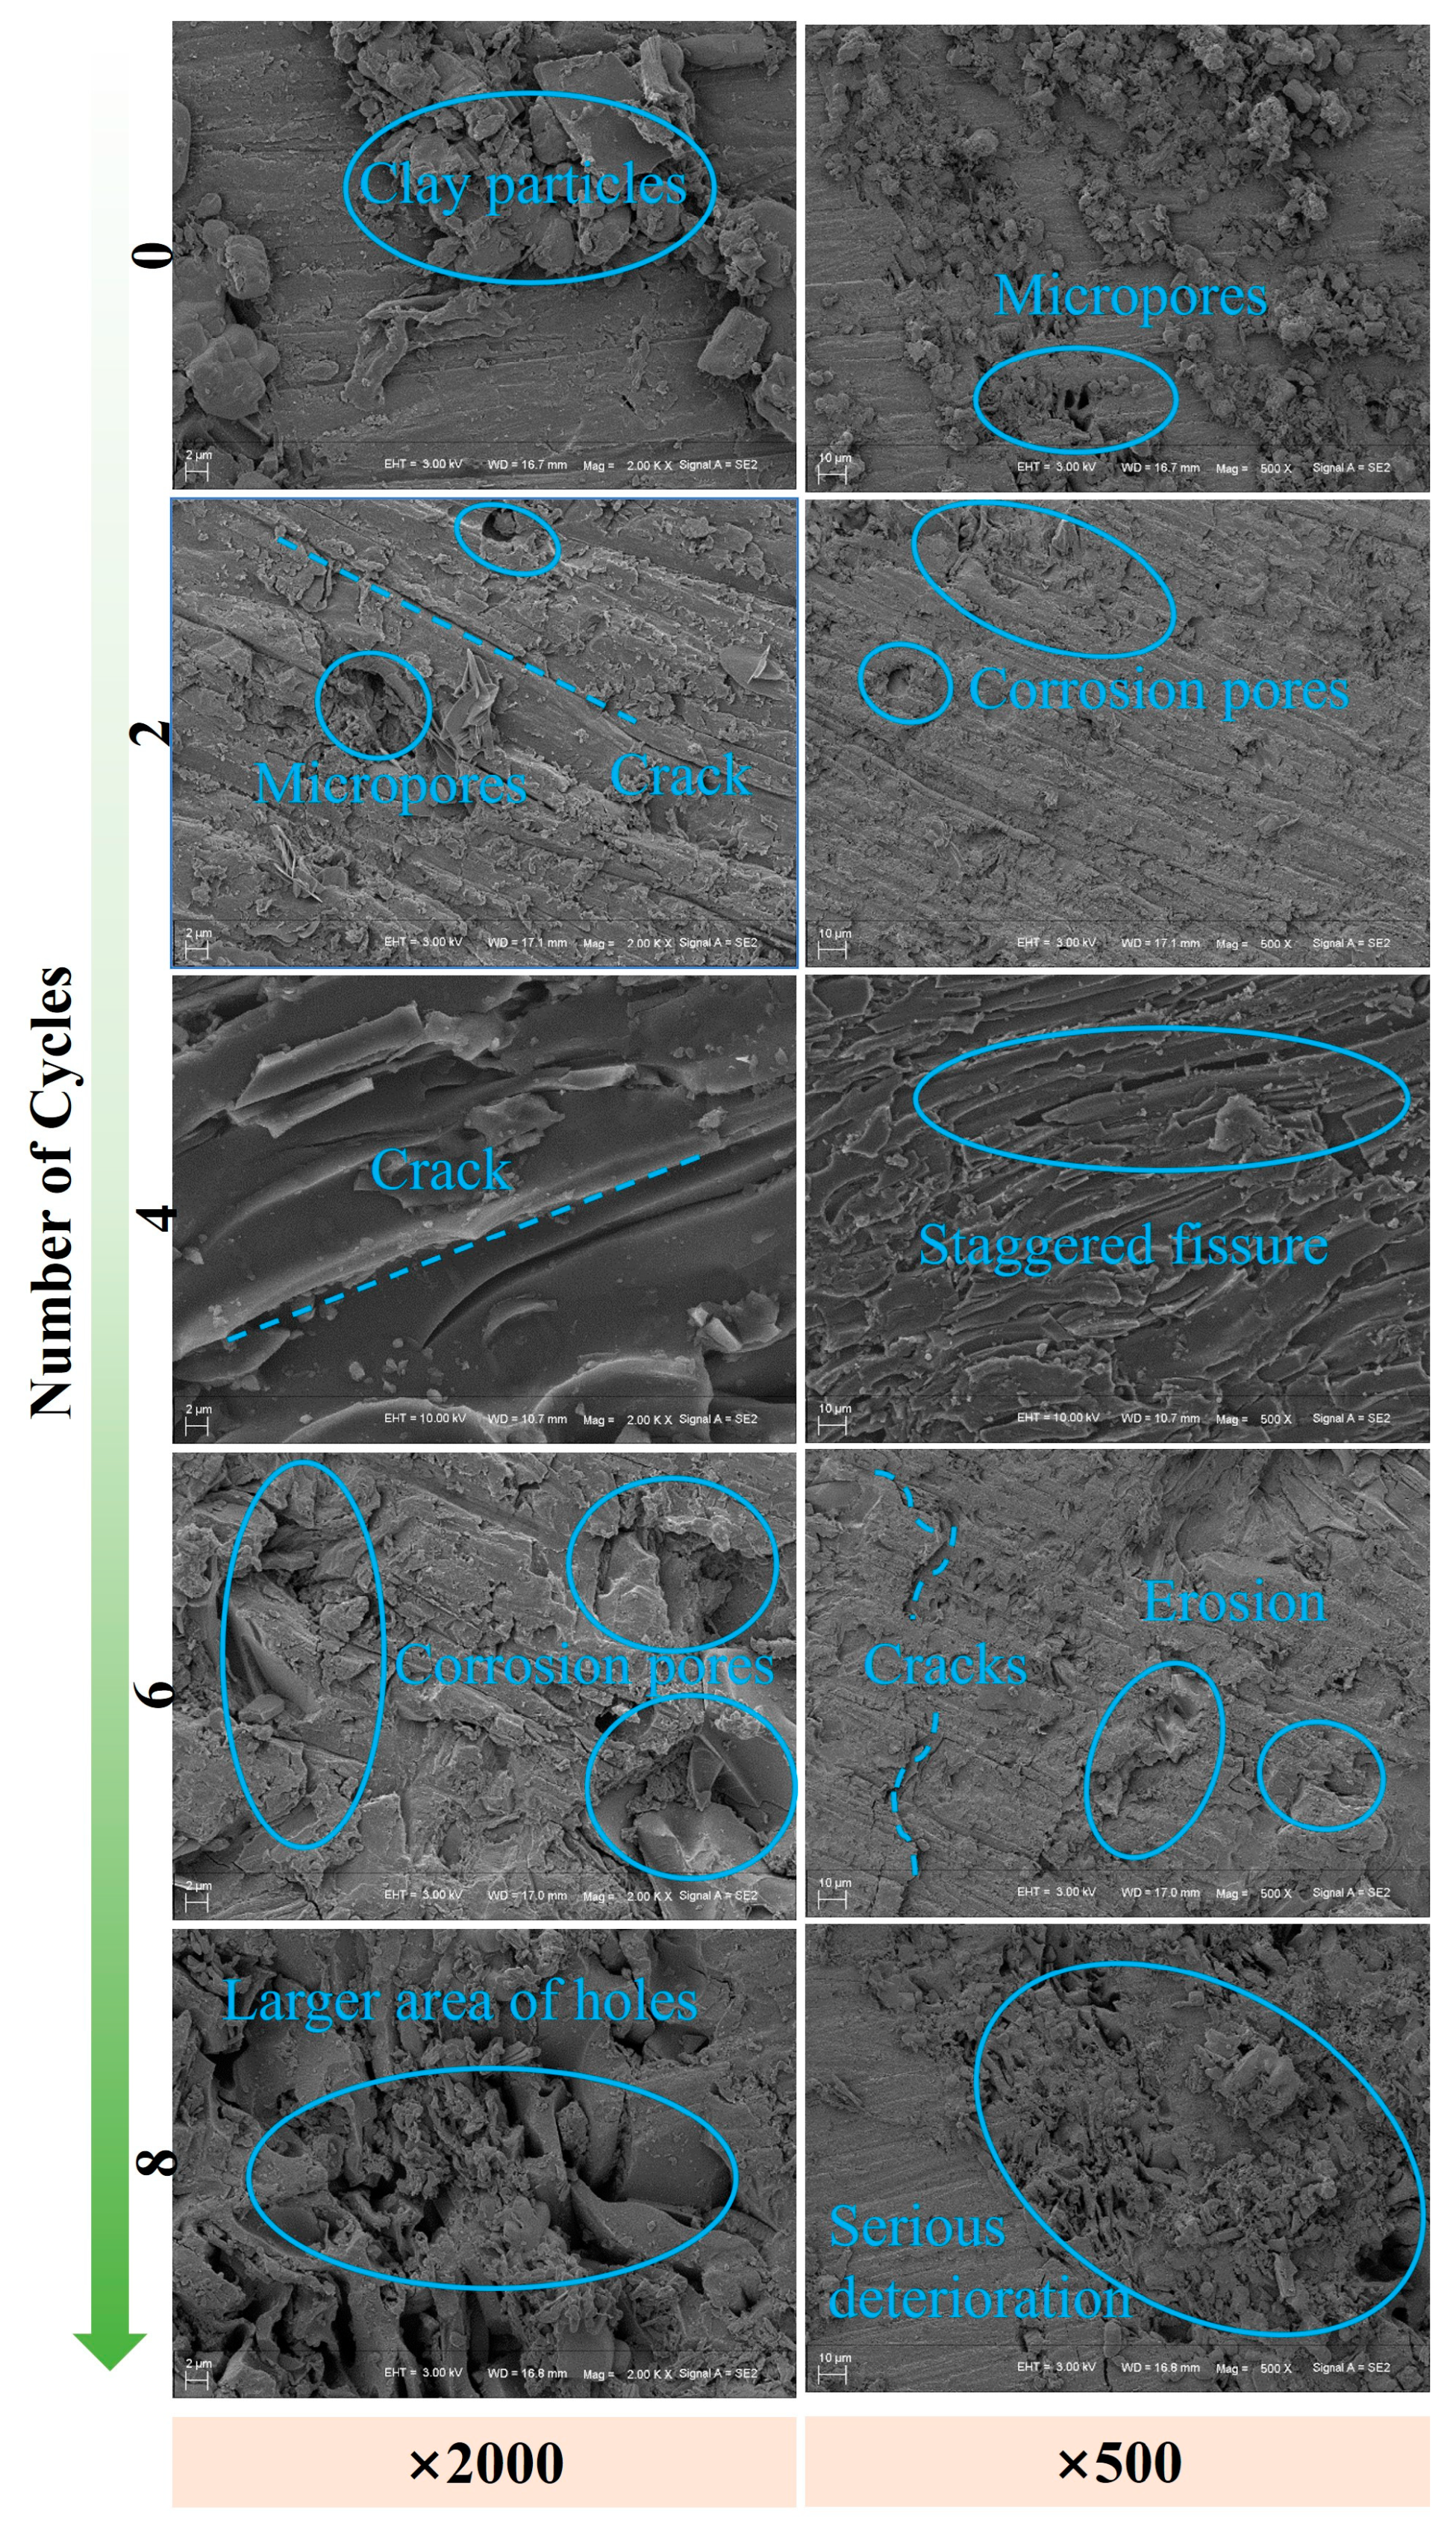
4.3. The Degradation Mechanism Based on the Microscopic Scale

The coal samples exhibit varying degrees of deterioration under the influence of different wet–dry cycle counts in an acidic, high-salinity solution. This deterioration results from the continuous and cumulative changes in the internal microstructure of the coal samples. On a microscopic scale, the coal samples contain numerous micropores and microparticle cements, which undergo complex damage processes under the action of the chemically acidic, high-salinity solution with different wet–dry cycles. These processes include varying degrees of dissolution, hydrolysis, ion exchange, acid-base corrosion, redox reactions, and salt expansion, among others. As the number of cycles increases, the microstructure progressively evolves, and the deterioration effect becomes more pronounced.
Figure 13 shows the microscopic structure of coal samples under different wet–dry cycle counts. As seen in the figure, the coal sample that was not subjected to wet–dry cycles appears relatively intact and dense. In the early stages of the wet–dry cycle, under the scouring effect of the solution, the clay particles begin to erode, and microcracks start to appear, damaging the apparent integrity of the coal sample. As the wet–dry cycle count increases, the erosion of the coal sample becomes progressively more severe, with noticeable pits appearing, and the particle compactness decreases. Especially in the later stages of the cycles, the surface of the coal sample shows an irregular, loose structure with poor compaction. Comparatively, both the natural state and the early stages of the wet–dry cycle show only a small number of cracks. After four cycles, more noticeable long cracks appear, and the cracks develop and connect, increasing in number. The penetration of these cracks results in spalling patterns and visible crack cavities, which increase the contact area between the solution and the coal sample, accelerating the development of micropores and other defects. After eight cycles, the microstructure exhibits significant pore development, with pores increasing and becoming more densely distributed. Thus, the wet–dry cycle has a deteriorating effect on the internal microstructure of the coal sample, damaging the particle framework and significantly developing pores, cracks, and other defects. The continuous accumulation of such microscopic deterioration ultimately leads to macroscopic damage to the coal sample.

5. Conclusions

(1)
The effect of dry–wet cycles on the mechanical properties and failure modes of coal samples in acidic, high-salinity solutions is significant. As the number of dry–wet cycles increases, the peak strength and elastic modulus of the coal samples degrade to varying extents, with the degradation of the elastic modulus being more pronounced.
(2)
In uniaxial compression tests, coal samples in their natural state exhibit significant brittle failure characteristics. However, as the number of dry–wet cycles increases, the failure mode of the coal samples gradually transitions from tensile failure to shear failure, with cracks extending increasingly in the directions deviating from the maximum principal stress.
(3)
The number of dry–wet cycles has a significant effect on the AE signals at different stages of the coal samples. As the number of cycles increases, the initial degree of damage within the coal sample gradually intensifies. The AE ringing count decreases progressively, and the cumulative ringing count also decreases correspondingly. Moreover, with the intensification of solution erosion, the initial internal defects increase, and AE signals become more concentrated in the early loading stages.
(4)
With the increase in dry–wet cycles, the coal samples undergo erosion and degradation by the acidic, high-salinity solution, with crack propagation transitioning predominantly to shear failure, characterized by sliding action. Based on the RA-AF classification of acoustic emissions, the proportion of shear cracks increases, and the coal samples shift from tensile failure to shear failure, which is consistent with the macro-failure mode of the coal samples.
(5)
During the incremental dry–wet cycles, the mean fractal dimension of the coal samples increases accordingly. The fractal dimension decreases with the increase in AE ringing counts. The continuous reduction in fractal dimension can be regarded as the precursor to the failure process of the coal samples, while the sharp decline in fractal dimension serves as a warning signal for the major failure of the coal samples.
(6)
The microscopic structure of coal samples in acidic, high-salinity solutions undergoes a complex damage process under different dry–wet cycles. With an increase in the number of cycles, the microscopic structure evolves progressively, with the development of defects such as pores and cracks becoming more pronounced. The deterioration effect intensifies, and the continuous accumulation of microscopic degradation ultimately leads to macro-scale failure in the coal samples.

Author Contributions

Conceptualization, L.Z. and J.P.; methodology, M.W. and J.P.; software, J.P. and L.Z.; validation, L.Z. and B.Z.; formal analysis, J.P. and Y.Z.; investigation, L.Z. and Y.Z.; resources, J.P.; data curation, M.W. and X.X.; writing—original draft preparation, J.P., L.Z. and M.W.; writing—review and editing, J.P. and X.X.; supervision, J.P.; project administration, J.P.; funding acquisition, J.P. and M.W. All authors have read and agreed to the published version of the manuscript.

Funding

This research was funded by the Natural Science Foundation of Hunan Province (No. 2023JJ40549), the Science and Technology Innovation Program of Hunan Province (No. 2023RC3171), and the Guangdong Basic and Applied Basic Research Foundation (No. 2023A1515110181).

Data Availability Statement

Data will be made available on request.

Conflicts of Interest

The authors declare no conflicts of interest.

References

  1. Wang, S.; Sun, Q.; Geng, J.; Yuan, S.; Gu, C.; Yang, D.; Niu, C.; Lu, T.; Guo, C.; Zhang, H.; et al. Geological Assurance Technology Framework for Damage and Damage Reduction Mining in Western Mining Areas. Coal Geol. Explor. 2024, 52, 1–13. [Google Scholar]
  2. Huang, B.; Xie, P.; Wu, Y.; Lin, W.; Luo, S.; Wang, S.; Wen, Z.; Chen, J. The Effect of Overlying Rock Fracture and Stress Path Evolution in Steeply Dipping and Large Mining Height Stope. Géoméch. Geophys. Geo-Energy Geo-Resour. 2024, 10, 95. [Google Scholar] [CrossRef]
  3. Yao, Q.; Yu, L.; Chen, S.; Li, Y.; Li, X. Mining-affected Water Resources and Ecological Effects in Ecologically Fragile Mining Areas of Western. China J. China Coal Soc. 2025, 1–22. [Google Scholar] [CrossRef]
  4. Shan, P.; Meng, Z.; Xu, H.; Li, C.; Zhang, L.; Xi, B. Research on Accurate Recognition and Refuse Rate Calculation of Coal and Gangue Based on Thermal Imaging of Transporting Situation. Measurement 2024, 244, 116574. [Google Scholar] [CrossRef]
  5. Gu, D.; Cao, Z.; Li, J.; Wu, B.; Zhang, Y.; Jiang, B.; Guo, Q.; Wang, H.; Wu, Y.; Shi, X.; et al. Development and Application of the Original Test Platform System for Coal Mine Underground Water Reservoir Technology. J. China Coal Soc. 2024, 49, 100–113. [Google Scholar]
  6. Gu, D.; Li, J.; Cao, Z.; Wu, B.; Jiang, B.; Yang, Y.; Yang, J.; Chen, Y. Development Strategy and Engineering Technology for Protection and Utilization of Mine Water in China. Coal Sci. Technol. 2021, 46, 3079–3089. [Google Scholar]
  7. Wang, M.; Xi, X.; Guo, Q.F.; Pan, J.L.; Cai, M.F.; Yang, S.T. Sulfate Diffusion in Coal Pillar: Experimental Data and Prediction Model. Int. J. Coal Sci. Technol. 2023, 10, 17. [Google Scholar] [CrossRef]
  8. Li, N.; Zhang, X.; Wang, D.; Zhao, X. Experimental Study on the Changes of Longitudinal Wave Velocity and Waveform Char-acteristics during the Water Absorption Process of Coal Samples. Rock Mech. Eng. 2017, 36, 1921–1929. [Google Scholar]
  9. Perera, M.S.A.; Ranjith, P.G.; Peter, M. Effects of Saturation Medium and Pressure on Strength Parameters of Valley Brown Coal: Carbon Dioxide, Water, and Nitrogen Saturations. Energy 2011, 36, 6941–6947. [Google Scholar]
  10. Poulsen, B.A.; Shen, B.; Williams, D.J.; Huddlestone-Holmes, C.; Erarslan, N.; Qin, J. Strength Reduction on Saturation of Coal and Coal Measures Rocks with Implications for Coal Pillar Strength. Int. J. Rock Mech. Min. Sci. Géoméch. Abstr. 2014, 71, 41–52. [Google Scholar] [CrossRef]
  11. Vishal, V.; Ranjith, P.; Singh, T. An Experimental Investigation on the Behaviour of Coal Under Fluid Saturation, Using Acoustic Emission. J. Nat. Gas. Sci. Eng. 2015, 22, 428–436. [Google Scholar] [CrossRef]
  12. Chen, T.; Yao, Q.-L.; Wei, F.; Chong, Z.-H.; Zhou, J.; Wang, C.-B.; Li, J. Effects of Water Intrusion and Loading Rate on Mechanical Properties of and Crack Propagation in Coal–Rock Combinations. J. Cent. South. Univ. 2017, 24, 423–431. [Google Scholar] [CrossRef]
  13. Yang, K.; Wei, Z.; Dou, L.T.; Chi, X.L.; Liu, W.J.; Zhang, J.Q. Experimental Study on Dynamic Tensile Energy Evolution and Failure Characteristics of Water-bearing Coal Samples. Coal Sci. Technol. 2021, 46, 398–411. [Google Scholar]
  14. Liu, S.; Yang, G.S.; Dong, X.H. Experimental Study on the Effect of Dry-Wet Cycles on the Mechanical Properties and Damage of Red Sandstone. Coal Sci. Technol. 2019, 47, 101–106. [Google Scholar]
  15. Abdilor, Y.; Khanlari, M. Influence of Wet-Dry, Freeze-Thaw, and Heat-Cool Cycles on the Physical and Mechanical Properties of Upper Red Sandstones in Central Iran. Bull. Eng. Geol. Environ. 2015, 74, 1287–1300. [Google Scholar]
  16. Özbek, A. Investigation of the Effects of Wetting–Drying and Freezing–Thawing Cycles on Some Physical and Mechanical Properties of Selected Ignimbrites. Bull. Eng. Geol. Environ. 2013, 73, 595–609. [Google Scholar] [CrossRef]
  17. Huang, S.; Wang, J.; Qiu, Z.; Kang, K. Effects of Cyclic Wetting-Drying Conditions on Elastic Modulus and Compressive Strength of Sandstone and Mudstone. Processes 2018, 6, 234. [Google Scholar] [CrossRef]
  18. Ma, D.H.; Yao, H.Y.; Cui, Q.; Cheng, S.L. Analysis of the Effect of Water Chemical Solution on the Mechanical Properties of Limestone. Chin. Sci. Pap. 2019, 14, 846–851. [Google Scholar]
  19. Wang, Y.J.; Rong, H.R.; Wang, D.L.; Guo, Q.; Mu, B.L.; Zhao, Y.; Zhan, L. Experimental Study on the Mechanical Properties of Yellow Sandstone under Al-kaline Solution Corrosion. J. Hebei Univ. Eng. 2017, 35, 15–20. [Google Scholar]
  20. Han, T.L.; Shi, J.P.; Chen, Y.S. Study on the Correlation of Fracture Toughness and Strength Parameters of Sandstone under Chemical Corrosion and Dry-Wet Cycles. J. Hydraul. Eng. 2018, 49, 1265–1275. [Google Scholar]
  21. Chen, W.L.; Xie, J.; Sun, Y. Effect of Acid Rain Corrosion on Uniaxial Compressive Properties of Marble. J. Cent. South Univ. Sci. Technol. 2013, 44, 2897–2902. [Google Scholar]
  22. Miao, S.J.; Cai, M.F.; Ji, D. Effects and Mechanisms of Granite Damage and Aging under Acidic Chemical Solution. Coal Sci. Technol. 2016, 41, 1137–1144. [Google Scholar]
  23. Miao, S.J.; Cai, M.F.; Ji, D. Damage Effects of Acidic Chemical Solution on the Mechanical Properties and Parameters of Granite. Coal Sci. Technol. 2016, 41, 829–835. [Google Scholar]
  24. Huo, R.K.; Wang, L.F.; Li, S.G.; Ding, F.; Wang, G.J.; Qiu, T. Damage Characteristics and Analysis Model of Sandstone under Acid Corrosion. J. Civ. Civil. Environ. Eng. 2022, 44, 1–9. [Google Scholar]
  25. Gong, C.-G.; Wang, W.; Shao, J.-F.; Wang, R.-B.; Feng, X.-W. Effect of Water Chemical Corrosion on Mechanical Properties and Failure Modes of Pre-Fissured Sandstone Under Uniaxial Compression. Acta Geotech. 2020, 16, 1083–1099. [Google Scholar] [CrossRef]
  26. Dai, J.; Liu, J.; Liu, C.; Yang, J.; Xue, F.; Tang, Y.; Liu, J.; Liu, D.; Dai, S. Regional Characteristics of Seismicity Associated with Hydraulic Fracturing in the Southern Sichuan Basin of China. Rock. Mech. Rock. Eng. 2024, 57, 6971–6996. [Google Scholar] [CrossRef]
  27. Dai, J.; Liu, J.; Yang, J.; Xue, F.; Wang, L.; Shi, X.; Dai, S.; Hu, J.; Liu, C. Seismicity Associated with Hydraulic Fracturing in Changning Shale Gas Field, China: Constraints from Source Mechanisms, Stress Field and Fluid Overpressure Thresholds. J. Rock. Mech. Geotech. Eng. 2024, in press. [Google Scholar] [CrossRef]
  28. Zhang, L.M.; Lai, X.P.; Pan, J.L.; Shan, P.F.; Zhang, Y.; Zhang, Y.; Xu, H.C.; Cai, M.F.; Xi, X. Experimental Investigation on the Mixture Optimization and Failure Mechanism of Cemented Backfill with Coal Gangue and Fly Ash. Powder Technol. 2024, 440, 119751. [Google Scholar] [CrossRef]
  29. Wen, S.Y.; Han, L.J.; Zong, Y.J.; Meng, Q.B.; Zhang, J. Study on Acoustic Emission Characteristics of Red Sandstone under Uniaxial Compression with Different Water Contents. Coal Sci. Technol. 2013, 41, 46–48. [Google Scholar]
  30. Ran, Q.C.; Liang, Y.P.; Yang, Z.L.; Zou, Q.L.; Ye, C.F.; Tian, C.L.; Wu, Z.P.; Zhang, B.C.; Wang, W.Z. Deterioration Mechanisms of Coal Mechanical Properties Under Uniaxial Multi-Level Cyclic Loading Considering Initial Damage Effects. Int. J. Rock Mech. Min. Sci. Géoméch. Abstr. 2024, 186, 106006. [Google Scholar] [CrossRef]
  31. Gao, B.; Li, H.; Li, L.; Su, C. Acoustic emission and fractal characteristics of saturated coal samples in the failure process. J. Min. Saf. Eng. 2015, 32, 665–676. [Google Scholar]
  32. Tang, L.; Tu, S.; Tu, H.; Miao, K.; Li, W.; Zhao, H.; Ma, J.; Zhang, L. Compressive Failure Characteristics of a Coal–Rock Combination at Different Angles: Experimental Study and Fractal Analysis. Fractal Fract. 2024, 8, 240. [Google Scholar] [CrossRef]
  33. Guo, Z.Q. High Mineralization Mine Water Treatment Technology and Application. Min. Saf. Environ. 2012, 39, 72–74. [Google Scholar]
  34. Han, T.; Chen, Y.; Shi, J. Experimental Study of Mechanical Characteristics of Sandstone Subjected to Hydrochemical Erosion. Chin. J. Rock Mech. Eng. 2013, 32 (Suppl. 2), 3064–3072. [Google Scholar]
  35. Li, G.; Wei, L.; Su, H.; Jing, H.; Zhang, T. Experimental Study on the SHPB Impact Dynamic Properties of Limestone Subjected to Chemical Erosion. J. Rock Mech. Eng. 2018, 37, 2075–2083. [Google Scholar]
  36. Han, T.; Shi, J.; Chen, Y.; Cao, X. Mechanism damage to mode-i fractured sandstone from chemical solutions and its correlation with strength characteristics. Pure Appl. Geophys. 2019, 176, 5027–5049. [Google Scholar] [CrossRef]
  37. Bieniawski, Z.T. Mechanism of Brittle Fracture of Rock: Parts I, II, and III. Int. J. Rock Mech. Min. Sci. Geomech. Abstr. 1967, 4, 395–406. [Google Scholar]
  38. Zhang, Y.; He, K.; Yang, J.; Pan, J.; Xi, X.; Feng, X.; Zhang, L. Mechanical, Seepage, and Energy Evolution Properties of Multi-Shaped Fractured Sandstone Under Hydro-Mechanical Coupling: An Experimental Study. Minerals 2025, 15, 215. [Google Scholar] [CrossRef]
  39. Wen, Z.; Du, Z.; Li, S. Research on the Time-dependent Stability of Filling Paste Under the Action of Different Concentrations of Chloride. Salts Coal Sci. Technol. 2025, 1–13. Available online: http://kns.cnki.net/kcms/detail/11.2402.TD.20240509.1104.001.html (accessed on 25 March 2025).
  40. Pan, J.; Zhang, Y.; Li, P.; Wu, X.; Xi, X. Mechanical Properties and Thermo-Chemical Damage Constitutive Model of Granite Subjected to Thermal and Chemical Treatments Under Uniaxial Compression. Constr. Build. Mater. 2023, 390, 131755. [Google Scholar] [CrossRef]
  41. Liu, X.; Liu, Z.; Li, X.; Gong, F.; Du, K. Experimental Study on the Effect of Strain Rate on Rock Acoustic Emission Character-istics. Int. J. Rock Mech. Min. Sci. 2020, 133, 104420. [Google Scholar]
  42. Ohno, K.; Ohtsu, M. Crack Classification in Concrete Based on Acoustic Emission. Constr. Build. Mater. 2010, 24, 2339–2346. [Google Scholar] [CrossRef]
  43. Li, Y.X.; Xie, H.P.; Liu, J.F. Study on the Fractal Dimension Calculation Method of RGB Images. Rock Mech. Eng. 2008, S1, 2779–2784. [Google Scholar]
  44. Wu, X.; Liu, X.; Liang, Z.; You, X.; Yu, M. Experimental Study of Fractal Dimension of AE Series of Different Rocks under Uniaxial Compression. Rock Soil. Mech. 2012, 33, 3561–3569. [Google Scholar]
  45. Liang, Z.Y.; Gao, F.; Lin, J.T.; Feng, S.Z.; Zheng, Z.G. Fractal Characteristics of Acoustic Emission Parameters of Rock under Uniaxial Compres-sion. Mech. Pract. 2009, 32, 43–46. [Google Scholar]
  46. Wang, G.F. Study on the Kaiser Point Signal Characteristics of Rock Acoustic Emission. Master’s Thesis, Jiangxi University of Science and Technology, Ganzhou, China, 2007. [Google Scholar]
Figure 1. Experimental samples and XRD test results.
Fractalfract 09 00221 g001
Figure 2. Schematic diagram of the acidic, high-salinity dry–wet cycle process.
Fractalfract 09 00221 g002
Figure 3. Equipment. (a) MTS 815 test system and PCI-2 acoustic emission monitoring system. (b) Specimen after the installation of the AE sensors and extensometers. (c) Position of the AE sensors and the extensometers.
Fractalfract 09 00221 g003
Figure 4. The schematic of AE parameters.
Fractalfract 09 00221 g004
Figure 5. Stress–strain curves of coal samples under different wet–dry cycles (where n denotes the number of cycles). (a) Axial strain and circumferential strain. (b) Volumetric strain.
Fractalfract 09 00221 g005
Figure 6. Schematic diagram of the degradation coefficients of peak strength and elastic modulus at various stages. (a) Total degradation coefficient. (b) Single-cycle degradation coefficient.
Fractalfract 09 00221 g006
Figure 7. The failure modes of coal samples under different wet–dry cycles.
Fractalfract 09 00221 g007
Figure 8. The evolution of AE count and cumulative AE count of coal rock samples under different cycle numbers. (a) n = 0; (b) n = 2; (c) n = 4; (d) n = 6; (e) n = 8.
Fractalfract 09 00221 g008
Figure 9. Classification criteria for tensile and shear cracks.
Fractalfract 09 00221 g009
Figure 10. The classification of cracks in coal samples under different cycle numbers. (a) n = 0; (b) n = 2; (c) n = 4; (d) n = 6; (e) n = 8.
Fractalfract 09 00221 g010
Figure 11. Evolution of AE fractal dimensions of coal samples under varying wet–dry cycle counts. (a) Different damage levels. (b) Different wet-dry cycle counts.
Fractalfract 09 00221 g011
Figure 12. Evolution of stress, ring count, and AE fractal dimension. (a) n = 0 (b) n = 2 (c) n = 4 (d) n = 6 (e) n = 8.
Fractalfract 09 00221 g012
Figure 13. Microscopic structure of coal samples under different cycle counts.
Fractalfract 09 00221 g013
Table 1. Main component concentrations of mine water.
TDSCa2+Na+K+SO42−Cl
/mg·L−1/mg·L−1/mg·L−1/mg·L−1/mg·L−1/mg·L−1
472086135010.711451230
Table 2. The strength and deformation parameters of the specimen.
Number of CyclesPeak Strength/MPaElastic Modulus/GPaDσj
/%
Dσi
/%
DEj
/%
DEi
/%
020.912.56----
210.831.3948.2124.1145.7022.85
49.060.8356.674.2367.5810.94
67.070.6966.194.7673.052.74
85.660.5572.933.3778.522.74
Table 3. AE fractal dimensions of coal samples at different damage levels under varying wet–dry cycle counts.
Number of CyclesFractal Dimension of Different Damage Degrees
10%20%30%40%50%60%70%80%90%100%
00.6540.7680.6120.2030.1460.4850.1530.0680.3720.297
20.7020.6860.5930.4820.5140.3270.2380.1260.4240.486
40.7340.7520.6850.5390.2640.5130.3270.0820.4150.305
60.7580.9350.4690.6230.3540.6470.4520.1340.0930.392
80.8241.0240.4280.1240.0180.6540.7561.1310.8610.679
Disclaimer/Publisher’s Note: The statements, opinions and data contained in all publications are solely those of the individual author(s) and contributor(s) and not of MDPI and/or the editor(s). MDPI and/or the editor(s) disclaim responsibility for any injury to people or property resulting from any ideas, methods, instructions or products referred to in the content.

