1. Introduction
In copper metallurgy, a flash furnace produces copper matte or smelting copper. The concentrate in the form of crushed particles is fed to the reaction space of the flash furnace through the concentrate burner located in the roof of the reaction shaft. The design of the concentrate burner through which the mixture of air and technical oxygen is supplied ensures homogenization of the concentrate and process air [1,2].
By using CFD methods, you can improve the efficiency and accuracy of processes. The phenomena in the reaction shaft of a flash furnace occur very quickly and are therefore difficult to observe on an industrial scale, which is why numerical methods make it possible to study them [3,4,5,6,7].
2. Materials and Methodology
Based on industrial data—the average value of the process air flow of 38,350 nm3/h with a concentrate feed of 100 Mg/h, the movement of concentrate particles inside the reaction shaft of the flash furnace and above the assumed level of the settling tank bath was modeled. Based on sieve analyzes of the delivered concentrates, the following grain composition was adopted—Table 1. The grain diameters assumed for calculations were 70 μm, 80 μm and 100 μm.

Table 1.
Grain composition of concentrate.
Model calculations were performed in the Phoenics program in unsteady mode. The Inter Phase Slip Algorithm two-phase flow model was used to analyze the movement of concentrate particles in the flash furnace. Calculations were carried out for the model k-ε.
3. Results
The calculations made it possible to obtain the distribution of concentrate particles flowing through the reaction shaft and settling tank after appropriate time steps. Figure 1 shows the distribution of 70 μm particles after 60 s.
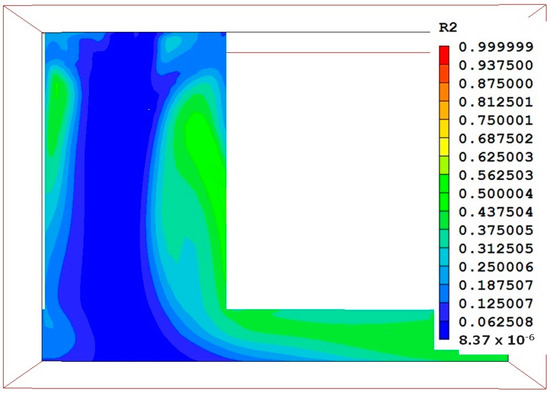
Figure 1.
Distribution of 70 μm particles after 60 s.
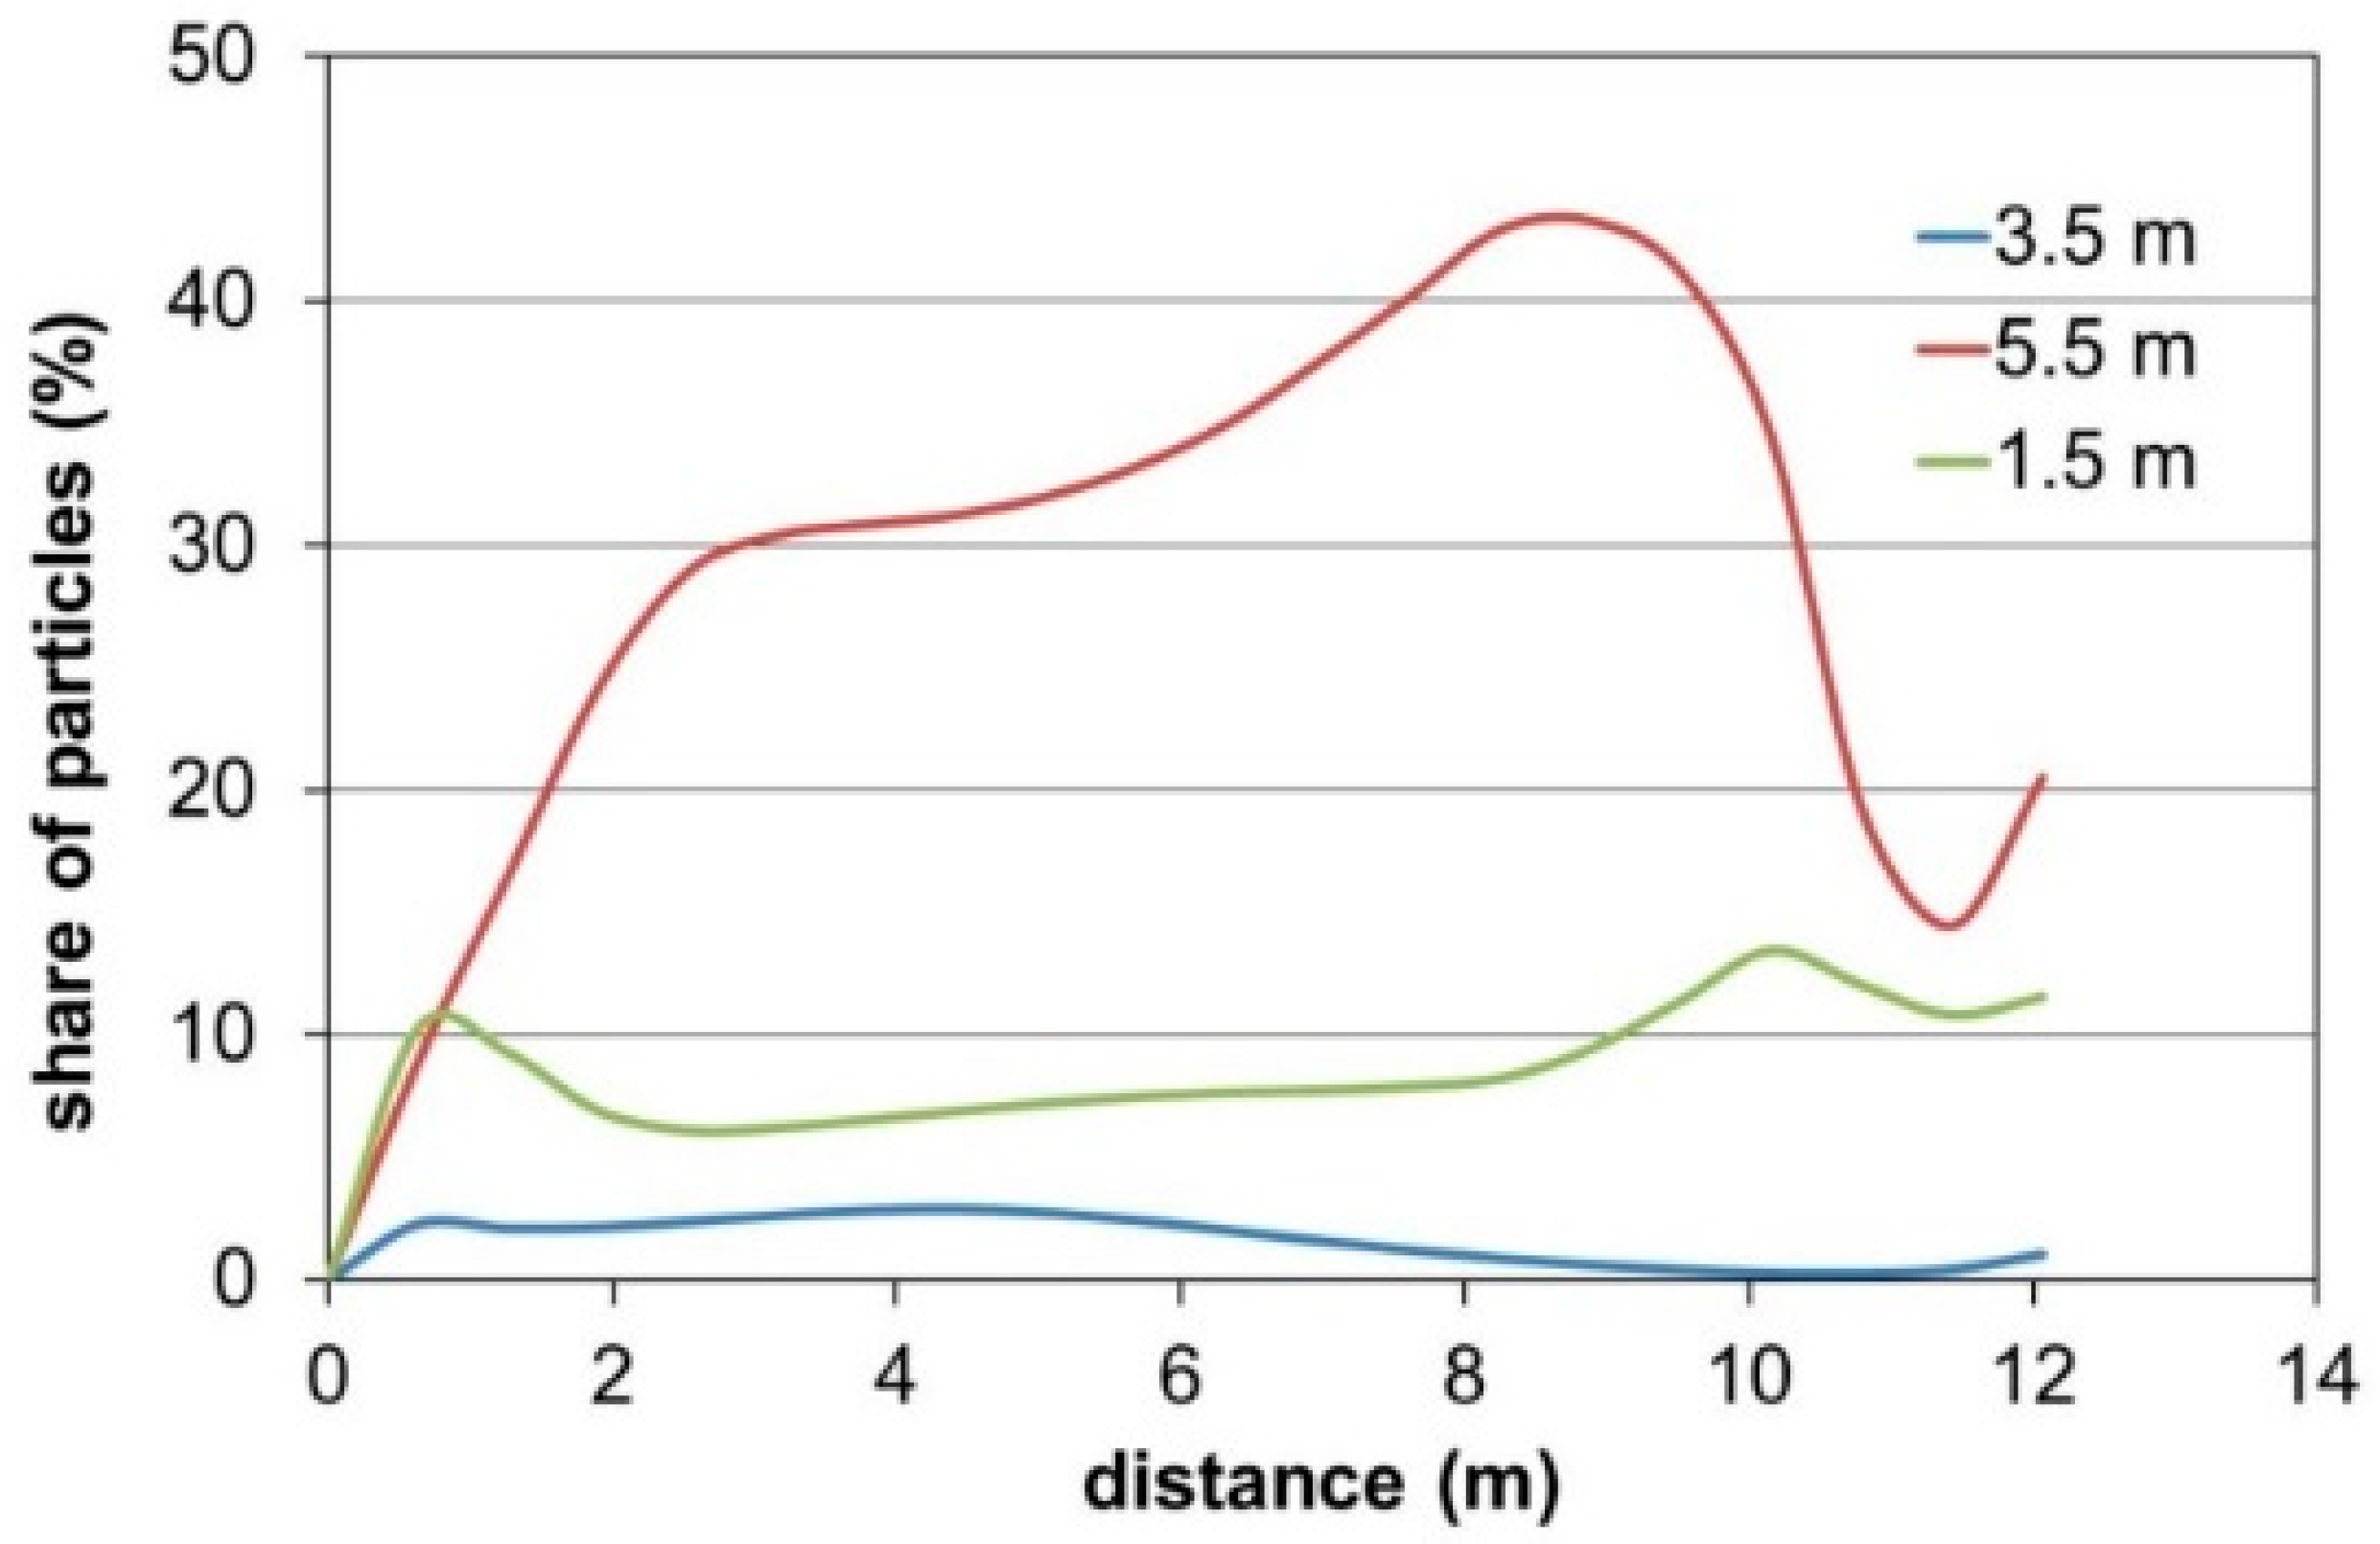
The change in the share of concentrate particles was examined along the height of the reaction shaft for three different planes at selected time steps. After 60 s, for particles of 70 μm in the plane passing through the center of the reaction shaft (which corresponds to a length of 3.5 m), the share of the solid phase from the outlet at a height of 12 m to the bottom of the settling tank is approximately 2–3%. At a length of 1.5 m, the share of particles at the shaft outlet from 12% decreases to 6% at a height of 10 m to 2 m. For a length of 5.5 m, the share of particles is 43% at a height of 8 m and then decreases reaching 30% at 3 m of the shaft height (Figure 2).

Figure 2.
Share of 70 μm concentrate particles along the reaction shaft.
From the obtained velocity distributions, the movement of particles in the flash furnace was analyzed. An example of the velocity distribution for particles of 70 μm is shown in Figure 3. The concentrate particles move, creating a central stream, heading towards the side wall of the settling tank, where some of them fall and the rest move along the settling tank.
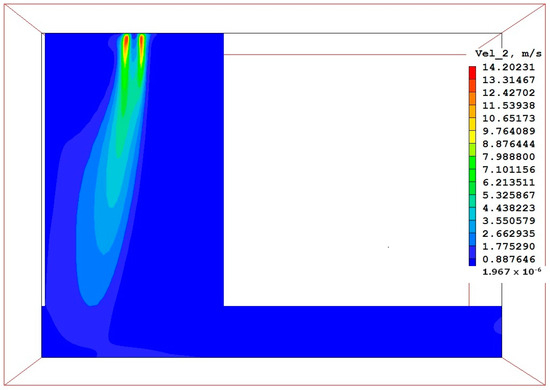
Figure 3.
Distribution of velocity of 70 μm particles.
Additionally, characteristics of the particle velocity changes along the reaction shaft at selected heights were prepared. On their basis, it was found that concentrate particles with a diameter of 70 μm moved the fastest along a shaft length of 3.25 m at a speed from 8 m/s to 0.23 m/s. Particles of 80 μm moved fastest along a shaft length of 3.3 m in the range of 13 m/s to 3 m/s, and particles of 100 μm moved fastest along a length of 2.5 m from 0.4 m/s to 2 m/s.
Funding
This research was funded by the Ministry of Science and Higher Education as part of the Statutory work of the Łukasiewicz Research Network—Institute of Non-Ferrous Metals No. 0322057008.
Institutional Review Board Statement
Not applicable.
Informed Consent Statement
Not applicable.
Data Availability Statement
Dataset is available on request from the authors.
Conflicts of Interest
The author declares no conflicts of interest.
References
- Piestrzyński, A. Monograph KGHM Polska Miedź. Wyd; CBPM: Lubin, Polska, 1996; Volume 6, pp. 916–1187. [Google Scholar]
- Miczkowski, Z.; Czernecki, J. Influence of the size of the suspension furnace sludge bath on the amount of dust removed. Ores Metals 2007, 52, 172–175. [Google Scholar]
- Jylhä, P.; Jokilaakso, A. CFD-DEM modelling of matte droplet behaviour in a flash smelting settler. Heliyon 2023, 9, 1–16. [Google Scholar] [CrossRef] [PubMed]
- Wypartowicz, J.; Łędzki, A. Metallurgy of non ferrous metals. Lecture 3, AGH Cracow, Poland, pp. 1–37. Available online: http://home.agh.edu.pl/~zmsz/pl/pliki/mmn/MMN_W03_MIEDZ2.pdf (accessed on 6 March 2014).
- Ma, Z.; Turan, A.; Guo, S. Practical numerical simulations of two-phase flow and heat transfer phenomena in a thermosyphon for design and development. Comput. Sci. 2009, 5544, 665–674. [Google Scholar]
- White, M.; Haywood, D.; Ranasinghe, D.J.; Chen, S. The development and application of a model of copper flash smelting. In Proceedings of the Eleventh International Conference on CFD in the Minerals and Process Industries, Melbourne, Australia, 7–9 December 2015; pp. 1–7. [Google Scholar]
- Miettinen, E. From Experimental Studies to Practical Innovations in Flash Smelting. In Proceedings of the International Process Metallurgy Symposium, Aalto, Finland, 31 October–1 November 2017; pp. 175–186. [Google Scholar]


Disclaimer/Publisher’s Note: The statements, opinions and data contained in all publications are solely those of the individual author(s) and contributor(s) and not of MDPI and/or the editor(s). MDPI and/or the editor(s) disclaim responsibility for any injury to people or property resulting from any ideas, methods, instructions or products referred to in the content. |
© 2024 by the author. Licensee MDPI, Basel, Switzerland. This article is an open access article distributed under the terms and conditions of the Creative Commons Attribution (CC BY) license (https://creativecommons.org/licenses/by/4.0/).