Abstract
Classical active thermographic testing of industrial goods has mostly been limited to generating 2D defect maps. While for surface or near-surface defect detection, this is a desired result, for deeply buried defects, a 3D reconstruction of the defect geometry is coveted. This general trend can also be well observed in widely used NDT methods (radiography, ultrasonic testing), where the progression from 2D to 3D reconstruction methods has already made profound progress (CT, UT phased array transducers). Achieving a fully 3D defect reconstruction in active thermographic testing suffers from the diffusive nature of thermal processes. One possible solution to deal with thermal diffusion is the application of the virtual-wave concept, which, by solving an inverse problem, allows the diffusiveness to be extracted from the thermographic data in the post-processing stage. What is left follows propagating-wave physics, enabling the usage of well-known algorithms from ultrasonic testing. In this work, we present our progress in the 3D reconstruction of deeply buried defects using spatially structured laser heating in conjunction with applying the well-known total focusing method (TFM) in the virtual-wave domain.
1. Introduction
Active thermographic testing, as a non-destructive testing method, being non-contact and covering large areas at a reasonable speed, offers a unique set of advantages over other non-destructive testing methods. However, one of its main drawbacks is the diffusive nature of thermal processes, which makes it difficult to detect and reconstruct deeply buried defects. Furthermore, in its application highly ill-posed inverse problems arise, as usually the object under test (OuT) can only be excited at its surfaces, and the temperature response is measured at the surface as well. Achieving a fully 3D tomographic reconstruction of defects—a much sought-after result—is therefore a challenging task for active thermographic testing. In this work, we present our progress towards achieving this goal by combining multiple spatially structured laser heatings with the total focusing method (TFM), known from ultrasonic testing in the virtual wave domain.
2. Methodology
Burgholzer et al. [1] developed a virtual wave concept that connects the diffusive heat equation with the propagating wave equation for ultrasound waves. The result is a Fredholm integral relationship that allows the computation of the virtual wave field based on a known temperature distribution . The formal equation is given by
with being the position vector and and being the different time scales in the time and virtual wave domains. The kernel transforms between both domains and contains the thermal diffusivity and the virtual speed of sound as parameters. The corresponding discretized version of Equation (1) for two spatial dimensions and is , where is the observed temperature data, is the discretized kernel, and is the virtual wave field. The entries of the discrete kernel can be calculated with
Here , and are the increments of the time, virtual time, and depth vector. The kernel is highly rank deficient, which makes solving for non-trivial. To solve this ill-posed inverse problem, we apply the alternating direction method of multipliers (ADMM) [2]. The minimization problem version of the discretized problem is given by [3] (Chapter 6.4) as
Since an ultrasound field is naturally very sparse, it makes sense to incorporate sparsity as an additional constraint into the minimization problem. The sparsity of the solution is achieved by the -norm of and controlled by the parameter , which has to be determined empirically.
3. Total Focusing Method
The total focusing method (TFM) is a well-established image reconstruction technique for ultrasonic testing [4]. Combined with an full matrix capture (FMC) experimental approach, the method relies on taking multiple measurements of the same OuT with different transmitter positions for each measurement while recording the response using multiple receivers. The transfer to an application within thermographic testing is very natural, as an infrared camera usually records a large region of interest (ROI) at all times, providing a high phase-coherent receiver count. Hence, only a change in the structure of the excitation is necessary for TFM application. This can be facilitated by step-scanning with a single laser spot of any shape [5] or using a full-scale light modulator [6]. Enough cooling time between excitations is necessary to guarantee sufficient independence of all measurements. Given two-dimensional virtual wave fields , we can compute the TFM reconstruction result using the following equation:
where is the location of a volume element within the discretized OuT, is the location of the -th receiver, and is the location of the -th transmitter. describes the travel time of the virtual wave from the transmitter via the volume element at to the receiver .
Using a Euclidean distance function between two points and the virtual wave speed , the travel time of the virtual wave can be determined as
4. Experimental Setup
The experimental setup is shown in Figure 1. Here, an OuT is examined that has been additively manufactured from stainless steel (316L, 1.4404, ) and features a height and width of and a thickness of . It contains four defect pairs ( rectangular channels) where the gaps between the two defects of each pair each double from . The OuT is symmetric in the -direction as the channels run through the whole width. On this OuT, line excitations for at have been performed, using a laser line with a width of and a step-over of in the -direction. The resulting temperature response has been measured using an MWIR cooled infrared camera with a pixel resolution of in reflection configuration. Because of the symmetry of the OuT, the ROI is limited to a -wide strip across the -direction.
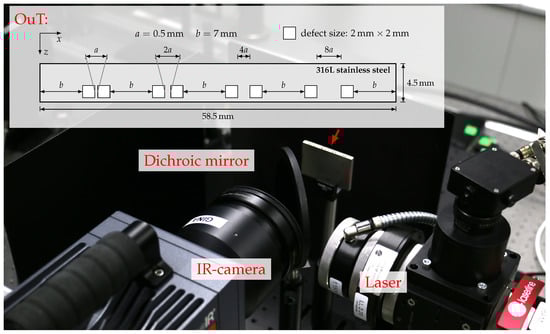
Figure 1.
Experimental setup: An OuT containing continuous rectangular channels (defects) is excited using a laser line and a dichroic mirror, while an infrared camera records its temperature response.
A dichroic mirror is used to compact the setup and avoid perspective distortion. The OuT is allowed to cool for between consecutive measurements.
5. Results and Discussion
Calculating the resulting virtual wave fields for all measurements, using a virtual speed of sound of , and at a depth discretization of , leads to the result shown in Figure 2a.
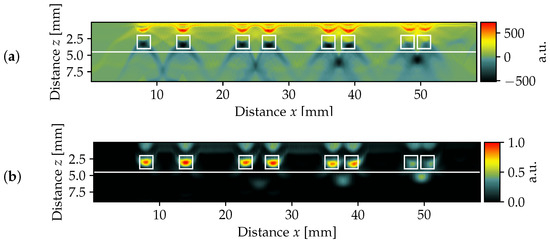
Figure 2.
(a) Sum of all virtual wave transformations, using , , and . (b) TFM reconstruction of the OuT. A single slice through the middle of the ROI is shown. The white line indicates the back wall of the OuT.
Here, the sum of all virtual wave fields is displayed. The white line indicates the back wall of the OuT at . In total, depths up to two times the thickness of the OuT have been reconstructed. The result already shows a clear indication of the defects and the wakes in the virtual wave field introduced by them. This mostly affects the area below the defects and directly above them.
Applying the afore-described TFM procedure to the virtual wave fields, making full use of all three spatial dimensions, leads to the result shown in Figure 2b. Here, a single slice through the middle of the ROI is shown. Compared to the result of the virtual wave transformation, the defect contrast has clearly improved, and defects are clearly visible. The defect wakes are somewhat suppressed, but the remains are still visible. Even the smallest defect pair, with a gap of at a depth of , can be differentiated using this technique.
6. Outlook
The presented results are very promising and show that the combination of multiple measurements with spatially structured laser heating and the application of the TFM in the virtual wave domain is a feasible method for 3D defect reconstruction. Additional measurements using round-laser-spot step-scanning on an OuT with a more complex defect geometry also reinforce this assumption. Due to the limited scope of this manuscript, a more detailed overview is to be published in a follow-up publication.
Author Contributions
Conceptualization, J.L., C.H. and M.Z.; methodology, L.R., J.L. and C.H.; software, L.R. and J.L.; resources, M.Z.; data curation, L.R. and J.L.; writing—original draft preparation, J.L.; writing—review and editing, all; visualization, J.L. and L.R. All authors have read and agreed to the published version of the manuscript.
Funding
This research received no external funding.
Institutional Review Board Statement
Not applicable.
Informed Consent Statement
Not applicable.
Data Availability Statement
The raw data supporting the conclusions of this article will be made available by the authors on request.
Conflicts of Interest
The authors declare no conflicts of interest.
References
- Burgholzer, P.; Thor, M.; Gruber, J.; Mayr, G. Three-dimensional thermographic imaging using a virtual wave concept. J. Appl. Phys. 2017, 121, 105102. [Google Scholar] [CrossRef]
- Thummerer, G.; Mayr, G.; Haltmeier, M.; Burgholzer, P. Photoacoustic reconstruction from photothermal measurements including prior information. Photoacoustics 2020, 19, 100175. [Google Scholar] [CrossRef] [PubMed]
- Boyd, S. Distributed Optimization and Statistical Learning via the Alternating Direction Method of Multipliers. Found. Trends Mach. Learn. 2010, 3, 1–122. [Google Scholar] [CrossRef]
- Holmes, C.; Drinkwater, B.W.; Wilcox, P.D. Post-processing of the full matrix of ultrasonic transmit–receive array data for non-destructive evaluation. NDT E Int. 2005, 38, 701–711. [Google Scholar] [CrossRef]
- Sobczak, M.; Machynia, A.; Dworakowski, Z.; Roemer, J. Experimental Setup for Nondestructive Testing of Composite Structures Using Laser Spot Thermography. In Advances in Technical Diagnostics II; Springer Nature: Cham, Switzerland, 2023; pp. 75–84. [Google Scholar] [CrossRef]
- Lecompagnon, J.; Hirsch, P.D.; Rupprecht, C.; Ziegler, M. Nondestructive thermographic detection of internal defects using pixel-pattern based laser excitation and photothermal super resolution reconstruction. Sci. Rep. 2023, 13, 3416. [Google Scholar] [CrossRef] [PubMed]


Disclaimer/Publisher’s Note: The statements, opinions and data contained in all publications are solely those of the individual author(s) and contributor(s) and not of MDPI and/or the editor(s). MDPI and/or the editor(s) disclaim responsibility for any injury to people or property resulting from any ideas, methods, instructions or products referred to in the content. |
© 2025 by the authors. Licensee MDPI, Basel, Switzerland. This article is an open access article distributed under the terms and conditions of the Creative Commons Attribution (CC BY) license (https://creativecommons.org/licenses/by/4.0/).