Abstract
Azar oil field is located to the east of the city of Mehran, Ilam. The tank of this oil field is shared by Iraq’s oil field whose name is Badra where oil extraction started in 2014, and they have maximized its oil exploration since 2017. Iran started oil exploration in 2017. In this study, we estimated the land surface deformation in Azar oil field using persistent scattering interferometry (PSI) in order to determine the corresponding subsidence source. PSI is a method of time series analysis used to measure various surface deformations. The Stanford Method for Persistent Scatterers (StaMPS) package was employed to process 50 ascending Sentinel-1A satellite images collected between 2016 and 2019, and 50 descending Sentinel-1A satellite images were collected between 2014 and 2019 to extract horizontal and vertical displacement components from the Interferometric Synthetic Aperture Radar (InSAR) LOS (line-of-sight) displacement. The results showed that the maximum displacement rate in the Iran-Iraq joint oil field between 2016 and 2019 was 15 mm in the vertical direction. Moreover, the maximum displacement rate measured in the horizontal direction was 30 mm. The vertical deformation confirms typical patterns of subsidence caused by oil extraction, and the horizontal deformation occurred due to considerable precipitation events after a drought period, as well as the presence of sand layers at different depths of the earth.
1. Introduction
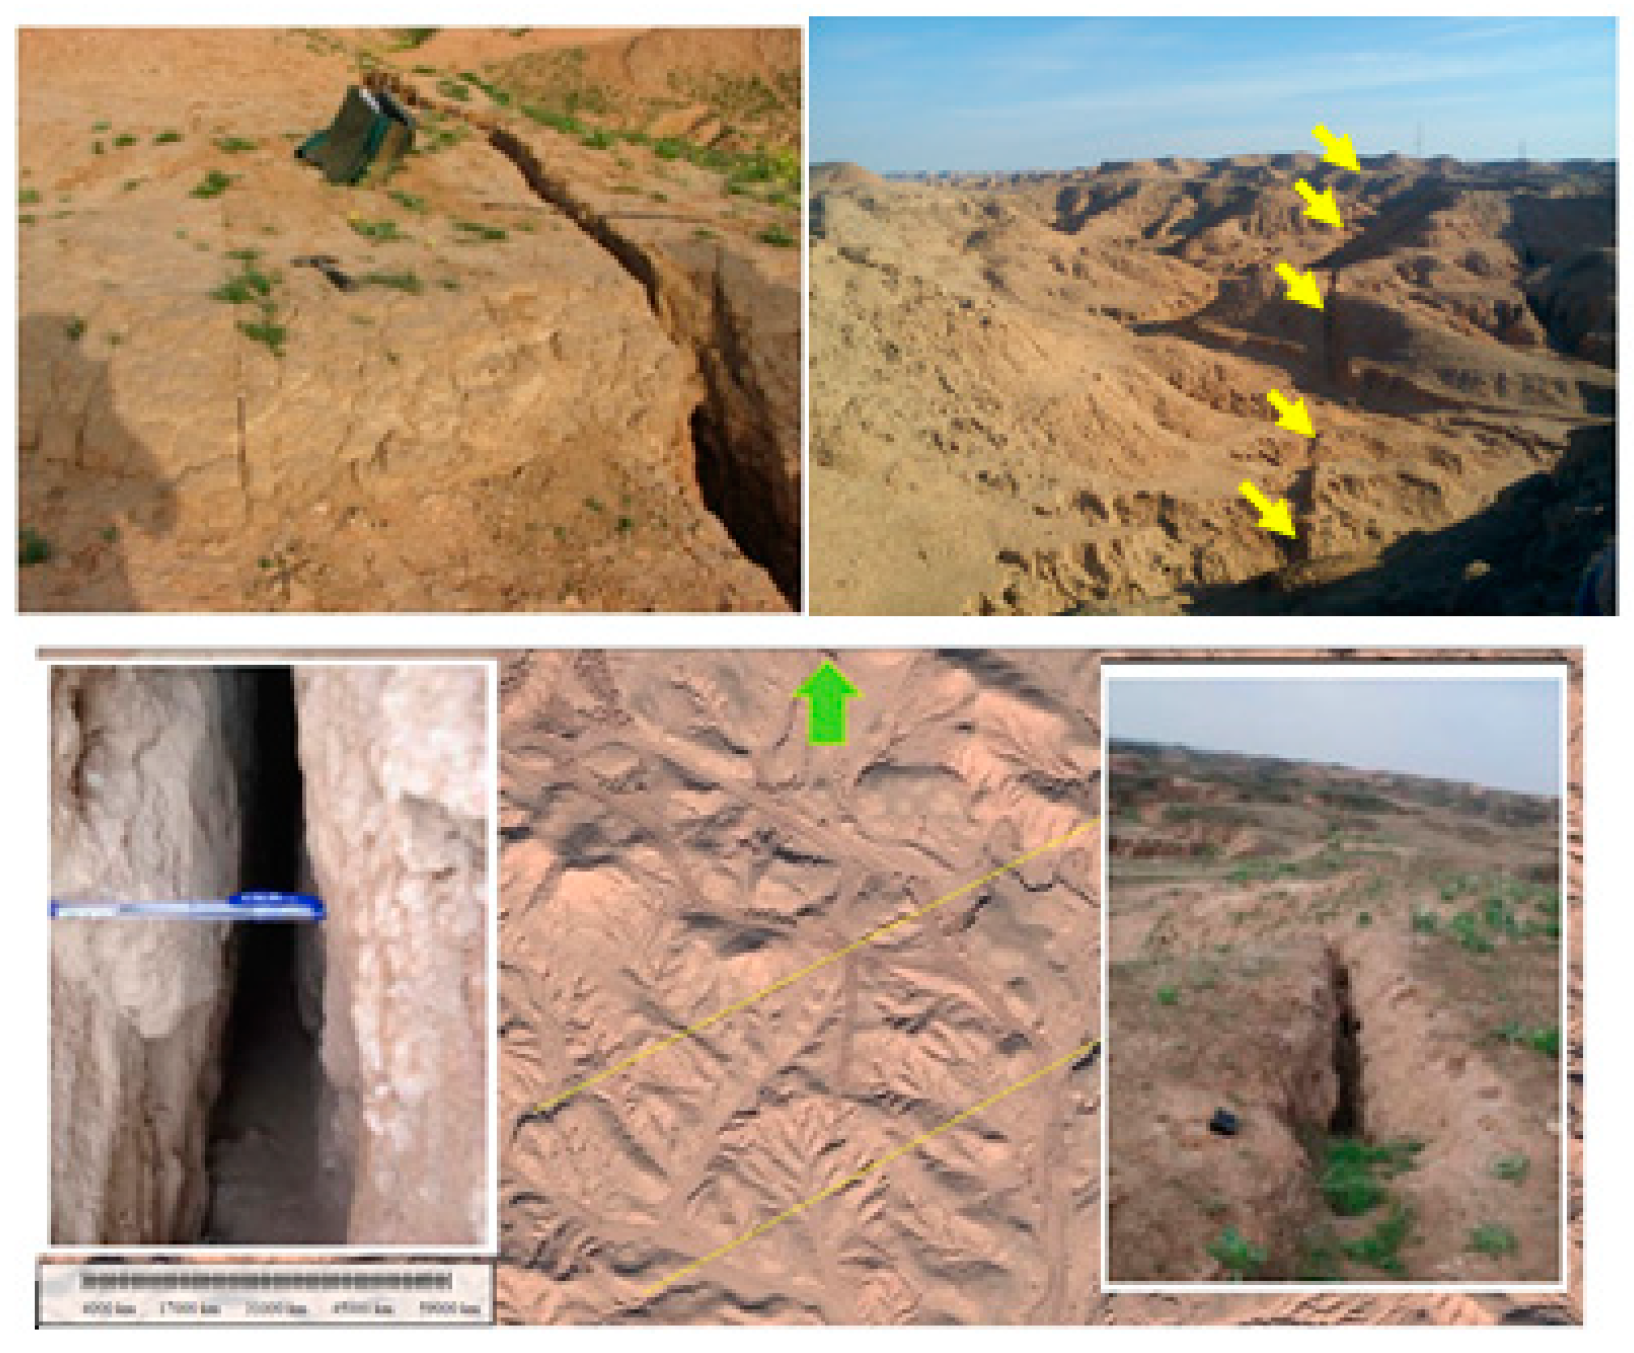
Land surface deformation has occurred in the Azar oil field. Between 2007 and 2011, the region observed sharp decreases in precipitation, but dramatic increases in precipitation occurred in the period between 2011 and 2013. The region’s soil, regarded to be of a weak type, is categorized as sandstone according to the international categorization. Since 2013, some cracks have formed, which despite modifications still persist. Figure 1 shows some typical cracks in this region.

Figure 1.
Sample of cracks observed in Azar oil field.
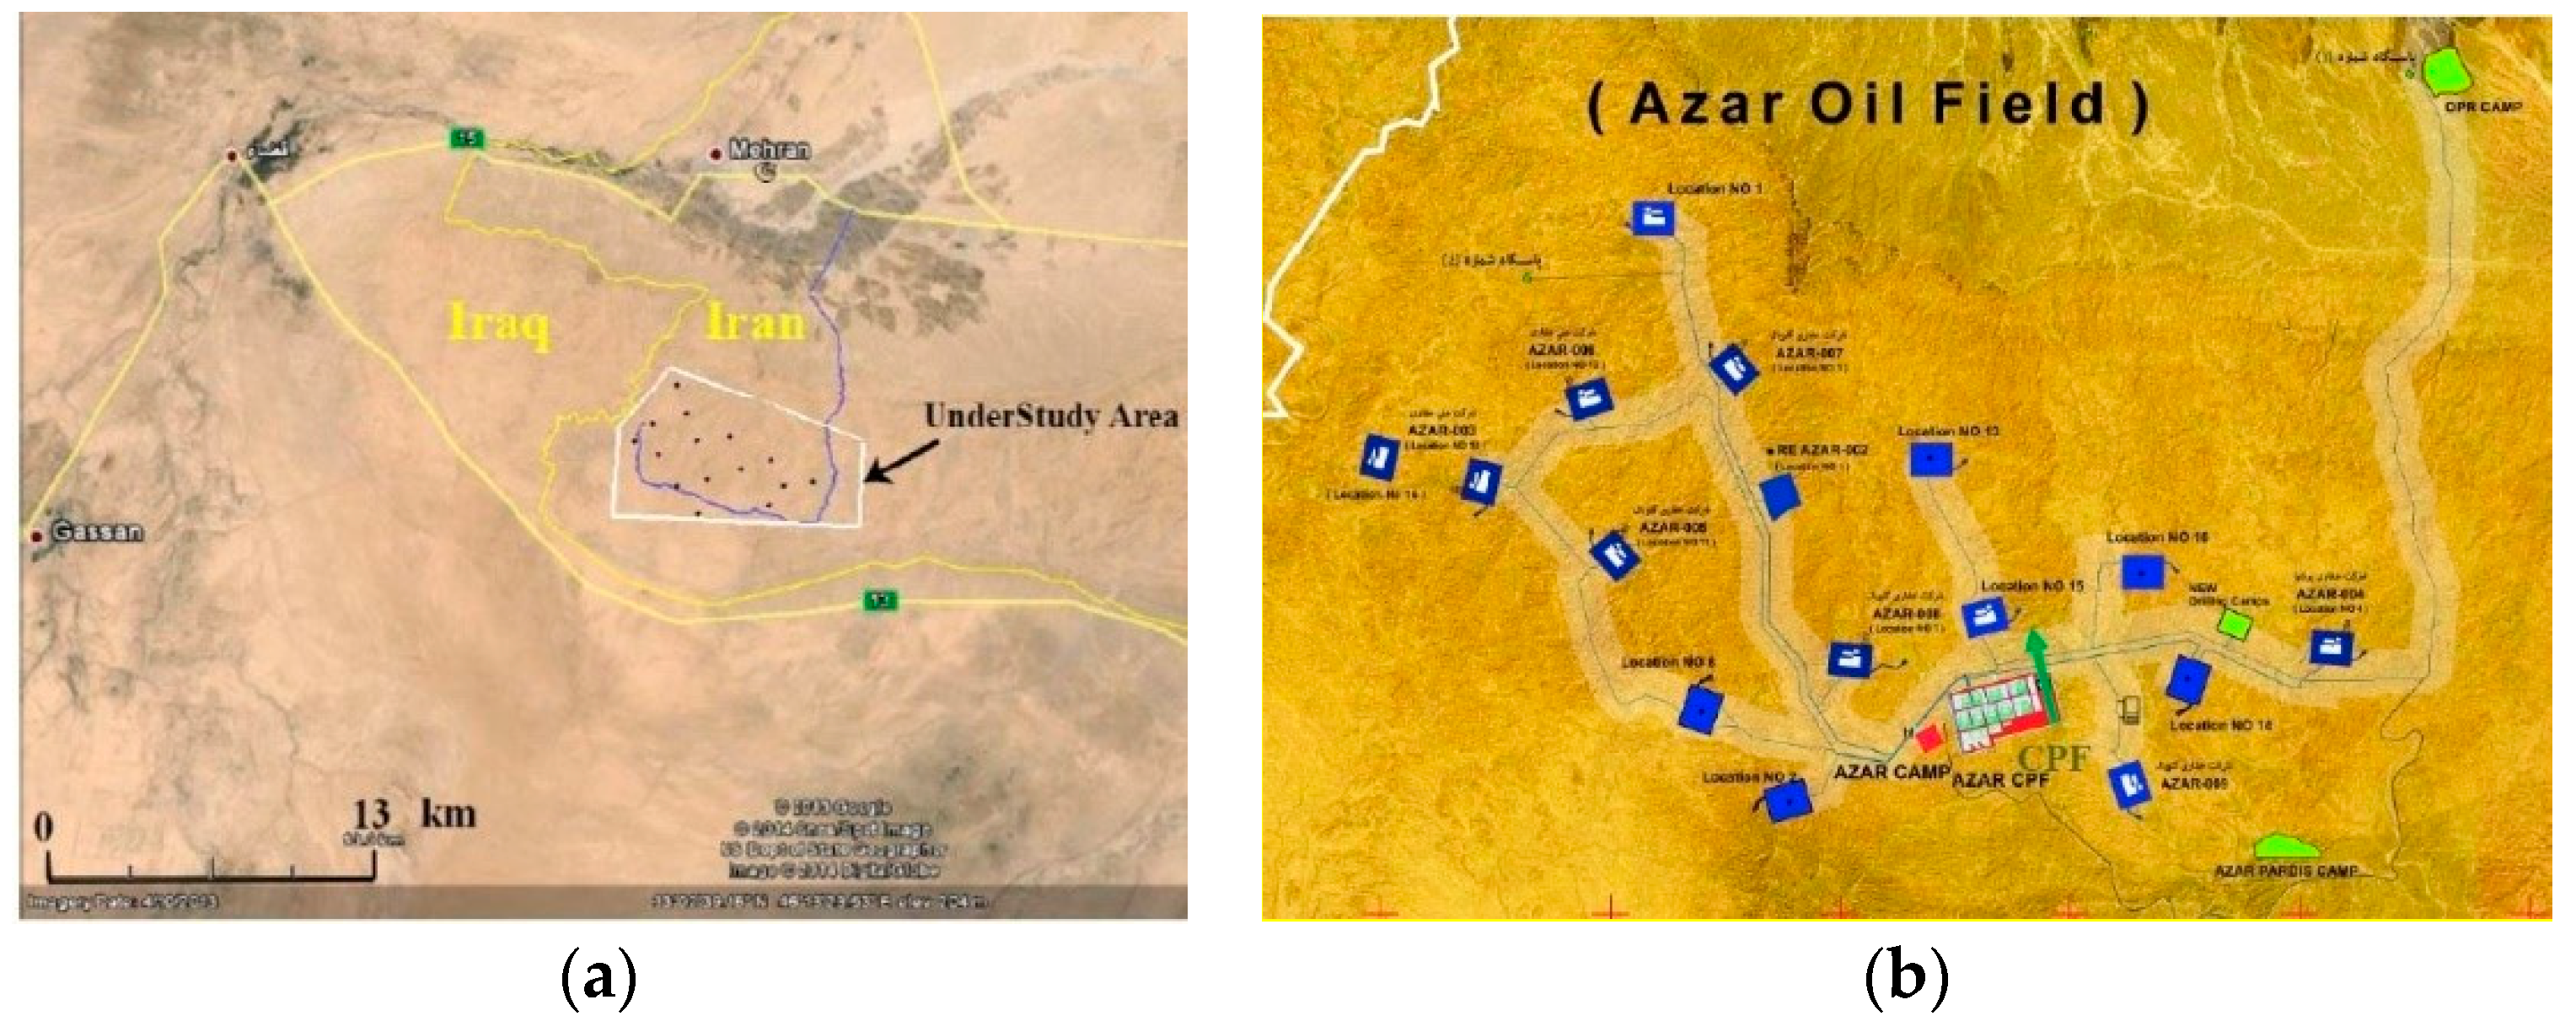
Once the cracks formed, in order to monitor the region, a notable number of studies of different types, such as geotechnical, hydrological, meteorological, seismic, and geophysical, were conducted. Drilling from Iraq’s petroleum tank began in 2014, and Iran started to drill in 2017. The oil in this reservoir is worth around four billion liters, and there are plans to drill the whole amount within a 20-year period. The length of this tank is 36 km in the northeast, southwest direction, 13.5 km of which is located in Iran, and it extends along a width of 30 km. Figure 2 shows Azar oil field, alongside 15 wells. Figure 3, in turn, displays the cracks formed in the region.
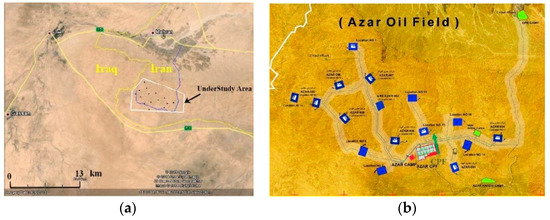
Figure 2.
(a) The white polygon is Azar oil field and the blue line shows access roads to Azar oil field; (b) Sites and wells in this area.
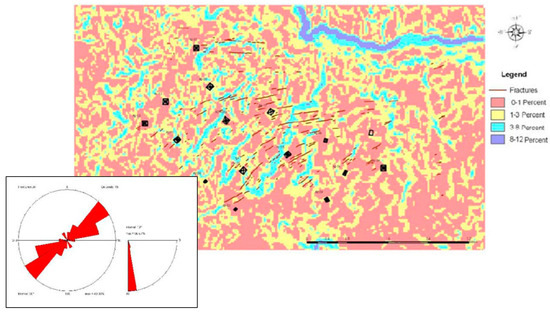
Figure 3.
Slope plan of the oil field and the distribution and direction of cracks in this area.
The azimuth direction of the cracks is between N45E to N85E, and most of the azimuth direction of cracks is N60–65E and N75–85E. Our goal in this article is to derive the temporal pattern of land deformation in this region using additional Synthetic Aperture Radar (SAR) data. C-band data from Copernicus missions Sentinel-1A have some attractive properties, such as large volumes of archived imagery, larger coverage/swath, and importantly, from an application point of view, a free and open access data policy. We employed 50 descending Sentinel-1A satellite images that were collected between 2014 and 2019, as well as 50 ascending Sentinel-1A satellite images that were collected between 2016 and 2019.
The InSAR method provides an all-weather, day-or-night capability to map ground deformations from human activities or various natural causes, such as volcano dynamics, earthquakes, slope instability, groundwater overexploitation, mining, and coastland reclamation [1,2,3,4,5,6,7]. Any factor that can affect the phase of the backscattered radar signal can affect the deformation pattern. These measurements include surface displacements, land changes, land subsidence/uplift, water levels, soil moisture, snow accumulation, the volume of forest cover, etc. Therefore, InSAR has found very broad applications in the field of earth and environmental sciences [8].
Land surface deformation leads to widespread damage to oil and drilling rigs, roads, and infrastructures. Knowledge of the spatial and temporal extent of land settlement provides important information for establishing effective measures necessary to mitigate losses from land subsidence hazards [9].
2. Experiments
The radar transmits a pulse to the earth and measures the return of the back-scattered pulses. The received pulses are digitized and make a raw complex data or a real aperture radar (RAR) image, with a very bad resolution in the flight direction because of physical length limitations of the radar antenna [10]. RAR images are subsequently focused by signal processing techniques so as to artificially make a long antenna and create a synthetic aperture radar (SAR) image with a much higher resolution. SAR images are sampled in an azimuth and range coordinate system, so every pixel has a unique range and azimuth coordinate. Single-look complex (SLC) data is a standard format of focused SAR images. The phase of SLC data can be written as a summation of four components as [10]:
where W{.} is the modulo-2 wrapping operator, is related to the distance between the radar sensor, the phase delay induced by the atmosphere, is related to the distribution of all scatterers within a resolution cell, and is the additional system or thermal noise, which is dependent on sensor specifications [1]. The phase difference between two SAR images that are acquired from different positions or at different times is called an interferogram. The interferogram is produced by complex conjugate multiplication of the two coregistered SLC images ( and ). The interferometric phase for a single pixel can be written as the summation of four components:
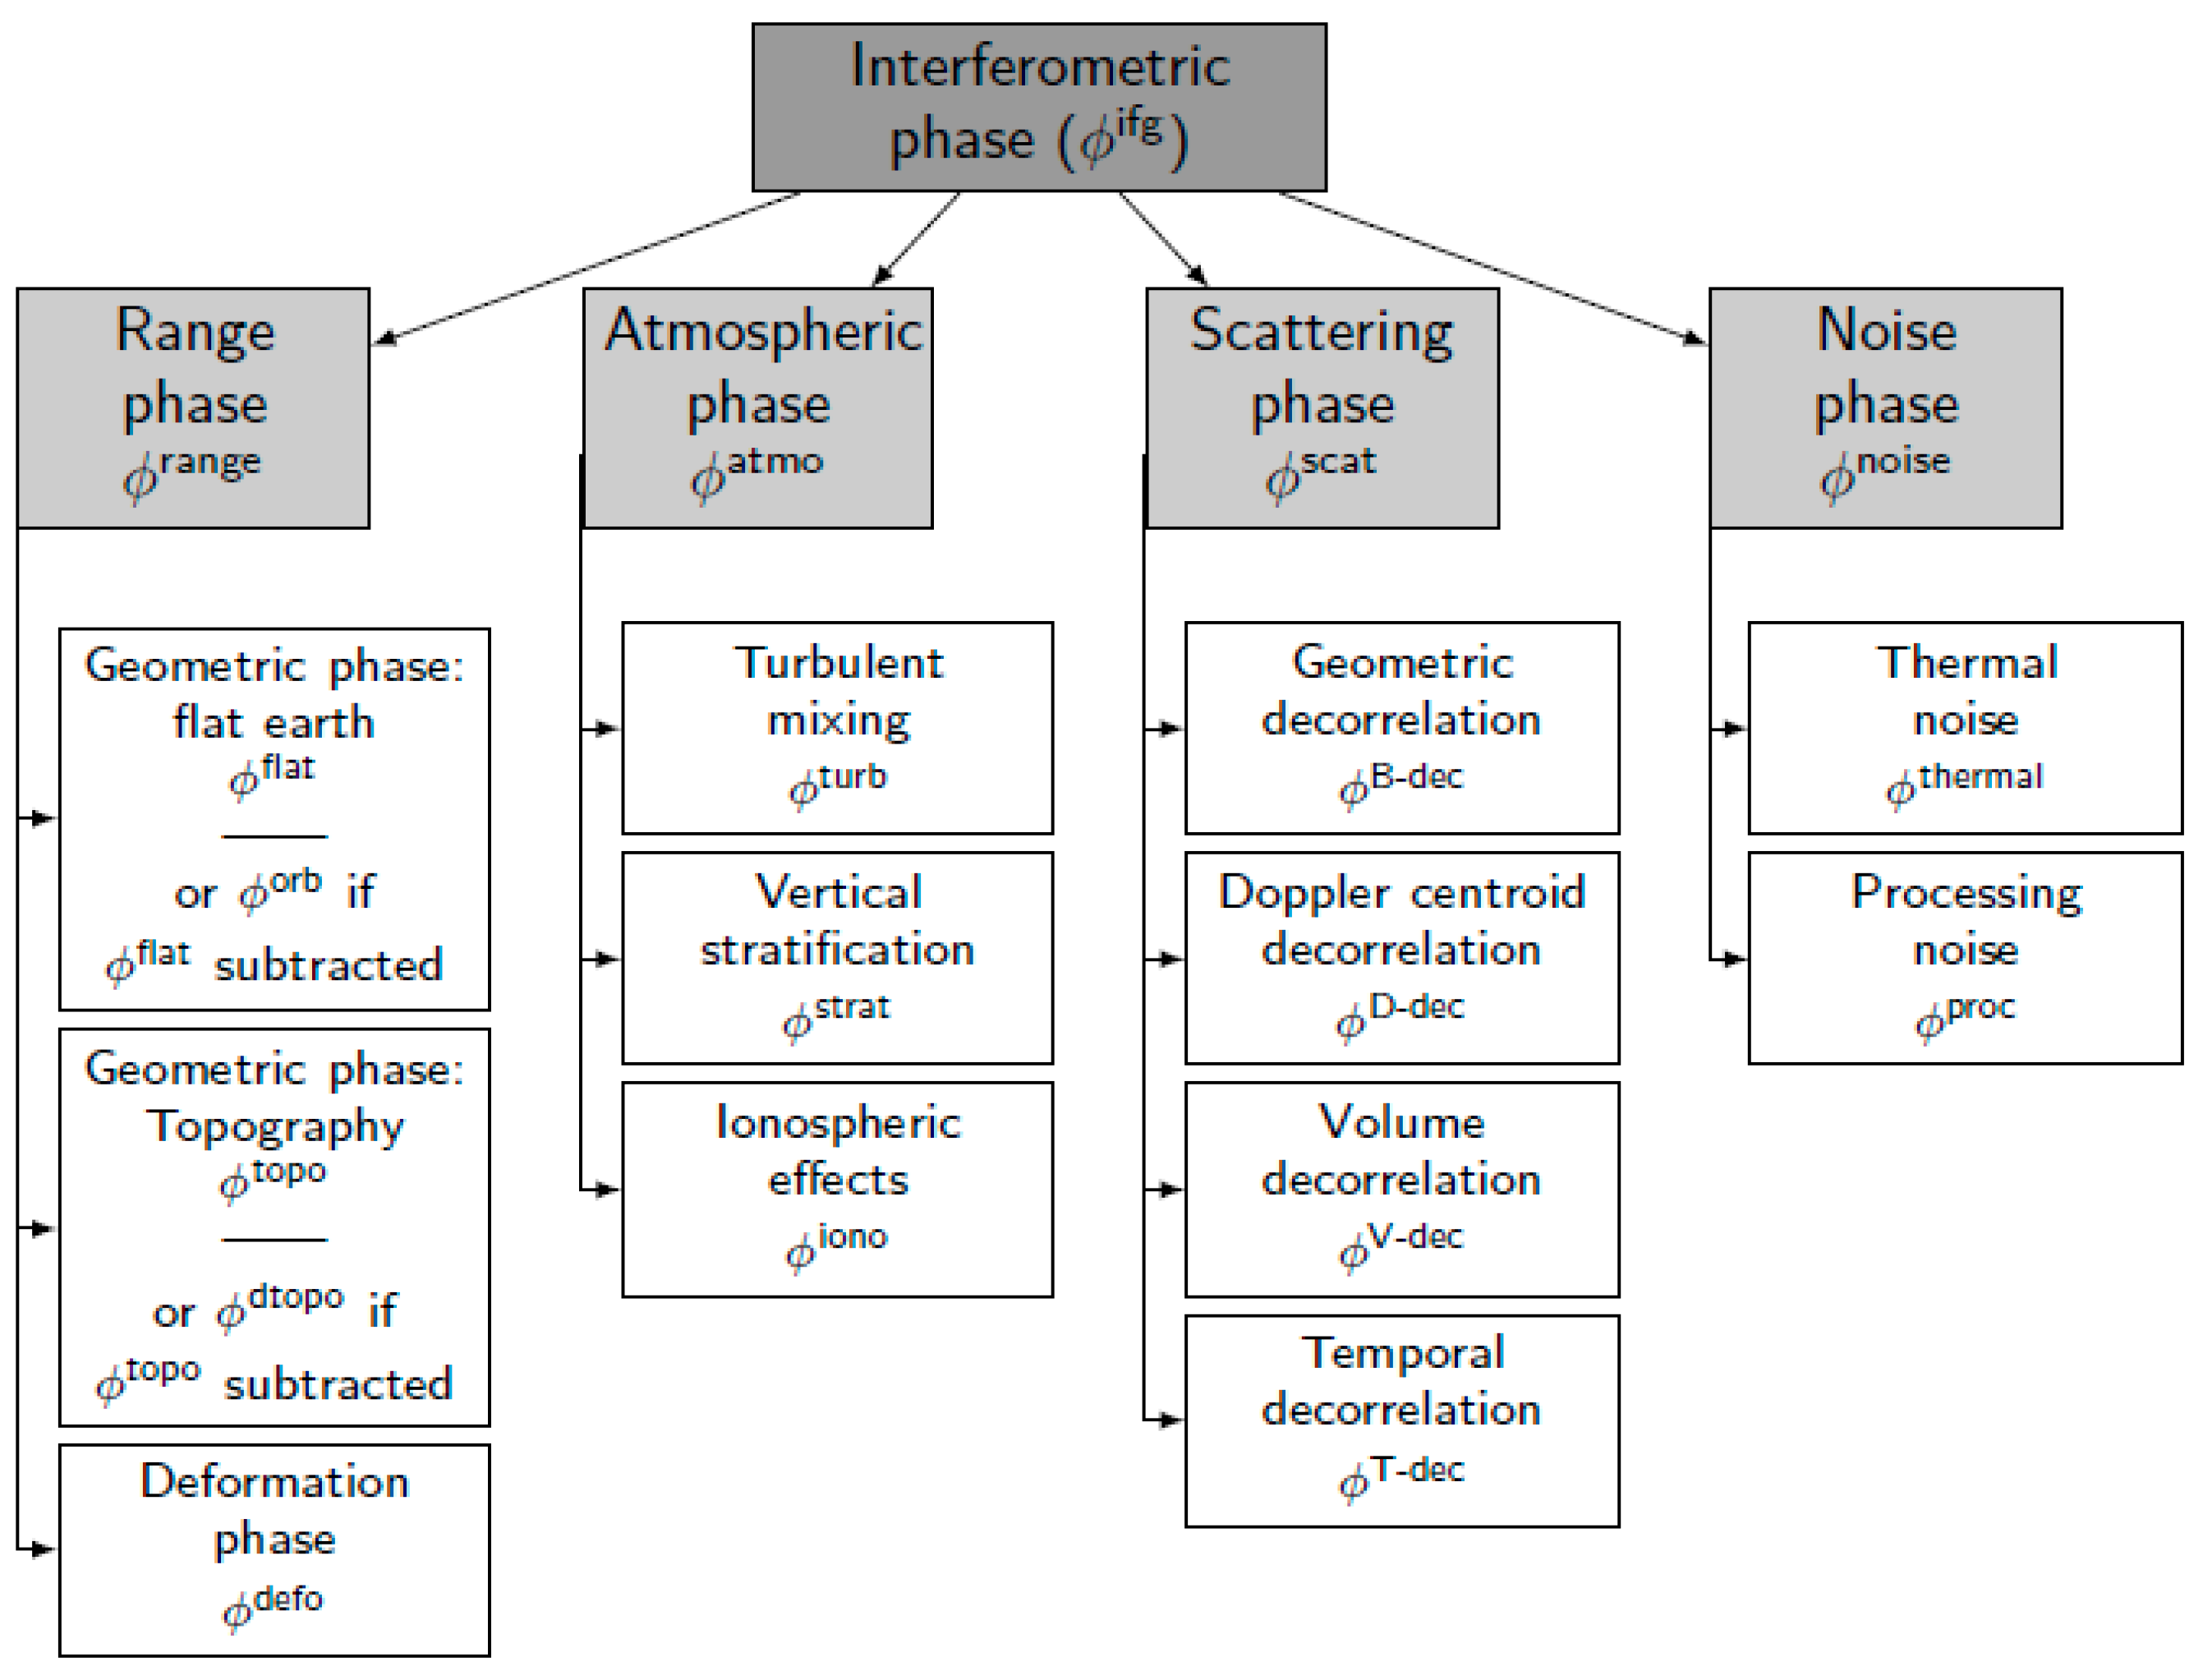
where is the phase of SLC data and is the differential phase between two SLC data. The phase component range, atmosphere scatter, and noise can be further decomposed into some components that are shown in Figure 4.
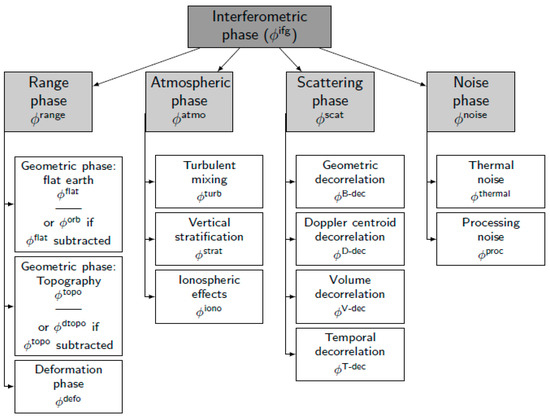
Figure 4.
Decomposition of interferometric phase [10].
In this study, we used the persistent scatterer interferometry (PSI) method, so we used single master (SM) interferometry. We coregistered master and slave images together in three steps. Then we produced 49 interferograms from 50 descending SLC images and 49 interferograms from 50 ascending SLC images. Flat earth and topographic phase were subtracted from every interferogram. We have carried out time series analysis in three main steps. We used the phase stability with respect to a predefined model in space to select PS-pixels. Pixel candidates were selected if their interferometric phases had a small deviation from their neighboring PS. After the selection of PS, 3D unwrapping was performed, and mitigation of atmospheric signal with high-pass filtering in time and low-pass filtering in space was conducted.
The dataset included 50 ascending images from June 2016 to February 2019, and 50 descending images covering October 2014 to February 2019, which are shown in Figure 5.
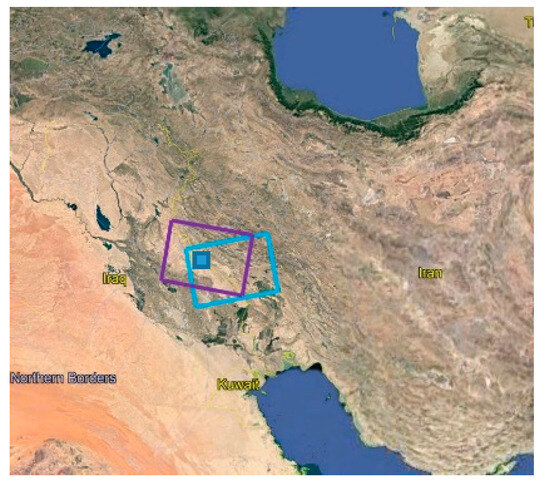
Figure 5.
Topography map of Mehran, Ilam. The boxes show satellite trajectories of radar images for descending orbits. The blue box is Azar oil field.
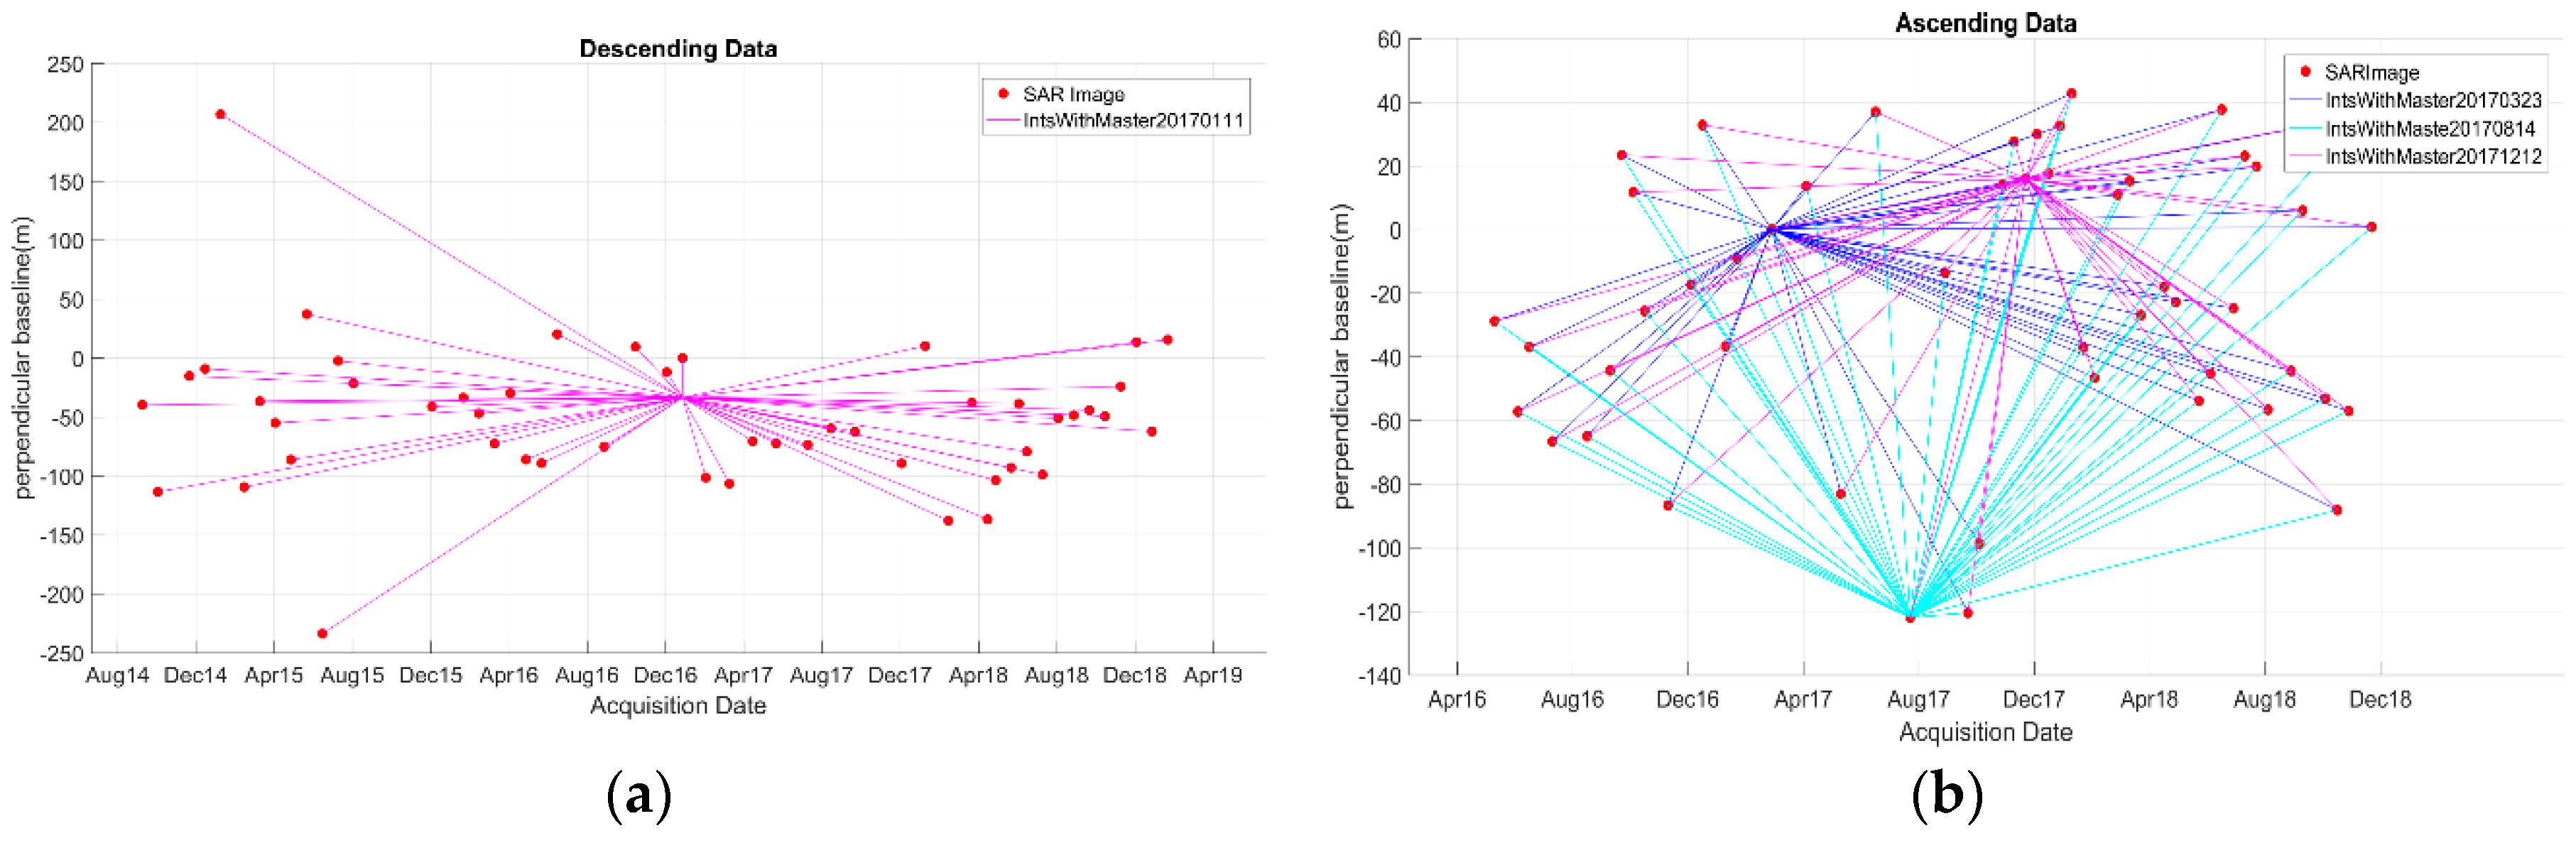
We produced interferograms with a single master. Interferometric combinations of the images were carried out with consideration of their spatial and temporal baselines. The overview of the baseline perpendicular plot of the images can be seen in Figure 6.
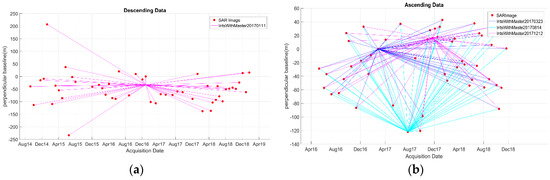
Figure 6.
Plots of acquisition dates versus perpendicular baselines for the final network of the (a) Sentinel-1 descending and (b) Sentinel-1 ascending data that were used for the time series analysis. The circles represent synthetic aperture radar (SAR) images, and the lines represent interferograms.
To make sure there was no unwrapping error, we generated ascending data interferograms with three masters. The results obtained from all these masters were almost the same, so there was no unwrapping error. The difference between deformation signals shown in ascending and descending processing is because of deformations in a horizontal direction.
3. Results
Deformation velocity maps in the Iran-Iraq joint oil field and Azar oil field are shown in Figure 7.
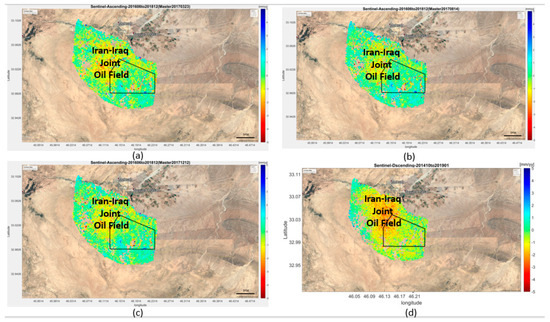
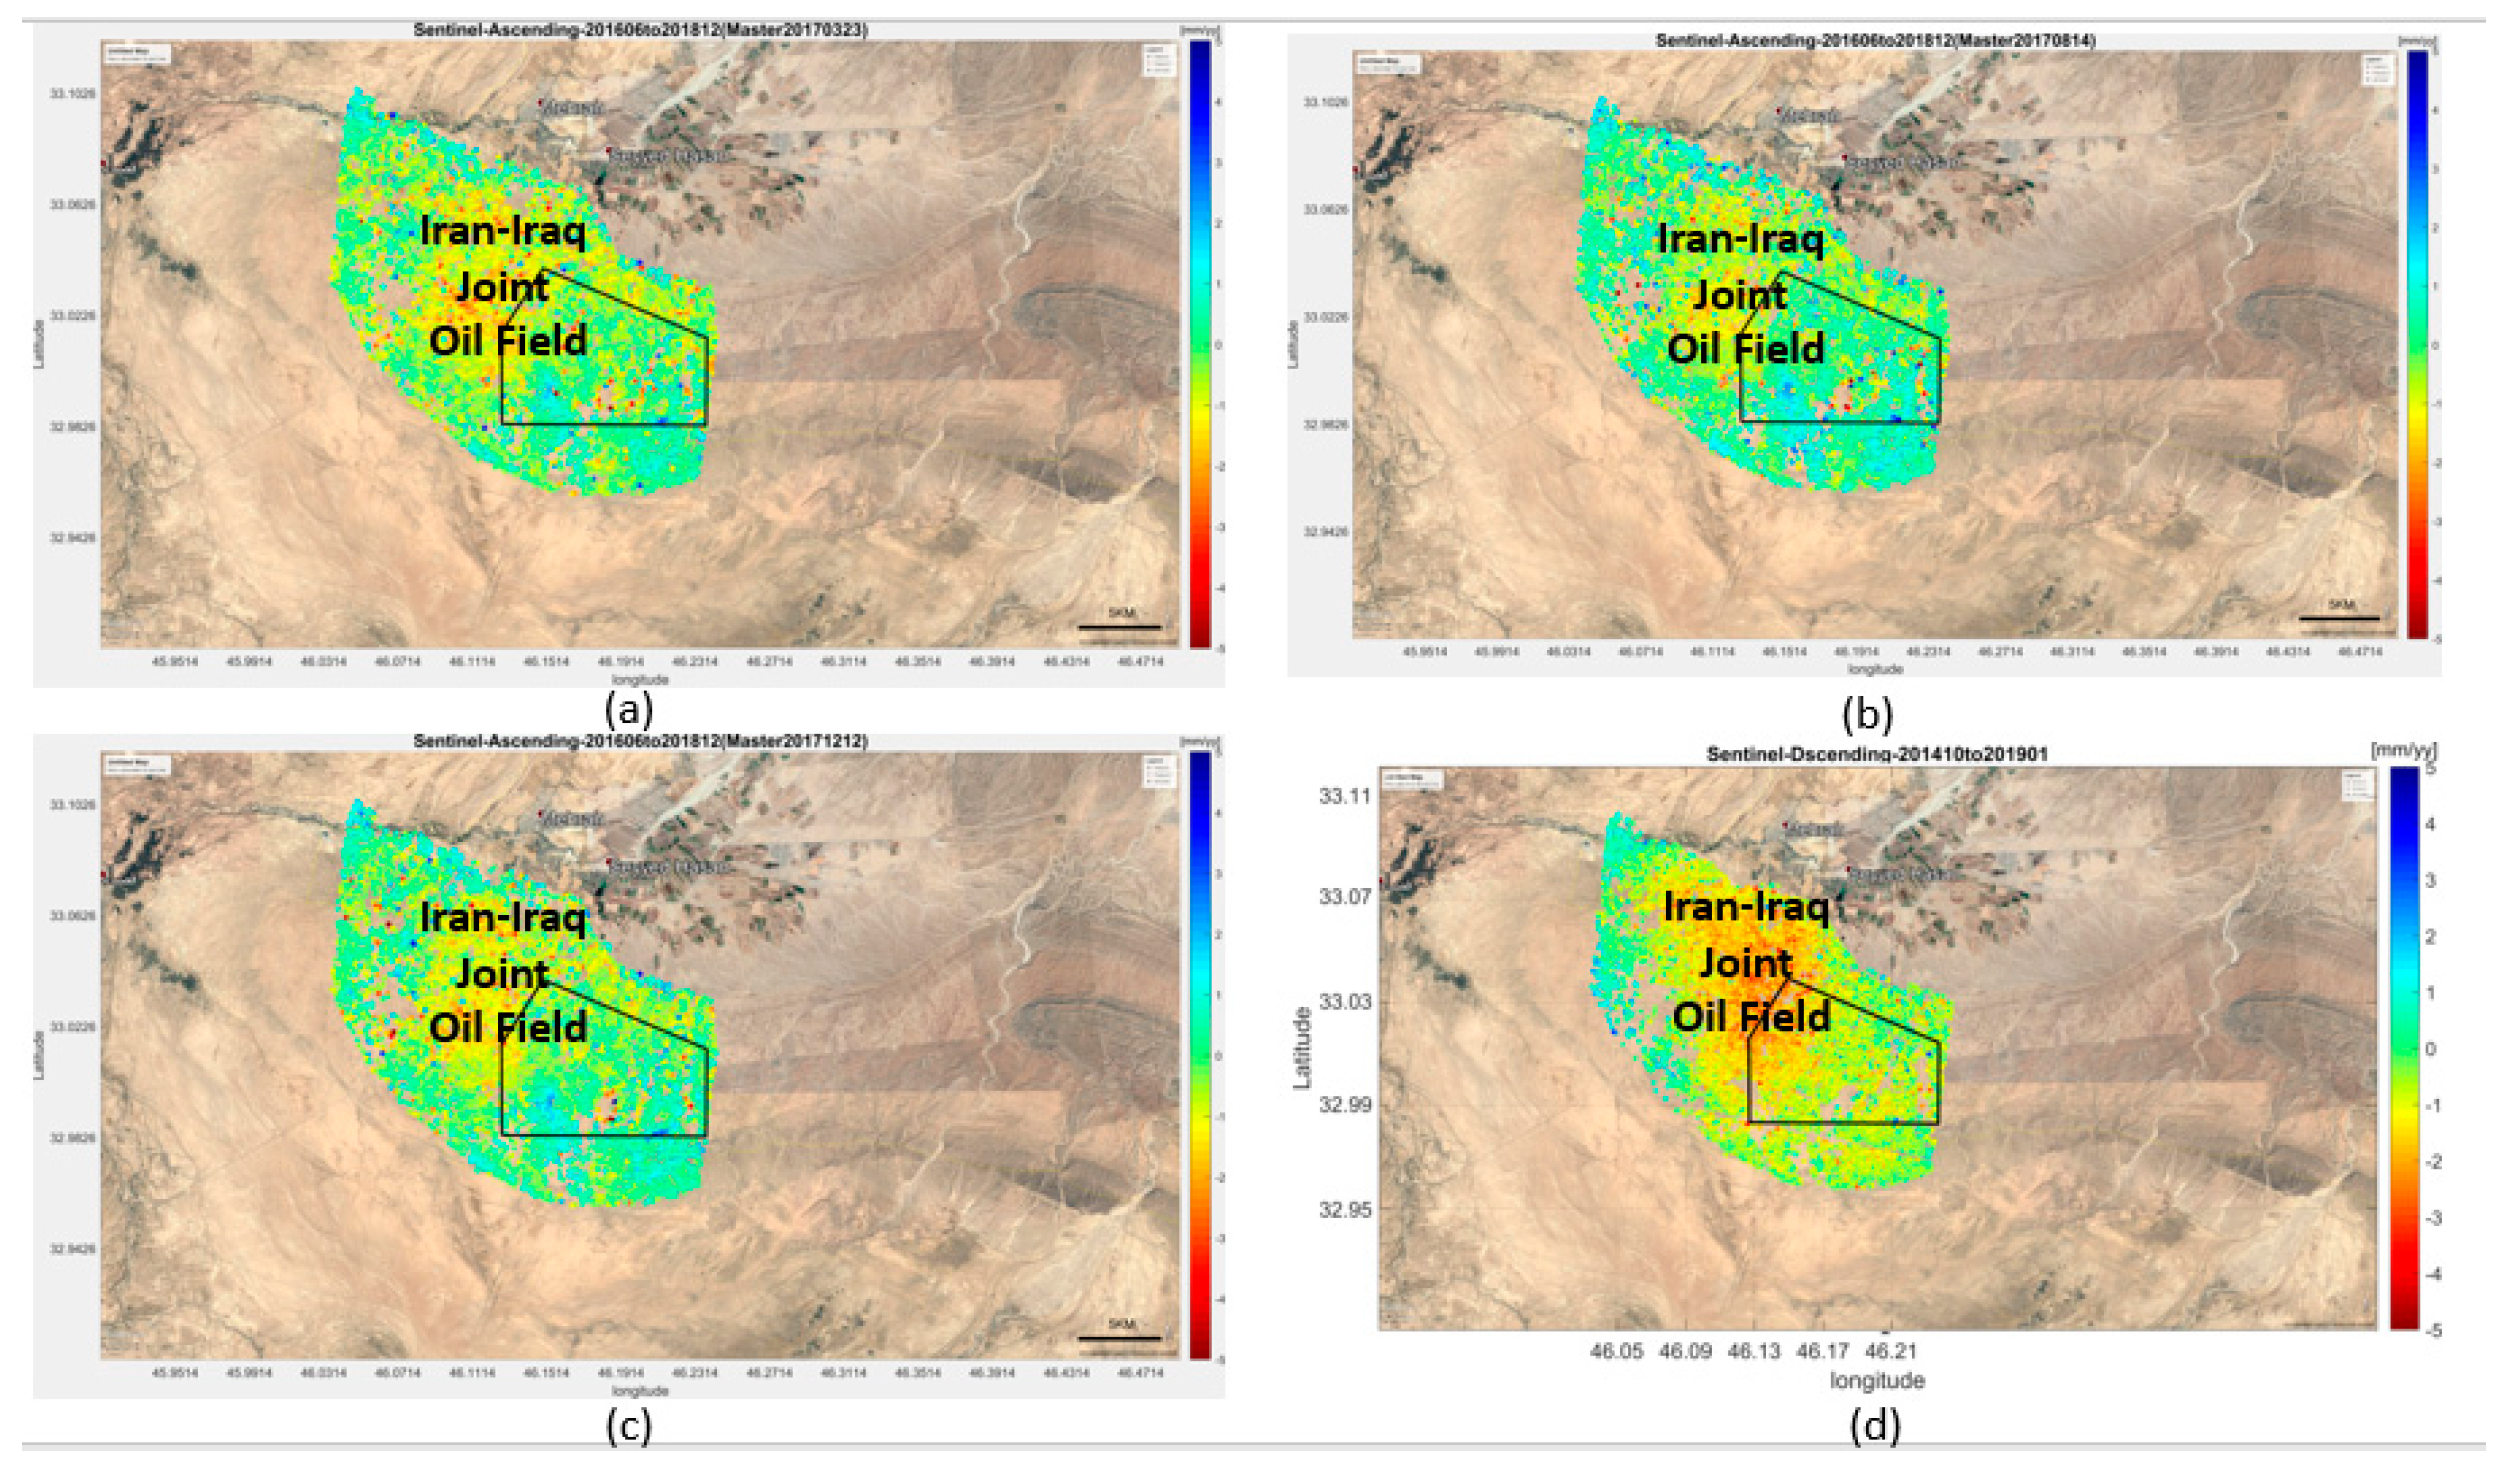
Figure 7.
Deformation velocity map with the reference point (46.22, 33.02) for (a) S1 ascending with master 20170323, (b) S1 ascending with master 20170814, (c) S1 ascending with master 20171212, and (d) S1 descending with master 2017011. The polygon is Azar oil field.
As can be seen in Figure 7, displacement is observed in the ascending data velocity map between 2016 and 2019, and in descending data between 2014 and 2019. Owing to droughts during some years and subsequent precipitation events, as well as the region’s soil type and oil drilling, a displacement of 5 mm per year can be seen. The cumulative displacement diagram for this period is presented below (Figure 8).
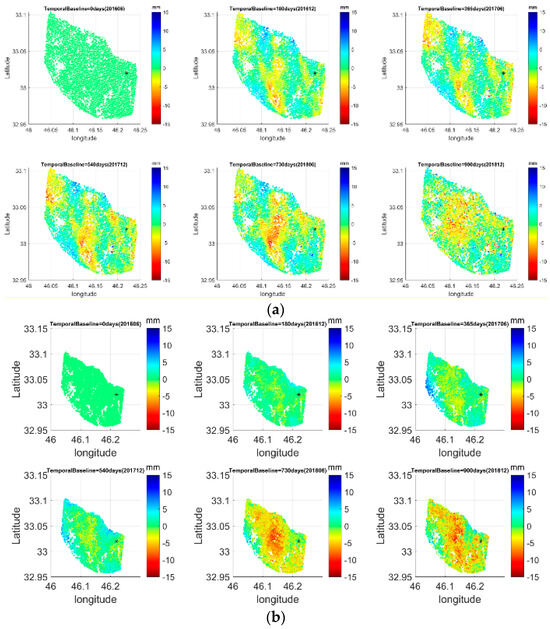
Figure 8.
Cumulative displacement of Azar oil field obtained from June 2016 to December 2018 every six months: (a) ascending Sentinel-1 (b) descending Sentinel-1.
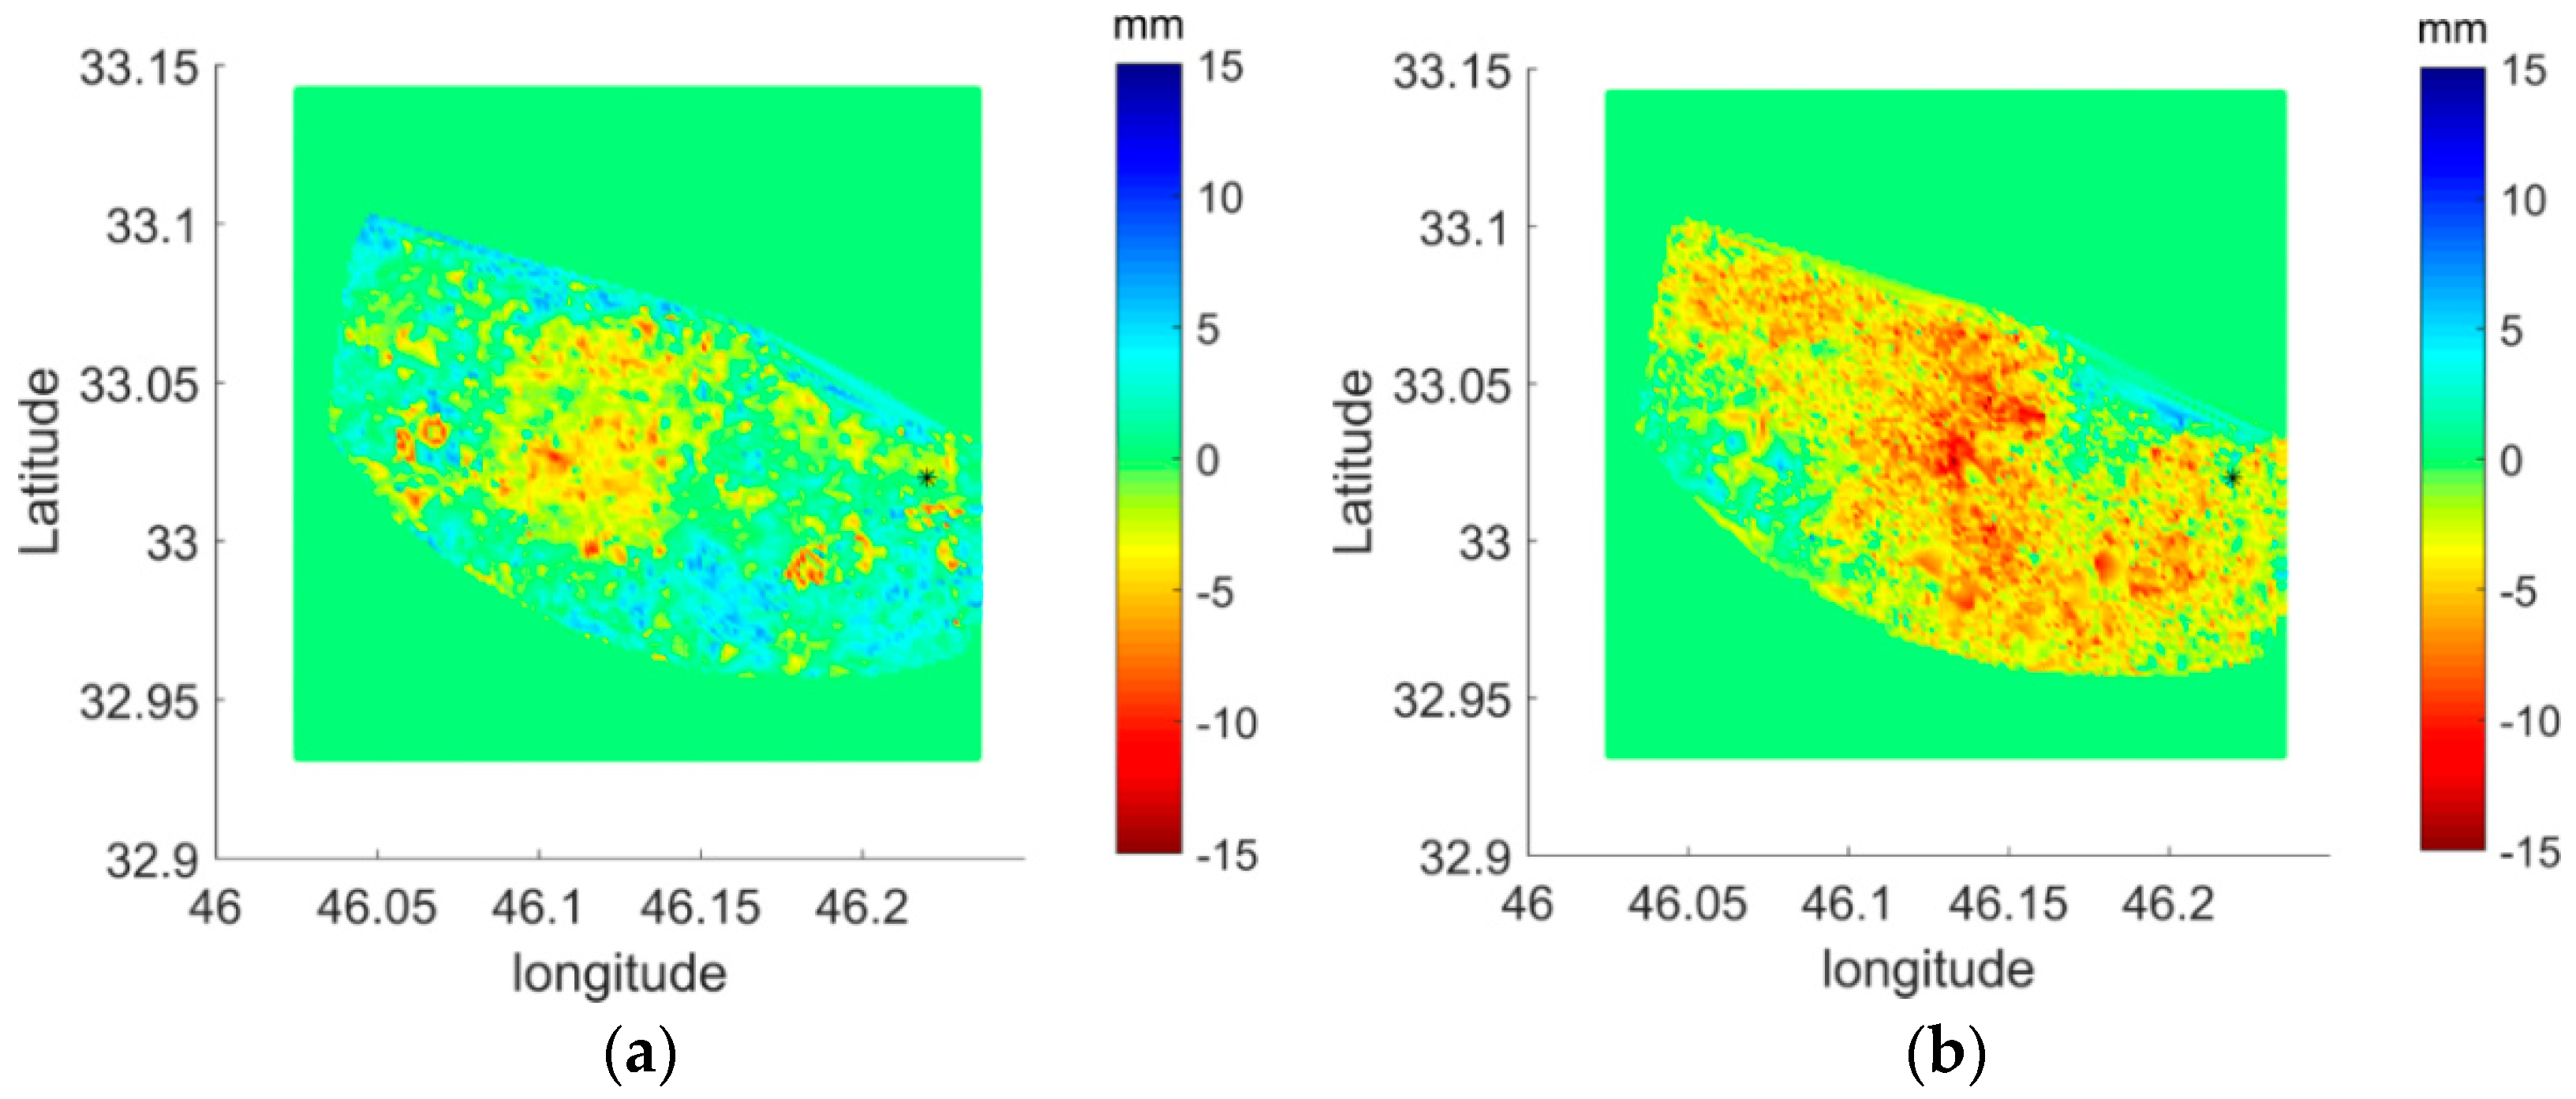
We used multi-track deformation estimate and utilized it to decompose deformation along line-of-sight into vertical and horizontal movements. We needed to create a new grid to interpolate ascending and descending data on it in order to perform a spatial coregistration of the data. The displacement between June 2016 and December 2018 with the reference point (46.22, 33.02) in the same grid is shown in Figure 9.

Figure 9.
The displacement between June 2016 and December 2018 for the (a) ascending gridding data and (b) the descending gridding data. The reference point (46.22, 33.02) is shown in black.
4. Discussion
In Figure 9, where the ascending and descending data are the same there has been a vertical displacement (which is the area located over Iran and Iraq’s tank); where there has been a difference in the line of sight direction, displacement has been horizontal. Figure 10 shows vertical displacement after decomposition.

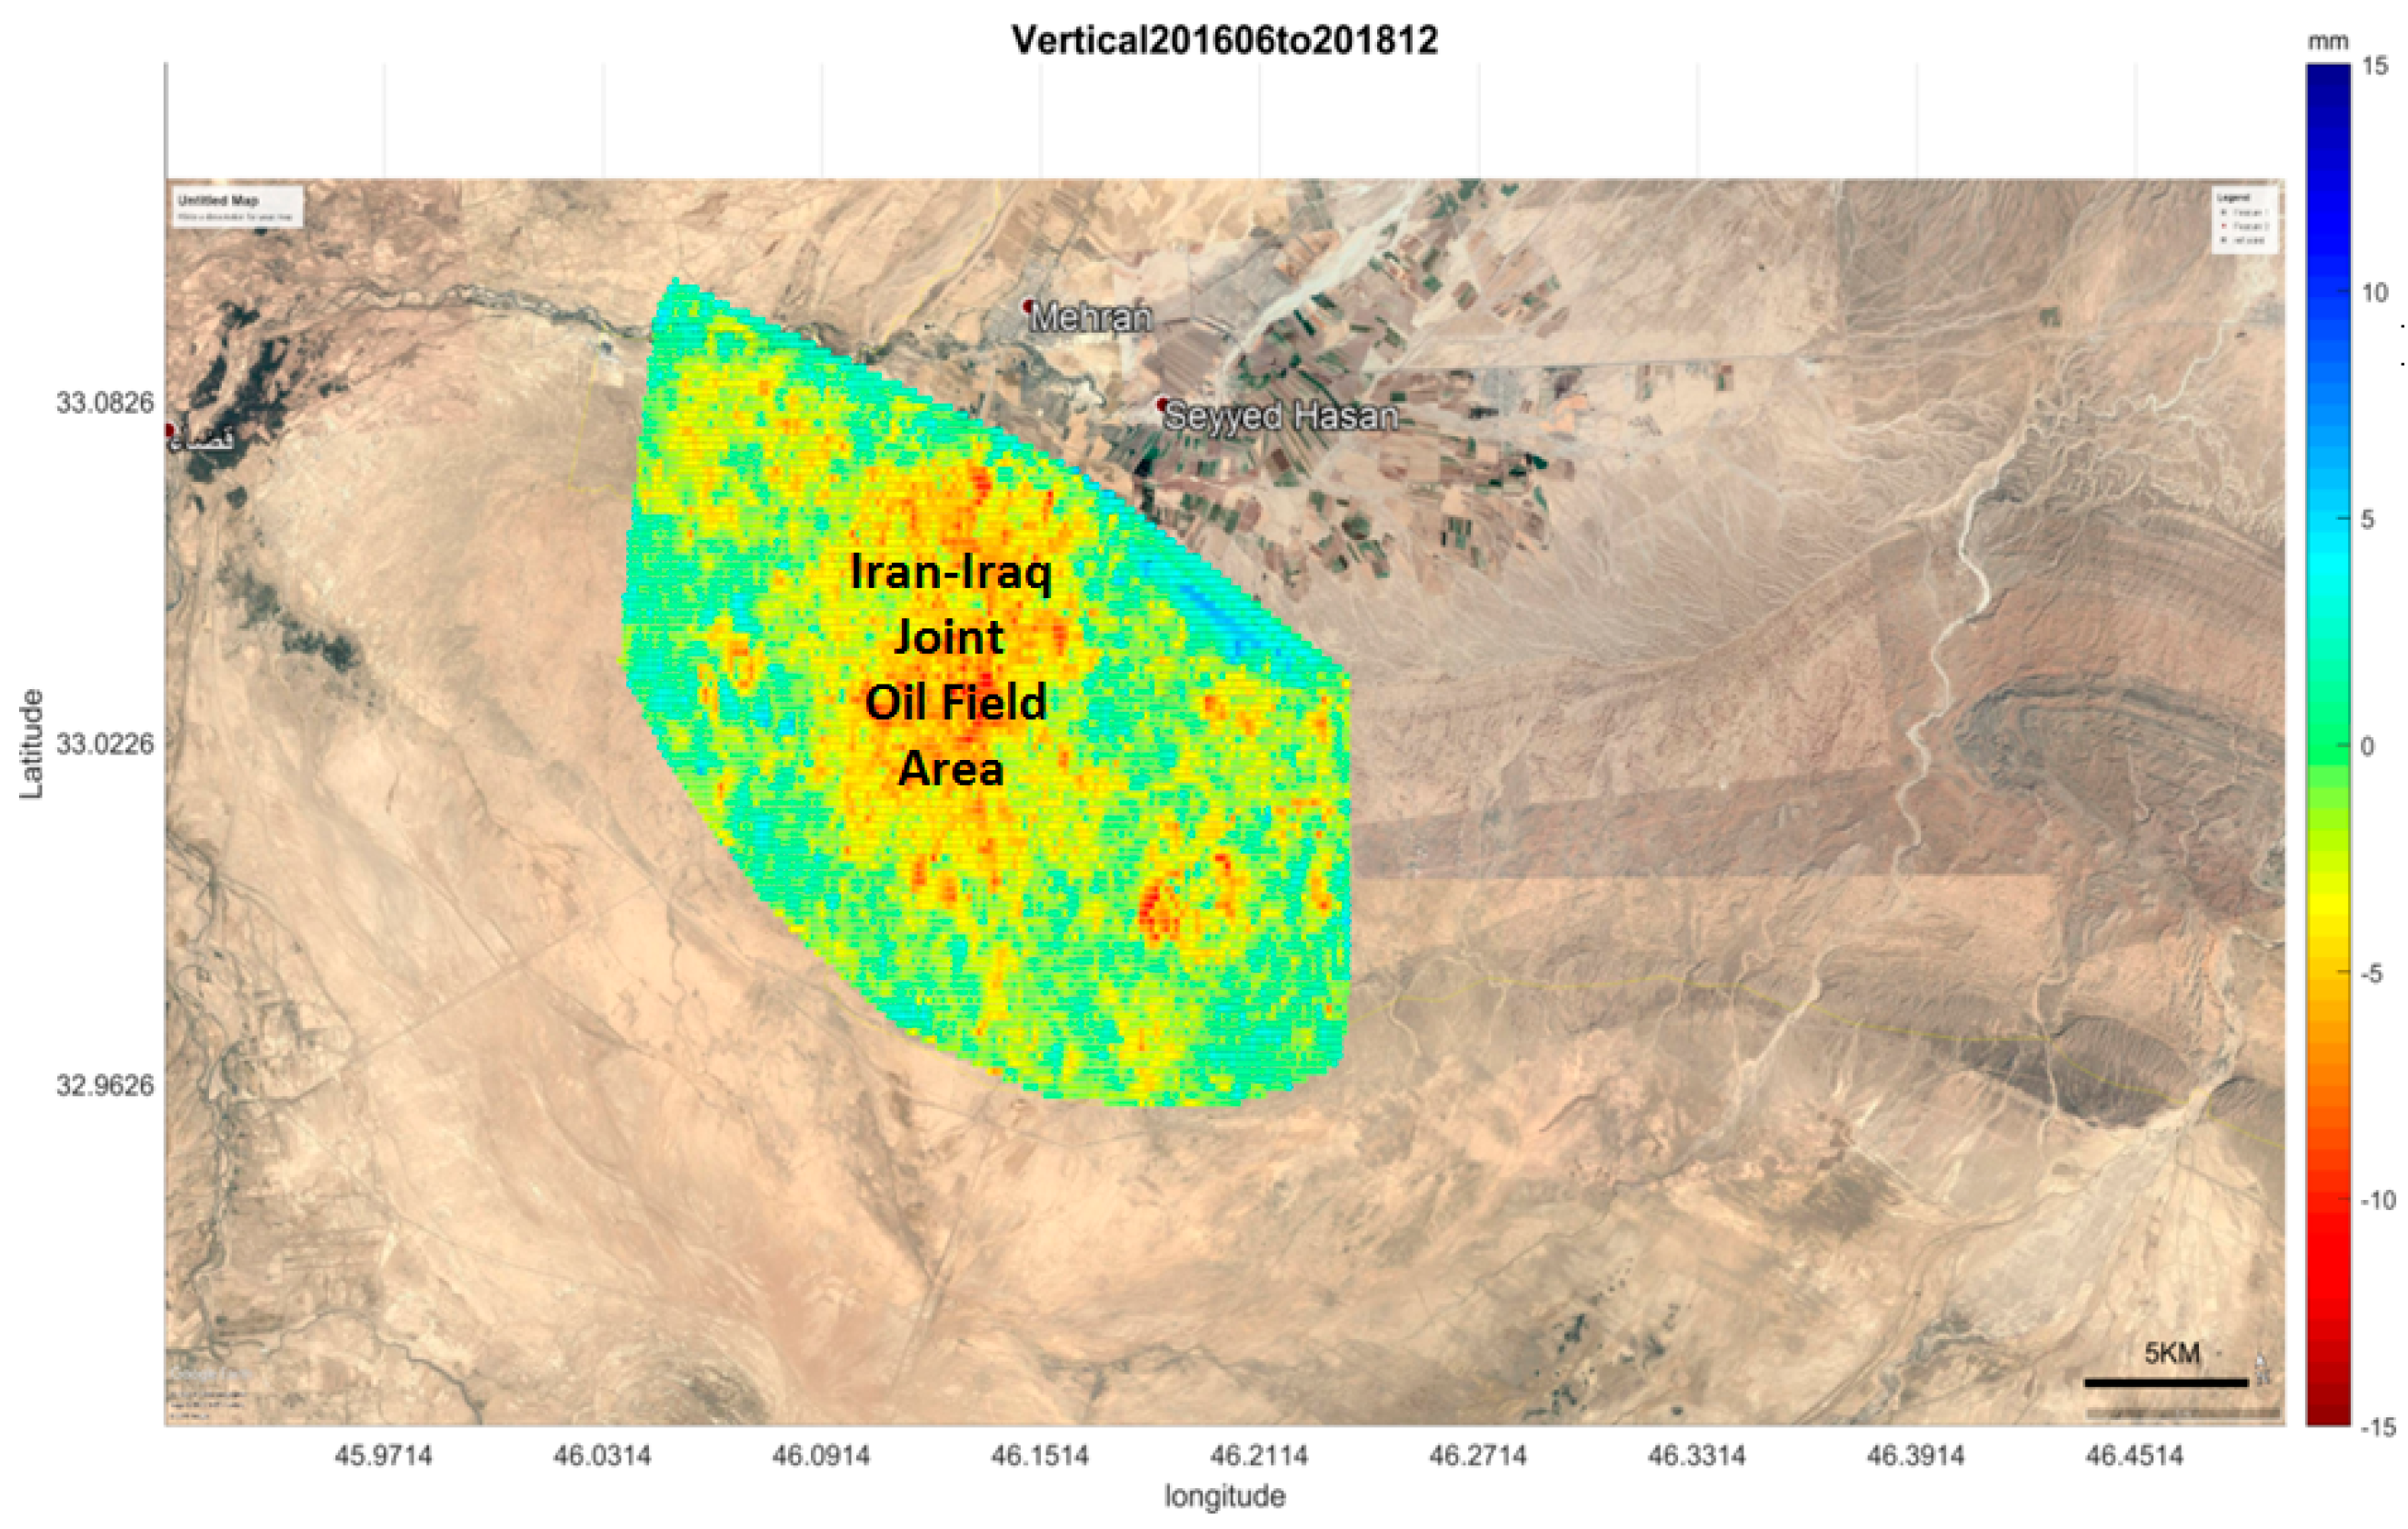
Figure 10.
Vertical displacement in the Iran-Iraq joint oil field area between June 2016 and December 2018.
Figure 11 indicates horizontal displacement in Azar oil field, which corresponds to the region’s existing cracks. This displacement has been caused by the existence of sand layers in depths of 10 to 15 meters under the ground, which we discovered in geological studies. Droughts and subsequent considerable precipitation events have caused the soil on the sand layer to slide and inconsistent slides have resulted in different displacements in the western direction and the formation of cracks.
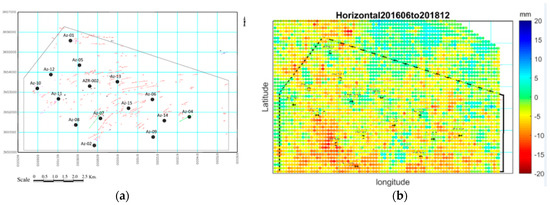
Figure 11.
(a) Distribution of wells and cracks in Azar oil field. (b) Horizontal displacement in the Azar oil field area between June 2016 and December 2018.
Azar oil field and 15 wells that were excavated and the cracks formed in the region are shown in Figure 11a. The distribution of these sites was obtained through various studies.
5. Conclusions
This study presented an application of the InSAR time series analysis to derive the spatial-temporal evolution of land subsidence in Azar oil field. The PSI method was applied for a dataset of 98 interferograms in order to extract surface deformation. The analyses also showed that oil extraction plays a key role in land subsidence in Azar oil field. Due to the high depth of oil wells (4300 meters), we expect the subsidence to cover a large area with a small magnitude. The subsidence is mainly observed in the vicinity of the oil field and is caused by fluid extraction. Likewise, the result of the InSAR cumulative map may show seasonal displacements on the territory.
Different horizontal displacement has been caused in the western direction. This has happened due to the inconsistent sliding of sand layers at depths of 10 to 15 meters, as well as considerable precipitation events in the region.
Author Contributions
Z.M., S.S.-E., P.A., M.H. and M.R. did fieldworks, collected data, and processed data. Z.M. and M.H. designed modeling concepts and implemented modeling process. Z.M., S.S.-E. and M.H. wrote and checked the manuscript.
Conflicts of Interest
The authors declare no conflict of interest.
References
- Massonnet, D.; Feigl, K.L. Radar interferometry and its application to changes in the Earth’s surface. Rev. Geophys. 1998, 36, 441–500. [Google Scholar] [CrossRef]
- Luo, Q.; Perissin, D.; Lin, H.; Zhang, Y.; Wang, W. Subsidence Monitoring of Tianjin Suburbs by TerraSAR-X Persistent Scatterers Interferometry. IEEE J. Sel. Top. Appl. Earth Obs. Remote. Sens. 2014, 7, 1642–1650. [Google Scholar] [CrossRef]
- Yen, J.-Y.; Chen, K.-S.; Chang, C.-P.; Boerner, W.-M. Evaluation of earthquake potential and surface deformation by Differential Interferometry. Remote Sens. Environ. 2008, 112, 782–795. [Google Scholar] [CrossRef]
- Jiang, L.; Lin, H.; Ma, J.; Kong, B.; Wang, Y. Potential of small-baseline SAR interferometry for monitoring land subsidence related to underground coal fires: Wuda (Northern China) case study. Remote Sens. Environ. 2011, 115, 257–268. [Google Scholar] [CrossRef]
- Yu, B.; Liu, G.; Li, Z.; Zhang, R.; Jia, H.; Wang, X.; Cai, G. Subsidence detection by TerraSAR-X interferometry on a network of natural persistent scatterers and artificial corner reflectors. Comput. Geosci. 2013, 58, 126–136. [Google Scholar] [CrossRef]
- Jung, H.C.; Kim, S.-W.; Jung, H.-S.; Min, K.D.; Won, J.-S. Satellite observation of coal mining subsidence by persistent scatterer analysis. Eng. Geol. 2007, 92, 1–13. [Google Scholar] [CrossRef]
- Jiang, L.; Lin, H. Integrated analysis of SAR interferometric and geological data for investigating long-term reclamation settlement of Chek Lap Kok Airport, Hong Kong. Eng. Geol. 2010, 110, 77–92. [Google Scholar] [CrossRef]
- Zhou, X.; Chang, N.-B.; Li, S. Applications of SAR Interferometry in Earth and Environmental Science Research. Sensors 2009, 9, 1876–1912. [Google Scholar] [CrossRef] [PubMed]
- Motagh, M.; Walter, T.R.; Sharifi, M.A.; Fielding, E.; Schenk, A.; Anderssohn, J.; Zschau, J. Land subsidence in Iran caused by widespread water reservoir overexploitation. Geophys. Res. Lett. 2008, 35. [Google Scholar] [CrossRef]
- Esfahany, S.S. Exploitation of Distributed Scatterers in Synthetic Aperture Radar Interferometry. PhD Thesis, Delft University of Technology, Delft, the Netherlands, 2017. [Google Scholar]


© 2019 by the authors. Licensee MDPI, Basel, Switzerland. This article is an open access article distributed under the terms and conditions of the Creative Commons Attribution (CC BY) license (https://creativecommons.org/licenses/by/4.0/).