Abstract
Droplet dosing devices for liquid medicine are widely spread in self-medication for prevention or in the event of illness. This paper presents investigations on the often unnoticed process of bubble formation in droplet dosing devices for liquid medicine which is decisive for the whole functionality of these systems. To obtain information about this process and how it affects the dosage, drip operations with an exemplary device have been evaluated. Based on these evaluations the bubble formation is explained qualitatively. Finally a mathematical approach to predict critical changes in the bubble formation process is presented.
1. Introduction
In the treatment of diseases a reliable self-medication is indispensable. Besides tablets, liquid medicine, often distributed in droplet dosing devices, is used. Figure 1 shows an exemplary droplet dosing device used in the investigations presented in this paper. When using these devices in practice, the focus is on the droplet formation. The bubble formation inside the sealed bottle, which has a great influence on the functionality of the device, goes unnoticed.
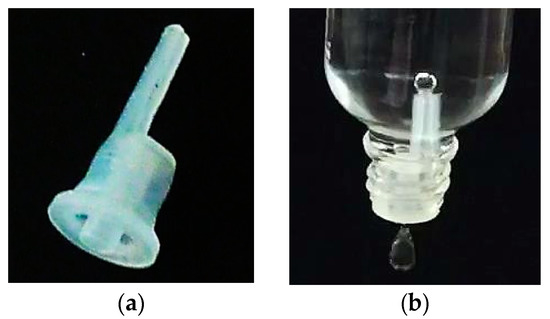
Figure 1.
(a) shows the droplet dosing device ‘Senkrechttropfer S2 0,6’ from ‘POMPL direkt e.K’. (b) shows this device combined with a bottle with a nominal volume of 50 mL. In the moment the picture was taken a droplet is detaching below the device and a bubble is forming on top of the ventilation capillary inside the bottle.
Existing approaches to estimate the properties of bubbles starting from the equilibrium of surface force and buoyancy force are summed up by Bals [1]. These approaches avoid using the Navier-Stokes-Equation to reduce complexity. Influencing factors on the bubble formation in general are the geometry of the orifice, the height of the fluid above the orifice and the properties of the used fluids [2]. Moreover Kumar & Kuloor [2] present several approaches to estimate the volume of bubbles detaching from an orifice. This detachment depends on the boundary conditions causing the bubble formation (constant pressure, constant flow rate). According to [1,2] these approaches have to be solved numerically which leads to a comparatively high computational effort. An analytically solvable approach, based on the balance of the buoyancy force, the momentum force due to the streaming gas, the surface force, the friction force and the inertia force acting on the bubble while its formation, is presented by Gaddis & Vogelpohl [3]. Applying some simplifications such as the negligence of the density of the bubble-forming gas leads to the equation
with the diameter of the orifice dh, the surface tension 𝜎, the density of the liquid 𝜌, the gravitational constant g and the volumetric flow rate .
Within this paper, the bubble formation from the mentioned droplet dosing devices will be explained and its importance for the whole dripping process will be figured out. Additionally, this work presents a new approach to estimate critical changes in the bubble formation process because none of the approaches named above considers the characteristics occurring due to the sealed bottle.
2. Measurement Setup
To analyze the dripping process as well as the bubble formation process inside the bottle a measurement setup was created. Within this setup the bottle is fixed by a tripod clamp and the droplets detaching from the dosing device are collected on a weighing scale with a resolution and a reproducibility of 0.001 g. The time elapsing during a single measurement is detected by a digital watch. The bubble and droplet formation as well as the displays of the weighing scale and the watch are recorded by an 8 megapixel camera with a framerate of about 60 fps. After recording a movie the bubbles can be counted and linked to the recording time and the mass of the fluid dripped out of the bottle until the examined point of time. Errors are reduced by calculating the mean value of 15 consecutive bubbles while evaluating the bubble formation. The working fluid used in the measurements presented in this paper is deionized and degassed water.
3. Bubble Formation in Droplet Dosing Devices
The results of the evaluation of the bubble formation process in the exemplary dosing device (Figure 1) are presented in Figure 2. The figure shows the bubble formation time T related to the recording time respectively air volume inside the bottle recorded with the setup described above. T is divided up in two phases t1 and t2: t1 illustrates the time until a hemispherical bubble, which represents a threshold due to the minimum radius and therefore maximum pressure inside the bubble (Young-Laplace equation), has formed on top of the ventilation capillary starting immediately after the detachment of the previous bubble. t2 illustrates the time until a bubble detaches starting with a hemispherical bubble. It can be seen that the bubble formation time increases with increasing recording time except in the period between 60 s and 85 s (dashed lines). In this interval the process of bubble formation changes due to the pressure variation inside the bottle.
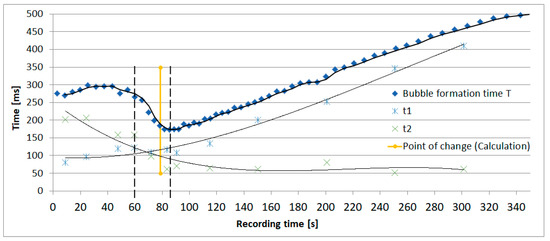
Figure 2.
The figure shows exemplarily the bubble formation time T and its phases t1 and t2 related to the recording time respectively air volume inside the bottle recorded with the setup described in Section 2.
Below 60 s recording time the air volume inside the bottle is comparatively small. According to the law of Boyle-Mariotte [4]
the volume transported into the bottle by a bubble is theoretically sufficient to compensate the negative pressure in the air volume inside the bottle. Because of the ongoing liquid flow out of the bottle the air volume inside the bottle increases continuously and a stable equilibrium cannot be reached. This leads to the growth of the bubble until its detachment and to an extended bubble formation time t2. The bubble formation process changes according to the increasing air volume inside the bottle with ongoing dripping process. Above 85 s recording time the volume transported into the bottle by a bubble is too small to compensate the negative pressure. After overcoming the critical pressure at the end of t1 (hemispherical bubble) the droplet inflates immediately which leads to a small time t2 and the time t1 needed to overcome the critical pressure of a hemispherical bubble becomes decisive.
Due to the correlation between bubble diameter and pressure via the Young-Laplace equation the change in the bubble formation process influences the pressure conditions occurring in the air volume inside the bottle. As a consequence, the bubble formation also influences the flow rate out of the bottle and therefore the droplet formation time. In sum the described change in the bubble formation process is of great importance for the whole dripping process of droplet dosing devices and, as a result of this, for the applicability of the dosing process.
4. Analytical Estimation of the Bubble Formation
To estimate the different phases of the described bubble formation process Equation (2) can be applied. This equation enables the calculation between two states, for example between the detachment of the previous bubble and a hemispherical bubble (t1) or a hemispherical bubble and the detachment of this bubble (t2). The diameter of the bubble needed within this approximation can be estimated by using Equation (1).
Equation (2) can also be used to calculate the point of change presented in Figure 2. Therefore phase t2 has to be considered in more detail. Applying Equation (2) leads to
with the air volume inside the bottle V1 at the state of a hemispherical bubble, the air volume V2 at the maximum bubble size and the corresponding pressures p1 and p2. Considering the increase of the bubble volume and neglecting the volume of the fluid streaming out of the bottle during the time t2 the volume V2 can be expressed as
Inserting Equation (4) in Equation (3) leads to
which represents the pressure p2 as a function of the air volume inside the bottle V1. Figure 3 shows the comparison of p2 to the maximum pressure inside the bottle pmax which is calculated from the environmental pressure pmax minus the pressure at the maximum bubble diameter estimated by Equation (1).
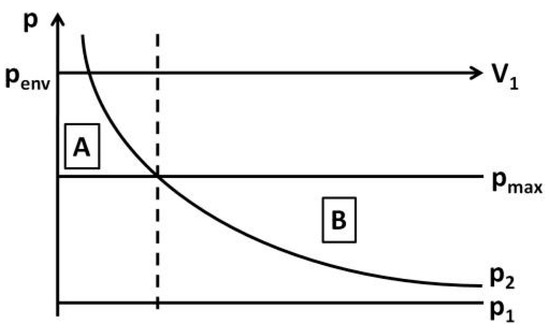
Figure 3.
The figure shows the estimation of the point of change in the bubble formation process.
For small volumes V1 (Figure 3, area A) the calculated pressure p2 is higher than the pressure pmax. With inflowing gas the pressure inside the bottle increases and the necessary pressure pmax to draw a bubble with maximum diameter into the bottle is exceeded. Therefore the growth of the bubble stops when a pressure equilibrium is reached. It continues only when liquid flows out of the bottle, which is neglected in this calculation, and the pressure inside the bottle decreases again. For increased volumes V1 (Figure 3, area B) p2 is less than pmax. This indicates that the negative pressure that appears after the inflow of the volume is ‘greater’ than needed to reach an equilibrium and air can continue streaming into the bubble. Hence the bubble formation starting from the hemispherical bubble is independent of the outflowing fluid.
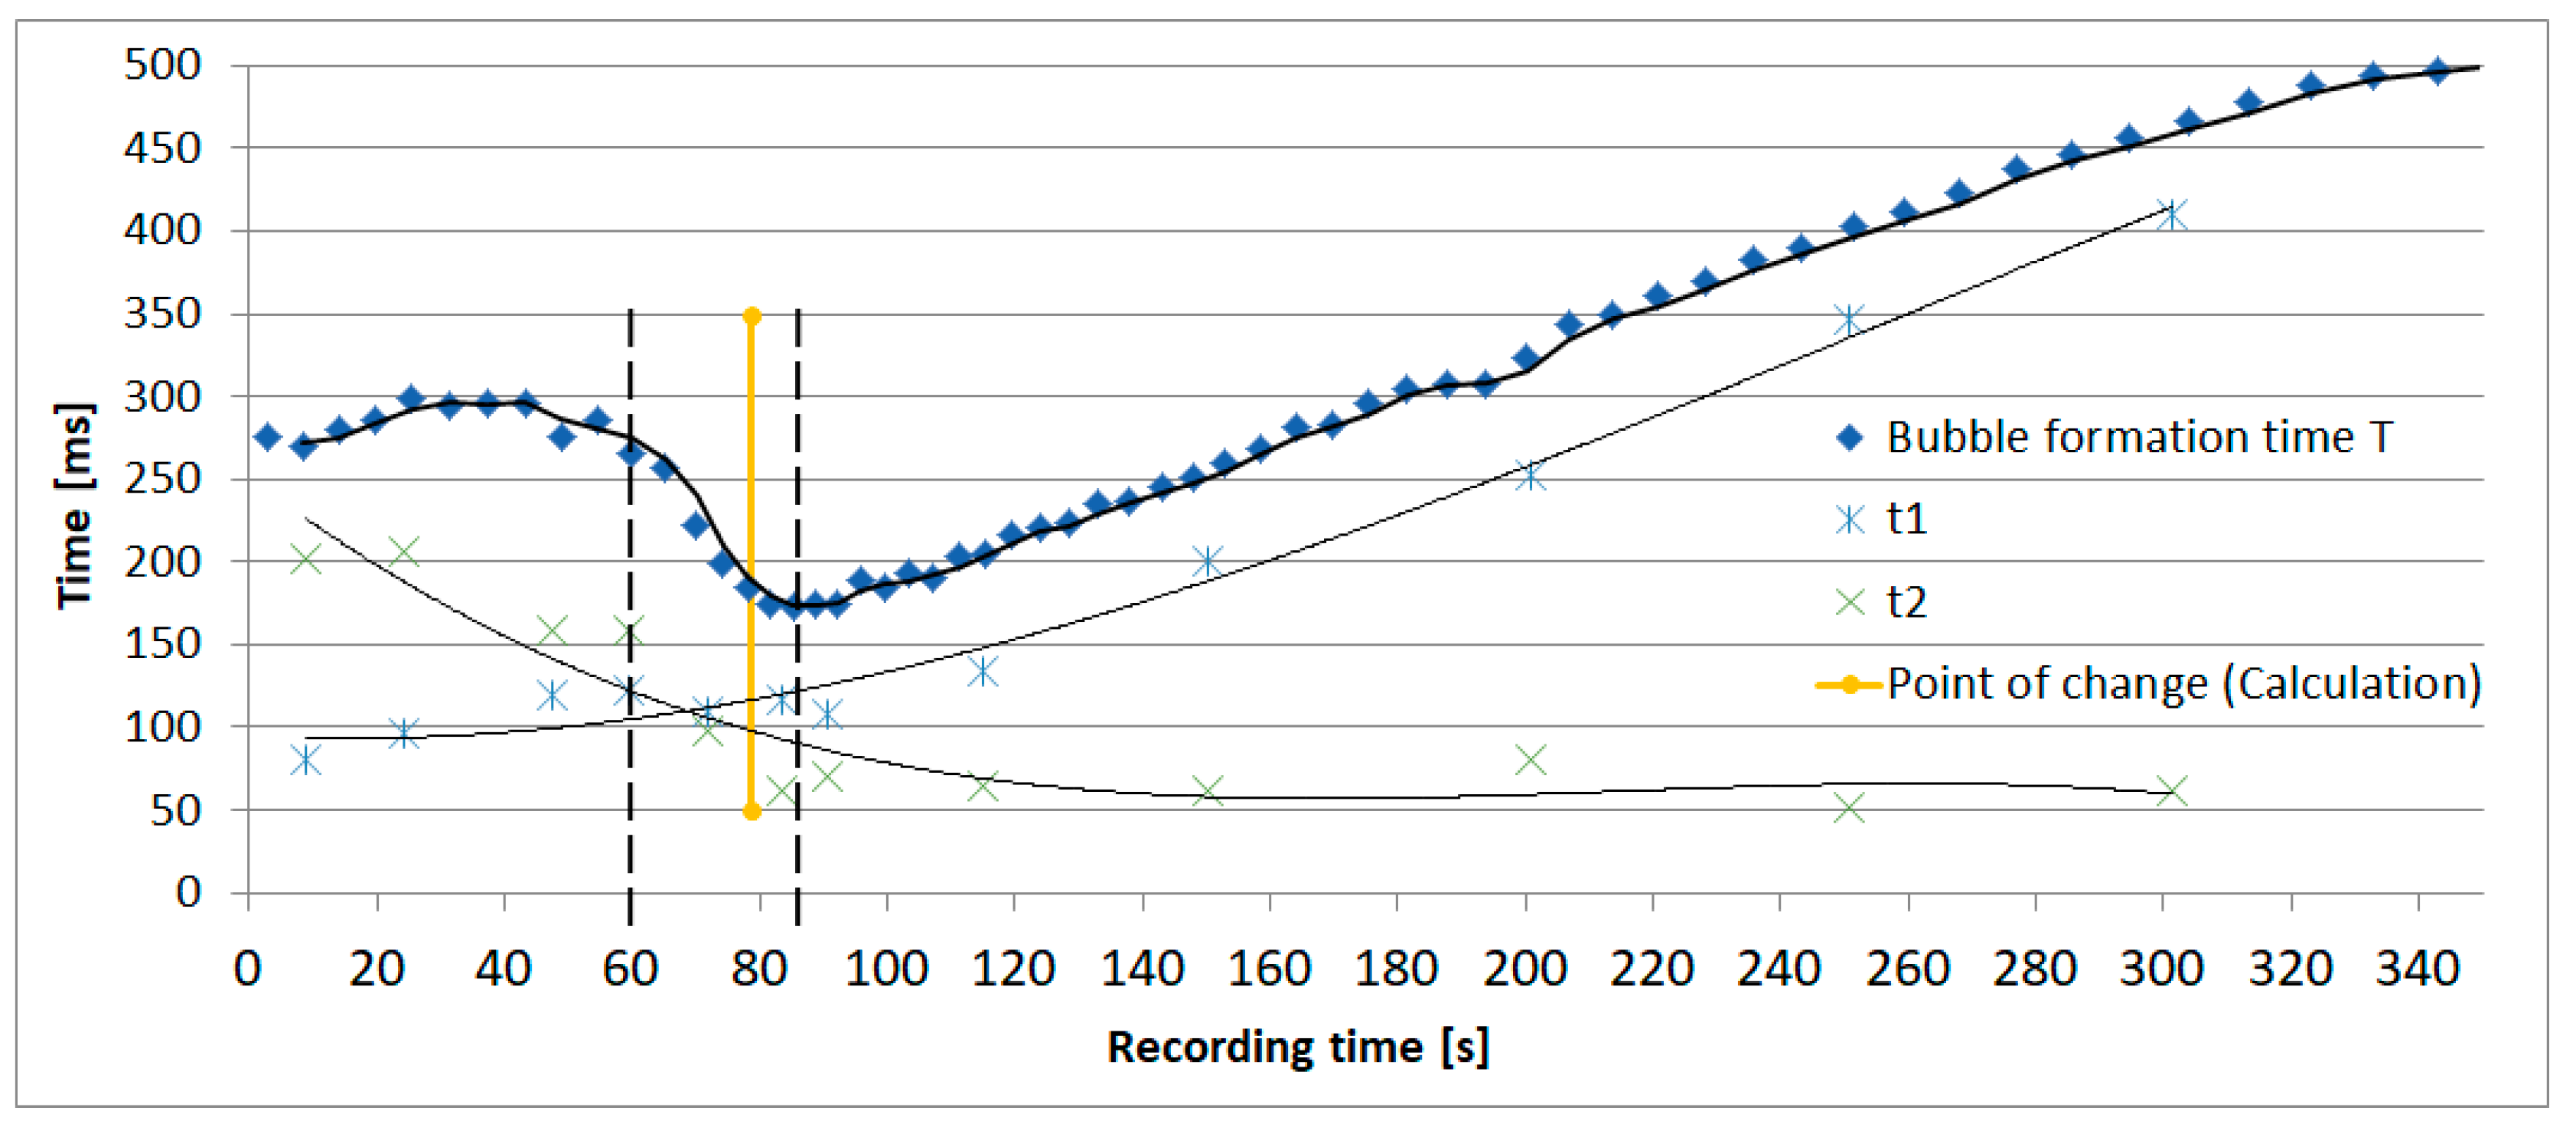
The calculation of the intersection between p2 and pmax leads to the expected point of change in the bubble formation process. Figure 2 shows the accuracy of the calculated point compared to the measured point of change indicated by the intersection of t1 and t2.
5. Discussion and Conclusions
Within this paper the characteristics of the bubble formation in droplet dosing devices for liquid medicine are presented by having a look at the exemplary measurement shown in Figure 2. The investigation of the presented measurement shows a change in the bubble formation process caused by the interaction of the droplet dosing device and the sealed bottle. The experimentally determined point of change arises as a result of the intersection of t1 and t2 and is compared to the point of change estimated with the new approach presented in this paper. The comparison of both results shows an adequate accordance.
Acknowledgments
A special thanks to Pia Müller and Leonie Blaser who provided the background of this paper by investigating droplet dosing devices for liquid medicine during their studies at the Chair Microsystems.
Conflicts of Interest
The authors declare no conflict of interest.
References
- Bals, A. Grundlagen der Blasenbildung an Einzelporen und Lochplatten. Chemie Ingenieur Technik 2002, 74, 337–344. [Google Scholar] [CrossRef]
- Kumar, R.; Kuloor, N.K. The formation of bubbles and drops. Adv. Chem. Eng. 1970, 8, 255–368. [Google Scholar] [CrossRef]
- Gaddis, E.S.; Vogelpohl, A. Bubble formation in quiescent liquids under constant flow conditions. Chem. Eng. Sci. 1986, 41, 97–105. [Google Scholar] [CrossRef]
- Hering, E.; Martin, R.; Stohrer, M. Physik für Ingenieure, 10th ed.; Springer: Berlin/Heidelberg, Germany, 2007; pp. 175–266. [Google Scholar]


Publisher’s Note: MDPI stays neutral with regard to jurisdictional claims in published maps and institutional affiliations. |
© 2018 by the authors. Licensee MDPI, Basel, Switzerland. This article is an open access article distributed under the terms and conditions of the Creative Commons Attribution (CC BY) license (https://creativecommons.org/licenses/by/4.0/).