Abstract
In active thermography, the use of an optimised excitation source can simplify the interpretation of measurement results. Our custom designed source, especially designed for dynamic line scanning thermography, minimises the needed excitation power and the biasing side effects generated by a wide-range heat source. The source is redesigned, starting from a regular heat source, to focus the available energy such that the needed heating power is provided in a small band. Ray tracing software is used to design absorbers and reflectors to focus the electromagnetic radiation as well as the heat in a thin line. The most optimal design is manufactured and validated on a laminated test sample. The acquired thermographic data are then compared to the data captured in the old-fashioned way with widely available excitation sources. The redesign is also tested on durability and practical use to make sure that it is easy to handle and that it can be used as a long-term solution. Experienced inspectors evaluated the ease of use of it in comparison to the existing sources. A redesigned excitation source minimises the generated biasing side-effects resulting in more energy efficient and safer measurements.
1. Introduction
Non-destructive testing (NDT) is worldwide advancing in the market of material inspections. Almost every object can be examined due to inspections without damaging the product itself. There is no longer the need to produce extra items to submit them to destructive tests. Those non-destructive tests offer a reliable, fast and cost-efficient way to inspect structures without affecting their functionality [1,2]. Within the use of infrared thermography, a variety of techniques can be distinguished according to the origin of the measured temperature differences. Passive thermography takes advantage of the emissivity of each object at a temperature above absolute zero (0 K), active thermography on the other hand uses an external excitation source to excitate an object to measure the temperature difference between the heating and cooling down. Different excitation sources can be used such as laser heating, halogen lamps, flash lamps, ultrasonic excitation, eddy currents excitation, microwaves, etc. Each of these sources has its advantages and disadvantages, laser heating for example creates the possibility to heat highly focussed. On the other hand halogen lamps are a much cheaper and safer way to heat the object.
Until now, the use of halogen lamps led to heating up a wide area of the specimen to be inspected. Several efforts have been done to minimise the heated region. Most of them make use of a slit to achieve the desired heating range. Each ray not reaching the specimen is a loss of energy, so the amount of those rays should be minimal. Figure 1 shows two experimental set-ups that currently are used to minimise the heated region.
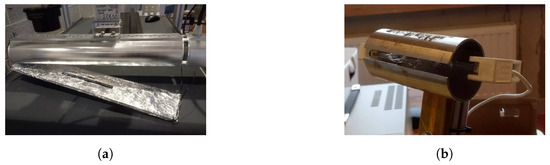
Figure 1.
Two experimental set-ups are shown as they are currently used: (a) experimental test-setup for dynamic line scanning on a conveyor belt; and (b) cylindrical reflector designed to focus the electromagnetic radiation in a thin line.
An optimised reflector shape could offer a safer and low-budget alternative for the use of laser excitation and could also be a huge step in the further development of Dynamic Line Scan Thermography. Concentrating the heating power in a small region offers a bigger temperature difference between the excitation and cooling down of the specimen to be inspected. This way, more excitation power can be delivered in a short period of time resulting in a more effective heating. The excitation source resembles flash excitation instead of the long step heating.
Multiple applications exist where electromagnetic radiation is focussed to produce heat; those are mostly powered by sunlight and therefore focussed using parabolas [3,4,5]. Incident parallel rays are focussed in the focal point of the parabola, consequently rays leaving the focal point of the parabola will be reflected parallel to each other. Lee et al. [6,7] studied the use of parabolic and elliptical mirrors for near infrared radiation to induce local heating of high-strength steels. Unvala and Maries [8] inspected the heating characteristics of an tungsten halogen lamp in combination with an elliptical reflector. Temperatures of 1200 °C were measured using a 1 kW heating source. The heated region was minimised to 2 cm.
In this paper, we try to combine the advantage of local heating of laser heating with the low cost and safety of halogen lamps. To focus the power of a halogen lamp a reflector is designed using ray tracing software.
2. Methodology
2.1. Requirements
To optimise an excitation source for active thermography, several requirements are predefined for the heat source. First, the focus length of the heat source is defined at 25 cm; this value is based on previous test where a non-focused heating source was placed 25 cm above the specimen. A second requirement is the use of a tungsten halogen lamp; known as a halogen lamps, these lamps are widely available and are safe to use in almost every circumstance. The focussed beam should be minimised and we aim to focus minimum 80 per cent of the heat radiation. Active thermography requires heating of the specimen to be inspected, therefore the heating power should be focussed. Radiation focussing can be performed in multiple ways: for example, using mirrors/reflectors or using lenses. Heat rays on the other hand cannot be focused using glass lenses because of the energy losses in the lenses resulting in heating the lenses. A germanium lens on the other hand is suitable for focussing heat radiation, but these are very expensive.
2.2. Geometry
A parabola has the characteristic to reflect incident parallel rays to the focus point of the parabola. This characteristic is better known as the reflective property of a parabola and is proven by several studies [11,12,13,14]. Consequently, rays leaving the focal point of a parabola are always reflected along a line parallel to the symmetry axis of the parabola. Using a parabola is therefore not suitable for our application. We aim to focus the rays in a narrow point in order to minimise the heated region.
An ellipse on the other hand can be used because of the specific geometry of an ellipse. The ellipse has the property that any ray leaving one of the foci will be reflected to the other focus point of the ellipse, known as the focal property of an ellipse [15]. The foci of the ellipse are generally named F1 and F2, as visualised in Figure 2. We place the halogen tube lamp in F1 of the ellipse and the predefined heated region in F2. This way, every ray leaving the halogen lamp will be reflected to F2 (the heated are on the specimen to be inspected). Figure 2 shows the different characteristics of a parabola and an ellipse.
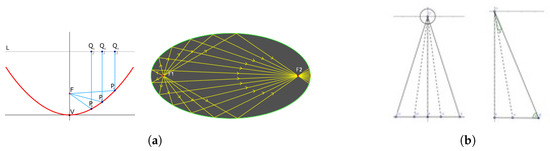
Figure 2.
(a) The reflecting characteristics of a parabola and an ellipse are visualised [9,10]; and (b) geometrical representation to calculate the amount of rays not being reflected by the ellipse.
By using an ellipse, it would be theoretically possible to focus the electromagnetic radiation in one single point. In practice, this is not possible, because the ellipse should remain a closed curve to ensure all rays are reflected to the other focal point. This is impossible for our application because the rays need to leave the reflector to heat the specimen to be inspected. Opening the elliptical reflector results in a part of the rays not being reflected to the focus point what leads to a wider radiation pattern. The amount of direct radiation towards the specimen can be found using simple mathematics. Figure 2 represents a simplified visualisation of the halogen lamp and the heated region as result of direct illumination. equals the focus distance between the lamp and the specimen to be inspected, represents the width of the gap in the elliptical reflector and stands for the desired heating region. Consider the triangle ΔOFE; the angle between and equals 90°. This implies that the length of can be found using Pythagoras Theorem:
The value for is consequently found using:
The length of a can easily be found by the subtraction of the total illuminated region and the desired heating region . Now, consider the triangle ΔOHE; the length of can be calculated using the law of cosines.
Consequently, the angle between and can be found using the law of cosines a second time.
The area of the lamp illuminating the specimen directly outside the desired region is represented by:
This area equals the summation of the circular sectors in triangle ΔOHE and ΔOH2E2. Notice that is in radian to calculate the area of the circular sector. The percentage of the lamp directly illuminating the specimen can finally be calculated:
Opening the elliptical reflector for our application at 24 cm from the top, results in an heated region of 4.76 cm and the desired maximum width of the heated region is 2 cm. According to previous calculations, the difference of 2.76 cm equals an area of 1.83% of our excitation source. A circular sector of the light emitting halogen tube lamp will directly illuminate the specimen to be inspected because of the opening in the elliptical reflector. To ensure that the desired 2-cm-wide focussed light beam is reached, additional reflectors are inserted in the ellipse. Figure 3 visualises the designed geometry of the reflector according to the simulations. According to the focal property of an ellipse, a ray leaving in a focal point is reflected to the other focus point of the ellipse. The halogen lamp has a diameter larger than the focal point of the ellipse; consequently, the rays do not leave exactly in the focal point of the ellipse. Assuming that the rays leave the halogen lamp normal to the length of it, the extended rays intersect the focus of the ellipse, approving the use of an elliptical reflector.
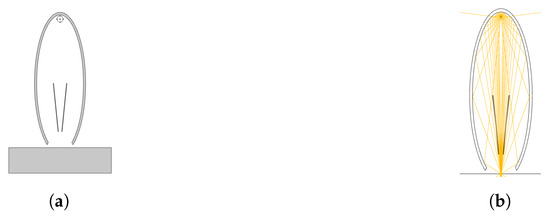
Figure 3.
Visualisation of the optimised geometry and the related ray trajectories. (a) Optimised geometry according to simulations; (b) Ray trajectories according to ray-tracing simulation.
2.3. Simulation
The shape of the reflector is optimised during different stages to split the search into smaller steps. First, a relatively simple simulation model was built in COMSOL® 5.2 to ensure the principal working of the model before optimising the shape of the reflector. Afterwards, the model was linked with a batch-script to diversify the parameters used in the parametric geometries. This way, the shape with the highest intensity in a predefined region can be found using parametric sweep over the different parameters.
For the optimisation of the geometry, the following assumptions were made:
- The geometry is made of aluminium.
- The surfaces are highly polished, resulting in a reflection coefficient of almost 1.
- The EM-radiation is uniform along the length of the halogen lamp.
- The excitation source and reflector are considered to be indefinitely so the sides can be neglected.
2.3.1. Ray-Tracing Model
A 2D ray-tracing model was built in COMSOL® 5.2 to find the optimal shape for a section of the reflector. A 2D simulation can be used due to the simple geometry of a halogen tube lamp. After parametrically designing the optimised section of the reflector, it can easily been extruded over the length of the halogen tube. The geometry in the simulation consists of the halogen lamp, the reflector and a specimen on which the incident radiation will be measured. Figure 3 shows the result of a ray-tracing simulation in ideal circumstances.
2.3.2. Automated Batch-Script
Different shapes were examined to find the optimal reflector shape. To automate the search for the best shape, the curvature is completely built up from parametric sections. This way, a parametric sweep could be performed using a batch-script. Two parameters are used during this parametric sweep: the first one to change defines the width of the reflector and the second one its height. The height of the ellipse is defined by the semi-major axis and the width by the semi-minor axis. The length of the semi-major axis varied between 0 and 0.3 using steps of 0.001. The semi-minor axis on the other hand diversified in a range between 0.1 and 0.2 with steps of 0.001. For each iteration, the intensity in a determined region is calculated and compared to the best simulation solution at that moment. As a result of the script, a plot is generated visualizing the optimised geometry, the ray trajectories and the computed intensities.
An additional Matlab®-script is used to calculate the impact of inaccurate assembling of the reflector and excitation source. Multiple placement heights of the lamp are simulated to visualise the influence of the error. This error is calculated for three different geometries to select the most adequate one out of the simulated geometries. Those geometries are in addition compared to three experimental set-ups. Two of them are shown in Figure 1. Figure 4 shows the visual output of the Matlab®-script used to visualise the impact of the misplacing of the halogen lamp.
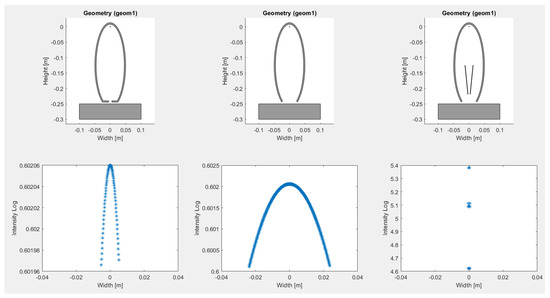
Figure 4.
Several geometries are compared to each other. The placing height of the halogen tube lamp varies to identify the difference in heating as result of placing the lamp not exactly in the focus point of the ellipse.
3. Results and Discussion
Multiple ray-tracing simulations indicate that the use of an ellipse in combination with additional reflectors is the most suitable solution for the focussing of the electromagnetic radiation coming from an halogen lamp. The width and height of the ellipse are variating according to the predefined requirements for the measurement set-up. The optimised geometry is resistant to flaws as misplacing of the excitation source. The electromagnetic radiation is focussed in a narrow region due to the elliptical reflector and the additional straight reflectors. Those straight reflectors deliver additional energy to the heated specimen in comparison to a reflector with a slit at the bottom to narrow down the heated area.
4. Conclusions
In this paper, we have designed a reflector for a tungsten halogen lamp to combine the ease of use and the safety of a halogen lamp with a minimal heating region. Using this reflector could resolve in faster and more accurate measurements using dynamic line scan thermography, whereby a specimen is inspected using a linear movement. The reflector geometry is designed using ray-tracing software and optimisation software to fulfil the predefined requirements of the measurement set-up. The obtained shape consists of an ellipse with foci at the position of the halogen lamp and at the surface of the specimen. Additional straight reflectors provide an extra energy gain in comparison to using a slit in order to obtain a small heated region.
Further investigation is necessary to define the possible increase of movement speed and accuracy of dynamic line scan thermographic inspections. Simulations regarding heat distribution through the reflector as well as the heat through the specimen as result of the focused beam need to be performed.
yes
Acknowledgments
This research was funded by the University of Antwerp and the Institute for the Promotion of Innovation by Science and Technology in Flanders (VLAIO) via support for the TETRA project, “SINT: Smart Integration of Numerical modeling and Thermal inspection”, project number HBC.2017.0032. The researchers received funding from the Antwerp University IOF-council through project PSID-34924 entitled “Fast Broadband Lock-In Thermography for Fragile Structures Using System Identification”.
References
- Maldague, X.P. Theory and Practice of Infrared Thermography for Nondestructive Testing; Wiley: New York, NY, USA, 2001. [Google Scholar]
- Ciampa, F.; Mahmoodi, P.; Pinto, F.; Meo, M. Recent Advances in Active Infrared Thermography for Non-Destructive Testing of Aerospace Components. Sensors 2018, 18, 609. [Google Scholar] [CrossRef] [PubMed]
- Chen, J.; Yang, L.; Zhang, Z.; Wei, J.; Yang, J. Optimization of a uniform solar concentrator with absorbers of different shapes. Sol. Energy 2017, 158, 396–406. [Google Scholar] [CrossRef]
- Oommen, R.; Jayaraman, S. Development and performance analysis of compound parabolic solar concentrators with reduced gap losses—‘V’ groove reflector. Renew. Energy 2002, 27, 259–275. [Google Scholar] [CrossRef]
- Tian, M.; Su, Y.; Zheng, H.; Pei, G.; Li, G.; Riffat, S. A review on the recent research progress in the compound parabolic concentrator (CPC) for solar energy applications. Renew. Sustain. Energy Rev. 2018, 82, 1272–1296. [Google Scholar] [CrossRef]
- Lee, E.H.; Yang, D.Y.; Yang, W.H. Numerical modeling and experimental validation of focused surface heating using near-infrared rays with an elliptical reflector. Int. J. Heat Mass Transf. 2014, 78, 240–250. [Google Scholar] [CrossRef]
- Lee, E.H.; Hwang, J.S.; Lee, C.W.; Yang, D.Y.; Yang, W.H. A local heating method by near-infrared rays for forming of non-quenchable advanced high-strength steels. J. Mater. Process. Technol. 2014, 214, 784–793. [Google Scholar] [CrossRef]
- Unvala, B.A.; Maries, A. Radiant heating using an ellipsoidal reflector. J. Phys. E Sci. Instrum. 1974, 7, 349. [Google Scholar] [CrossRef]
- File:Parabola with Focus and Arbitrary Line.svg—Wikimedia Commons. Available online: https://commons.wikimedia.org/wiki/File:Parabola_with_focus_and_arbitrary_line.svg (accessed on 25 March 2018).
- Math Open Reference. Elliptical Mirrors—Math Open Reference. Available online: https://www.mathopenref.com/ellipseoptics.html (accessed on 29 March 2018).
- Rashed, R. A Pioneer in Anaclastics: Ibn Sahl on Burning Mirrors and Lenses. Isis 1990, 81, 464–491. [Google Scholar] [CrossRef]
- Holland, F. The Reflective Property of a Parabola. Ir. Math. Soc. Bull. 2010, 66, 87–90. [Google Scholar] [CrossRef]
- Williams, R.C.; By, E.; Hutchinson, J.P.; Wagon, S. A Proof of the Reflective Property of the Parabola. Am. Math. Mon. 1987, 94, 667–668. [Google Scholar] [CrossRef]
- Waghmare, S.A.; Gulhane, N.P. Design and ray tracing of a compound parabolic collector with tubular receiver. Sol. Energy 2016, 137, 165–172. [Google Scholar] [CrossRef]
- Berendonk, S. Proving the Reflective Property of an Ellipse. Math. Mag. 2014, 87, 276–279. [Google Scholar] [CrossRef]
Publisher’s Note: MDPI stays neutral with regard to jurisdictional claims in published maps and institutional affiliations. |
© 2018 by the authors. Licensee MDPI, Basel, Switzerland. This article is an open access article distributed under the terms and conditions of the Creative Commons Attribution (CC BY) license (https://creativecommons.org/licenses/by/4.0/).