Abstract
Land use/land cover (LULC) is a significant factor which plays a vital role in defining an urban ecosystem. Interpretations of LULC are eased in recent times by utilizing hyperspectral and multispectral datasets obtained from various platforms. An attempt is made to comparatively assess the potentiality of AVIRIS NG with Sentinel 2 data through applied classification techniques for Kalaburagi urban sphere. Spectral responses of both datasets were analyzed to derive reflectance spectra. A standard supervised classification algorithm associated with dimensionality reduction techniques is applied. For performance evaluation, results are validated to check which dataset outperforms well and provides better accuracy.
1. Introduction
Land Use/Land Cover (LULC) is a salient element used in explication of terrain features. Technical advancements in spatial sciences havefavored the researches to utilize remotely sensed imageries for extraction of land cover information. Potential remote sensing methods are highly capable of providingdatasets with high spatial, spectral, and temporal resolutions that promote further analysis [1,2]. Multispectral and hyperspectral datasets obtained from spaceborne and airborne platforms yield possible results when used for numerous geospatial use cases. Reflectance properties from the Earth’s surfacedistributed among the spectrum bands are taken more into consideration. The classification task in general requires precise bands exposing apparent land cover features. Though hyperspectral and multispectral datasets provide more detailed information, spectral bands in the vicinity remain strongly correlated, thus revealing a high degree of redundancy [3]. Selection of appropriate bands is of prime importance in order to reduce irrelevant information. Also, the acquired hyperspectral data have to be transformed like the multispectral dataset for accurate classification. The results are compared to check the effectiveness of applied classification for both hyperspectral and multispectral datasets [4,5,6,7].
This study briefly describes how well the remote sensor datasets respond to the conventional supervised classification algorithm. The aim of this study is achieved using the following objectives that are mentioned below.
- To focus on using multispectral and hyperspectral dataset for LULC classification through standard dimensionality reduction techniques.
- To assess the classified results and theircorresponding accuracies obtained using a supervised algorithm for a benchmark dataset representing a core urban area.
2. Related Work
Hyperspectral image classification is achieved based upon the reflectance values distributed along spectral bands. On the other hand, multispectral imageries render more information in fewer bands while also retaining the accuracy of the image [8,9]. Dimensionality reduction techniques like principle component analysis (PCA), minimum noise fraction (MNF) are pre-processing steps that enhances the image by reducing the redundancy in the original data. In general, multispectral information has a collection of mixed pixels representing ground features that are to be distinguished using selective representative samples [10,11,12]. A supervised classification algorithm like random forest (RF) classifier is applied to datasets in this study as it is popular among the remote sensing community for its accuracy. RF is capable of handling high data dimensionality but sensitive to the sampling design. Relevant information that is suitable to the geographic datasets are provided as training samples to obtain better results that achieve high accuracy of up to 91% [13].
3. Materials and Methods
3.1. Study Area
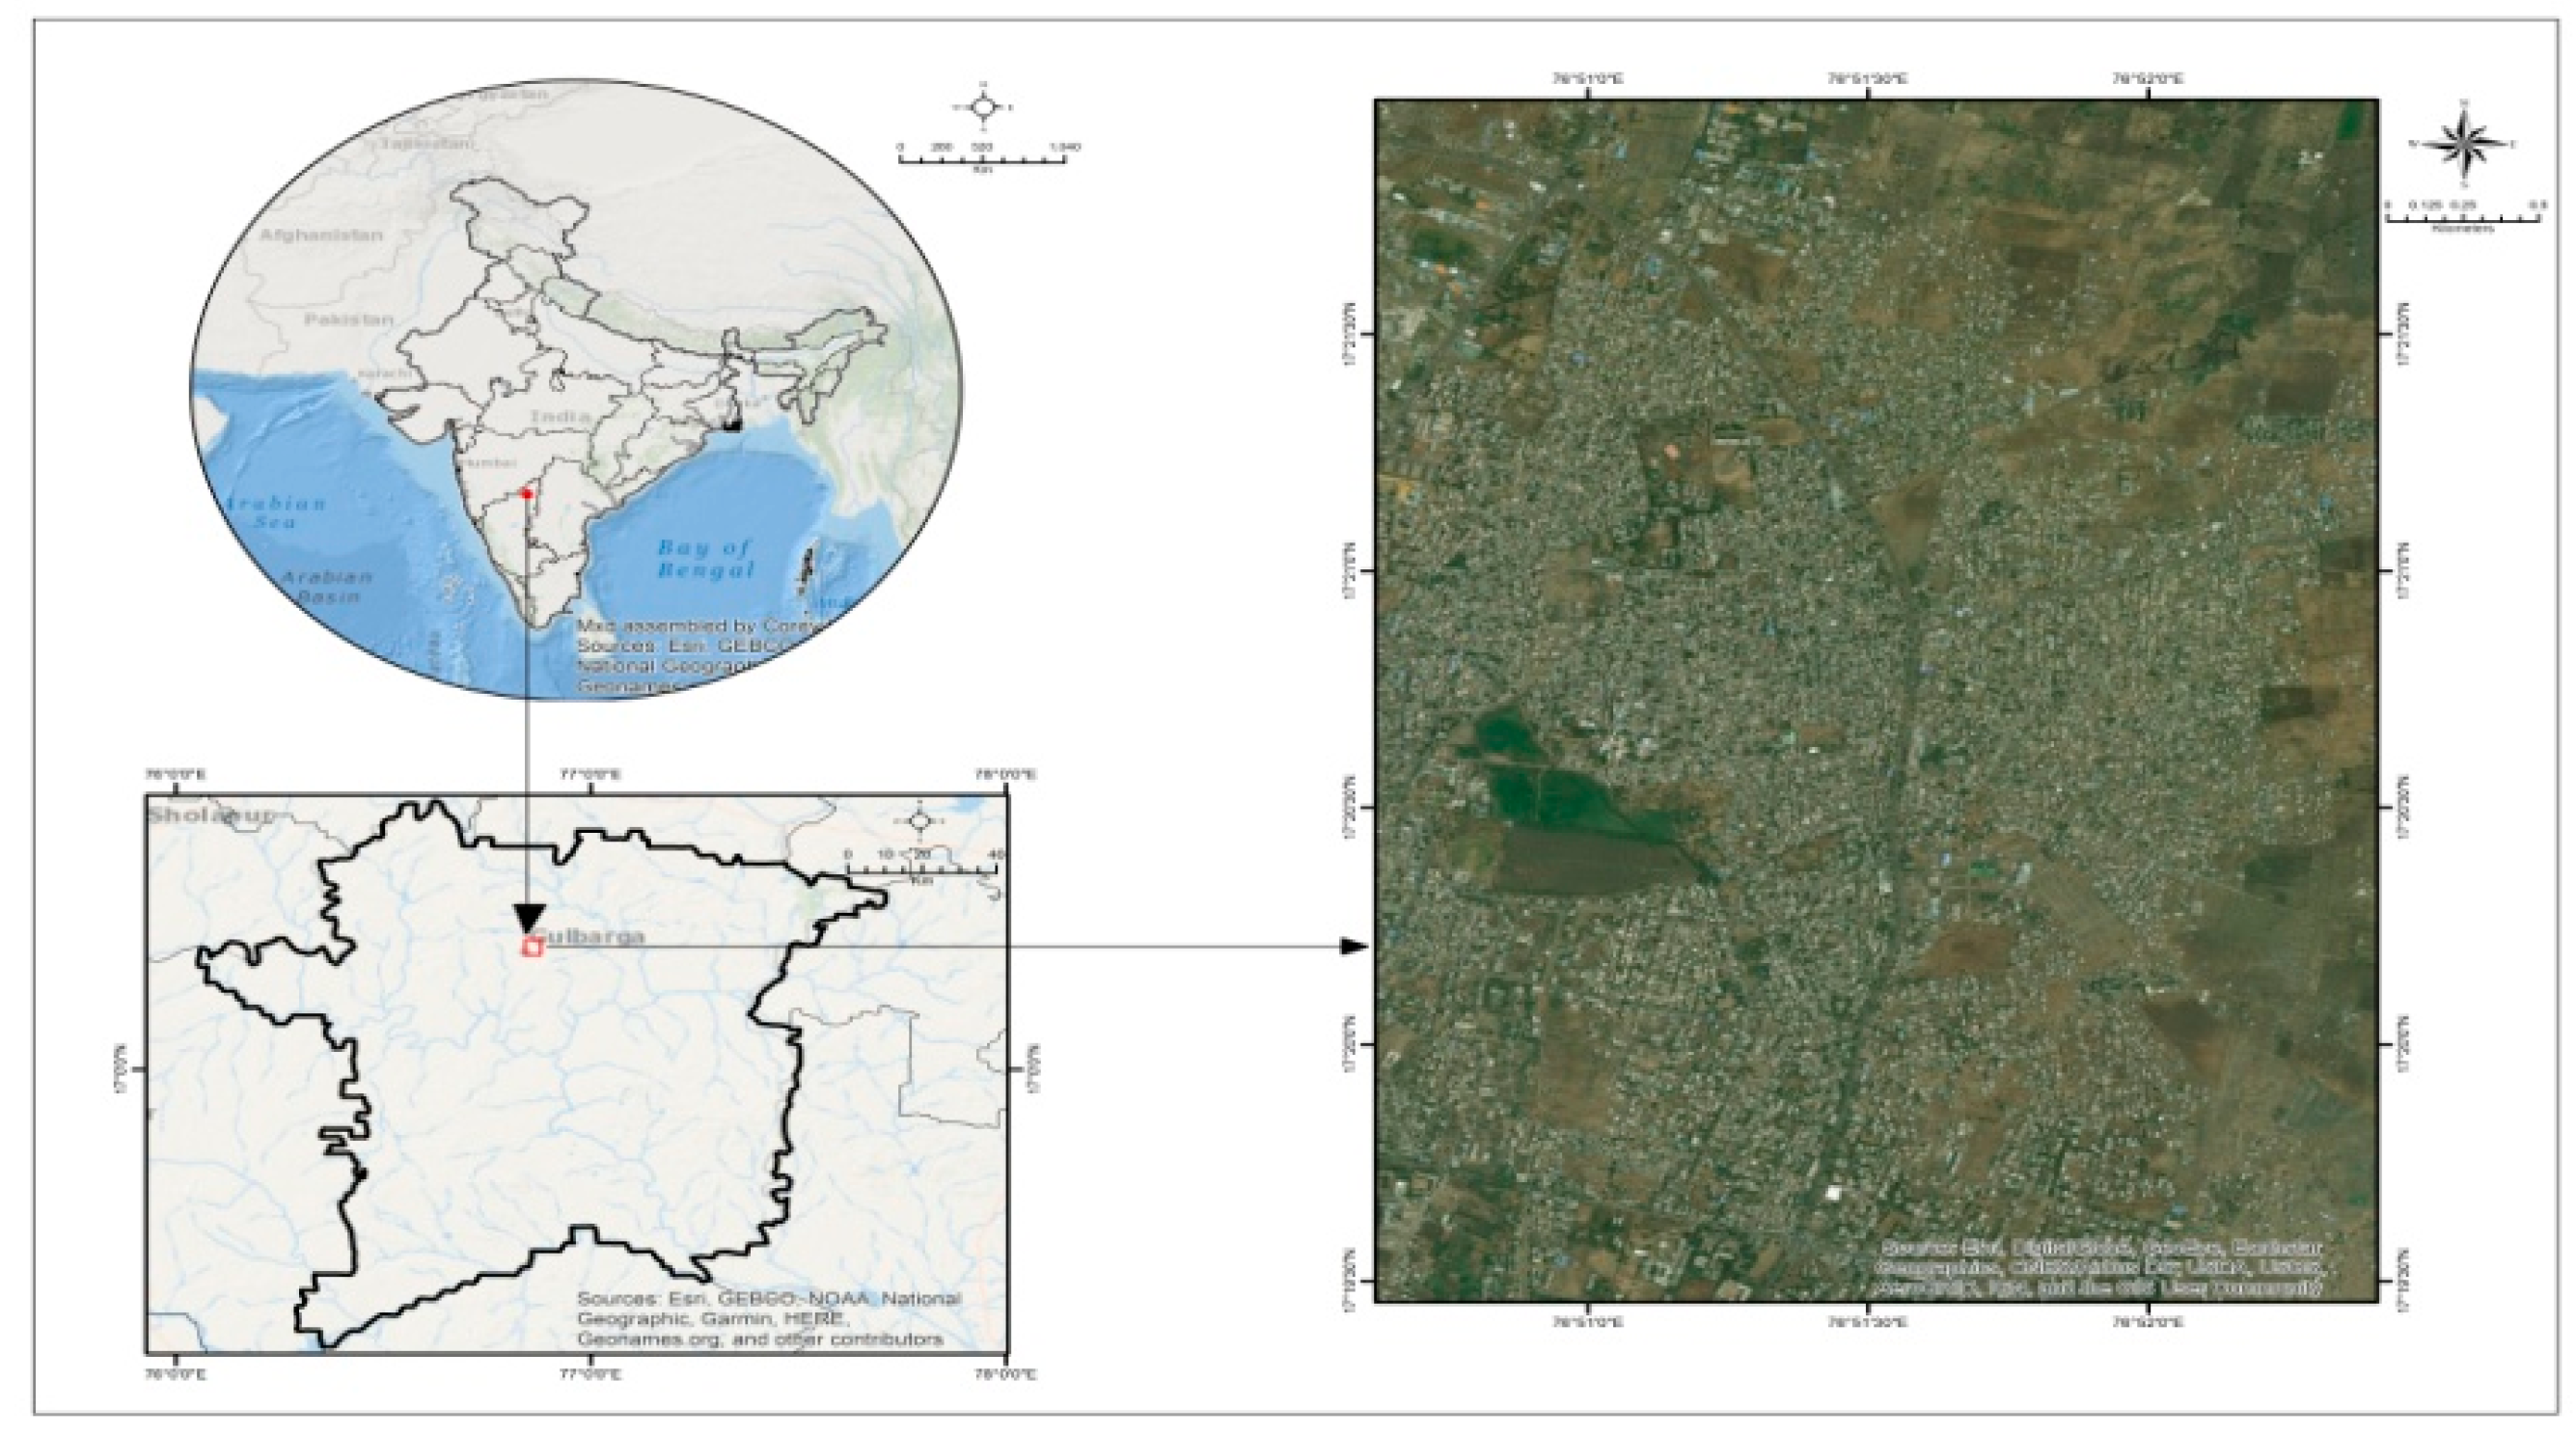
The study area chosen is Kalaburagi, a growing urban sphere located at the north eastern part of Karnataka state. It extends between 76°04’ and 77°42’ East longitude, and 17°12’ and 17°46’ North latitude. A portion of the core urban area is considered for this study covering an area of about 18.9 Sq·Km shown in Figure 1.

Figure 1.
Location of study area.
3.2. Datasets
Sentinel 2, multispectral dataset and AVIRIS NG, hyperspectral imagery obtained from spaceborne and airborne platforms are used for this study. Sentinel 2 multispectral imager is developed and operated by the European Space agency (ESA) that renders information in13 spectral bands, ranging from 443–2190 nm with multiple spatial resolution of 10 m, 20 m, and 60 m.
Imaging spectroscopy data is acquired from AVIRIS NG reflectance corrected level 2 data ranging from 376–2500 nm with a ground sampling distance of 4–8 m and a sampling interval of 5 nm. Spectral responses of these datasets are observed and bands that are highly informative are taken into account. The datasets acquired is represented in the form of 402*472 pixels that comprise spectral information of bands that are dimensionally reduced.
3.3. Methodology
The satellite datasets were processed to fulfil the purpose of this study. The implemented operation is explained briefly in Figure 2. and in the following subsections.
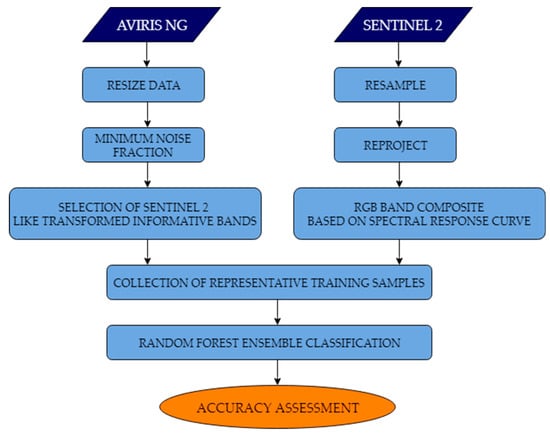
Figure 2.
Formalized workflow.
3.3.1. Dimensionality Reduction
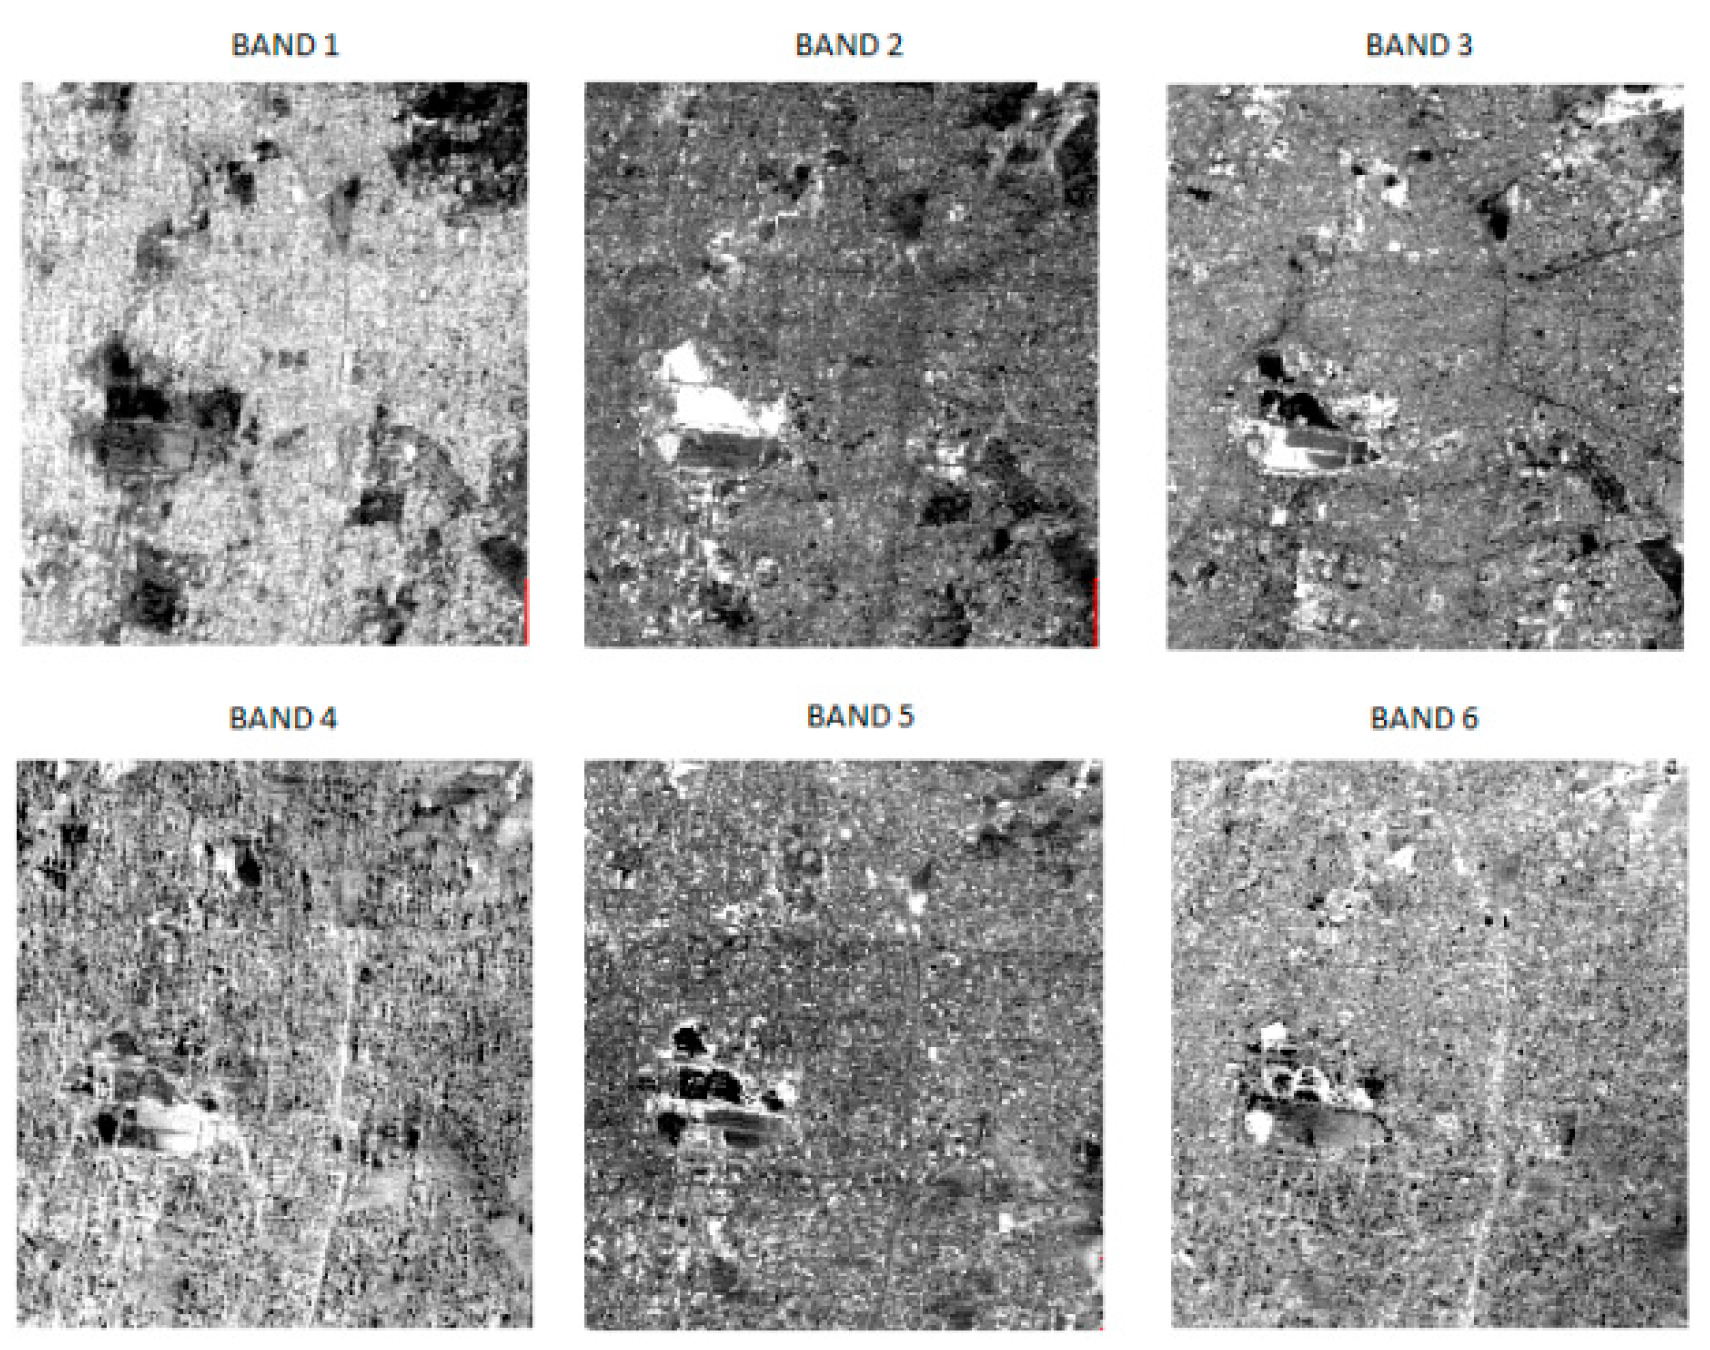
The dimensionality reduction process reduces spectral data by applying mathematical transformations that are a linear combination of all input bands. As the numbers of bands are contiguous and narrow in AVIRIS NG, discrete set of bands are chosen for performing classification. Transformation is applied to decorrelate and rescale the noise present in raw imagery. The characteristic dimensionality in the data is investigated through the associated eigenvalues. For this study, MNF transform, an unsupervised dimensionality reduction technique [14], is incorporated for AVIRIS NG reflectance corrected imagery containing a total of 425 bands. Covariance matrix computation followed by eigenvalue decomposition is the first phase of MNF transform. This phase continues to reduce the decorrelation thus normalizing the linear noise from the image by the process called ‘noise whitening’. The results will define a high signal-to-noise ratio that decreases towards lower order which are noise dominated. Associated eigenvalue elements of higher order (>1) renders bands that are highly informative when compared to that of values near 1. For this study, bands ranging from λ20 = 471 nm to λ194 = 1358 nm, λ218 = 1463 nm to λ283 = 1788 nm and λ330= 2024 nm to λ411 = 2500 nm where λk is kth spectral band with its corresponding wavelength and a total of 323 bands from 425 are chosen thus eliminating water absorption and redundant bands. The covariance statistics that normalizes the noise in the image is computed in a forward MNF rotation. Later, the eigenvector matrixes with corresponding eigenvalues for the selected MNF components are displayed, from which eigenvalues (>3) mentioned in Table 1 containing almost 6 bands that are shown in Figure 3 are selected as the benchmark study region for Kalaburagi.

Table 1.
Eigen values for MNF transformed bands.
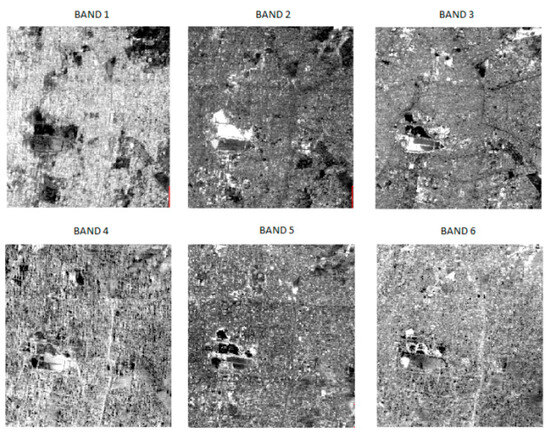
Figure 3.
MNF transform.
3.3.2. SNAP Processing
Sentinel Application Platform (SNAP) is a specially designed package for processing ESA’s products. Sentinel 2 multispectral dataset having varied spatial resolutions needs to be equalized and hence resampled andreprojected for further processing. Spectral consistency is examined for Sentinel 2 bands that are capable to suit for urban applications and it is perceived that bands ranging from λ3 = 550 to 580 nm, λ4 = 640 to 670 nm, and λ8 = 780 to 900 nm are ideal for classification. The rest of the bands from the spectrum arediscarded as they strongly affect the atmospheric transmissivity at a certain wavelength.
3.3.3. Transformation of Dimensionally Reduced AVIRIS NG to Sentinel 2–Like Dataset
The reflectance corresponding to the spectral bands of AVIRIS NG are used to derive alike reflectance values from Sentinel 2 by analyzing the spectral response functions [3]. Reflectance spectra are compared and concatenated through weighted mean of the reflectance values determined using linear interpolation that is dependent upon spectral response function normalized to 1. Spectral bands that are dimensionally reduced having distinct and perceptible land cover features from both the datasets are examined for representative training sample collection. Physical features that disclose homogeneity with equivalent spatial and spectral properties are counted in this study. Visually clear land cover patterns that appear distinct in both the datasets are included in order to obtain better classified results. The MNF transformed bands of the hyperspectral imagery apparently provides clear cut details when compared to that of the multispectral imagery due to its finer resolution and low ground sampling distance. Focusing on image classification, it should be evident that the bands representing obviously ample information along the spectrum should be taken into account. It is observed that, MNF transformed bands 1, 3, and 4 of AVIRIS NG of range λk > 1900 nm are considered equivalent to bands 8, 4, and 3 of Sentinel 2 where λk > 850 nm are with specified analogy revealing urban information. Thus, the bands associated with similar reflectance properties of reliable urban information are equated and chose as input for further classification process.
4. Results and Discussion
4.1. Random Forest Classifier
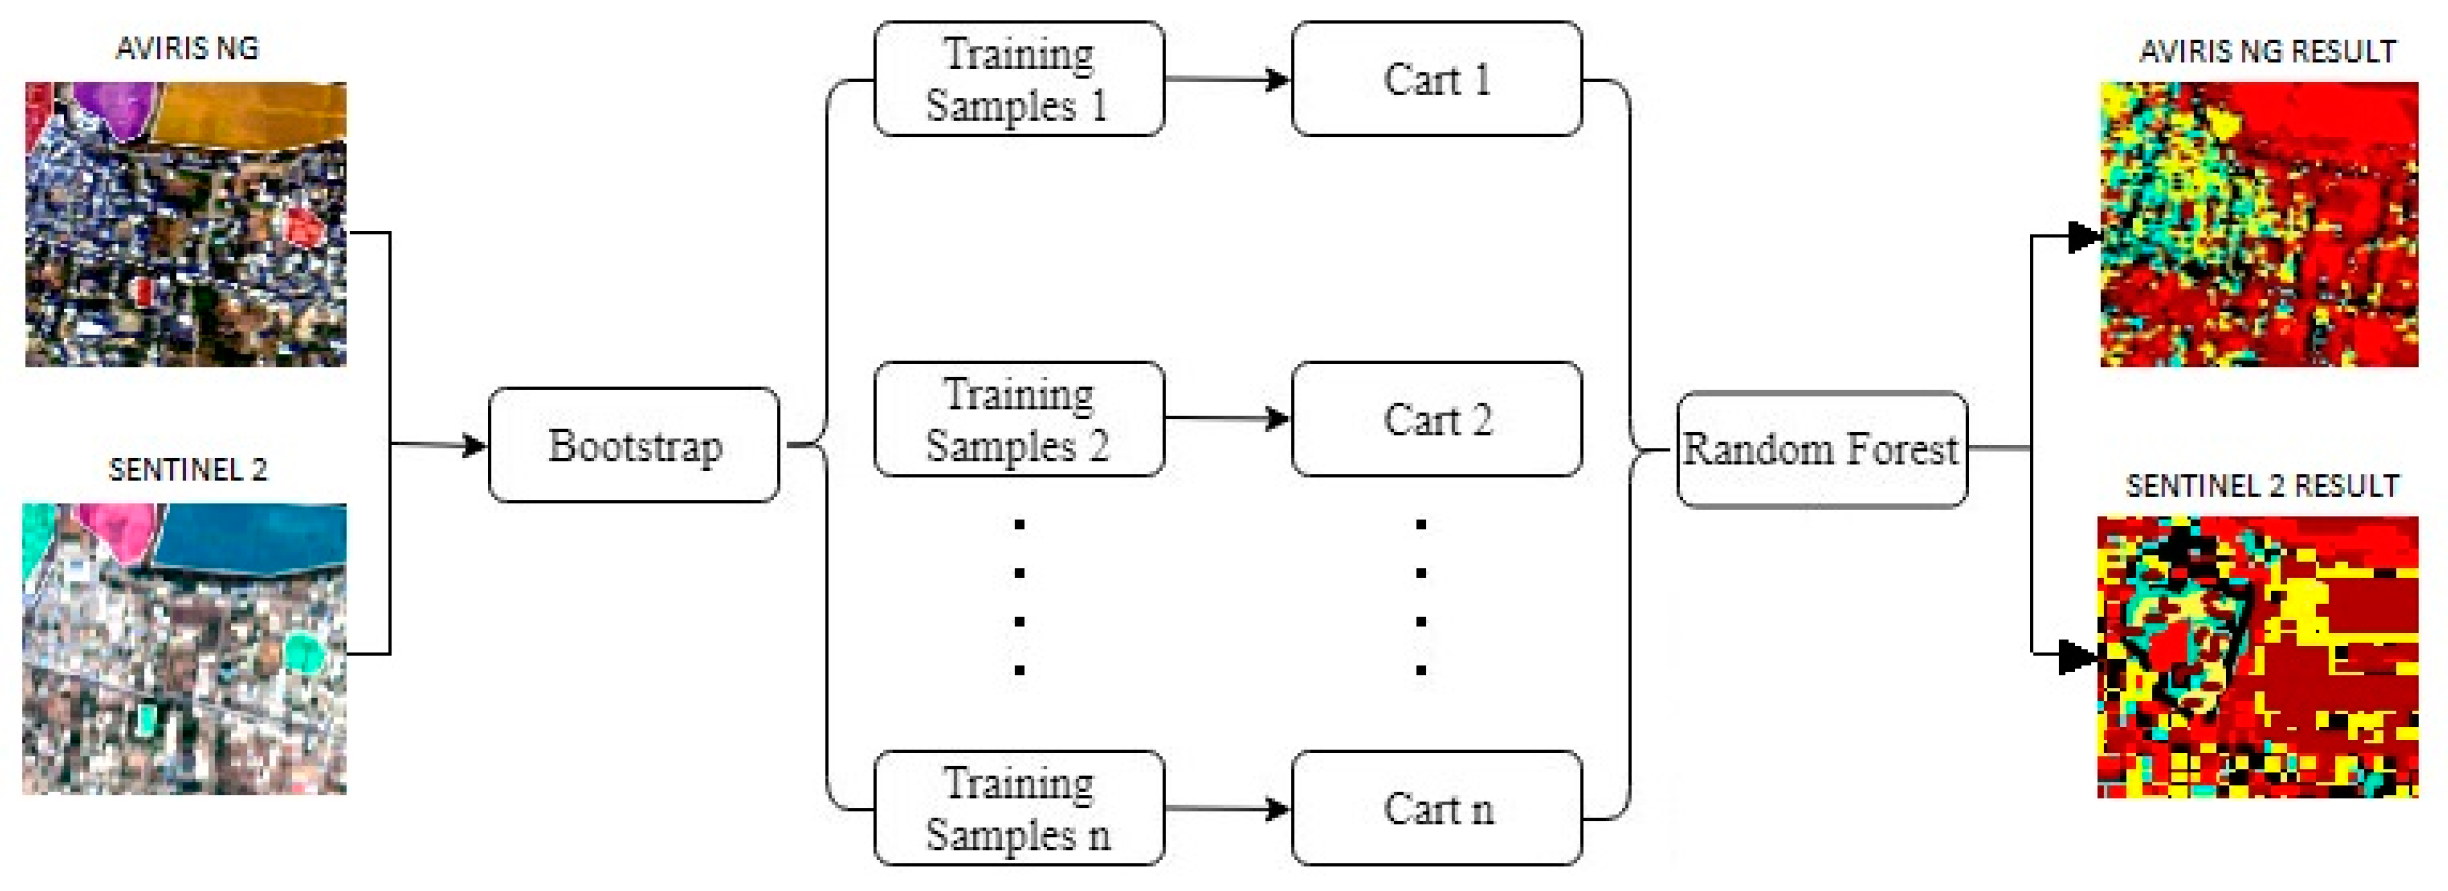
The supervised algorithm random forest uses bagging/bootstrap, an ensemble aggregation method, for estimating statistical quantities from samples and creates multiple models from single training dataset. Representative training samples are assigned for desired LULC classes that are structurally similar and works better for accurate predictions. For each of the five given bootstrap samples taken from the training dataset, some samples remain and are left out of the bag that are averaged to estimate accuracy. Figure 4 represents the classification and regression tree (CART) analysis employed for AVIRIS NG and Sentinel 2 sensor datasets.
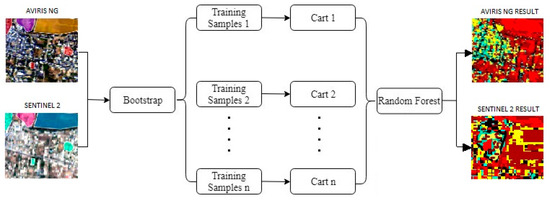
Figure 4.
Framework of random forest classifier.
4.2. Accuracy Assessment
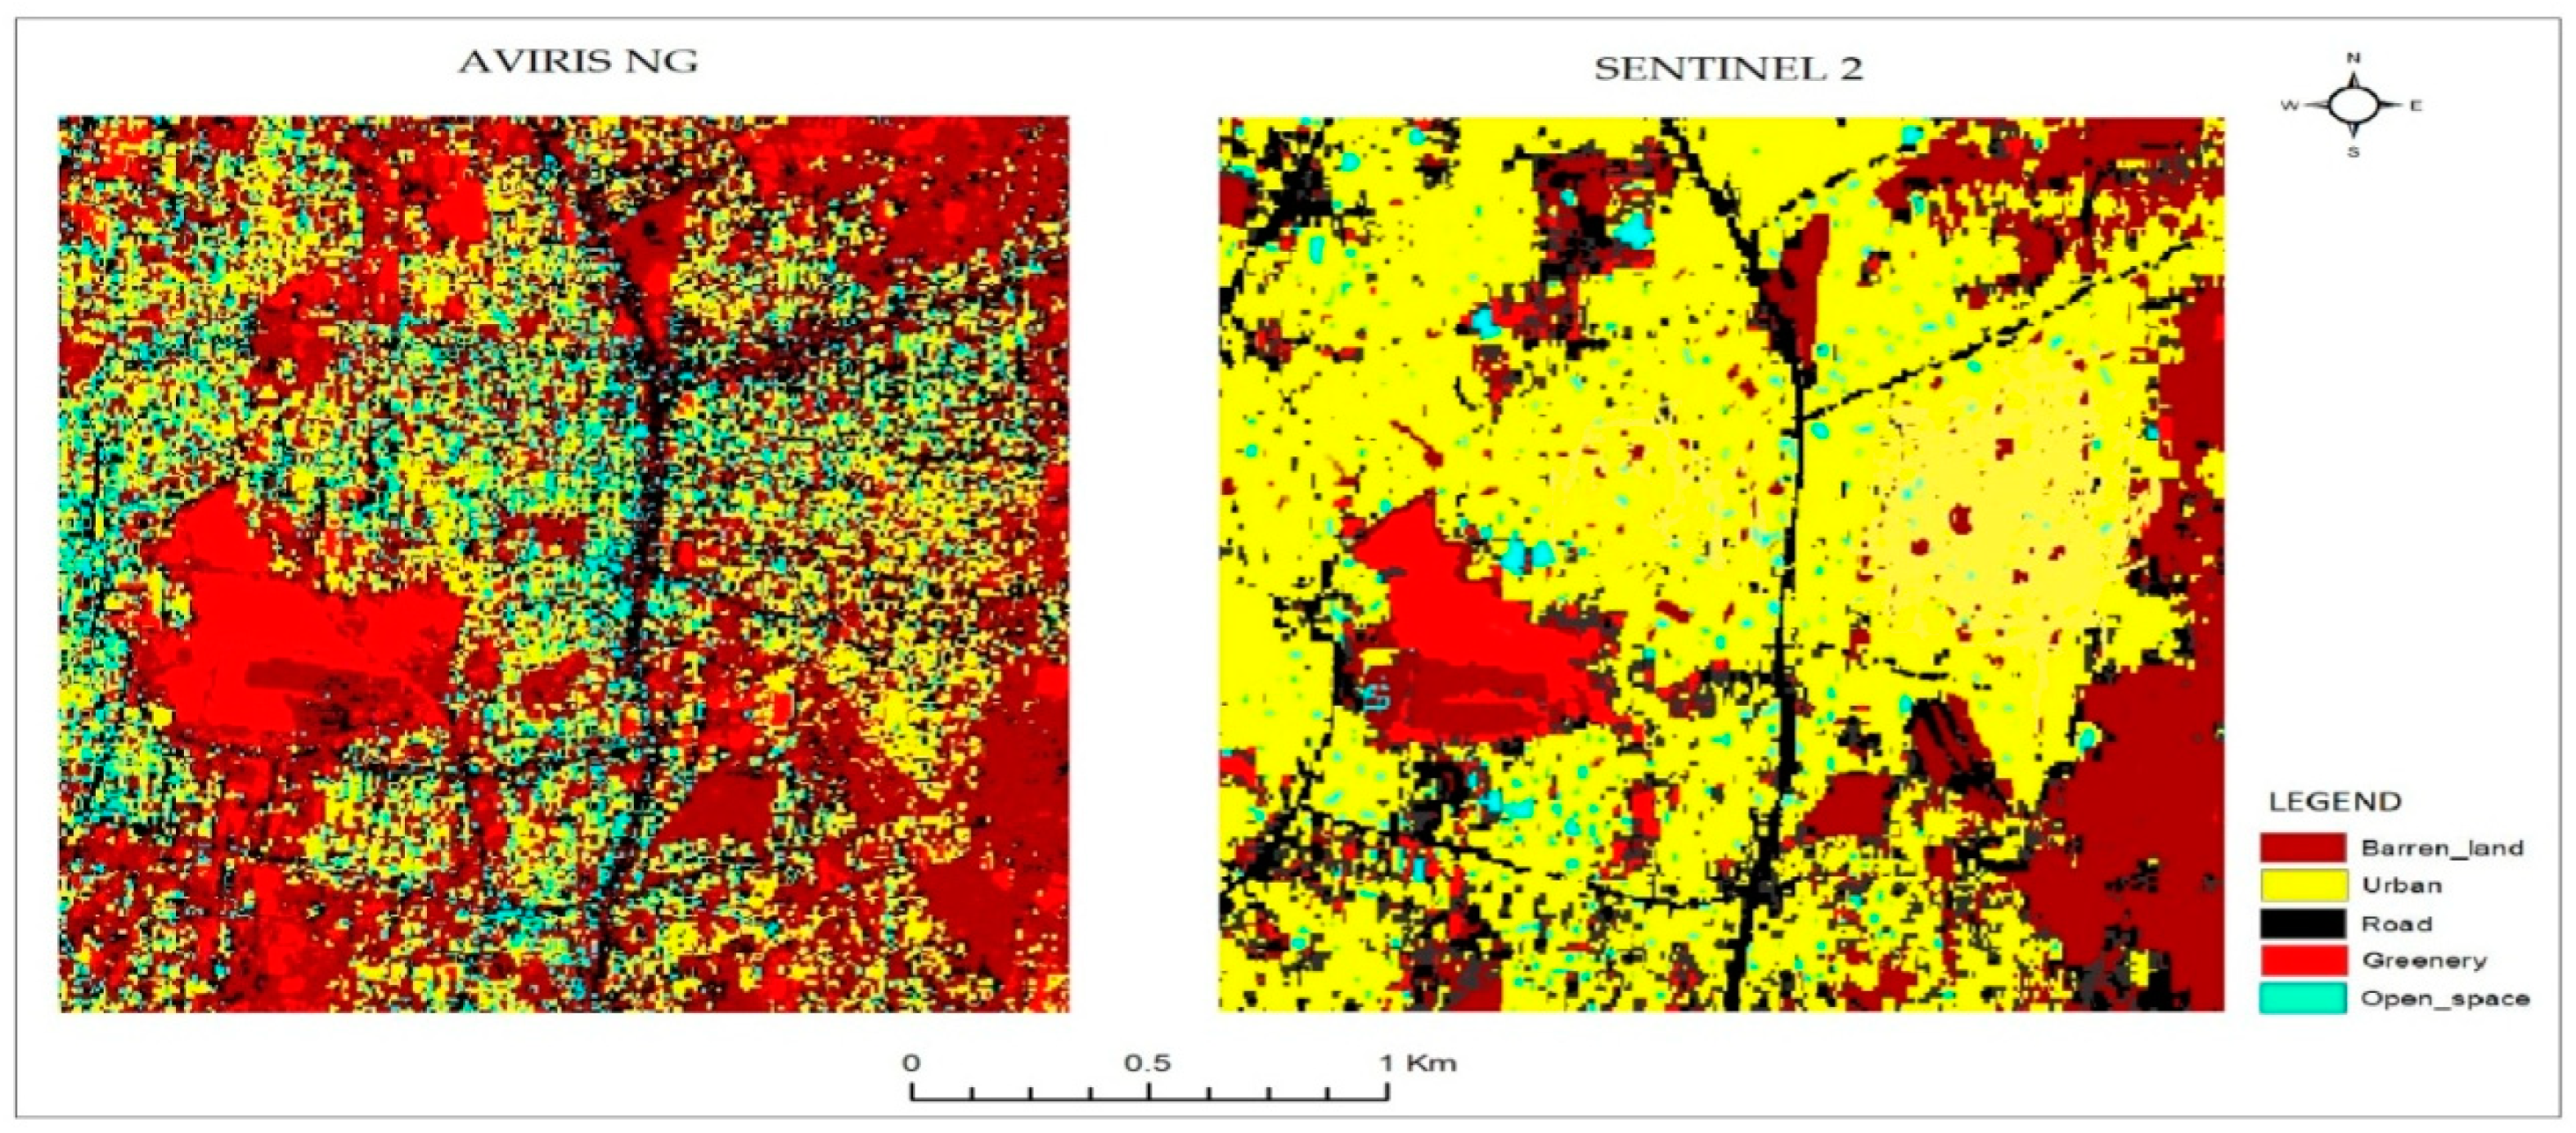
From the above classified results shown in Figure 5, it is estimated that the overall accuracy is higher for AVIRIS NG hyperspectral data than Sentinel 2 MSI for the assigned LULC classes. The assigned samples outperforms well for AVIRIS NG dimensionally reduced data as the results could be compared from Table 2. Features of Sentinel 2 that end up with low scores might have been strongly biased towards variables with many categories. The mean of individual class wise accuracy for AVIRIS NG and Sentinel 2 are 94.2% and 88.6%, respectively.
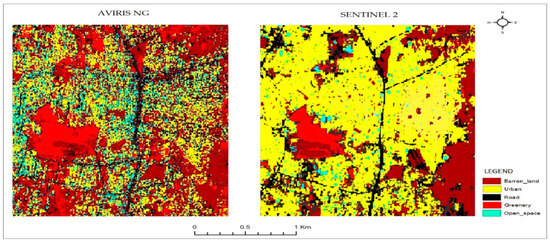
Figure 5.
Classified result of using RF algorithm.
Table 2.
Accuracy results for random forest classifier.
5. Conclusions
Hyperspectral airborne AVIRIS NG with highest ground sampling distance yielded better classified output as like original data. Significant dimensionality reduction by applying MNF has improved the quality of bands by rendering minute details of the original sensor imagery. Since MSI data has a lower resolution, pixels associated with samples were misclassified, thus slackening accuracy. The scope of this paper clearly fulfils that hyperspectral data AVIRIS NG outperforms well when incorporating ensemble random forest supervised classification when compared with multispectral Sentinel 2. Also, a multispectral dataset being a good source of information addresses effects related to spatial resolution that can be improvised through image fusion techniques with hyperspectral imagery are beyond the scope of this paper and remain as a future work.
Author Contributions
Conceptualization & Analysis, K.N.P. and V.S.; Writing—Original Draft Preparation, K.N.P. and V.S.; Review& Editing, S.S. and K.B.; Supervision, S.S. and K.B.; Funding Acquisition, S.S.
Funding
This research was carried out under the support of DST funded Network Project on Imaging Spectroscopy & Applications (NISA).
Conflicts of Interest
The authors declare no conflict of interest.
References
- Zhang, T.X.; Su, J.Y.; Liu, C.J.; Chen, W.H. Potential Bands of Sentinel-2 A Satellite for Classification Problemsin Precision Agriculture. Int. J. Autom. Comput. 2018, 16, 16–26. [Google Scholar] [CrossRef]
- Nivedita Priyadarshini, K.; Kumar, M.; Rahaman, S.A.; Nitheshnirmal, S. A Comparative Study of Advanced Land Use/Land Cover Classification Algorithms Using Sentinel-2 Data. In Proceedings of the 2018 ISPRSTCV Mid-term Symposium “Geospatial Technology–Pixel to People”, Dehradun, India, 20–23 November 2018; pp. 665–670. [Google Scholar] [CrossRef]
- Weinmann, M.; Maier, P.M.; Florath, J.; Weidner, U. Investigations on the potential of hyperspectral and Sentinel-2 data for land-cover/land-use classification. In Proceedings of the 2018 ISPRSTCI Mid-Term Symposium “Innovative Sensing–From Sensors to Methods and Applications”, Karlsruhe, Germany, 10–12 October 2018; pp. 155–162. [Google Scholar] [CrossRef]
- Segl, K.; Guanter, L.; Kaufmann, H.; Schubert, J.; Kaiser, S.; Sang, B.; Hofer, S. Simulation of spatial sensor characteristics in the context of the EnMAP hyperspectral mission. IEEE Trans. Geosci. Remote Sens. 2010, 48, 3046–3054. [Google Scholar] [CrossRef]
- Thenkabail, P.S.; Enclona, E.A.; Ashton, M.S.; Van Der Meer, B. Accuracy assessments of hyperspectral wave band performance for vegetation analysis applications. Remote Sens Env. 2004, 91, 354–376. [Google Scholar] [CrossRef]
- Benediktsson, J.A.; Palmason, J.A.; Sveinsson, J.R. Classification of hyperspectral data from urban areas based on extended morphological profiles. IEEE Trans. Geosci. Remote Sens. 2005, 43, 480–491. [Google Scholar] [CrossRef]
- Huang, X.; Han, X.; Zhang, L.; Gong, J.; Liao, W.; Benediktsson, J.A. Generalized Differential Morphological Profiles for Remote Sensing Image Classification. IEEE J. Sel. Top. Appl. Earth Obs. Remote Sens. 2016, 9, 1736–1751. [Google Scholar] [CrossRef]
- Camps-Valls, G.; Tuia, D.; Bruzzone, L.; Benediktsson, J.A. Advances in hyperspectral image classification: Earth monitoring with statistical learning methods. IEEE Signal Process. Mag. 2014, 31, 45–54. [Google Scholar] [CrossRef]
- Eismann, M.T. Hyperspectral Image Classification. In Hyperspectral Remote Sensing; SPIE digital library: Bellingham, WA, USA, 2012. [Google Scholar] [CrossRef]
- Frassy, F.; Dalla Via, G.; Maianti, P.; Marchesi, A.; Nodari, F.R.; Gianinetto, M. Minimum noise fraction transform for improving the classification of airborne hyperspectral data: Two case studies. In Proceedings of the 5th Workshop on Hyperspectral Image and Signal Processing: Evolution in Remote Sensing (WHISPERS), Gainesville, FL, USA, 26–28 June 2013; pp. 1–4. [Google Scholar] [CrossRef]
- Plaza, A.; Martínez, P.; Plaza, J.; Pérez, R. Spectral analysis of hyperspectral image data. In Proceedings of the Advances in Technique for Analysis of Remotely Sensed Data, IEEE Workshop, Greenbelt, MD, USA, 2003; pp. 298–307. [Google Scholar] [CrossRef]
- Iordache, M.-D.; Bioucas-Dias, J.M.; Plaza, A. Sparse unmixing of hyperspectral data. Geoscience and Remote Sensing. IEEE Trans. 2011, 49, 2014–2039. [Google Scholar] [CrossRef]
- Belgiu, M.; Drăguţ, L. Random forest in remote sensing: A review of applications and future directions. Isprs J. Photogramm. Remote Sens. 2016, 114, 24–31. [Google Scholar] [CrossRef]
- Green, A.A.; Berman, M.; Switzer, P.; Craig, M.D. A transformation for ordering multispectral datain terms of image quality with implications for noise removal. Trans. Geosci. Remote Sens. 1988, 26, 65–74. [Google Scholar] [CrossRef]

Publisher’s Note: MDPI stays neutral with regard to jurisdictional claims in published maps and institutional affiliations. |
© 2019 by the authors. Licensee MDPI, Basel, Switzerland. This article is an open access article distributed under the terms and conditions of the Creative Commons Attribution (CC BY) license (https://creativecommons.org/licenses/by/4.0/).