Abstract
This paper investigates the relationship between the gross value added (GVA) of Greece’s agricultural sector and the GVAs of the other sectors. The research considers both the relationship between value levels and the cycles of GVAs. Dynamic analysis using ARDL modeling shows that there is no cointegration between agricultural GVA and the other GVAs. However, there is an estimated cointegrating relationship between business cycles of agriculture and those of the rest of the economic sectors, with the cycles of services being the significant variable. Moreover, econometric analysis using NARDL modeling shows that there is a cointegrating relationship between the levels of GVAs as well, when asymmetricity—with respect to GVA changes of the services sector—is introduced.
1. Introduction
This paper investigates the relationship between agricultural value added (GVA) and the GVAs of the other economic sectors, and the relationship between farm business cycles and the other sectoral business cycles as well. Analysis and estimates refer to the Greek economy and the non-farm sectors, which are classified as industry, construction and services. The results provide information on a significant aspect of linkages between the farm and non-farm economy in the process of growth and transformation, as well as the relationship of their cyclical behavior. Understanding such linkages and relationships is useful to decision makers when sectoral policy measures and growth incentives are devised.
Structural transformation is a prominent feature of economic growth and is regarded as one of the main stylized facts of development [1]. Several studies have been conducted regarding the co-movement of different sectoral outputs [2]. Some investigate such linkages within the context of the Real Business Cycles theory [3]. Empirical research regarding fluctuations in crop output relies heavily on weather shocks and climate changes [4].
However, econometric investigations of the relationship between outputs or the GVA of agriculture and other sectors are limited. Ref. [5] suggests that all economic sectors’ outputs are integrated in China, and highlights the prevalence of agriculture in driving other sectors’ growth. Ref. [6] supports that Indian sectoral outputs move together and that sectoral growths are interdependent. Regarding the Greek agriculture, ref. [7] argues that linkages between the farm and non-farm sectors are weak. In addition to these studies with variables used at their levels, ref. [8] examined farm business cycles in the U.S. and concluded that they are not correlated with the rest of the economy.
Dynamic analysis shows that even though cointegrating relationships at the variable levels were not found using the ARDL model, when changes in the GVA time series of services are decomposed into positive and negative ones, the estimated NARDL model shows that a significant and negative asymmetric long-term relationship between the GVAs of agriculture and services does exist. In addition, an ARDL model confirms that between the cyclical behavior of GVAs of agriculture and services, there is a significant negative cointegrating relationship.
2. Materials and Methods
We use an annual time series (1960–2020) of sectoral GVAs (at 2015 constant prices) on a logarithmic scale. Deviations of sectoral GVA time-series are taken from the estimation of their trend to estimate their cyclical components, applying the Hodrick–Prescott (HP) filter, despite severe criticisms [9], the Butterworth (BW), the Baxter–King (BK) and the Christiano–Fitzgerald (CF) filters. Results show that the choice of filters does not alter the general picture of cyclical behavior.
The approach initially applied is based on the linear ARDL (p,q) model [10]. We adopted the respective ECM (Error Correction Model) and used it at levels and cyclical components only. In cyclical behavior studies in particular, it has been used to investigate the cointegrating relationship between business cycles of different countries [11]. It is given by Equation (1):
where Y refers to log GVA of agriculture while X refers to the log GVAs of non-farm sectors.
Asymmetric effects can be searched for and taken under consideration using the NARDL model as per [12]. Decomposing the (kx1) vector of in positive and negative partial sums of total increases and decreases, that is, , with , we derive the relevant nonlinear ECM. The model can and should be applied only at levels since detrended cycle values cannot be decomposed. NARDL applications in agricultural economics are found in [13].
3. Results
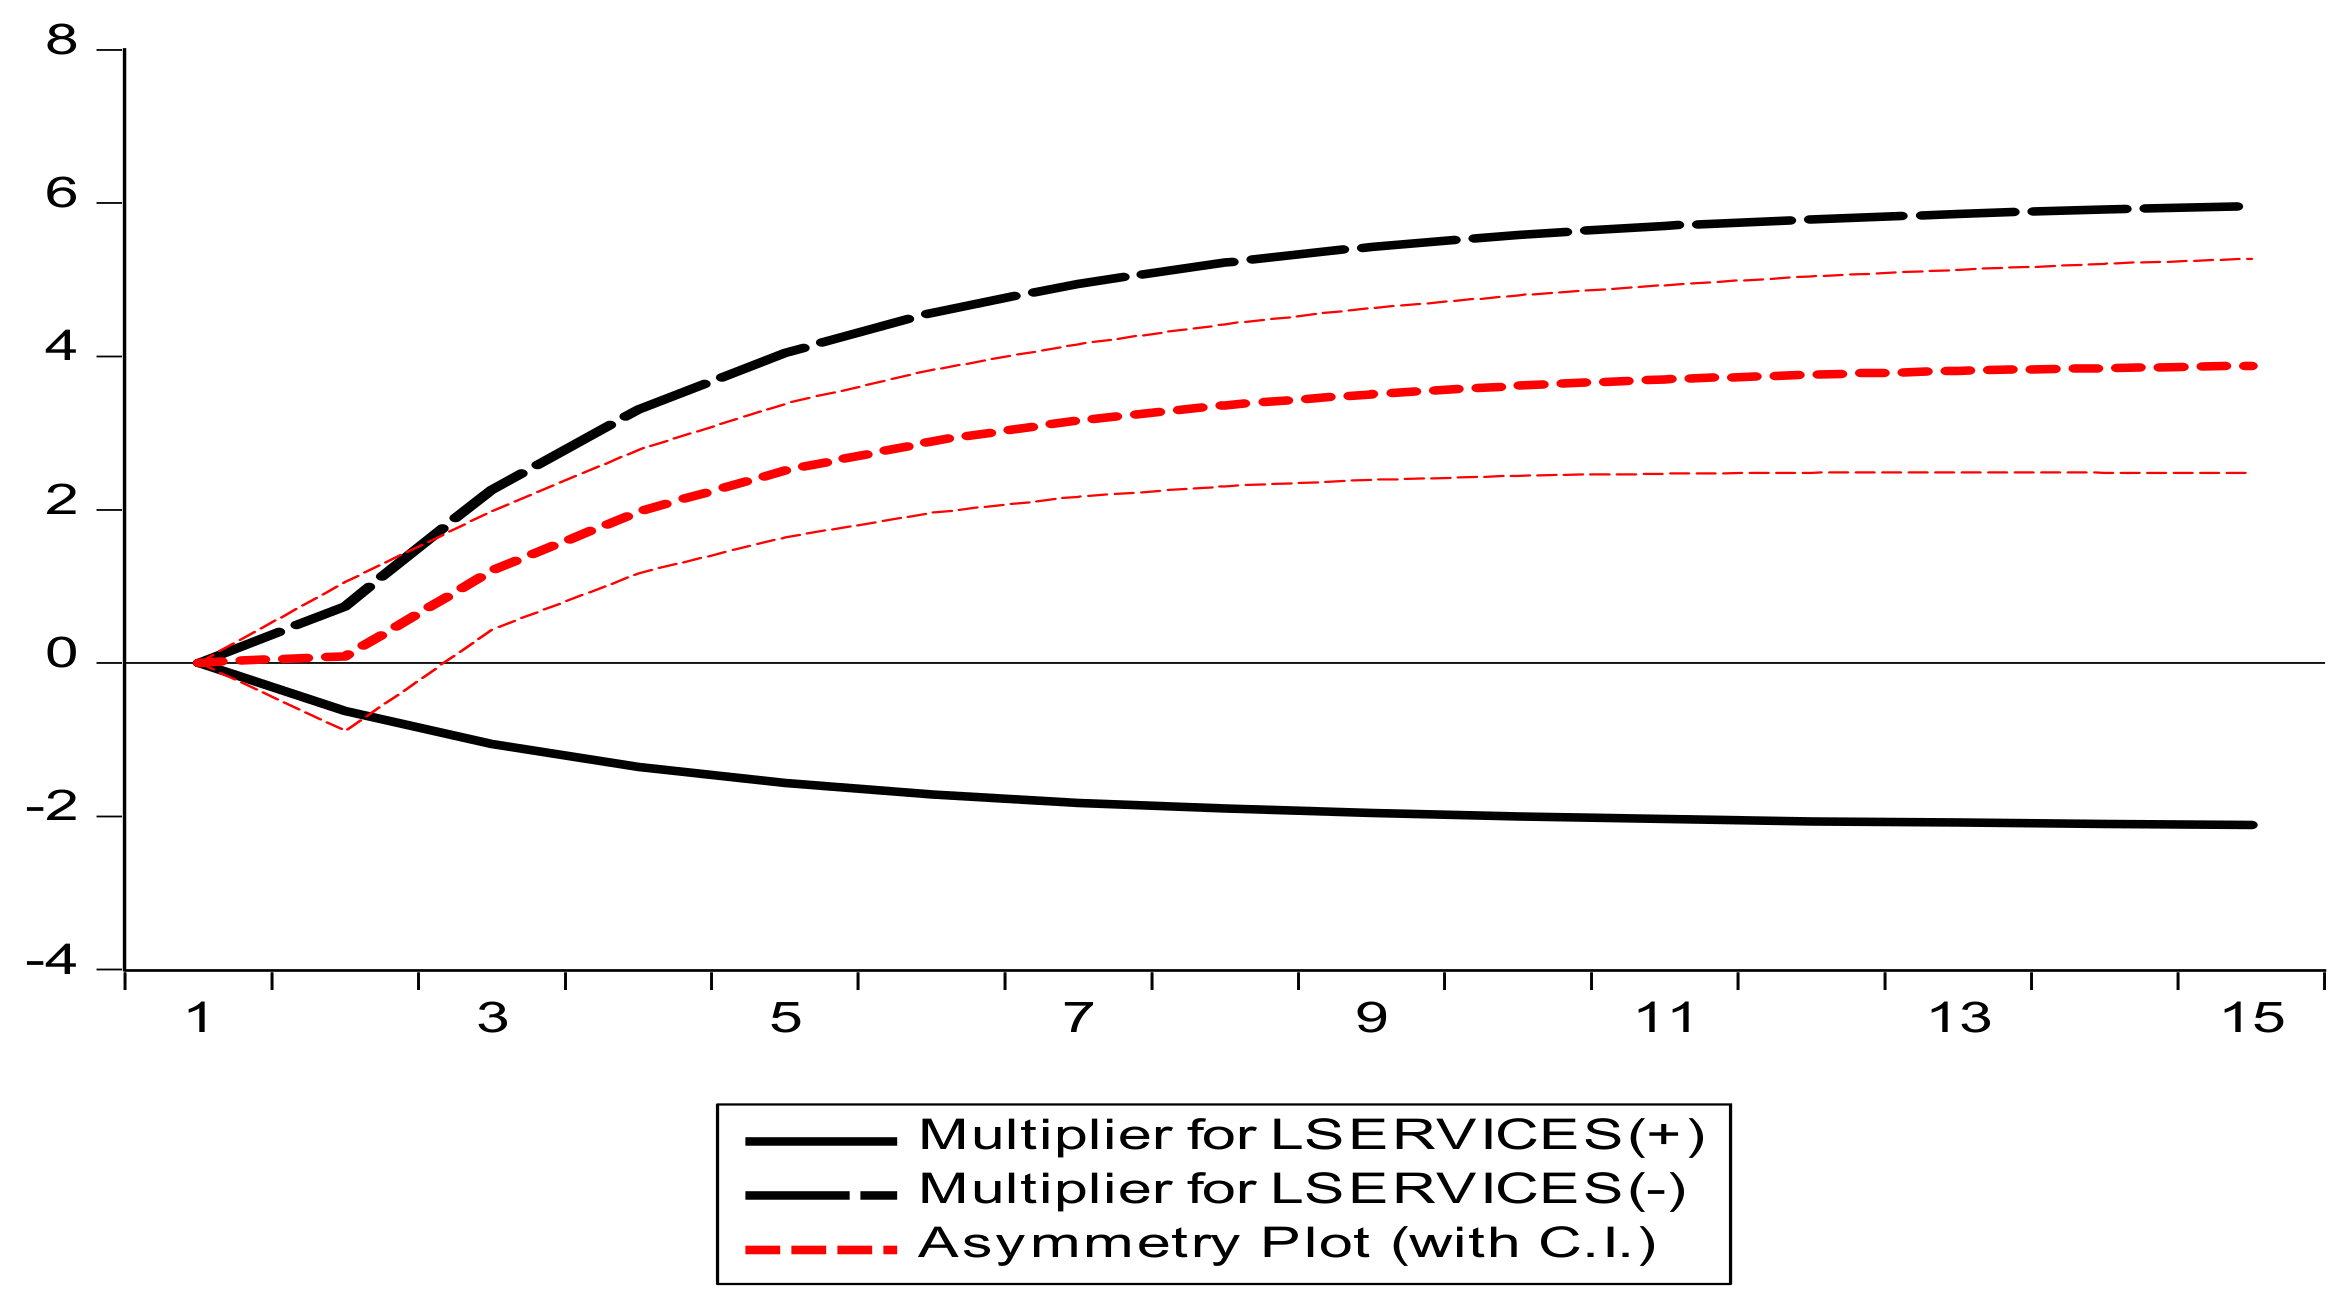
An estimation of the ARDL model rejects the hypothesis of the existence of a linear long-term relationship between the sectoral GVAs, since the FPSS-stat (1.86) is well below the upper and lower bounds’ critical values (3.63 and 2.45, respectively). However, when asymmetry is considered and an NARDL model is implemented, a significant cointegrating relationship is found between the variables at their log levels (FPSS-stat = 3.48, p-value (0.05)). Considering that structural change has to do with the continuous growth of services, in accordance with the practice in the literature of selecting a variable as the asymmetric one, the variable treated as such is the GVA of services. The estimated long-run asymmetric equilibrium relationship, derived by the appropriate process after the estimation of the NARDL model, is given by Equation (2):
where ln denotes the log values of GVA for agriculture (), construction (), industry (), and services (), while and are the total increases and decreases in the log GVA up to time t. To check for statistically significant differences between and , the Wald test is applied and the results reject the hypothesis of long-term symmetry. This becomes apparent at the dynamic multipliers graph (Figure 1).
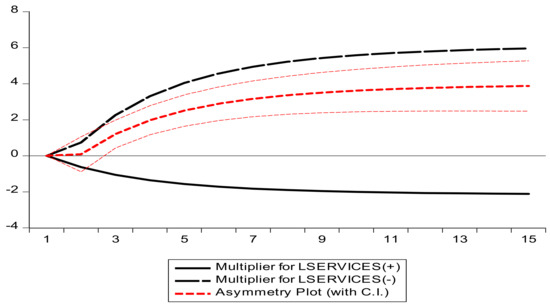
Figure 1.
Dynamic multipliers.
In order to investigate the existence of a long-run equilibrium relationship between the cyclical components of agricultural GVA and the other sectoral GVAs, the linear ARDL model is deployed. Four different models are estimated (corresponding to different filters of detrending) and a linear long-term equilibrium relationship is supported, as the model F-values show, which also confirms the negative relationship between the products of the agricultural and services sectors (Table 1).

Table 1.
Dynamic symmetric estimations (cycles) 1.
4. Discussion
The Greek economy has undergone a structural transformation from an agricultural-based economy to a service-based economy. This shift reflects a negative long-run relationship between the two sectors as the share of agricultural employment and output declines over time. The findings of an asymmetric relationship between the agricultural and service sectors at the level of their values added suggest that there may be additional factors at play. Agriculture seems to be rising faster when economic conditions and services deteriorate, while its reduction in times of service growth follows slower rates.
The service sector is generally considered to be more dynamic and responsive to changes in demand compared to the agricultural sector, which is more dependent on production lags and external factors such as weather conditions and natural disasters. Demand changes in growth periods also reflect more on services. As a result, changes in the service sector may have a greater correlation with economic reverse situations compared to the agricultural sector. During economic downturns or recessions, the service sector may be more vulnerable to declining demand and may experience a more severe contraction than the agricultural sector. Finally, the detrended cyclical behavior of the two sectors and their negative significant relationship is also confirmed.
Future research could focus on the investigated linkages using data from other countries. This would shed more light into relationships of structural changes during the growth processes.
Author Contributions
Conceptualization, C.P.P. and C.T.P.; methodology, C.P.P. and C.T.P.; software, C.P.P.; validation, C.P.P. and C.T.P.; formal analysis, C.P.P. and C.T.P.; investigation, C.P.P. and C.T.P.; resources, C.P.P.; data curation, C.P.P.; writing—original draft preparation, C.P.P.; writing—review and editing, C.P.P. and C.T.P.; visualization, C.P.P.; supervision, C.T.P.; project administration, C.P.P. and C.T.P.; funding acquisition, C.T.P. All authors have read and agreed to the published version of the manuscript.
Funding
This research received no external funding.
Institutional Review Board Statement
Not applicable.
Informed Consent Statement
Not applicable.
Data Availability Statement
Data confirming the reporting results are available at the links: https://economy-finance.ec.europa.eu/economic-research-and-databases/economic-databases_en (accessed on 7 March 2023).
Conflicts of Interest
The authors declare no conflict of interest.
References
- Bustos, P.; Caprettini, B.; Ponticelli, J. Agricultural Productivity and Structural Transformation: Evidence from Brazil. Am. Econ. Rev. 2016, 106, 1320–1365. [Google Scholar] [CrossRef]
- Carvalho, V.; Gabaix, X. The Great Diversification and Its Undoing. Am. Econ. Rev. 2013, 103, 1697–1727. [Google Scholar] [CrossRef]
- Rebelo, S. Real Business Cycle Models: Past, Present and Future. Scand. J. Econ. 2005, 107, 217–238. [Google Scholar] [CrossRef]
- Deschênes, O.; Greenstone, M. The Economic Impacts of Climate Change: Evidence from Agricultural Output and Random Fluctuations in Weather. Am. Econ. Rev. 2012, 102, 3761–3773. [Google Scholar] [CrossRef]
- Yao, S. Cointegration Analysis of Agriculture and Non-Agricultural Sectors in the Chinese Economy 1952–1992. Appl. Econ. Lett. 1994, 1, 227–229. [Google Scholar] [CrossRef]
- Kanwar, S. Does the Dog Wag the Tail or the Tail the Dog? Cointegration of Indian Agriculture with Nonagriculture. J. Policy Model. 2000, 22, 533–556. [Google Scholar] [CrossRef]
- Kyrkilis, D.; Semasis, S. Greek Agriculture’s Failure. The Other Face of a Failed Industrialization. From Accession to EU to the Debt Crisis. Procedia Econ. Financ. 2015, 33, 64–77. [Google Scholar] [CrossRef]
- Da-Rocha, J.M.; Restuccia, D. The Role of Agriculture in Aggregate Business Cycles. Rev. Econ. Dyn. 2006, 9, 455–482. [Google Scholar] [CrossRef]
- Hamilton, J.D. Why You Should Never Use the Hodrick-Prescott Filter. Rev. Econ. Stat. 2018, 100, 831–843. [Google Scholar] [CrossRef]
- Pesaran, M.H.; Shin, Y.; Smith, R.J. Bounds Testing Approaches to the Analysis of Level Relationships. J. Appl. Econ. 2001, 16, 289–326. [Google Scholar] [CrossRef]
- Konstantakopoulou, I.; Tsionas, E.G. Half a Century of Empirical Evidence of Business Cycles in OECD Countries. J. Policy Model. 2014, 36, 389–409. [Google Scholar] [CrossRef]
- Shin, Y.; Yu, B.; Greenwood-Nimmo, M. Modelling Asymmetric Cointegration and Dynamic Multipliers in a Nonlinear ARDL Framework. In Festschrift in Honor of Peter Schmidt: Econometric Methods and Applications; Springer: New York, NY, USA, 2014; pp. 281–314. [Google Scholar] [CrossRef]
- Rezitis, A.N. Investigating Price Transmission in the Finnish Dairy Sector: An Asymmetric NARDL Approach. Empir. Econ. 2019, 57, 861–900. [Google Scholar] [CrossRef]
Disclaimer/Publisher’s Note: The statements, opinions and data contained in all publications are solely those of the individual author(s) and contributor(s) and not of MDPI and/or the editor(s). MDPI and/or the editor(s) disclaim responsibility for any injury to people or property resulting from any ideas, methods, instructions or products referred to in the content. |
© 2024 by the authors. Licensee MDPI, Basel, Switzerland. This article is an open access article distributed under the terms and conditions of the Creative Commons Attribution (CC BY) license (https://creativecommons.org/licenses/by/4.0/).