Abstract
Measuring the electrical conductivity (EC) of plant substrates is an effective way to assess their nutrient content. This study aims to compare the performance of EC sensors with varying electrode sizes and spacings when embedded in a plant substrate. The range of electrode sizes and spacings varied from 0.1 mm to 10 mm. The EC electrodes were embedded in a porous plant substrate and subjected to wet–dry cycles. The results showed that the electrodes with larger electrode dimensions and spacing produce valid EC values.
1. Introduction
Continuous monitoring and controlling of nutrients in plant substrates, such as peats and rockwool slabs, is critical for achieving higher productivity, improved profitability, and greater sustainability. Maintaining the required concentration of nutrients is essential for optimal plant growth and efficiency [1]. Electrical conductivity (EC) is a measure of the ionic strength of a solution and can provide valuable information about the bulk concentration of nutrients in the plant substrate [1]. However, there are challenges in measuring EC in a plant substrate due to the complex mixture of solid, liquid, and gas phases, compared to measuring EC in an aqueous phase [2]. If EC measurement is localized, the inhomogeneity of the mixture measures air pockets resulting in accurate measurement. This study evaluates the performance of EC measurement in plant substrates by examining the performance of EC sensors with different electrode sizes and spacing on a single sensor format. The electrode design is based on a Printed Circuit Board (PCB) substrate which opens opportunities for significant cost reduction and, hence, a network of EC sensors.
2. Materials and Methods
The EC sensor with multiple electrode pairs (denoted E1 and E2) along with their dimensions and cell constant is shown in Figure 1. The sensor has two sharp arms that make it easy to embed in the plant substrate. These electrodes are composed of hard-plated gold on a PCB substrate. The electrodes measure electrical impedance then convert it to conductivity using their cell constant. To determine the cell constants, the electrodes are first measured in an aqueous electrolyte of known conductivity. Afterward, a fiber-based plant substrate from Grodan BV, the Netherlands, is used for evaluation. The substrate is soaked in a 3 mS/cm KCl solution before the measurement. The sensor is then embedded in the substrate (see Figure 1c) and EC values are measured. The substrate is dried under lab conditions for one week before pouring 3 mS/cm of KCl solution over it to simulate the watering process. This step is repeated for two weeks, with one watering cycle/week. For comparison, the electrodes were also measured in an aqueous solution of 3 mS/cm for more than 2 weeks.
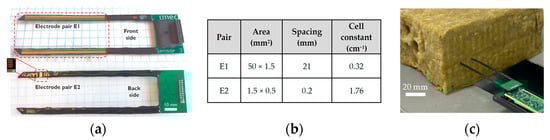
Figure 1.
(a) The sensor with different EC electrode combinations E1 and E2; (b) cell constant of each pair; (c) experimental setup for EC measurement in a plant substrate for watering–drying cycle.
3. Discussion
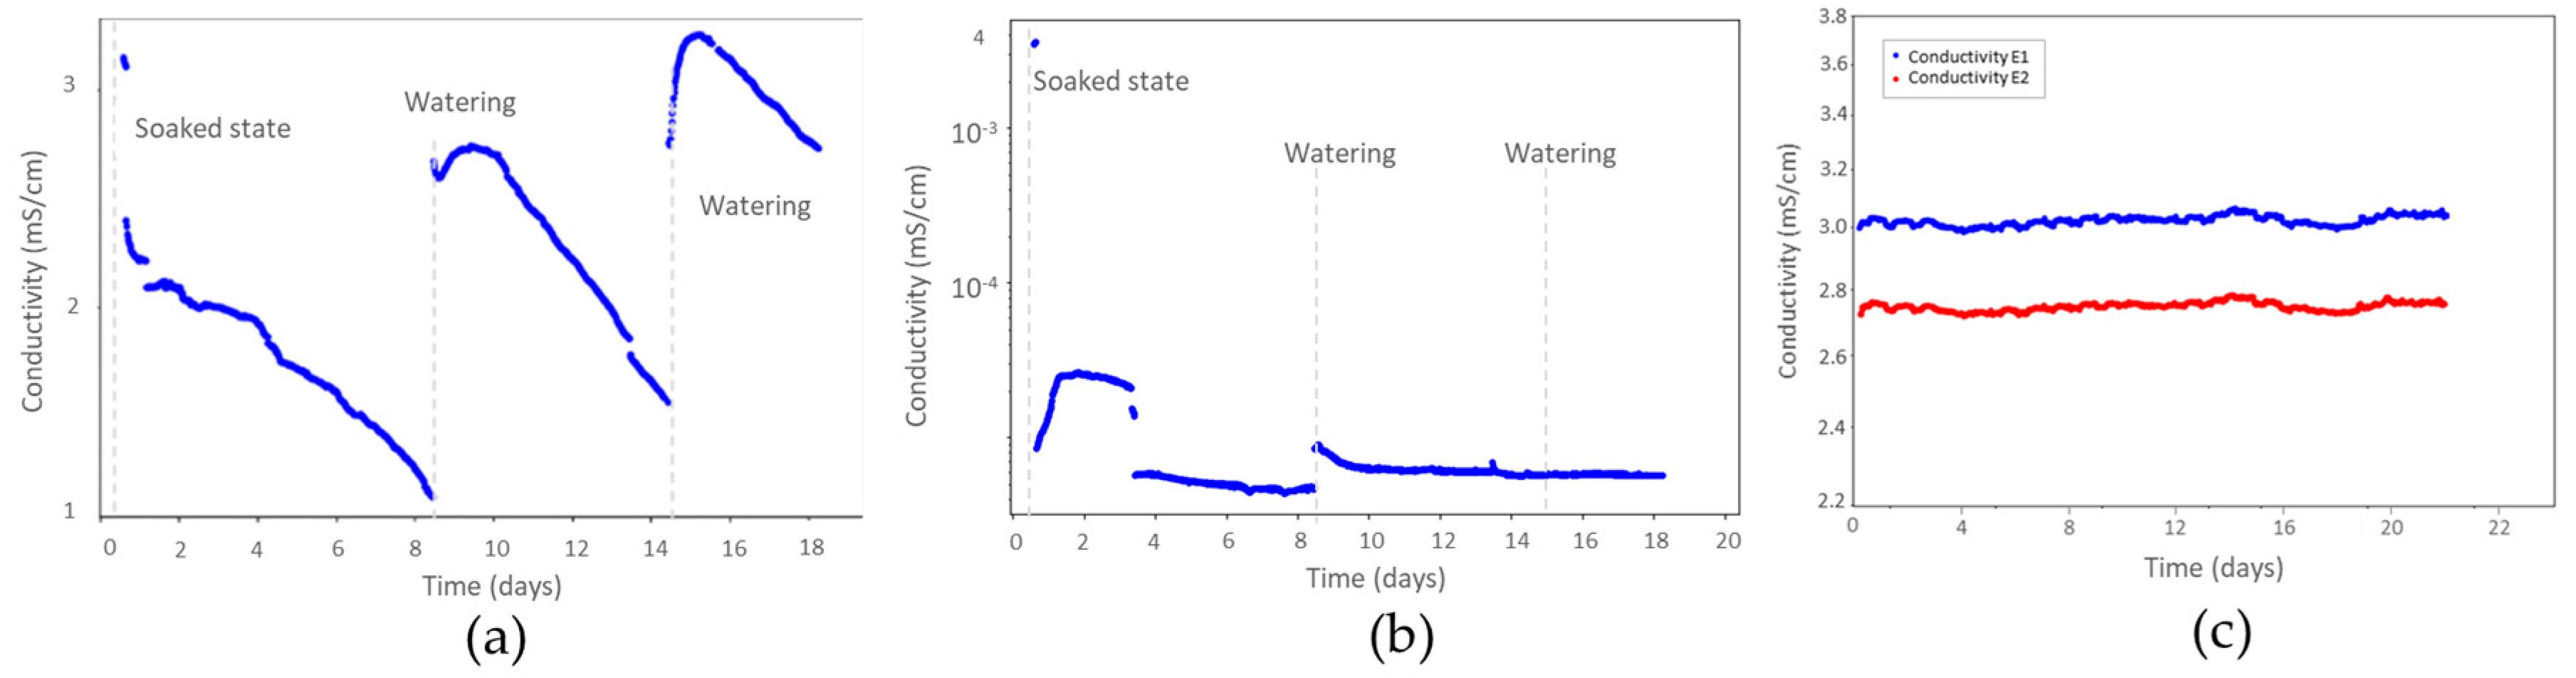
Figure 2 shows the EC data of the embedded sensor after two cycles of watering/drying. The ECs measured in the aqueous solution (Figure 2c) show stable values of 3 ± 1.1% and 2.7 ± 1.3% mS/cm for E1 and E2, respectively, which is within 10% accuracy of the actual EC. In the substrate, the starting EC of 3 ± 6.3% mS/cm is observed with the larger electrode E1 (Figure 2a), which is expected. As the substrate dries in ambient conditions, the EC value decreases to 1.1 mS/cm. Following the substrate’s watering after a week, the EC value increases to 2.6 mS/cm. In the last watering cycle, the EC rises to 3.38 mS/cm, which exceeds the initial EC (3 mS/cm). This can be attributed to the accumulation of salt ions in the substrate. These results demonstrate that the EC electrode design E1 detects the watering and drying cycle of the plant substrate and provides the reasonable EC ranges [2], whereas the EC values obtained from the smaller electrode design E2 do not follow the watering–drying cycle significantly. Moreover, the EC values are much lower, in the order of 10−4 to 10−5 mS/cm as compared to the initial solution EC. This is due to the possibility of localized air pockets at the surface of smaller electrodes (E2) hindering the flow of ions toward the electrode, leading to lower ECs. In contrast, the larger electrodes of design E1 ensure that the excitation current passes through the substrate, capturing the effect of watering and solution conductivity in the substrate. Therefore, for an accurate measurement of the EC in a plant substrate, the electrode design type E1 is better.

Figure 2.
EC measurements of the electrode designs: (a) E1; (b) E2; (c) E1 and E2 in aqueous solution.
Author Contributions
Conceptualization and methodology, Y.A.; validation, M.J.; formal analysis, Y.A., R.M., J.v.N. and M.A.G.Z.; investigation, Y.A.; writing—original draft preparation, Y.A.; writing—review and editing, Y.A., R.M., J.v.N. and M.A.G.Z. All authors have read and agreed to the published version of the manuscript.
Funding
This research was funded by PENTA—EURIPIDES, project number 19016.
Institutional Review Board Statement
Not applicable.
Informed Consent Statement
Not applicable.
Data Availability Statement
The data are available on request from the corresponding author.
Acknowledgments
We would like to thank Peter Spoor from Grodan B.V. for providing the plant substrates.
Conflicts of Interest
The authors declare no conflicts of interest.
References
- Lu, T.; Yu, H.; Wang, T.; Zhang, T.; Shi, C.; Jiang, W. Influence of the electrical conductivity of the nutrient solution in different phenological stages on the growth and yield of cherry tomato. Horticulturae 2022, 8, 378. [Google Scholar] [CrossRef]
- Rhoades, J.D.; Manteghi, N.A.; Shouse, P.J.; Alves, W.J. Soil electrical conductivity and soil salinity: New formulations and calibrations. Soil Sci. Soc. Am. J. 1989, 53, 433–439. [Google Scholar] [CrossRef]

Disclaimer/Publisher’s Note: The statements, opinions and data contained in all publications are solely those of the individual author(s) and contributor(s) and not of MDPI and/or the editor(s). MDPI and/or the editor(s) disclaim responsibility for any injury to people or property resulting from any ideas, methods, instructions or products referred to in the content. |
© 2024 by the authors. Licensee MDPI, Basel, Switzerland. This article is an open access article distributed under the terms and conditions of the Creative Commons Attribution (CC BY) license (https://creativecommons.org/licenses/by/4.0/).