Abstract
This work presents a smart mask for real-time monitoring of carbon dioxide (CO2) levels as a reference tool for diagnosis, sports training and mental health status. A printed circuit board was projected and fabricated to gain data with real-time visualization and storage on a database, enabling remote monitoring as a needed skill for telemedicine purposes. The electronics were inserted in a wearable device—shaped like a mask—and 3D-printed with biocompatible materials. The whole device was used for analyzing CO2 on a breath volunteer in three kinds of measurement.
1. Introduction
Exhaled breath has always been an interesting research topic for scientists. Among its volatile pattern, we highlight carbon dioxide (CO2) as a promising health marker since it is a byproduct of cellular activity that arrives in the lungs through the bloodstream before being exhaled from the body [1]. CO2 levels determine oxygen release by red blood cells to the body and influence the need to breathe. This is an important parameter for athletes needing a properly balanced gas exchange to improve their performances [2]. From a diagnostic point of view, hypercapnia can cause a mild effect like headache or fatigue or life-threatening consequences like asthma, apnea, and chronic obstructive pulmonary disease (COPD) [3]. Furthermore, literature shows a correlation between high CO2 concentration and situations of stress and anxiety [4]. In this study, we present a portable, non-invasive, low-cost and user-friendly device for CO2 analysis. Internet of Things (IoT) and 3D printing enable the patient for a home usage device and ensure continuous remote monitoring for the doctor.
2. Materials and Methods
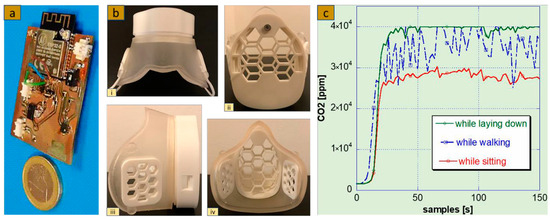
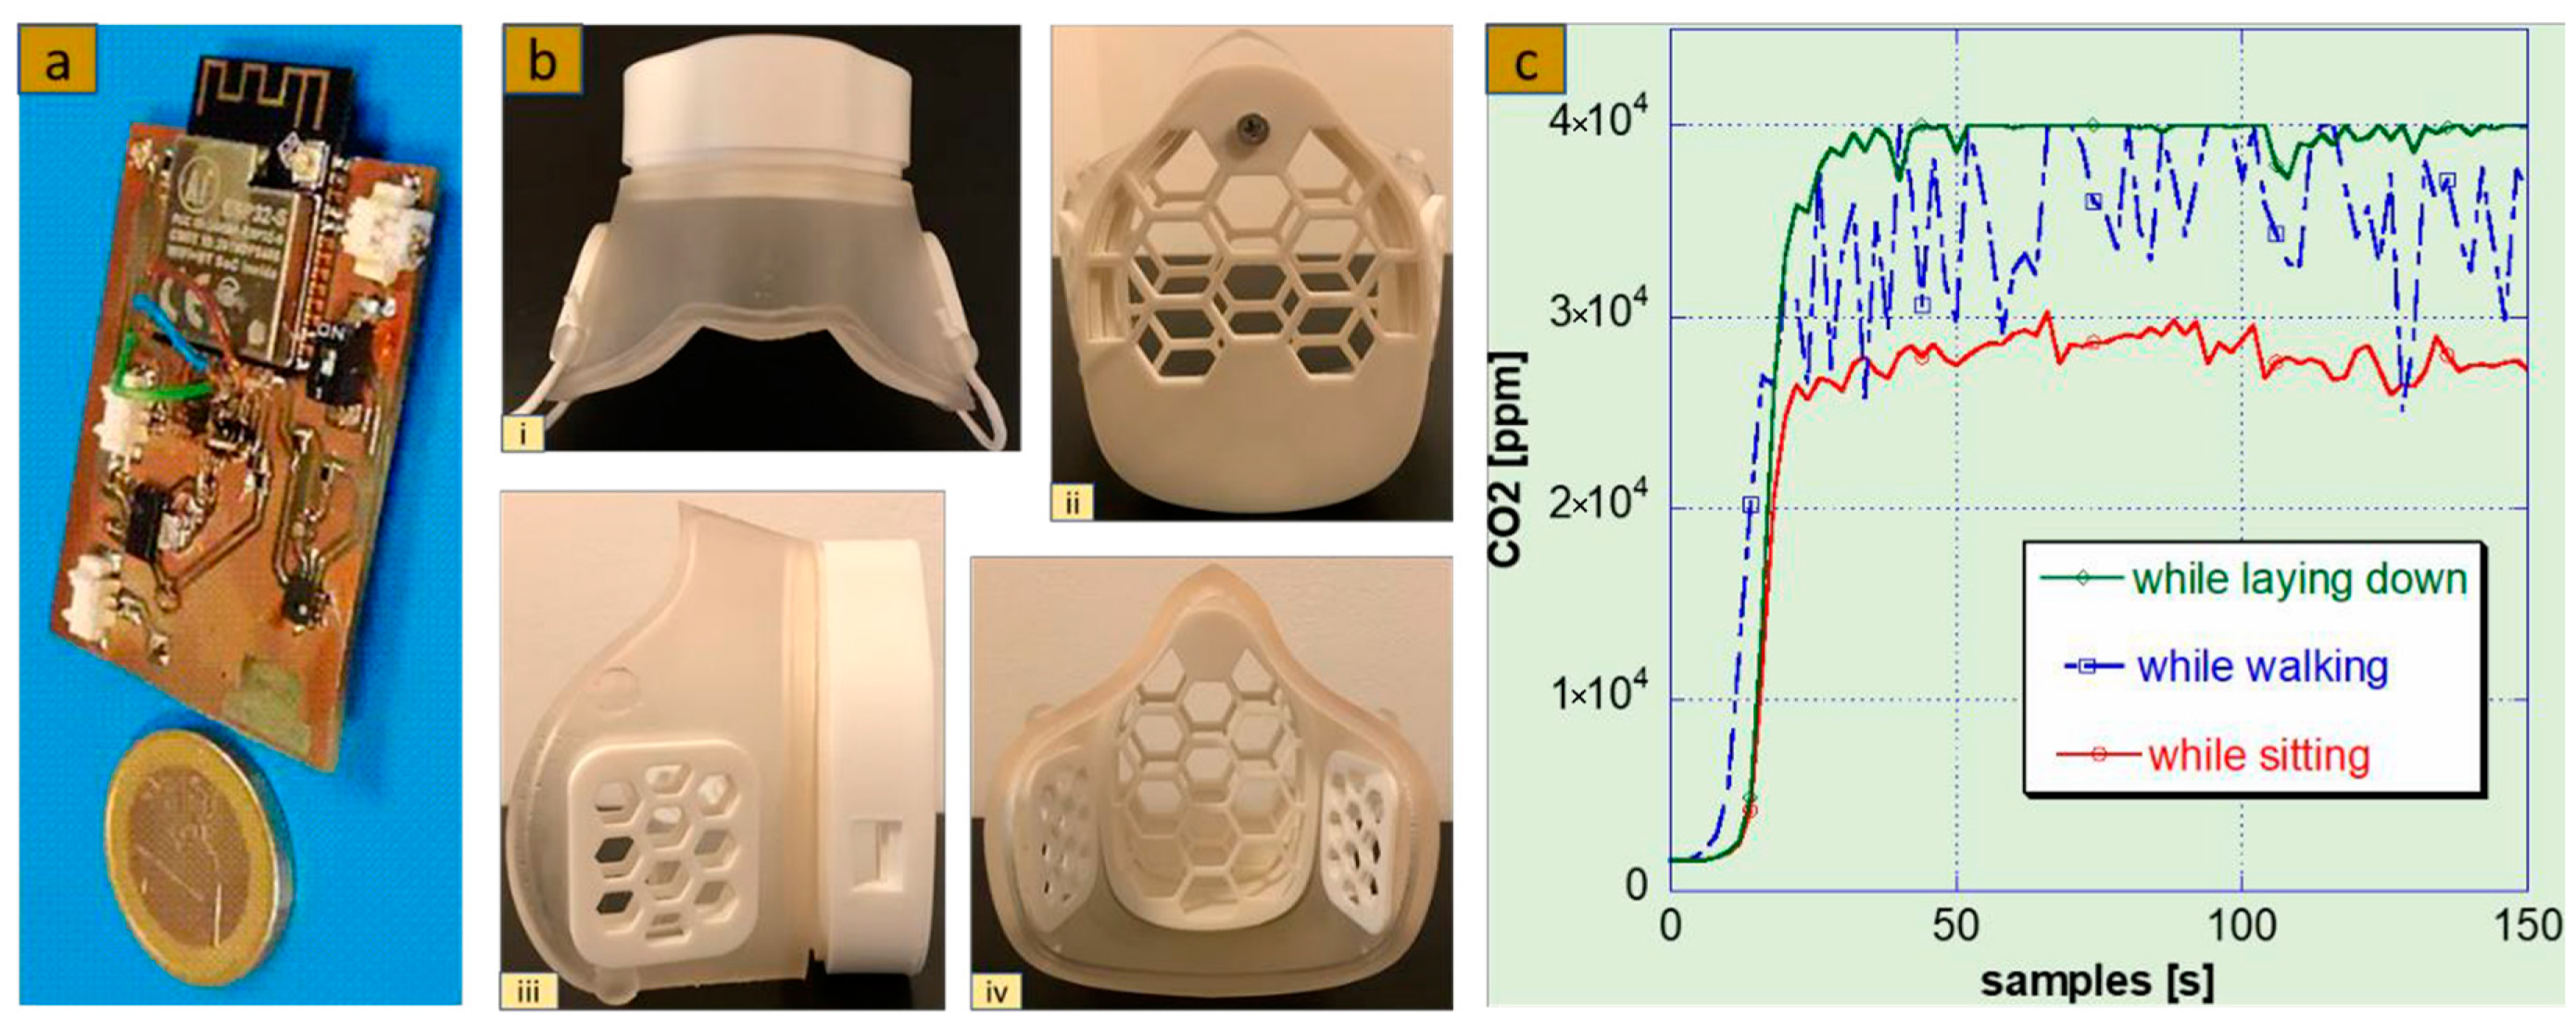
The electronics needed for the project development were assembled on a printed circuit board mainly based on a CO2 sensor (STC31, Sensirion, Stäfa, Switzerland) and a microcontroller (MCU)/WiFi module (ESP-32-S, Ai-Thinker, Shenzhen, China), Figure 1a. We programmed the MCU with an ARDUINO code for gaining measurements and also designed a web page for wireless real-time visualization/storage through LAMP Server and phpMyAdmin. Autodesk Fusion360 2.0.17954 was used to design the wearable device (Figure 1b) to encapsulate the electronics. We chose a mask-shaped design for its social acceptance due to the recent global pandemic and for its double filtering properties. In addition, we focused on the wearability of the smart tool by selecting elastic resin for the mask and a thermoplastic polyester (PETG) for the sockets’ rigidity.

Figure 1.
(a) Image of a printed circuit board (PCB)-based breath sensing system. The figure highlights the small size of the device compared to a coin; (b) Prototype of the wearable device useful for encapsulating the PCB. In order (i), (ii), (iii), (iv) insets represent the top-, front-, lateral- and back- side views; (c) Plot showing CO2 levels (ppm) vs. samples (s) in three measurement conditions.
3. Discussion
The described smart mask was worn by a 28-year-old volunteer for three sets of measurements: while sitting, walking and laying down (Figure 1c). Every measure happens over 150 s, taking a sample every 2 s. The green curve reaches the sensor saturation level (40,000 ppm); values around 30,000 ppm are linked to the sitting situation (red curve) during the in-movement (blue) curve span between 30,000 and 40,000 ppm. This plot shows how the static/dynamic setup measurement influences both the peak and the trend values. Further evaluation is needed to secure the repeatability on the same subject and also to investigate trend values on other volunteers.
Author Contributions
Conceptualization, S.C. and D.C.; methodology, S.C., D.P., A.B., D.C. and G.d.C.; data curation, S.C., A.M. and M.B.; writing—original draft preparation, S.C.; writing—review and editing, A.B., A.M. and M.B.; supervision, D.C., G.d.C. and D.P. All authors have read and agreed to the published version of the manuscript.
Funding
This research was funded by MUR through the Sapienza University Major Project 2021: “Smart Face-mask for Monitoring Health-related Parameters in the Breathing Zone”, grant number RG12117A84C979D3.
Institutional Review Board Statement
Not applicable.
Informed Consent Statement
Informed consent was obtained from the the subject involved in the study.
Data Availability Statement
Data are available after a request to the authors.
Conflicts of Interest
The authors declare no conflicts of interest.
References
- Patel, S.; Miao, J.H.; Yetiskul, E.; Anokhin, A.; Majmundar, S.H. Physiology, carbon dioxide retention. In StatPearls; StatPearls Publishing: Treasure Island, FL, USA, 2018. [Google Scholar]
- Weatherald, J.; Sattler, C.; Garcia, G.; Laveneziana, P. Ventilatory response to exercise in cardiopulmonary disease: The role of chemosensitivity and dead space. Eur. Respir. J. 2018, 51, 1700860. [Google Scholar] [CrossRef] [PubMed]
- Khatri, S.B.; Ioachimescu, O.C. The intersection of obstructive lung disease and sleep apnea. Cleve Clin. J. Med. 2016, 83, 127–140. [Google Scholar] [CrossRef] [PubMed]
- Sprimont, P. The Use of a Timed Exhale CO2 Tolerance Test as an Index of State/Trait Anxiety in Healthy Adults. Master Thesis, California State University, Fullerton, CA, USA, 2019. [Google Scholar]
Disclaimer/Publisher’s Note: The statements, opinions and data contained in all publications are solely those of the individual author(s) and contributor(s) and not of MDPI and/or the editor(s). MDPI and/or the editor(s) disclaim responsibility for any injury to people or property resulting from any ideas, methods, instructions or products referred to in the content. |
© 2024 by the authors. Licensee MDPI, Basel, Switzerland. This article is an open access article distributed under the terms and conditions of the Creative Commons Attribution (CC BY) license (https://creativecommons.org/licenses/by/4.0/).

