Abstract
Unmanned aerial vehicles (UAVs) are increasingly deployed to enhance the operational efficiency of city services. However, finding optimal solutions for the gather–return task pattern under dynamic environments and the energy constraints of UAVs remains a challenge, particularly in dense high-rise building areas. This paper investigates the multi-UAV path planning problem, aiming to optimize solutions and enhance data gathering rates by refining exploration strategies. Initially, for the path planning problem, a reinforcement learning (RL) technique equipped with an environment reset strategy is adopted, and the data gathering problem is modeled as a maximization problem. Subsequently, to address the limitations of stationary distribution in indicating the short-term behavioral patterns of agents, a Time-Adaptive Distribution is proposed, which evaluates and optimizes the policy by combining the behavioral characteristics of agents across different time scales. This approach is particularly suitable for the early stages of learning. Furthermore, the paper describes and defines the “Narrow-Elongated Path” Problem (NEP-Problem), a special spatial configuration in RL environments that hinders agents from finding optimal solutions through random exploration. To address this, a Robust-Optimization Exploration Strategy is introduced, leveraging expert knowledge and robust optimization to ensure UAVs can deterministically reach and thoroughly explore any target areas. Finally, extensive simulation experiments validate the effectiveness of the proposed path planning algorithms and comprehensively analyze the impact of different exploration strategies on data gathering efficiency.
1. Introduction
UAVs have become an integral part of urban management and service optimization [1,2,3,4,5], with their feasibility increasingly being validated [6,7]. Compared to an individual UAV, multi-UAV systems can complete tasks more efficiently through collaborative operations [8,9]. UAV-based data gathering is more efficient and flexible than traditional ground-based methods, enabling rapid responses to real-time monitoring needs and allowing for data collection from optimal viewpoints [10,11]. To fully exploit the potential of UAVs in smart city services, it is necessary to study the path planning problem of UAVs. In urban environments, the main challenges in finding optimal solutions include densely high-rise buildings, non-stationary multi-UAV teams, and dynamic mission objectives. This research aims to develop an efficient path planning algorithm to maximize the overall data gathering rate of camera-equipped multi-UAVs, applicable to various urban services such as traffic data gathering and infrastructure data gathering.
Numerous studies on UAV path planning for urban services cover tasks such as communication relay [12], disaster management [13], target monitoring [14], collaborative search [15], pursuit [16], and convoy tracking [17]. Most of these studies aim to find optimal paths to maximize task efficiency. In [18], a DQN-based target search strategy was proposed, considering the uncertainty characteristics of task targets in an obstacle-free environment. Under energy and search time constraints, an optimal trajectory was designed to minimize the uncertainty of the search area. In [19], a trajectory design scheme incorporating RL was proposed to address the issue of multi-UAVs serving as base stations to provide communication coverage for dispersed users. Optimal paths and power allocation strategies for the multi-UAV system were designed to maximize the overall system utility for all served users. In [20], an intention-based communication method was proposed for randomly appearing traffic monitoring task targets. This method balances the workload among UAVs and maximizes the coverage of ground monitoring equipment blind spots. In [21], an RL-based clustering management method and online path planning method were proposed, considering rapidly changing environments and a set of fixed waypoints. This approach enables UAVs equipped with visual sensors to fully cover existing waypoints in polynomial time in dynamic environments.
Although these efforts have improved task efficiency through path optimization, they have not adequately addressed task variability and UAV team composition. A general path planning framework should adapt to changes in the location and number of task points, as well as variations in UAV energy and quantity, to better meet urban service needs. To address this issue, this paper proposes an RL system with an environment resetting strategy. This algorithm periodically resets the environment and randomly selects variable parameters such as task points and UAVs at the beginning of each training cycle to adapt to different task scenarios. Specifically, this method is applicable to various types of information collection tasks based on onboard cameras. It can also be extended to tasks such as parcel delivery and emergency medical deliveries by setting appropriate parameters for communication range, the amount of information collected, and other factors, as detailed in the simulation section. Additionally, the characteristics of urban environments must be considered. Effectively capturing more optimal path planning solutions in dense high-rise buildings areas is a significant challenge. In urban settings, UAVs cannot fly over high-rise buildings, which restricts their movements and prevents a thorough exploration of the environment before the end of training. The substantive impact, further reflected at the system level, manifests as lower UAV accessibility to certain areas and a reduced overall information collection rate. This issue is particularly acute in the aforementioned periodic systems, where each training episode has a very limited number of steps. Due to the flexibility challenges posed by unpassable buildings, the more dense and widespread the distribution of high-rise buildings, the greater the restrictive impact. This issue is referred to as the NEP-Problem in this study, and it is rigorously mathematically described in Section 2. Additionally, the reward settings in RL often include collision penalties or time penalties, which create sparse reward challenges for specific task points, further reducing the agent’s exploration rate in areas dense with high-rise buildings.
The NEP-Problem can be optimized by selecting appropriate exploration strategies that explore suboptimal actions to discover choices that may yield higher long-term rewards [22]. In the field of RL exploration, researchers have proposed various strategies, including imitation-based methods [23,24], goal-based methods [25], and intrinsic motivation-based methods [26,27,28]. In [29], a curiosity-driven exploration mechanism-based RL method was proposed for the time-constrained urban search and rescue path planning problem. This approach measures curiosity by the time a state has not been visited, encouraging an exploration of that area to reduce the time required for path planning. In [30], an optimized Q-Learning method was proposed to address the issue of agents getting trapped in local optima in unknown environments. This method drives the agent to explore the environment thoroughly through a new action selection strategy and a novel exploration reward. In [31], an RL method guided by the model’s predictive path, integral for exploration and efficient data gathering, was proposed. It adopts a task-oriented approach to policy improvement to reduce ineffective exploration. In [32], a self-imitation learning model was proposed for the collaborative monitoring scenario of UAV swarms. By emphasizing valuable historical experiences, this method corrects mistakes and finds the optimal solution more quickly.
The essence of these exploration strategies can be broadly divided into two directions: increasing the probability of selecting exploration actions and enhancing the efficiency of experience utilization. Due to dense obstacles and limited time constraints, simply increasing the exploration rate cannot fundamentally solve the problem of a low exploration rate in the target area. For instance, even with a uniform action selection strategy, which is likely to explore the environment fully, the target area may not be explored deterministically before the training ends. Since the exploration rate of the target area is extremely low or even zero, the agent cannot obtain effective experiences, and increasing the efficiency of experience utilization cannot improve the exploration rate. Inspired by “Go-Explore” [33] and human learning processes, this paper proposes a Dual-Phase Trajectory-Constrained (DP-TC) method based on expert knowledge. This method enables agents to deterministically reach and explore specific areas under time constraints. Subsequently, based on DP-TC, a Hierarchical–Exponential Robust-Optimization Exploration Strategy (HEROES) is proposed. This strategy employs a hierarchical exponential decay approach to ensure agents thoroughly explore the overall environment.
Additionally, the state distribution is crucial for policy evaluation and improvement. However, commonly used stationary distribution only indicates the long-term characteristics of a system. In stationary distribution, certain states may appear frequently, but in systems with limited steps, these states might not be visited. If visiting these states could lead to more optimal solutions, then a method based on stationary distribution will result in suboptimal outcomes. To assess the adequacy of exploration and optimize exploration strategies, a Temporal Adaptive Distribution (TA-Distribution) method is proposed during the research process. This method effectively indicates both the short-term and long-term operational characteristics of the RL system.
In summary, this paper proposes a DDQN architecture equipped with an environment resetting strategy and HEROES, aiming to maximize the data gathering rates in urban environments by optimizing multi-UAV paths. The proposed method adapts to changes in environmental parameters, enhances UAV accessibility in dense high-rise building areas, and can be extended to any region. The main contributions of this paper are as follows:
- (1)
- A definition of target areas with low accessibility in path planning: This study addresses the issue of low accessibility in certain regions, conceptualizing it as the NEP-Problem. The primary cause is that obstacles restrict the agent’s path choices, hindering the development of effective solutions. To our knowledge, this is the first study to rigorously define the obstacle-induced low accessibility problem within the context of RL-based path planning.
- (2)
- A novel method is developed for policy evaluation and improvement across a variety of temporal scales. By incorporating the long-term and short-term behavioral patterns of agents, the proposed TA-Distribution method enhances the indicative capabilities of the stationary distribution.
- (3)
- A novel RL-based path planning algorithm: This study introduces a DDQN architecture, enhanced with an environment reset strategy and the HEROES technique, designed to enable UAVs to navigate to any designated target areas while adhering to constraints associated with parameter variability, latency, and computational demands.
This paper is structured as follows: Section 2 provides a detailed description of the NEP-Problem. Section 3 presents the system model, delineates the principles of TA-Distribution and HEROES, and introduces the framework for multi-agent RL. Section 4 introduces the simulation experiments and provides an in-depth discussion and analysis of their results. Section 5 offers the conclusions drawn from the research. To enhance comprehensibility, Section 3 discusses several simulation experiments.
2. Problem Descriptions
In RL environments, there exists a complex spatial configuration where actions approaching the target point may be obstructed by obstacles, requiring agents to circumvent these obstacles before reaching the target point. In such cases, agents must execute a series of specific actions to reach the target area. The more elongated and narrower the path formed by obstacles, the fewer routes the agent can choose, and the lower the reachability of the agent to that area.
The NEP-Problem refers to the low reachability of specific areas under the aforementioned spatial configuration in RL environments. Compared to open areas, this low reachability prevents the agent from fully exploring and understanding the environment. A typical result, reflected in the UAV path planning efficiency after algorithm training, is a lower information collection rate. In Appendix A, two examples based on real-world scenarios are presented, substantiating the existence of the NEP problem in practical environments and illustrating its consequential impact. A typical spatial configuration is shown in Figure 1. The meanings of each element are detailed in Table 1. This chapter provides a rigorous mathematical description of the NEP-Problem.
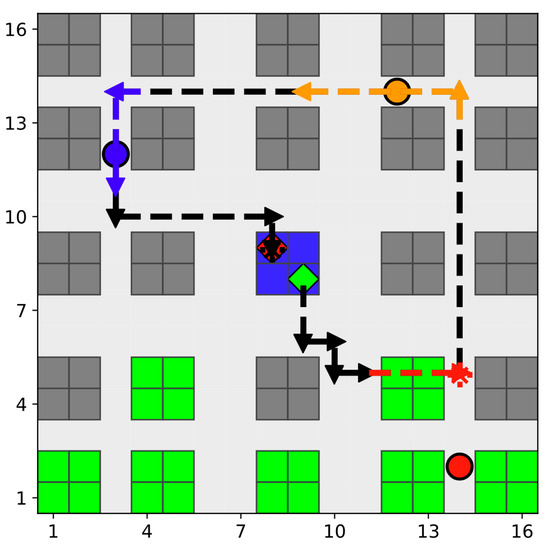
Figure 1.
An example of a grid environment demonstrating the layout and possible UAV movements. The meanings of the elements in the figure are explained in Table 1.

Table 1.
Legend of symbols used in the grid environment.
The NEP-Problem was identified during the study of UAV path planning based on RL algorithms in urban environments with dynamic conditions. Although RL algorithms possess strong generalization capabilities, we designed an environment reset strategy during the research process, wherein different parameters were selected in each episode. This was carried out to enable the RL algorithm to learn a broader range of parameters and to tackle the challenges posed by dynamic UAV teams and dynamic mission objectives. However, it was observed that within this framework, the agent was unable to sufficiently explore the environment within the limited number of steps, thereby failing to discover potentially optimal solutions. This situation repeatedly occurred in obstacle configurations with similar characteristics. We have described this specific spatial configuration and defined it as follows.
In defined state space where all states are reachable and no obstacles exist, there are validated paths from the start point to the goal point . The -th path between these points can be represented by a sequence of states as follows:
where and the element denotes the -th state encountered on path , situated between and . The elements and must satisfy that they can be reached through a single state transition. All possible paths form the following set:
The difficulty in reaching the goal point can be described by the transition probabilities from the start point to the goal point. Within specific path , the agent needs to continuously take a series of optimal actions to successfully move from the initial state to the target state , passing through multiple states . In an obstacle-free environment, the state transition probability from to can be expressed as
The single-step state transition probability is the probability of reaching state when action is taken at the -th state along the -th path. Here, represents a selectable path, and in scenarios without obstacles , denotes the number of elements contained within the set .
The computational complexity of Equation (3) increases linearly with the number of available paths and the number of state transitions . However, considering that an increase in environmental dimensions can lead to an exponential growth in the number of available paths , directly calculating the state transition probabilities for all possible paths may become impractical. To address this computational challenge, two strategies are employed in this study to limit the selection of invalid paths: proximity to the target state and the certainty of reaching the endpoint. Proximity to the target state: is closer to the goal point than for . This approach prunes the path tree by reducing paths that deviate from the target, thereby decreasing the computational load. The certainty of reaching the endpoint: when reaching a state adjacent to , the next transition will definitely move to the target state .
In the context of “Narrow-Elongated”, the concept of “Elongated” is relatively straightforward to understand, referring to the total state transition probability from the start point to the goal point of each selectable path decreasing as the number of transitions, , increases. According to Equation (3), given a constant set of selectable paths , where and is not perpetually equal to 1, the total state transition probability will rapidly decrease as increases.
“Narrow” implies that the number of selectable paths from the start point to the goal point decreases as the number and location of obstacles increase, which causes the total state transition probability to decrease with the reduction in . Obstacles can potentially restrict path choices in any environment. Adding regular obstacles that do not affect the length of the shortest path ensures that holds; if the obstacles are located in states passed by paths in the set , it certainly leads to . Furthermore, when adding a gathering of narrow obstacles that do not affect the shortest path length, and when is the case, it invariably results in ; if the narrow obstacles are located in the states traversed by paths in the set and impede more path choices, it definitely leads to . Here, the set and contains information about the number and locations of regular obstacles and narrow obstacles, represents the set of paths from the start point to the goal point under a regular-obstacles environment, denotes the set of paths under a narrow-obstacles environment forming a narrow corridor, and indicates that the number of obstacle states added in both scenarios is equal.
Figure 2 intuitively displays the impact of the quantity and location of obstacles on the state transition probabilities, helping to understand the meaning of “Narrow” in the context of “ Narrow-Elongated”. The starting position is indicated by blue text labeled “start”, and the goal position is indicated by red bold text labeled “goal”. The text within each cell represents the calculated probability distribution, rounded to two decimal places. The simulation setup includes a step size of 10 and runs for 10,000 episodes to eliminate randomness. The theoretical calculation results are consistent with the computer simulation outcomes.

Figure 2.
Theoretical calculation and simulation validation of the system stationary distribution based on a uniform action selection strategy. represents the number of available paths. (a) Available paths . (b) Available paths . (c) Available paths . (d) Available paths . (e) Available paths . (f) Available paths . The blue color map represents visit frequency; a darker shade indicates a higher frequency of visits.
In a grid environment, if there are no obstacles between the start and end points, there are possible obstacle configurations. Based on this, using Depth-First Search (DFS) to determine passability from the start to the end point, 51 configurations are found to be passable. Further, ensuring that all grids are passable, we tested all 51 obstacle configurations in our study, with more configurations presented in the supplementary experiments in the Appendix B. Since the number of available paths is the essential factor affecting the state transition probability, the obstacle configurations depicted in Figure 2a–e are characterized by the information of available paths, reflecting all passable situations from a local perspective in real-world scenarios. Based on the mathematical description of the NEP-Problem and the TD-distribution design in Section 3, we expressed the state transition probability as a state probability distribution, applicable to scenarios of any size.
According to Figure 2a–c, it is evident that an increasing number of obstacles restricts the selection of paths. Figure 2c,d demonstrate that obstacles in specific locations can further limit path choices, even if there are not many obstacles. Figure 2e,f indicate that an increase in the number of obstacles does not further limit the number of path choices. The degree of narrowness of a pathway is fundamentally determined by the number of path choices, which in turn is determined by both the number and location of obstacles. It is not accurate to simply assume that denser obstacles result in lower state transition probabilities. Therefore, with the number of transitions constant (i.e., the path length remains unchanged), fewer selectable paths result in a lower probability of state transitions from the start point to the endpoint .
In general environments without grid-like boundaries limiting state transitions, the probability of reaching the goal from the start point is even lower. Section 3.2.1 illustrates a scenario representing a narrow corridor situation. It shows that even with a strategy biased towards moving towards the goal point, and even with larger grid boundary restrictions on state transitions, the probability distribution at the endpoint remains very low, despite the step size being much greater than the optimal path transition count .
In summary, the greater the distance from the start point to the endpoint, the more “Elongated” the corridor; the fewer the path choices from the start point to the endpoint, the “Narrower” the corridor. When both these conditions are met, the scenario is referred to as the NEP-Problem. A distinctive feature of this problem is that there must exist some states between which the state transition probabilities are extremely low.
The low reachability caused by the NEP-Problem is the fundamental challenge for UAV information collection path planning. Specifically, low reachability stems from flexibility challenges and sparse reward challenges. The flexibility challenge is due to the obstacle characteristics in urban environments, where high-rise buildings or no-fly zones restrict the three-dimensional spatial flexibility of UAVs. The sparse reward challenge arises from the step and collision penalties within episodes in RL algorithms, which lead to insufficient exploration of certain areas during early training, making it difficult to generate optimal solutions. On the other hand, urban service tasks require maximizing data collection rates under limited resources, necessitating the identification of the most optimal solution. RL algorithms need to explore all potential solutions to determine the best option. Since mission points may be distributed across any area of the city, addressing the NEP-Problem and improving the reachability of target areas is particularly important.
To address the issue of low accessibility, a feasible approach is to leverage human expert knowledge to define an action pattern that deterministically guides the UAV to the target area. However, this approach faces several key challenges: first, human expert knowledge may not be optimal, and the resulting cost could be high; second, reliance on expert knowledge may lead to model overfitting; and finally, the RL algorithm must adapt to the complex mathematical structure of the NEP-Problem. In the following sections, we will provide a detailed description of the system model for path planning and the corresponding solutions.
3. System Model and Path Planning
This paper aims to determine an optimal take-off–gather–return path for multiple UAVs to maximize data collection under energy constraints. First, this chapter details the system model for the path planning problem in urban data collection tasks involving multiple UAVs. Next, it introduces the TA-Distribution model for evaluating the system state. Finally, it presents the HEROES designed to enhance exploration efficiency.
3.1. System Model
There have been numerous studies modeling the UAV path planning problem [34]. This chapter presents a systematic model for the multi-UAV gather–return path planning problem tailored for urban data gathering.
3.1.1. Environment Model
In this research, the data gathering area is defined as a bounded region and modeled using a grid method. Specifically, the area is discretized into cells, each of size , with all possible positions forming the set . This model divides the environment into a two-dimensional grid system, where each grid cell represents a potential UAV location. The environment contains designated take-off/landing positions represented by the following:
where each position is a coordinate point within the grid, representing a potential start or end position for a UAV. Positions that UAVs cannot occupy, primarily due to impassable high-rise buildings or prohibited airspace (such as military areas, construction sites, etc.) in the urban environment, are represented by the following:
Obstacles that block the UAV camera sightlines, which affect the UAV data gathering capabilities, are represented by
These obstacles will impact UAV data gathering capabilities.
3.1.2. UAV Model
The set of the -th active UAV moves within the confines of the grid world . At each time step, the -th UAV can move from the center of its current cell to the center of an adjacent cell, adhering to boundary restrictions. The position of UAV at time step is denoted by , with the UAV location , altitude , at ground level or at altitude ; operational status , being either inactive or active; and energy level .
The constant altitude set for UAV trajectories in the model is due to the consideration that flying over high-rise buildings consumes more energy than circumnavigating them. In practical engineering applications, local obstacle avoidance algorithms can be employed, or each UAV can be assigned to a different altitude to avoid mutual collisions.
The data gathering mission for all UAVs ends after a set number of discrete mission time steps, with the entire mission time discretized into equal-length seconds mission time slots and . The action space for each UAV is defined as
The motion actions for each UAV are constrained by
where represents six actions determined based on the UAV current position . In urban areas that are not designated for take-off/landing areas, landing actions are not permitted.
The flight distance of a UAV within a mission time slot is equivalent to a unit size c. By selecting a smaller mission time slot, it can be approximated that speed of each UAV remains constant within a single time slot. UAVs are constrained to move with a horizontal velocity, , or remain stationary. That is, for any , it holds that . The position of each UAV evolves according to the motion model is given by
If the -th UAV is in an inactive state, it remains stationary. The operational state of each UAV changes is given by
When the -th UAV lands safely, its operational state becomes inactive. The end of the data gathering mission, is defined as the time slot in which all UAVs have reached the end state and no longer actively perform tasks. For all UAVs, their operational states satisfy . The energy level of the n-th UAV evolves is given by
The energy consumption of the UAVs is constant during operation and zero when the operation ends. When UAVs encounter high-rise buildings, they opt to detour around them. The energy consumption during hovering and flight is nearly identical. The energy capacity can be approximately equated to the remaining flight time. Any potential minor differences not accounted for are considered during the initial energy selection, as discussed in Section 4.3. The mobility model of a multi-UAV system is subject to the following constraints:
Constraint (12) describes collision avoidance between active UAVs. For task efficiency and to address potential safety concerns, UAVs must not enter a grid occupied by another UAV, even if the grid size is significantly larger than the UAV’s dimensions. Given the configuration of UAV launch and recovery operations, UAVs can land at the same location.
Constraint (13) forces UAVs to avoid collisions with high-rise buildings.
Constraint (14) limits the mission flight time of the UAVs, ensuring that UAVs complete their missions before depleting their batteries.
Constraint (15) defines the UAV starting position within the launch/landing area and the initial altitude as .
Constraint (16) ensures that UAVs are activated in the operational state. Due to the characteristics of video data, a video data acquisition system and UAV movement usually operate on different time scales. Generally, the operations and data exchanges of video data gathering systems occur more frequently than the path planning and execution of UAVs. To address this time scale discrepancy, this paper introduces the concept of a video time slot, . Each mission time slot is further divided into video slots . If a mission time slot contains video slots, each video time slot has a communication metric of , where and are constant values. The duration of each video slot is seconds. Here, is the length of a mission time slot, and is the number of video slots within a mission time slot. Selecting a larger divides the mission time slot into larger video slots, facilitating the linear interpolation of UAV positions and within each mission time slot. Simultaneously, it can be assumed that the video time slot video data gathering rate remains constant within each video slot.
Suppose there are task points requiring data gathering tasks, each located on the ground at positions and . Each task point has data during the entire mission time . Let be the video communication range of the -th task point, expressed as
At the start of the mission, the data volume of each device is initialized to . Throughout the mission time, the data volume at each IoT node varies based on the communication metric and the position of the -th UAV, as represented by
The UAV data gathering model considers the occlusion effect of buildings on the line of sight. In this model, the field of view of the UAV onboard camera is set to three cells. The data gathering rate is a constant, , which indicates that for task points within the field of view, if not occluded by buildings, data can be collected at the specified rate; however, if the line of sight is blocked by buildings, no data can be collected. The position of the task point is , and the position of the agent is . The nearest task point index k* based on the positions of the task point and the UAV is determined as
Therefore, the amount of data collected by the -th UAV from the task point during the video mission slot is
3.1.3. Optimization Model
Based on the aforementioned model, the primary objective of the multi-UAV path planning problem is to maximize the total data gathering by the deployed UAVs under Constraints (12)–(16). This optimization model is represented by
The goal is to find suitable actions in the joint action space , optimizing the total data gathering while satisfying the aforementioned constraints.
3.2. Method for Policy Evaluation and Improvement
Exploration strategies in RL help agents find the optimal policy by balancing exploration and exploitation. For step-limited periodic systems, a method is needed to evaluate the effectiveness of exploration and optimize exploration strategies. The state distribution of the system can be used to measure an agent’s access probability to various states. However, while stationary distribution reflects long-term behavior patterns, it cannot accurately capture short-term behavior in step-limited periodic systems.
To address this issue, this chapter proposes the Sequential Approximation Distribution (SA-Distribution) and Temporal Adaptive Distribution (TA-Distribution). These methods reweight and reorganize the state distribution based on the agent potential behavior patterns, enabling an accurate evaluation of the system state from both long-term and short-term perspectives and optimizing exploration strategies. A simulation verification of these approaches is provided at the end of this chapter.
3.2.1. Stationary Distribution of RL System
The stationary distribution refers to a probability distribution in a Markov chain, from which the resulting distribution after state transitions is identical to the original distribution. If is a probability distribution over the state space and is the state transition matrix, then is a stationary distribution if and only if
The stationary distribution does not depend on the initial state and represents the behavior characteristics of a Markov chain after running for a long time. Additionally, since π is a probability distribution, the sum of all probabilities must satisfy . The elements of the state transition probability matrix derived from policy represent the probability of choosing an action according to policy in state and transitioning to state . The specific calculation method is given by
where is the probability of choosing action in state , and the state transition probability represents the probability of transitioning to state after performing action in state . State transitions are fully deterministic; hence, the stationary distribution can be obtained by solving the system of Equation (22).
Inspired by the stationary distribution, let the initial distribution be , where each element represents the probability of the system starting in state . During the transition process, the state distribution after t steps is given by
The future state distribution of the system is entirely determined by the current state distribution and the state transition rules. The short-term state distribution of the system is referred to hereafter as ST-Distribution.
The characteristics of the stationary distribution and the ST-Distribution are examined through a simulation. Consider a grid environment. The state space is defined as the set . The action space is defined as , where represent the agent moving up, down, left, and right by one grid cell, respectively. The environment state transitions are fully deterministic; if an action results in the agent entering an obstacle or boundary area, the agent remains in its current state. For the stationary distribution and ST-Distribution, a specific policy is calculated and verified through simulations in two scenarios, with the results depicted in Figure 3 and Figure 4. The agent follows a biased action selection policy towards moving towards the goal, which has not fully learned to adequately respond to situations encountered during training. After reaching the goal position, the agent does not restart to best indicate the agent behavior pattern. Each simulation setting is run for episodes to average out stochastic variations, and setting step is used to approximate the stationary distribution. The theoretical calculation results are consistent with the computer simulation outcomes.
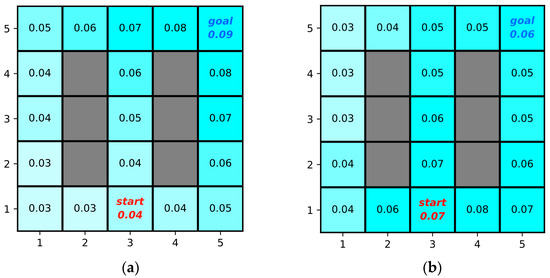
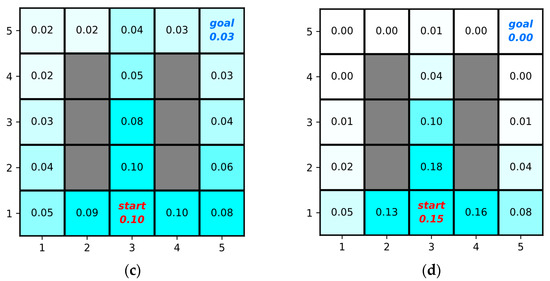
Figure 3.
Double vertical bar obstacle scene. (a) Simulations are conducted with 100,000 steps to approximate the stationary distribution. (b–d) Simulations are conducted with step size of 60, 30, 10, respectively. The blue color map represents visit frequency; a darker shade indicates a higher frequency of visits.
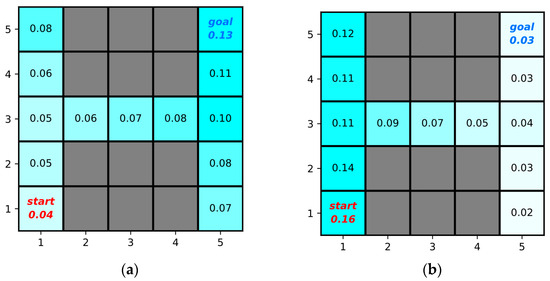
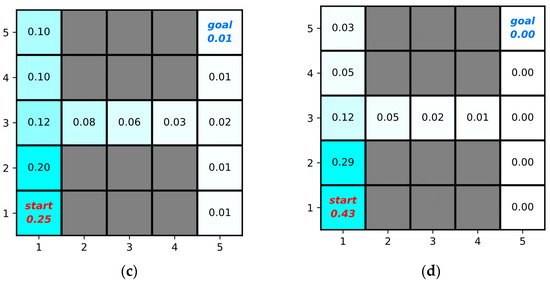
Figure 4.
Narrow extended obstacle scene. (a) Simulations are conducted with 100,000 steps to approximate the stationary distribution. (b–d) Simulations are conducted with step size of 60, 30, 10, respectively. The blue color map represents visit frequency; a darker shade indicates a higher frequency of visits.
Figure 3a and Figure 4a depict the stationary distribution based on a non-uniform policy. Due to the non-uniform probabilities of actions specified by policy , along with different transition rules for obstacles, map edges, and accessible areas, the system probability distribution is likely to be non-uniform. Regions favored by the policy may exhibit higher visitation frequencies as they offer more action choices. The stationary distribution indicates the long-term behavioral patterns of agents within an RL system and measures the agent’s access to states over an extended period.
However, in real-world RL systems, particularly those with a limited number of steps and periodic constraints, using stationary distribution to measure and optimize exploration strategies has limitations. Comparing Figure 3b,c and Figure 3a, it is evident that both ST-Distribution and stationary distribution show similar distribution trends from the start to the goal. However, ST-Distribution indicates a behavioral pattern concentrated near the start. In contrast, the stationary distribution in Figure 4a shows a higher probability near the goal, while the ST-Distribution in Figure 4b,c shows higher probabilities near the start and at cell (1, 5).
It is important to note that at step , the agent does not explore the area near the goal due to its limited number of steps, yet the stationary distribution suggests that the goal and cell (1, 5) are thoroughly explored. Therefore, using stationary distribution to evaluate and optimize exploration strategies is not advisable. Additionally, Figure 3d and Figure 4d show that ST-Distribution gradually approaches the stationary distribution as the number of steps increases.
Intuitively, the stationary distribution indicates that the agent can reach the goal, whereas the ST-Distribution indicates that the agent does not reach the goal, particularly in practical RL systems with limited steps. The reason for this discrepancy lies in the step settings, which do not meet the long-term requirements necessary for achieving a stationary distribution.
In this study, the RL system is characterized by periodicity, meaning there exists a set of states such that once the system reaches any state within this set, it resets to the initial conditions. The specific state that triggers a reset is when all UAVs cease activity. Additionally, the number of steps each agent can take within a cycle is constrained to simulate energy limitation, preventing the system from achieving stationary distribution over the long term. Even if an agent is allowed a substantial number of steps in an episode, or if a large experience buffer is set up prior to training the RL algorithm to simulate long-term system behavior, the distribution of system states can only approximate, but not fully achieve, a stationary distribution. Often, reaching a stationary distribution may take an excessively long time, which in practical RL applications means that the learning process could conclude before this distribution is attained.
3.2.2. Temporal Adaptive State Distribution
In complex RL systems, the behavior patterns of agents may be influenced by multiple factors. ST-Distribution discussed previously captures the behavior patterns of agents under different temporal constraints. ST-Distribution usually has a high probability distribution for the initial state and the state near it. Exploring other states can increase the agent’s exploration of the environment and lead to better solutions. In the context of ST-Distribution indicative capabilities concerning agent behavior, it is often observed that a considerable number of states exhibit low probability distribution. Conversely, beyond the scope of ST-Distribution indicative reach, particularly in the initial phases of learning, regions characterized by zero probability distribution emerge. Uniformly randomly selecting these states for exploration is one solution, but it can increase the already lengthy training time. To address this, this paper proposes the Sequential Approximation Distribution (SA-Distribution), which expands the indicative capabilities of the ST-Distribution based on a target distribution that is approximated using a sequence-based method and a long-term perspective of the stationary distribution.
To more accurately describe the transition from short-term behavior patterns to stationary behavior patterns of an agent under the same time scale constraint, it is essential to consider the process from the ST-Distribution toward stationary distribution comprehensively.
Let denote the -th ST-Distribution, and define the SA-Distribution as
where represents the weight coefficient for the -th ST-Distribution. To ensure that constitutes a probability distribution, must satisfy
The weight coefficient decays with I increasing. The infinite series allows the SA-Distribution to asymptotically approximate a target distribution, which further elaborates on the agent’s behavior patterns as they gradually transition from short-term to long-term behavior. Indeed, as i approaches infinity, can be considered as the stationary distribution. However, given the weight coefficient , SA-Distribution still emphasizes the agent’s short-term behavior patterns based on a given step. In response, this paper introduces a Temporal Adaptive Distribution (TA-Distribution), characterized by introducing SA-Distribution and stationary distribution to optimize the balance between short-term and long-term perspectives.
denotes the stationary distribution, denotes SA-Distribution, and TA-Distribution can be expressed as
where parameters and respectively control the contribution of the agent’s long-term and short-term behaviors to the overall behavior and . If the system behavior needs to indicate long-term characteristics, such as in a non-periodic system where time or operations are unrestricted, increasing the value of α can enhance the influence of the stationary distribution; if the system is constrained by time or operational limits, increasing β can enhance the weight of SA-Distribution to accurately indicate the agent’s short-term behavior patterns. The TA-Distribution method is particularly suited to systems like those illustrated in Figure 4, which have clear differences in long-term and short-term behaviors.
In this study, another benefit of using TA-Distribution is its ability to transform the complex mathematical structure of the NEP-Problem into a reasonable state probability distribution, thereby simplifying computational complexity and mitigating potential computational challenges. This completes the mapping from the mathematically described NEP-Problem to a probability distribution within the RL framework, allowing the problem to be addressed using RL-related methods.
3.2.3. Potential Visitation Count Based on TA-Distribution
Further, the expected potential visitation count to each state under a certain number of experimental steps can be estimated using . The environmental uncertainty, based on the potential visitation count, can then be utilized for policy evaluation and improvement. In state space , the potential visitation count to each state is recorded by the array and , and is a mapping from state space to the set of non-negative integers . Each state corresponds to an integer, which represents the total number of times state has been visited from the start of training to the current moment, assuming the agent has taken independent steps in the environment. Based on the TA-Distribution and the total number of experiments , potential visitation count to state can be estimated as
Exploration priorities for each state can be set based on uncertainty and information gain, and uncertainty can be evaluated based on the potential visitation count. Uncertainty is generally measured by the frequency of visits to a state. Higher state uncertainty corresponds to fewer visits. In this case, exploring such a state may yield greater information gain, as there is relatively less knowledge about this state. The uncertainty of this state can be represented by
The uncertainty decreases as increases because more visits provide more information. If is a state that is rarely or never visited, then any new information about this state could significantly change the agent’s understanding of it. The agent can adopt a strategy that considers the uncertainty of states when choosing exploration areas, and the exploration strategy will tend to select states with higher uncertainty for exploration, thereby reducing system uncertainty in the long-term perspective.
The TA-Distribution encapsulates the characteristics of the NEP-Problem, with the visit count and uncertainty sequentially extracting and describing these characteristics as the agent’s understanding of the environment. This completes the mapping from the mathematical structure of the NEP-Problem to the uncertainty that can be understood and addressed by RL exploration strategies, thereby avoiding potential computational obstacles and enabling unified processing within the RL framework.
Section 3.2.4 presents simulation validation that demonstrates the contributions of the TA-Distribution to the system condition evaluation and exploration strategy improvement, and its inherent long-term distribution characteristics are particularly suitable for determining the exploration priorities among states where the state distribution is zero in the ST-Distribution. Furthermore, Section 3.3.1 builds on this by constructing a heuristic task selection algorithm based on the potential visitation count and uncertainty. This task selection algorithm prioritizes exploring task points with the lowest state distribution probabilities to help the agent maximize its exploration of the environment.
3.2.4. The Contribution of TA-Distribution
In the process of RL exploration, there are many unexplored areas, as shown in Figure 3a where, at step = 10, some states have extremely low or even zero exploration rates. Prioritizing these low exploration rate areas based on uncertainty and exploring the highest priority areas can significantly increase the likelihood of discovering more optimal solutions.
Maintaining the same pathfinding RL setup, coins will now appear at random intervals as “gold”. When an agent reaches the grid containing a coin, it receives a substantial reward, which significantly exceeds the penalty for movement but is less than the penalty for not reaching the destination. Therefore, the RL objective now becomes generating the shortest path from the start to the endpoint while passing through grids containing coins whenever possible.
Comparing Figure 3d with Figure 5a,b, we can draw the following conclusions: The SA-Distribution in Figure 5a expands the descriptive scope of the ST-Distribution in Figure 3d. From Figure 5a, it is evident that the agent’s exploration of the grid containing a coin at (1, 5) is less adequate compared to the target grid at (5, 5). Figure 5b, demonstrating the TA-Distribution method, further corroborates this observation. Comparing Figure 4d with Figure 5c,d, we can draw the following conclusions: The ST-Distribution and SA-Distribution used in Figure 4d and Figure 5c do not accurately describe the exploration priorities for the target (5, 5) and the gold (5, 1). The positions (5, 5) and (5, 1), along with their nearby areas, are far from the starting position (1, 1), with probability distribution that are equally zero, exceeding the effective range of the ST-Distribution and SA-Distribution. The farther a region is from the starting position, the greater the limitations of the two methods in measuring the probability distribution of that region. However, the TA-Distribution method in Figure 5d, by incorporating the long-term characteristics of the stationary distribution, more accurately reveals the potential state distribution at (5, 5) and (5, 1), thereby determining the exploration priorities.
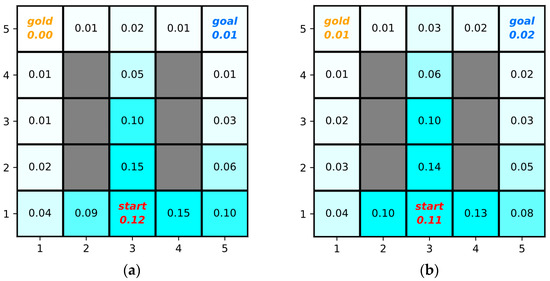
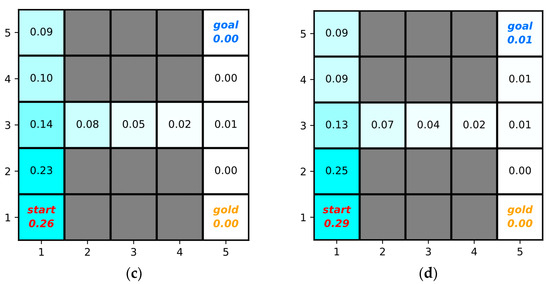
Figure 5.
Comparative Experiment. (a,c) shows the agent’s behavior patterns indicated by SA-Distribution. (b,d) shows the agent’s behavior patterns indicated by TA-Distribution. The blue color map represents visit frequency; a darker shade indicates a higher frequency of visits.
The SA-Distribution and TA-Distribution can intuitively reweight and re-combine probability distributions across states, increasing differences between states with similar or identical distributions. This enhancement facilitates the effective evaluation and optimization of exploration strategies. A notable feature of the TA-Distribution is its ability to estimate potential state distributions for states the agent may not have visited, particularly those far from the starting position. This capability is crucial for comprehensively understanding environments as it ensures that even lesser-known areas of the state space are considered in strategic decisions.
3.3. Hierarchical–Exponential Robust-Optimization Exploration Strategy (HEROES)
This chapter introduces the DP-TC method, designed to enable an agent access to specific regions previously unreachable. Subsequently, the HEROES framework based on the DP-TC method is proposed to adapt to more general exploration scenarios.
3.3.1. Dual-Phase Trajectory-Constrained Method (DP-TC Method)
The key question, in the context of periodic RL systems under constrained steps and in response to the NEP-Problem discussed in previous sections, is whether an exploration strategy exists that should be able to address the issue of extremely low state transition probabilities, as described by Equation (23), effectively directing the agent to explore areas of interest.
Inspired by exploration strategies based on prior knowledge [35,36], this paper introduces the DP-TC method. Its key characteristic is the full use of expert knowledge to determine specific actions that enable the agent to traverse particular regions and reach a desired state. Before executing the exploration strategy in an episode, a “Booklet” containing multiple “Pages” is created as a guide filled with expert knowledge. Each page details paths from the starting point to various task points generated using the A* algorithm. Within this booklet, each task point and its associated trajectory information are organized on individual pages, facilitating target selection and trajectory-based exploration. It is important to note that if this exploration strategy is employed, the actions specified by the strategy should be performed throughout the episode, unlike -Greedy exploration strategies where actions are probabilistically chosen between exploratory and optimal actions within a single episode.
Specifically, Phase-A of the DP-TC method involves identifying the state space of interest and reaching the designated state following the trajectory outlined on the page. Phase-B implements a nearby guidance methods at that state. By assessing the agent’s remaining steps and its distance from the starting point, a return strategy is planned and executed, ensuring maximizing exploration effectiveness within the step constraints. In the target selection task of Phase-A, the agent selects one “Page” from the established “Booklet” for exploration. Pages can be chosen uniformly at random, but typically, a heuristic method is used to improve the baseline, making the probability of selecting certain “Pages” higher.
The set of states can be defined as
where is the Manhattan distance from state to state , is the central point and includes all states within a Manhattan distance of 3. We define the uncertainty of state based on Equation (29) as . The uncertainty of the region can then be defined as
where the weight is defined as
The closer the state is to the center point, the greater its contribution to the regional uncertainty. Based on the regional uncertainty of task points and their nearby areas, ranked from high to low, an exploration priority queue is established. Selecting a high-priority page for exploration can significantly reduce the overall environmental uncertainty. Once a target is selected, the agent follows the trajectory determined by the ‘page’ without additional exploration until reaching the task point. The A* algorithm is a widely used pathfinding method that ensures unbiased and consistent results and generates the optimal path. Following this path allows the agent to reach the designated task point optimally and deterministically, addressing the issue of low state transition probabilities described in Equation (23). It is important to note that once a target is chosen, the agent’s actions strictly adhere to the path outlined in the “Page” without introducing any random actions that could disrupt the trajectory.
Phase-A ensures the agent deterministically moves towards a target point. To further explore the area around the target point, Phase-B implements an exploration strategy upon reaching the target point in the page. Simultaneously, a return trajectory to the starting point is generated using the A* algorithm, and the agent follows this trajectory back to the start to satisfy the step constraints.
To further reduce uncertainty in the surrounding area, this paper proposes a nearby guidance methods that prioritizes exploring areas where the potential visitation count within the state set is the lowest. The exploration priority of state is determined by
where is a very small positive number, represents the number of states in the state space, and is the number of states within the region. The parameter controls the preference for exploring states inside versus outside the region, with a higher value favoring the exploration of states within the region. The exploration probability for choosing state in the region-oriented exploration strategy is defined by
The distinct feature of this strategy is its orientation around the center, focusing exploration activities around this area. This approach emphasizes the exploration of the target area over other unexplored regions, even if these unexplored areas might have a lower potential visitation count. Given that the RL task involves gathering information and returning, the heuristic target selection method by Phase-A has already identified the most critical task points for exploration. Therefore, focusing on the task point itself, rather than the surrounding areas, is a more reasonable choice.
Considering the extremely limited number of steps within an episode, the agent needs to return to the starting point promptly under the step constraints. The process of the agent returning from the task point to the starting point still corresponds to the problem described by Equation (23). General exploration strategies or inadequately learned strategies may not assist the agent in returning to the starting point. The optimality of the A* algorithm can be leveraged to generate a path from the current location back to the starting point. The distance parameter records the distance of the agent from the starting point at time step , while the remaining step parameter records the number of steps left for the agent. Considering that the distance between the agent and the starting point may increase from time step to , the A* algorithm is invoked to generate a return trajectory when the real-time distance parameter or reaches a critical value. The agent then follows this trajectory back to the starting point using the remaining steps. Figure 6 shows the simulation results of an “NEP” scenario for multi-UAV data gathering path planning. Except for the exploration strategy, all other algorithm settings are identical. The results of the simulation experiments using the DP-TC method are shown in Figure 6a.
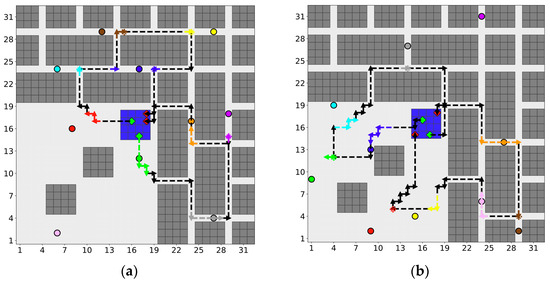
Figure 6.
“NEP” scenario simulation results. The meanings of the elements in the figure are explained in Table 1. (a) shows the DDQN path planning algorithm based on the DP-TC strategy. (b) shows the DDQN path planning algorithm based on the HEROES.
The DDQN path planning algorithm, utilizing the DP-TC method, is capable of generating reasonable paths in areas severely affected by the NEP-Problem and ensures a safe return. Figure 7 shows the average visitation count, under different steps for the yellow task point located at (29, 4) and the pink task point located at (24, 29). The red solid line represents the long-term average visitation count derived from the stationary distribution.
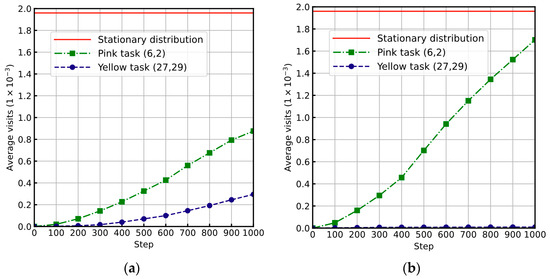
Figure 7.
Average visitation counts for two task points under different step conditions. (a) shows the results when the agent follows a uniform random action selection strategy. (b) presents the results when the agent follows the policy that has been sufficiently learned after adding reward functions.
In Figure 7a, at step , the average visitation count for the two task points are significantly lower than the long-term average visitation count. Due to the NEP-Problem in the vicinity of the yellow task point, even after a significant increase in steps, there is no noticeable upward trend in the average visitation count.
In Figure 7b, using the RL architecture with an added reward function, the behavior of the agent is noticeably affected. Due to the data gathering reward setup, the agent’s visits to the pink task point increase. However, because the reward function includes time penalties and collision penalties, the agent’s number of visits to the yellow task point is essentially zero. A small amount of punishment in the reward function causes the agent to avoid dense obstacle regions to maximize cumulative rewards. In this situation, the agent is unable to learn the existence of more optimal solutions. The reward signals convey the task objectives but do not directly communicate how to achieve these objectives; hence, optimizing this issue based on the reward function remains challenging.
In contrast, due to the optimality of the A* path planning, the DP-TC method strips away the influence of randomness and can reach the target points when the step count equals the optimal path state transitions. Combined with nearby guidance methods, the DP-TC method significantly increases the visitation count to the task points, effectively resolving the NEP-Problem and enabling UAVs to navigate through the “mini-city” canyons.
3.3.2. Robustness Optimization
In our simulation experiments, we observed that RL algorithms based on the DP-TC method tend to over-focus on task points selected during Phase-A, a phenomenon akin to “overfitting” in neural networks. To address this, the robustness optimization of the DP-TC method is necessary. One possible optimization method involves introducing random actions to increase the likelihood of discovering better solutions. However, a small probability of choosing random actions does not significantly alter the trajectory, while a high probability leads to the issues described in Equation (23), preventing effective exploration in the first phase.
In light of this, this study proposes the HEROES based on DP-TC method and the -Greedy strategy. Its notable feature is that, based on the training process, it effectively balances exploration and exploitation by an adjustment of the exploration probability and the weights of different exploration strategies through a dual exponential decay mechanism.
The probability of converting an episode into an E-episode before execution is denoted as . The conversion rate at the start of the learning process is , and at time step , it is , where and . Then, the episode conversion rate at time can be described as
The parameter λ can be defined based on and as
where epsilon is a very small positive number. Further, on this basis of the E-episode, is the initial choice probability. The probability of choosing the DP-TC method at time can be described as
The cumulative decay function Λ(t) is defined as
Λ(t) represents the total cumulative decay rate, where λ(s) denotes the decay rate at each discrete time point s, and is defined as
The first term is a time-dependent decay rate function, which reduces the exploration rate as the training time increases. The second term is a decay function based on the number of collisions , where and are the baseline and range of the decay rates, is a constant controlling the slope of the function, and is the error rate threshold. When the number of collisions exceeds , it indicates that the algorithm cannot effectively handle the NEP-Problem, necessitating an exploration based on the DP-TC method; otherwise, it decreases.
This means that throughout the learning process, the probability of initiating an E-episode and the probability of employing the DP-TC method within the E-episode decrease as the learning process advances. By setting appropriate parameter values, it is possible to maximize the use of the two-stage exploration strategy, which includes expert knowledge, in the initial phases of exploration while gradually reducing reliance on this expert knowledge in the mid-phase of exploration to optimize the “overfitting” issue. It is important to note that this process occurs before an episode is executed, meaning the choice made based on probability does not change during the episode.
Figure 6b shows the optimization effect after employing the HEROES. The simulation results demonstrate that the optimized exploration strategy effectively balances the exploration of target areas focused on by Phase-A and other areas.
Figure 8 comprehensively displays the data gathering performance using different exploration strategies. All settings except for the exploration strategies are the same. “Phase-A methods” represents the method that explores based solely on the A* algorithm without relying on any return policy. The -Greedy strategy and the “reach-explore” strategy of Phase-A are limited to collecting data in open areas due to their restricted ability to solve the NEP-Problem, failing to find more optimal solutions; the DP-TC method has a higher rate of data gathering but exhibits considerable randomness; and a robustly optimized HEROES shows better performance and stability.
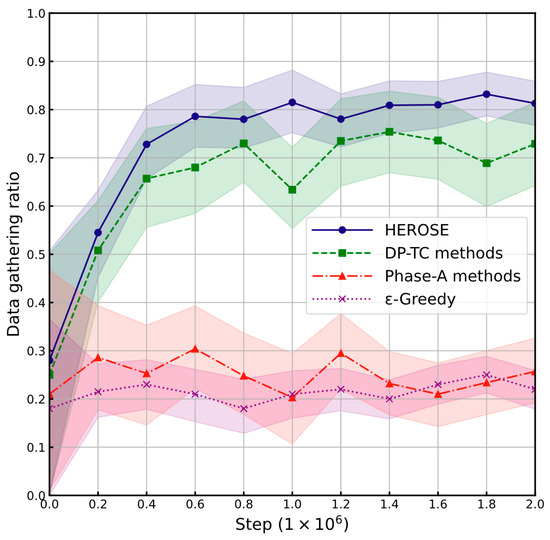
Figure 8.
Line graph of “NEP” scenario total data gathering rates for DDQN path planning algorithms based on different exploration strategies.
Section 4 further compares and analyzes the data gathering rates and landing probability parameters after the training completion of the DDQN path planning algorithms based on different exploration strategies.
3.4. Multi-Agent Reinforcement Learning
UAVs can be regarded as intelligent agents with specific motion rules. Multi-agent coordination methods can be broadly categorized into three types: traditional mathematical optimization methods, various heuristic methods, and RL methods. For common challenges in multi-agent systems, such as environmental instability, inconsistency in individual goals, and partial observability, RL provides an effective solution. By designing appropriate reward functions, RL can address these challenges in an end-to-end manner. Moreover, reinforcement learning methods offer superior computational efficiency and generalization capabilities.
3.4.1. Markov Decision Process
In the optimization model, maximizing the total data gathering depends on the environmental state and the series of actions taken by the UAVs. However, the joint actions of multiple UAVs are in a coupled state where they influence each other.
In the data gathering mission, UAVs should fly to densely populated task areas to maximize their data gathering, thereby increasing the overall data gathering. However, it is possible for multiple UAVs to fly to the same area simultaneously, each attempting to maximize its own data gathering in the same region. This scenario does not result in the maximum increase in total data gathering across the entire mission area. Additionally, adapting to changes in the number of tasks, the amount of data to be gathered, the number of UAVs, and UAV energy constraints makes the optimization problem difficult to solve. Therefore, we employ a Markov Decision Process (MDP) to address this issue.
To solve the aforementioned optimization problem, we use a Decentralized Partially Observable Markov Decision Process (Dec-POMDP). This process is used to describe interactions in multi-agent systems where agents cannot observe the full, true state of the environment. A Dec-POMDP is defined as a tuple , where S represents the state space, denotes the joint action space, T is the transition model, R is the reward function, is the joint observation space, O is the observation model, γ is the discount factor, and N represents the number of agents.
At each time step, the environment is in state . When the agents take action , the system transitions to new state according to the transition model . The reward represents the reward obtained when the agents take action a in state s and the system transitions to state s′. For the -th agent, the observation probability is . The discount factor is used to balance short-term and long-term decision optimization, where a smaller value indicates less emphasis on future rewards.
The state space for the multi-UAV data gathering problem is defined as
where each element is given by
is a tensor representation of the set comprising the launch/landing zones , obstacles , and line-of-sight obstructions . is the UAV motion model, is the energy level model, and defines the operational state of the UAV. defines the position of the task points, and defines the data volume at the task points. In the agent’s state , is the set of UAV positions, is the flight time, and is the position of the line-of-sight obstructions. The environment state includes information on both the flyable structure and the unflyable structure. In the tasks state , is the set of task point positions, and contains the data volume information of the task points. Thus, the state space can be redefined as
The reward function directly influences the decision-making process of the UAVs. In this study, the reward function is designed to provide feedback based on the actions of the UAVs at each time step, where each movement results in an update of the data gathering amount. First, the data gathering reward at time step is defined as
where the first term represents the total amount of uncollected data in the area at time step , and the second term represents the total amount of uncollected data in the area at time step . The difference between these two terms is the reward received. When action is taken, the total data gathering state changes from to . The -th UAV must satisfy certain constraints while flying. If these constraints are not met, a penalty is incurred. The penalty can be defined as
The collision penalty is parameterized by and given by
If an action is expected to cause a collision, a hover action is executed instead. The personal penalty for landing outside the designated landing zones is given by
and is parameterized by . The penalty for not landing in the designated landing zones before energy depletion is given by
and is parameterized by . Constant penalty is imposed to apply a persistent negative incentive, encouraging agents to minimize flight time and prioritize efficient trajectories during mission execution. Based on task locations, the remaining information, and other characteristics, the algorithm makes a trade-off between data collection and a safe return, driven by the underlying logic of maximizing cumulative rewards. Specifically, by setting a substantial penalty to ensure a safe return under all possible circumstances, combined with a significant reward for information collection, the algorithm incentivizes the agent to gather as much data as possible before energy is depleted and the UAV must return to the take-off point. Conversely, if a smaller penalty and a larger reward for information collection are set, the algorithm will prioritize collecting more information over ensuring a safe return. The reward with penalties can be defined as
The reward for the -th UAV during the mission time slot can be further described as
The first term represents the data gathering reward , optimized through the data gathering parameter , and the gathered reward is shared among all agents. In the MDP model, the optimal policy must be found to maximize the reward over time. This focuses on long-term returns, where a series of joint actions can yield higher reward returns. Therefore, the optimal policy for path planning that maximizes the total data gathering can be redefined as
This means finding the optimal policy among all possible strategies that maximizes the expected return.
3.4.2. Double Deep Q-Learning
Q-Learning is a widely used model-free RL algorithm that learns the value of state–action pairs in a specific environment through an iterative updating process. At time t, an agent observes the current state and selects action based on a policy, and the environment provides a reward and transitions the agent to the next state . The goal of the agent is to learn the optimal policy to maximize cumulative rewards.
The action value function is defined as the expected return obtained by taking action in state s and following policy and can be expressed as
where is the reward obtained at time , is the discount factor, which is between and , used to value future rewards in present terms and ensures the finiteness of the total return.
Traditional Q-learning faces challenges in handling large state spaces because it relies on maintaining a large Q-table to store the Q-values for each state–action pair. As the number of states or actions increases, the size of the Q-table and the computational resources required become difficult to manage. Deep Q-Networks (DQNs) [37] utilize deep neural networks to approximate the Q-function, which effectively addresses problems with high-dimensional state spaces. Although the DQN has achieved notable success, it can lead to overestimations of state–action values because it uses the same network for both selecting and evaluating actions. To mitigate this overestimation bias inherent in the DQN, we introduced the Double Deep Q-Learning (DDQN) modification [38], which uses two separate sets of network parameters. In DDQN, the main network, parameterized by , is used for action selection, while the target network, parameterized by , is used for evaluating action values. The parameters of the target network are updated periodically with the parameters from the main network to stabilize the training process. The update formula for DDQN is as follows:
This formula adjusts the estimated value of the current state–action pair by combining the immediate reward with the discounted value of future potential returns. The loss function of DDQN, which minimizes the difference between the predicted values and target values, updates the network weights and is defined as
where represents the target Q-value, and is the network evaluation of the current state–action pair. The calculation of the target value in DDQN utilizes two networks to reduce selection bias as follows:
The main network is used to determine the best action to take in the next state, , while the target network evaluates the value of this action. This separation ensures that the evaluation of the target value is not influenced by immediate updates, thereby reducing estimation bias.
Additionally, the research incorporates Prioritized Experience Replay (PER), which assigns priority to each training sample to reduce correlations in the data sequence and increase the sampling probability of experiences worth learning. The priority of an experience is typically determined by the size of its Temporal Difference (TD) error. The larger the error, the higher the priority for learning from that experience. This mechanism allows the agent to learn more frequently from significant experiences, thereby accelerating the learning process.
It is important to note that due to the generalization capabilities of RL algorithms and the design of the reward function, similar to how the algorithm adapts to task location distributions, it can handle obstacle configurations that are not encountered during training when there is a certain degree of variation in the input obstacles.
3.4.3. Multi-Agent DDQN Architecture Combining HEROES
The DQN has been extended to multi-agent systems [39] and the DDQN based on the DQN can be applied to the cooperative multi-agent system of this study without changing the underlying logic. The multi-agent exploration strategy is an extension of the single-agent exploration strategy [40]. Based on the HEROES, it adopts a hierarchical independent exploration method extended to a multi-agent exploration strategy [41]. In an E-episode requiring exploration tasks, there are agents and task points, where . In the created “Booklet”, each agent sequentially selects a “Page” to explore. Although this method is a straightforward approach to exploration, it performs well in practice. Each UAV has the same internal and external structure, action space, and perception capabilities. Although there is no direct communication between agents to coordinate actions, they can still acquire the position information of other UAVs. Given that local regulations and monitoring requirements mandate the real-time monitoring of UAV positions to ensure safety, the exchange of location information among UAVs is necessary and feasible in operations. The RL architecture in this study is based on the DDQN algorithm and HEROES, employing a centralized training and decentralized execution strategy.
The pseudocode for the multi-agent DDQN architecture based on the HEROES is shown in Algorithm 1, and the structure diagram is shown in Figure 9. The Action Selection module outputs actions determined by either the HEROES or main network, based on the selected episode type. Specifically, the algorithm initially initializes the replay memory and a DDQN network with random weights and is executed for a total of episodes. Before each episode begins, random scenario parameters are selected, and the probability is calculated to decide whether to convert the episode into an E-episode. If the episode is an E-episode, exploration actions E-Action are chosen according to the HEROES; otherwise, actions are selected based on the maximum Q-value output from the current main network. Every time step, the weights of the target DDQN network are updated to the weights of the current DDQN network.
| Algorithm 1 Multi-Agent DDQN Based on the HEROES |
| 1: Initialize replay memory 2: Initialize DDQN with random parameters 3: Initialize target DDQN with weights 4: for each episode from 1 to do 5: Randomly select scenario parameters 6: Evaluate the probability 7: if then 8: Set episode type to “E-episode” 9: end if 10: Observe the initial state 11: for each time step t from 1 to do 12: if episode type is “E-episode” then 13: Select action based on HEROES 14: else 15: Select action base on main network 16: end if 17: Store the transition in the replay memory 18: Sample a random mini-batch of transitions from the replay memory 19: Compute the target Q-value using the target DDQN 20: Perform gradient descent using the loss between the DDQN predictions and target Q-values 21: Every steps, update target network weights 22: end for 23: end for |
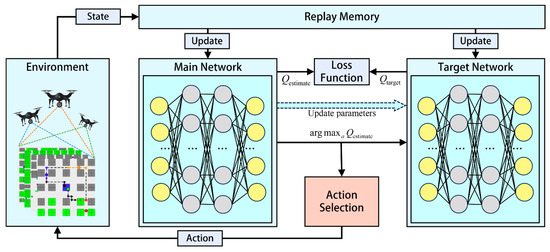
Figure 9.
Architecture of multi-agent DDQN based on the HEROES. The red modules are newly introduced for action selection. The cyan modules retain core functions from the original DDQN with partial modifications.
4. Simulations and Discussion
Due to environmental factors, potential UAV malfunctions, and strict legal regulations, verifying the effectiveness of algorithms through physical experiments can be challenging. Simulation environments offer a controlled alternative.
4.1. Simulation Map Construction
The majority of multi-agent research studies conduct simulation tests on custom-built simulation maps without taking into account real-world features. The ultimate objective of this research is to deploy algorithms on UAVs to carry out data gathering missions in real physical environments, for which we employ a grid-based method to model real urban environments. Moreover, the simulation map generated using real maps can function as a standardized testing environment, enabling various research teams to conduct algorithm testing and result verification in an identical map setting.
As grid resolution increases, the state space expands rapidly, resulting in an exponential decline in the computational efficiency of RL algorithms when dealing with large-scale state spaces. To keep training time within a reasonable range while maintaining accuracy, grid resolution must be appropriately managed to avoid setting excessively high resolutions. The specific impact of different grid resolutions on training time is provided in Appendix C.
This study extracts real-world map data from Google Maps and OpenStreetMap, including information on buildings and road networks, and enhances these with 3D map rendering and satellite imagery to supplement building height data. Using nearest neighbor interpolation, we consolidate information concerning both flyable and unflyable structures alongside road data. Owing to the limitations imposed by the grid-based mapping system, priority is given to the incorporation of road information. The inclusion of road network information is essential. The grid environment is calibrated to preserve the real-world map features as much as possible while simplifying the map environment. The grid-based simulation map focuses more on preserving the passability information that is critical for decision making, rather than retaining the exact shapes of buildings and roads. This type of simulation map is suitable for global path planning at the planning and decision-making stages, rather than local path planning at the control stage. This aligns with our research problem, which is focused on generating appropriate task strategies for UAVs, rather than optimizing local UAV trajectories.
4.2. Simulation Setup
This study conducts simulations on two distinct maps. The first is the “Midtown Manhattan” map, characterized by a high density of high-rise buildings, which exacerbates the NEP-Problem. The second is the “Downtown Los Angeles” map, based on the northwestern region of downtown Los Angeles, where high-rise buildings are less prevalent but the map size is larger.
The grid map uses a cell size of , and UAVs fly at a constant height of over urban streets, unable to fly over urban buildings taller than 20 m. Data gathering is only possible when UAVs enter within 45 m of the center of a task point, and their line of sight may be obstructed by buildings. Each task slot includes video slots. Before starting an episode, the number of UAVs to be deployed and the remaining energy of UAVs, initial positions, as well as the number and positions of task points and the data volume to be gathered, are randomly determined. The specific parameter settings are provided in Section 4.3 and Section 4.4.
This simulation is conducted on a computer equipped with an Nvidia GeForce 3060 Ti GPU and an i5-12500 CPU, requiring 80 h to complete 2,000,000 steps.
4.3. “Midtown Manhattan” Scenario
The scenario in Figure 10 is established based on the Midtown Manhattan, representing the region surrounded by four streets: Park Avenue, 7th Ave, W 55th St, and W 47th St. This region includes a large number of regular urban buildings, regular grid-like roads, and two relatively wider roads. It is noteworthy that the impassable high-rise buildings on the map are very dense, posing a severe NEP-Problem for the UAVs.
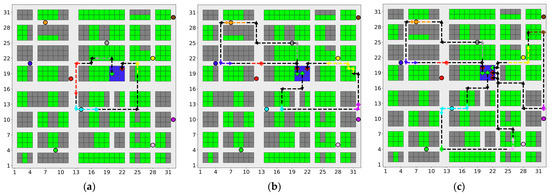
Figure 10.
Path planning simulation results in “Midtown Manhattan” Scenario. The meanings of the elements in the figure are explained in Table 1. (a) Number of UAVs . (b) Number of UAVs . (c) Number of UAVs .
In this set of simulations, we established a grid with cells, resulting in a total size of . The number of UAVs set at , the initial energy for each UAV set at , and the number of task points set at were randomly distributed. The data gathering duration at each task point was set at . Nine starting positions were designated. To further account for the similar energy consumption across different flight states and uncertainties such as wind speed and direction, the UAV’s initial energy selection model is designed to address these issues. For example, providing a narrow energy selection range under fixed energy conditions can better accommodate such uncertainties. Additionally, to ensure safety during the actual deployment and compliance with legal regulations, UAVs should retain a certain amount of residual energy to guarantee a safe return. The initial energy selection range can be determined based on the required residual energy. The east side of the “Midtown Manhattan” map had a denser distribution of task points, while the west side, characterized by densely packed buildings, had fewer task points.
With changes in the number of UAVs, , while the other parameters remained constant, the simulation results for the “Midtown Manhattan” scenario are illustrated in Figure 10.
In Figure 10a, the agent opted to collect information in the eastern part of the map where task points were densely located, without overly focusing on the eastern area, demonstrating that the robust optimization post-exploration strategy does not excessively concentrate on specific areas. Figure 10b shows the trajectory of the first agent remaining largely unchanged, while the newly added second agent collected data from task points in the dense western building area, successfully navigating through the narrow extended path formed by numerous high-rise buildings and returning without focusing on the remote blue task points. In Figure 10c, the introduction of a third agent allowed for data gathering from a remote device in the map outlying area, with the three agents effectively dividing the map into three sectors to maximize data gathering efficiency. The simulation results demonstrate the effectiveness of the robustly optimized HEROES based on the DP-TC method, while the DDQN path planning algorithm proved adaptable to varying scene parameters.
This study allows for parameter adjustments to suit the decision-making phase of different tasks, such as traffic information collection, surveillance, last-mile parcel delivery, and data collection services during the maintenance of digital twin models in smart cities. Specifically, if the simulation settings are the same as those in this study, the method can accomplish traffic information collection tasks. By increasing the amount of information at mission points and adjusting their weight in the reward function, UAVs can be made to remain at mission points for longer periods, thus completing surveillance tasks. By reducing the communication range of mission points and appropriately adjusting the reward function, UAVs can be guided to approach mission points more closely, simulating the process of approaching and descending to complete parcel delivery tasks. By adjusting the location of mission points (e.g., from roads to buildings or equipment), the algorithm will plan appropriate paths for UAVs to complete data collection tasks for digital twin models.
4.4. “Downtown Los Angeles” Scenario
The scenario depicted in Figure 11 is based on the northwestern region of downtown Los Angeles. Despite numerous flyable buildings along the map periphery, UAVs are required to navigate through densely high-rise building areas to reach these regions. This scenario features a larger map size and more widely distributed task points.
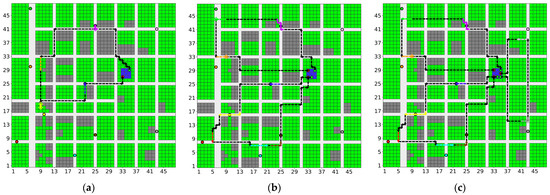
Figure 11.
Path planning simulation results in “Downtown Los Angeles” scenario. The meanings of the elements in the figure are explained in Table 1. (a) Number of agents . (b) Number of agents . (c) Number of agents .
For this scenario, we established a grid with cells, resulting in a total size of . The number of UAVs set at , the energy for each UAV set at , and the number of task points set at were randomly distributed. The data gathering duration at each task point was set at . Nine starting positions were designated.
With the number of UAVs, , varying while the other parameters remained constant, the simulation results for the “Downtown Los Angeles” scenario are shown in Figure 11.
In Figure 11a, the agent navigated through areas with dense high-rise buildings, collecting data from numerous task points and disregarding closer but fewer task points on the east side. Figure 11b, with an increased number of agents, shows the first agent altering its path to maximize the team data gathering efficiency. Due to flight duration constraints, the two agents did not opt to collect data from the southeastern gray task points. In Figure 11c, three agents similarly divided the map into three sections to perform data gathering, maximizing coverage while avoiding overlap in the data gathering areas.
4.5. System Performance Analysis and Discussion
This section compares the training processes and outcomes of path planning algorithms that integrate three exploration strategies: -Greedy, Go-Explore, and HEROES. It also analyzes the necessity of the proposed exploration strategies and validates their effectiveness.
In multi-UAV data gathering path planning, the performance of algorithms can be assessed through three metrics: the data gathering rate, safe landing rate, and cumulative reward. In this study, maximizing the data gathering rate is paramount, but achieving safe landings in urban environments is also crucial. The data gathering ratio is the ratio of the total data gathered at the end of a task to the total amount of data available at the beginning, indicating the agent’s ability to cover task points and gather information. The safe landing rate records whether all agents have successfully and timely landed at the end of an episode, indicating the agents’ capability to return and land safely. Cumulative rewards provide a comprehensive assessment of the system’s learning performance.
Figure 12 compares the DDQN training processes using three different exploration strategies in both the Manhattan and Los Angeles scenarios. Each training period is defined as 200,000 steps. For each training period, the solid lines depict the average metrics, the shaded regions representing the 95% quantiles of the metrics.
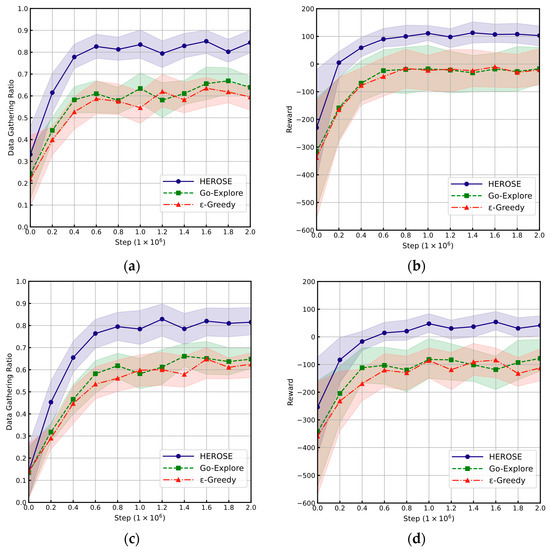
Figure 12.
Line graphs of data gathering rates and cumulative rewards throughout the training process for DDQN algorithms with different exploration strategies. (a) Data gathering ratio in “Midtown Manhattan” scenario. (b) Reward metrics in “Midtown Manhattan” scenario. (c) Data gathering ratio in “Downtown Los Angeles” scenario. (d) Reward metrics in “Downtown Los Angeles” scenario.
It is evident that there is no significant difference between the training processes of the Go-Explore and -Greedy exploration in the two scenarios. One potential reason is that Go-Explore only returns to the edge of previously explored areas, without directly reaching target areas within unexplored zones. A second possible reason is that upon reaching the edge of explored areas, the employed strategy is a random exploration tactic, which inherently does not address the problem described in Equation (23).
Furthermore, adequately trained RL path planning strategies need to be evaluated. Using the Monte Carlo analysis method, the system learning situation is assessed by re-selecting random parameters and running episodes to eliminate randomness. The overall average performance metrics for data gathering rates and successful landing rates in the “Midtown Manhattan” and “Downtown Los Angeles” scenarios are presented in Table 2 and Table 3.

Table 2.
Monte Carlo Evaluation of DDQN with three exploration strategies in the “Midtown Manhattan” scenario.

Table 3.
Monte Carlo evaluation of DDQN with three exploration strategies in the “Downtown Los Angeles” scenario.
The data gathering rate fell short of reaching 100% in certain scenarios characterized by high values for task points and data volume , coupled with a low number of UAVs and reduced energy . This configuration can lead to situations where the UAVs are incapable of gathering the entirety of the available data.
Figure 10 and Figure 11 demonstrate the effective collaboration between agents and the system’s stability across different numbers of agents, reflecting excellent parameter generalization capabilities. However, as the number of agents increases and the state space expands, system complexity will grow exponentially. To address large-scale and complex coordination scenarios, further algorithm optimization, the introduction of more efficient training strategies, and the design of a more robust system architecture are still required.
Through Monte Carlo simulations, the path planning performance of DDQN algorithms incorporating five distinct exploration strategies is evaluated in the “NEP” scenario. The overall average performance metrics for data gathering rates and successful landing rates are presented in Table 4. “Phase-A” represents the method that explores based solely on the A* algorithm without relying on any return policy.

Table 4.
Monte Carlo evaluation of DDQN with five exploration strategies in the “NEP” scenario.
Due to the low pass-through capability of the -Greedy exploration strategy for narrow corridors, the algorithm ultimately focuses only on data gathering tasks in open areas, as narrow pathways remain underexplored. The improvement with Go-Explore over -Greedy is minimal because it still introduces random action perturbations and lacks a clear path to the task points. The “select and reach” method based on Phase-A lacks a return strategy, preventing the system from learning effective and complete solutions. The exploration strategy based on the DP-TC method overemphasizes the characteristics of task points near narrow corridors, causing the algorithm to overlook task points in easily accessible areas. The HEROES, which is based on the robust optimization of the DP-TC method, uses a dual exponential decay mechanism to fully explore the environment and balance exploration and exploitation, proving to be a relatively optimal solution.
All algorithms demonstrate a high rate of safe landings, primarily because the simulation imposes strict penalties for failing to land at the designated take-off and landing points. This observation suggests that the NEP-problem does not compromise the algorithms’ ability to generate complete path outputs. Instead, it primarily impedes the discovery of optimal solutions, thereby affecting the overall quality of path planning, as evidenced by the total information collection rate. For instance, both the -Greedy algorithm and the “select and reach” method based on Phase-A are capable of producing complete take-off–collection–return paths, yet their information collection rates are comparatively lower.
Table 5 and Table 6 provide the training parameters, where each iteration represents the decision-making process of the agent at each step. Table 7 provides the parameters for the time required by the trained path planning model to make decisions, where each iteration represents the process of making a complete path planning decision for a single scenario. As shown in Table 5 and Table 6, the proposed HEROES requires more training resources compared to the traditional -Greedy strategy. However, there is little difference between the HEROES and Go-Explore in terms of computation time and resource consumption.

Table 5.
The training time parameters for DDQN with three exploration strategies in the “Midtown Manhattan” scenario.

Table 6.
The training time parameters for DDQN with three exploration strategies in the “Downtown Los Angeles” scenario.

Table 7.
Time Required for DDQN with three exploration strategies to make decisions for 1000 random scenarios after training.
As shown in Table 7, the HEROES can generate a reasonable path planning decision for a random scenario in an average of 3 s, which is entirely acceptable during the mission planning phase. After training, the proposed HEROES shows no significant difference in the path planning decision computation time for random scenarios when compared to the -Greedy and Go-Explore strategies within the DDQN framework.
4.6. Challenges in Practical Deployment and Directions for Future Research
The deployment of these algorithms in real urban environments presents several critical challenges. First, the uncertainty in flight costs, arising from complex weather conditions such as variable wind direction and speed, results in unpredictable energy consumption. A feasible solution involves the development of robust strategies that integrate both historical and forecasted weather data, coupled with energy redundancy measures. Second, airspace conflicts constitute an inherent risk in real-world operations, necessitating the careful planning of flight zones or the implementation of real-time air traffic management systems. Third, while this study primarily focuses on decision-making processes, the integration of local path planning algorithms is crucial for practical deployment. These algorithms should account for environment-specific behavioral models and task patterns, such as the increased energy consumption during parcel descent or the need for circling to avoid line-of-sight occlusion in surveillance tasks. Finally, legal, regulatory, and safety considerations are imperative, particularly in urban environments with stringent UAV operation regulations. Although this study has minimized the risk of unintended landings, the deployment phase requires the application of appropriate auto-landing algorithms to mitigate potential safety hazards.
This study primarily focuses on global decision making and considers common obstacle scenarios, providing appropriate solutions. For other obstacles, particularly those that are difficult to detect, such as kite strings or power lines, adjustments can be made using corresponding local algorithms. If local obstacle avoidance algorithms are introduced, these algorithms will perform path planning when encountering dynamic obstacles and generate relevant features. The global decision-making algorithm should capture these features during training to maximize overall task efficiency.
In future research, to address dynamic obstacles, uncertain flight costs due to variable weather, and real-time communication constraints, local path planning or trajectory optimization algorithms should be developed, with their features integrated into the global decision-making algorithm to achieve a comprehensive multi-UAV urban service path planning framework. By introducing more accurate flight cost maps and incorporating them into the DDQN framework, the algorithm’s adaptability to different weather conditions and the reliability of path planning can be enhanced. Additionally, considering practical resources (which can support real-time communication for a limited number of UAVs) and legal regulations (which require the real-time monitoring of UAV operational status), designing multi-agent path planning models based on real-time communication will be more suitable for engineering deployment.
5. Conclusions
In this paper, we address the data collection problem of multi-UAV path planning in urban environments. The main contribution lies in optimizing the accessibility of UAVs to densely populated high-rise building areas, and the proposed method can be extended to any target area. Under the constraints of energy and dynamic environment limitations, we model the maximization of data collected by UAVs based on an RL method with an environment reset strategy. To overcome the limitations of stationary distribution in describing the short-term behavior patterns of agents, we propose TA-Distribution to effectively capture both the short-term and long-term behavior patterns of agents. To effectively address the NEP-Problem, we introduce the DP-TC method, which leverages a deterministic trajectory approach based on the A* algorithm. The HEROES, a robust optimization of the DP-TC method, enables UAVs to fully explore the entire environment within a limited time. The experimental results indicate that the proposed HEROES method outperforms other methods in both theoretical and real-world scenarios in terms of path planning quality. Specifically, in the two real-world scenarios of Manhattan and Los Angeles, the total information collection rate increased by 24.7% and 19.5%, respectively, compared to the traditional -Greedy method and by 22.5% and 16.9%, respectively, compared to the Go-Explore method. There was no significant difference in decision-making time among the three methods, all of which successfully generated complete path outputs. However, the HEROES method requires more training resources than the -Greedy and Go-Explore methods. Future research will focus on incorporating more accurate flight cost and energy consumption estimates, as well as developing local path planning algorithms.
Author Contributions
Conceptualization, Z.J. and R.C.; methodology, Z.J. and K.W.; software, Z.J.; validation, Z.J. and L.F.; investigation, T.Y.; writing—original draft preparation, Z.J.; writing—review and editing, K.W. and R.C. All authors have read and agreed to the published version of the manuscript.
Funding
This work was supported in part by the National Natural Science Foundation of China, grant number 51975079.
Data Availability Statement
Data are contained within the article.
Conflicts of Interest
The authors declare no conflicts of interest.
Appendix A
This section aims to clearly illustrate the existence of the NEP-Problem in real-world scenarios and how it affects UAV accessibility and the quality of information gathering path planning solutions. The simulation uses a policy derived from the training process of a DDQN architecture with a -Greedy exploration strategy. The state distribution reflects the number of times a single UAV visits each state, with a blue color map indicating visit frequency; the darker the color, the more frequent the visits. To eliminate the impact of randomness, the number of episodes is set to 10,000. The simulation results for Midtown Manhattan are shown in Figure A1, and for downtown Los Angeles, in Figure A2.
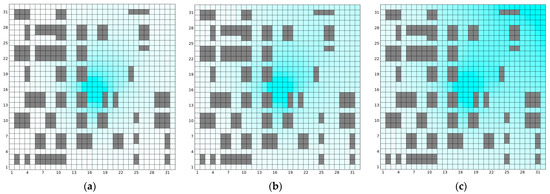
Figure A1.
Simulation results in “Midtown Manhattan” Scenario. The blue color map represents visit frequency; a darker shade indicates a higher frequency of visits. (a) Step . (b) Step . (c) Step .
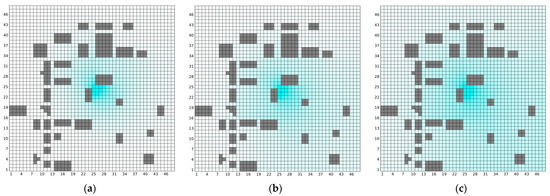
Figure A2.
Simulation results in “Midtown Manhattan” Scenario. The blue color map represents visit frequency; a darker shade indicates a higher frequency of visits. (a) Step . (b) Step . (c) Step .
In Figure A1 and Figure A2, the presence of the NEP-Problem is clearly observed. Due to the extremely low accessibility of certain regions, the algorithm fails to learn potentially better solutions for these areas. The steps in Figure A1a and Figure A2a are set based on the mission mode, which theoretically should be sufficient to reach the target points and return, but as shown, the UAVs only operate near the starting points. Even after increasing the number of steps, as shown in Figure A1b and Figure A2b, some areas still exhibit very low or even zero visit frequency. Further increasing the number of steps, as seen in Figure A1c and Figure A2c, shows that the southwestern part of Midtown Manhattan and the northwestern part of Los Angeles still have very low visit frequencies. The presence of the NEP-Problem severely hinders the discovery of more optimal solutions.
Appendix B
This section supplements some obstacle configurations not shown in Figure 2, as illustrated in Figure A3. Except for the obstacle configurations, all other simulation settings are identical to those in Figure 2. Even with guaranteed connectivity between the start and end points, there are still 51 possible obstacle configurations. Due to space limitations, it is impractical to display all 51 configurations. Therefore, categorizing the obstacle configurations based on the number of available paths z is a reasonable approach. These configurations can be divided into five categories corresponding to z values of [1, 2, 4, 5, 6].

Figure A3.
Additional experiments for other obstacle scenarios. r epresents the number of available paths. (a) Available paths . (b) Available paths . (c) Available paths . (d) Available paths . The blue color map represents visit frequency; a darker shade indicates a higher frequency of visits.
The following principles were used for further selection: Firstly, obstacle configurations with similar characteristics, such as rotation or symmetry, can be grouped together, as seen in Figure A3a,b. Secondly, an increase in the number of obstacles reduces the number of available grids, thereby increasing the state transition probability from the start to the end point. Thus, configurations with fewer obstacles are prioritized when z is constant, as illustrated by Figure A3a,c. Lastly, configurations with any impassable grids are not considered, as shown in Figure A3d. This section aims to provide an intuitive understanding of the complex mathematical description of the NEP-problem, which will later be mapped to a state probability distribution problem through the TA-Distribution and HEROES architecture.
Appendix C
As shown in Figure A4, the relationship between grid size and training time indicates that while the iteration speed decreases linearly, the total training time increases exponentially with the grid size. Excessively large grid environments can significantly increase the training time.
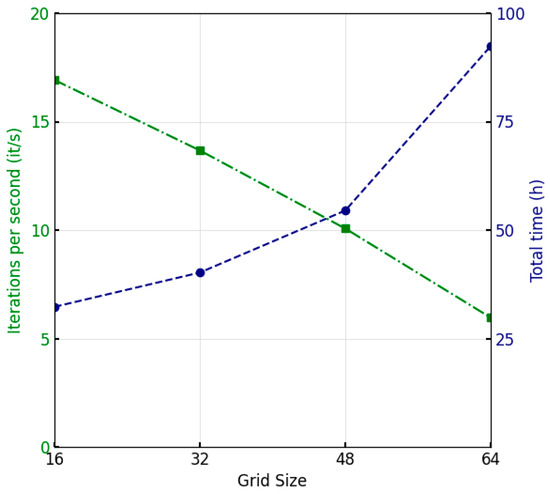
Figure A4.
The relationship between the iteration speed (it/s) and total training time (h) of the algorithm under different grid sizes. The x-axis represents the dimensions of the selected grid world, where 16 corresponds to a grid world.
References
- Outay, F. Applications of Unmanned Aerial Vehicle (UAV) in Road Safety, Traffic and Highway Infrastructure Management: Recent Advances and Challenges. Transp. Res. Part A Policy Pract. 2020, 141, 116–129. [Google Scholar] [CrossRef] [PubMed]
- Hartling, S.; Sagan, V.; Maimaitijiang, M. Urban Tree Species Classification Using UAV-Based Multi-Sensor Data Fusion and Machine Learning. GISci. Remote Sens. 2021, 58, 1250–1275. [Google Scholar] [CrossRef]
- Yi, S.; Liu, X.; Li, J.; Chen, L. UAVformer: A Composite Transformer Network for Urban Scene Segmentation of UAV Images. Pattern Recognit. 2023, 133, 109019. [Google Scholar] [CrossRef]
- Zhou, L.; Meng, R.; Tan, Y.; Lv, Z.; Zhao, Y.; Xu, B.; Zhao, F. Comparison of UAV-Based LiDAR and Digital Aerial Photogrammetry for Measuring Crown-Level Canopy Height in the Urban Environment. Urban For. Urban Green. 2022, 69, 127489. [Google Scholar] [CrossRef]
- Xu, R.; Zhang, W.; Wong, N.H.; Tong, S.; Wu, X. A Novel Methodology to Obtain Ambient Temperatures Using Multi-Rotor UAV-Mounted Sensors. Urban Clim. 2022, 41, 101068. [Google Scholar] [CrossRef]
- Zou, L.; Munir, M.S.; Tun, Y.K.; Hassan, S.S.; Aung, P.S.; Hong, C.S. When Hierarchical Federated Learning Meets Stochastic Game: Toward an Intelligent UAV Charging in Urban Prosumers. IEEE Internet Things J. 2023, 10, 10438–10461. [Google Scholar] [CrossRef]
- Osco, L.P.; Marcato Junior, J.; Marques Ramos, A.P.; de Castro Jorge, L.A.; Fatholahi, S.N.; de Andrade Silva, J.; Matsubara, E.T.; Pistori, H.; Goncalves, W.N.; Li, J. A Review on Deep Learning in UAV Remote Sensing. Int. J. Appl. Earth Obs. Geoinf. 2021, 102, 102456. [Google Scholar] [CrossRef]
- Fei, B.; Bao, W.; Zhu, X.; Liu, D.; Men, T.; Xiao, Z. Autonomous Cooperative Search Model for Multi-UAV With Limited Communication Network. IEEE Internet Things J. 2022, 9, 19346–19361. [Google Scholar] [CrossRef]
- Liu, X.; Su, Y.; Wu, Y.; Guo, Y. Multi-Conflict-Based Optimal Algorithm for Multi-UAV Cooperative Path Planning. Drones 2023, 7, 217. [Google Scholar] [CrossRef]
- Tong, P.; Yang, X.; Yang, Y.; Liu, W.; Wu, P. Multi-UAV Collaborative Absolute Vision Positioning and Navigation: A Survey and Discussion. Drones 2023, 7, 261. [Google Scholar] [CrossRef]
- de Moraes, R.S.; de Freitas, E.P. Multi-UAV Based Crowd Monitoring System. IEEE Trans. Aerosp. Electron. Syst. 2020, 56, 1332–1345. [Google Scholar] [CrossRef]
- Oubbati, O.S.; Atiquzzaman, M.; Baz, A.; Alhakami, H.; Ben-Othman, J. Dispatch of UAVs for Urban Vehicular Networks: A Deep Reinforcement Learning Approach. IEEE Trans. Veh. Technol. 2021, 70, 13174–13189. [Google Scholar] [CrossRef]
- Wan, P.; Xu, G.; Chen, J.; Zhou, Y. Deep Reinforcement Learning Enabled Multi-UAV Scheduling for Disaster Data Collection With Time-Varying Value. IEEE Trans. Intell. Transp. Syst. 2024, 25, 6691–6702. [Google Scholar] [CrossRef]
- Cai, Z.; Liu, Z.; Kou, L. Reliable UAV Monitoring System Using Deep Learning Approaches. IEEE Trans. Reliab. 2022, 71, 973–983. [Google Scholar] [CrossRef]
- Zhang, H.; Ma, H.; Mersha, B.W.; Zhang, X.; Jin, Y. Distributed Cooperative Search Method for Multi-UAV with Unstable Communications. Appl. Soft Comput. 2023, 148, 110592. [Google Scholar] [CrossRef]
- Du, W.; Guo, T.; Chen, J.; Li, B.; Zhu, G.; Cao, X. Cooperative Pursuit of Unauthorized UAVs in Urban Airspace via Multi-Agent Reinforcement Learning. Transp. Res. Part C-Emerg. Technol. 2021, 128, 103122. [Google Scholar] [CrossRef]
- Garg, A.; Jha, S.S. Deep Deterministic Policy Gradient Based Multi-UAV Control for Moving Convoy Tracking. Eng. Appl. Artif. Intell. 2023, 126, 107099. [Google Scholar] [CrossRef]
- Luo, Q.; Luan, T.H.; Shi, W.; Fan, P. Deep Reinforcement Learning Based Computation Offloading and Trajectory Planning for Multi-UAV Cooperative Target Search. IEEE J. Sel. Areas Commun. 2022, 41, 504–520. [Google Scholar] [CrossRef]
- Chang, Z.; Deng, H.; You, L.; Min, G.; Garg, S.; Kaddoum, G. Trajectory Design and Resource Allocation for Multi-UAV Networks: Deep Reinforcement Learning Approaches. IEEE Trans. Netw. Sci. Eng. 2023, 10, 2940–2951. [Google Scholar] [CrossRef]
- Liu, S.; Bai, Y. Multiple UAVs Collaborative Traffic Monitoring with Intention-Based Communication. Comput. Commun. 2023, 210, 116–129. [Google Scholar] [CrossRef]
- Swain, S.; Khilar, P.M.; Senapati, B.R. A Reinforcement Learning-Based Cluster Routing Scheme with Dynamic Path Planning for Multi-UAV Network. Veh. Commun. 2023, 41, 100605. [Google Scholar]
- Ladosz, P.; Weng, L.; Kim, M.; Oh, H. Information Fusion Exploration in Deep Reinforcement Learning: A Survey. Inf. Fusion 2022, 85, 1–22. [Google Scholar] [CrossRef]
- Lu, S.; Han, S.; Zhou, W.; Zhang, J. Recruitment-Imitation Mechanism for Evolutionary Reinforcement Learning. Inf. Sci. 2021, 553, 172–188. [Google Scholar] [CrossRef]
- Li, Y.; Wang, Y.; Tan, X. Self-Imitation Guided Goal-Conditioned Reinforcement Learning. Pattern Recognit. 2023, 144, 109845. [Google Scholar] [CrossRef]
- Singla, A.; Padakandla, S.; Bhatnagar, S. Memory-Based Deep Reinforcement Learning for Obstacle Avoidance in UAV with Limited Environment Knowledge. IEEE Trans. Intell. Transp. Syst. 2021, 22, 107–118. [Google Scholar] [CrossRef]
- Chen, Z.; Luo, B.; Hu, T.; Xu, X. LJIR: Learning Joint-Action Intrinsic Reward in Cooperative Multi-Agent Reinforcement Learning. Neural Netw. 2023, 167, 450–459. [Google Scholar] [CrossRef] [PubMed]
- Yu, P.; Zhang, H.; Song, Y.; Hui, H.; Huang, C. Frequency Regulation Capacity Offering of District Cooling System: An Intrinsic-Motivated Reinforcement Learning Method. IEEE Trans. Smart Grid 2023, 14, 2762–2773. [Google Scholar] [CrossRef]
- Liu, Q.; Liu, Z.; Xiong, B.; Xu, W.; Liu, Y. Deep Reinforcement Learning-Based Safe Interaction for Industrial Human-Robot Collaboration Using Intrinsic Reward Function. Adv. Eng. Inform. 2021, 49, 101360. [Google Scholar] [CrossRef]
- Wang, Z.; Gao, W.; Li, G.; Wang, Z.; Gong, M. Path Planning for Unmanned Aerial Vehicle via Off-Policy Reinforcement Learning with Enhanced Exploration. IEEE Trans. Emerg. Top. Comput. Intell. 2024, 8, 2625–2639. [Google Scholar] [CrossRef]
- Zhou, Q.; Lian, Y.; Wu, J.; Zhu, M.; Wang, H.; Cao, J. An Optimized Q-Learning Algorithm for Mobile Robot Local Path Planning. Knowl.-Based Syst. 2024, 286, 111400. [Google Scholar] [CrossRef]
- Wang, H.; Qin, J.; Kan, Z. Shielded Planning Guided Data-Efficient and Safe Reinforcement Learning. IEEE Trans. Neural Netw. Learn. Syst. 2024. [Google Scholar] [CrossRef] [PubMed]
- Yang, B.; Shi, H.; Xia, X. Federated Imitation Learning for UAV Swarm Coordination in Urban Traffic Monitoring. IEEE Trans. Ind. Inform. 2023, 19, 6037–6046. [Google Scholar] [CrossRef]
- Ecoffet, A.; Huizinga, J.; Lehman, J.; Stanley, K.O.; Clune, J. First Return, Then Explore. Nature 2021, 590, 580–586. [Google Scholar] [CrossRef]
- Zhu, X.; Wang, L.; Li, Y.; Song, S.; Ma, S.; Yang, F.; Zhai, L. Path Planning of Multi-UAVs Based on Deep Q-Network for Energy-Efficient Data Collection in UAVs-Assisted IoT. Veh. Commun. 2022, 36, 100491. [Google Scholar] [CrossRef]
- Karimpanal, T.G.; Rana, S.; Gupta, S.; Tran, T.; Venkatesh, S. Learning Transferable Domain Priors for Safe Exploration in Reinforcement Learning. In Proceedings of the 2020 International Joint Conference on Neural Networks (IJCNN), Glasgow, UK, 19–24 July 2020; pp. 1–10. [Google Scholar]
- Yu, H.; Xu, W.; Zhang, H. Towards Safe Reinforcement Learning with a Safety Editor Policy. Adv. Neural Inf. Process. Syst. 2022, 35, 2608–2621. [Google Scholar]
- Mnih, V.; Kavukcuoglu, K.; Silver, D.; Rusu, A.A.; Veness, J.; Bellemare, M.G.; Graves, A.; Riedmiller, M.; Fidjeland, A.K.; Ostrovski, G.; et al. Human-Level Control through Deep Reinforcement Learning. Nature 2015, 518, 529–533. [Google Scholar] [CrossRef] [PubMed]
- Van Hasselt, H.; Guez, A.; Silver, D. Deep Reinforcement Learning with Double Q-Learning. In Proceedings of the AAAI Conference on Artificial Intelligence, Phoenix, AZ, USA, 12–17 February 2016; Volume 30. [Google Scholar]
- Bayerlein, H.; Theile, M.; Caccamo, M.; Gesbert, D. Multi-UAV Path Planning for Wireless Data Harvesting with Deep Reinforcement Learning. IEEE Open J. Commun. Soc. 2021, 2, 1171–1187. [Google Scholar] [CrossRef]
- Hao, J.; Yang, T.; Tang, H.; Bai, C.; Liu, J.; Meng, Z.; Liu, P.; Wang, Z. IEEE Transactions Exploration in Deep Reinforcement Learning: From Single-Agent to Multiagent Domain. IEEE Trans. Neural Netw. Learn. Syst. 2023, 35, 8762–8782. [Google Scholar] [CrossRef]
- Liu, X.; Tan, Y. Feudal Latent Space Exploration for Coordinated Multi-Agent Reinforcement Learning. IEEE Trans. Neural Netw. Learn. Syst. 2022, 34, 7775–7783. [Google Scholar] [CrossRef]
Disclaimer/Publisher’s Note: The statements, opinions and data contained in all publications are solely those of the individual author(s) and contributor(s) and not of MDPI and/or the editor(s). MDPI and/or the editor(s) disclaim responsibility for any injury to people or property resulting from any ideas, methods, instructions or products referred to in the content. |
© 2024 by the authors. Licensee MDPI, Basel, Switzerland. This article is an open access article distributed under the terms and conditions of the Creative Commons Attribution (CC BY) license (https://creativecommons.org/licenses/by/4.0/).


