Article

Comprehensive Distortion Analysis of a Laser Direct Metal Deposition (DMD)-Manufactured Large Prototype Made of Soft Martensitic Steel 1.4313

1
Institute for Machine Tools and Manufacturing, ETH Zürich, 8092 Zurich, Switzerland
2
Inspire AG, 8005 Zurich, Switzerland
*
Author to whom correspondence should be addressed.
J. Manuf. Mater. Process. 2024, 8(2), 78; https://doi.org/10.3390/jmmp8020078
Submission received: 15 February 2024 / Revised: 27 March 2024 / Accepted: 5 April 2024 / Published: 16 April 2024

Abstract

:
Additive manufacturing (AM) by using direct metal deposition (DMD) often causes erratic distortion patterns, especially on large parts. This study presents a systematic distortion analysis by employing numerical approaches using transient–thermal and structural simulations, experimental approaches using tomography, X-ray diffraction (XRD), and an analytical approach calculating the buckling distortion of a piston. The most essential geometrical features are thin walls situated between massive rings. An eigenvalue buckling analysis, a DMD process, and heat treatment simulation are presented. The eigenvalue buckling simulation shows that it is highly dependent on the mesh size. The computational effort of the DMD and heat treatment simulation was reduced through simplifications. Moreover, artificial imperfections were imposed in the heat treatment simulation, which moved the part into the buckling state inspired by the experiment. Although the numerical results of both simulations are successful, the eigenvalue and DMD simulation cannot be validated through tomography and XRD. This is because tomography is unable to measure small elastic strain fields, the simulated residual stresses were overestimated, and the part removal disturbed the residual stress equilibrium. Nevertheless, the heat treatment simulation can predict the distortion pattern caused by an inhomogeneous temperature field during ambient cooling in an oven. The massive piston skirt cools down and shrinks faster than the massive core. The reduced yield strength at elevated temperatures and critical buckling load leads to plastic deformation of the thin walls.

1. Introduction

Additive manufacturing (AM) excels by allowing for the creation of complex shapes, without the conventional steps and expenses associated with tooling, dies, or casting molds. Direct metal deposition (DMD) is an AM process using a laser as the heat source for melting and depositing metal, as reviewed in [1,2]. According to Thompson et al. [1], DMD offers rapid production, enabling shape optimization for cost reduction, weight reduction, and enhanced component functionality. Korsmik et al. [3] claimed that DMD deposits material with a minimal heat-affected zone (HAZ), good material density, and strong metallurgical bonding. DMD is commonly used in the energy and aerospace industries, where high-value components are repaired and built. In recent years, complex and large parts, such as impellers [4], propellers [3], or pistons [5], have been built using DMD.
Despite the advantages derived from AM technology, there are still a lot of unresolved obstacles that limit the application, such as process instabilities [6], defect formations [7], anisotropic mechanical properties [8], residual stresses [9,10], and distortions [10,11]. After the buildup, all of these print failures lead to scrap, which is very time and cost intensive. The most prominent defect is distortion, especially in large parts, that can be orders of magnitude larger than the post-machining accuracy. It is common that additively manufactured parts are post-processed by annealing, as presented in [12,13], to target traditional material properties such as improved ductility. Above the yield point at elevated temperature, residual stresses are transformed via plastic deformation, as described in [14,15]. However, if the cooling and heating cycles are conducted too fast, further stresses can be induced.
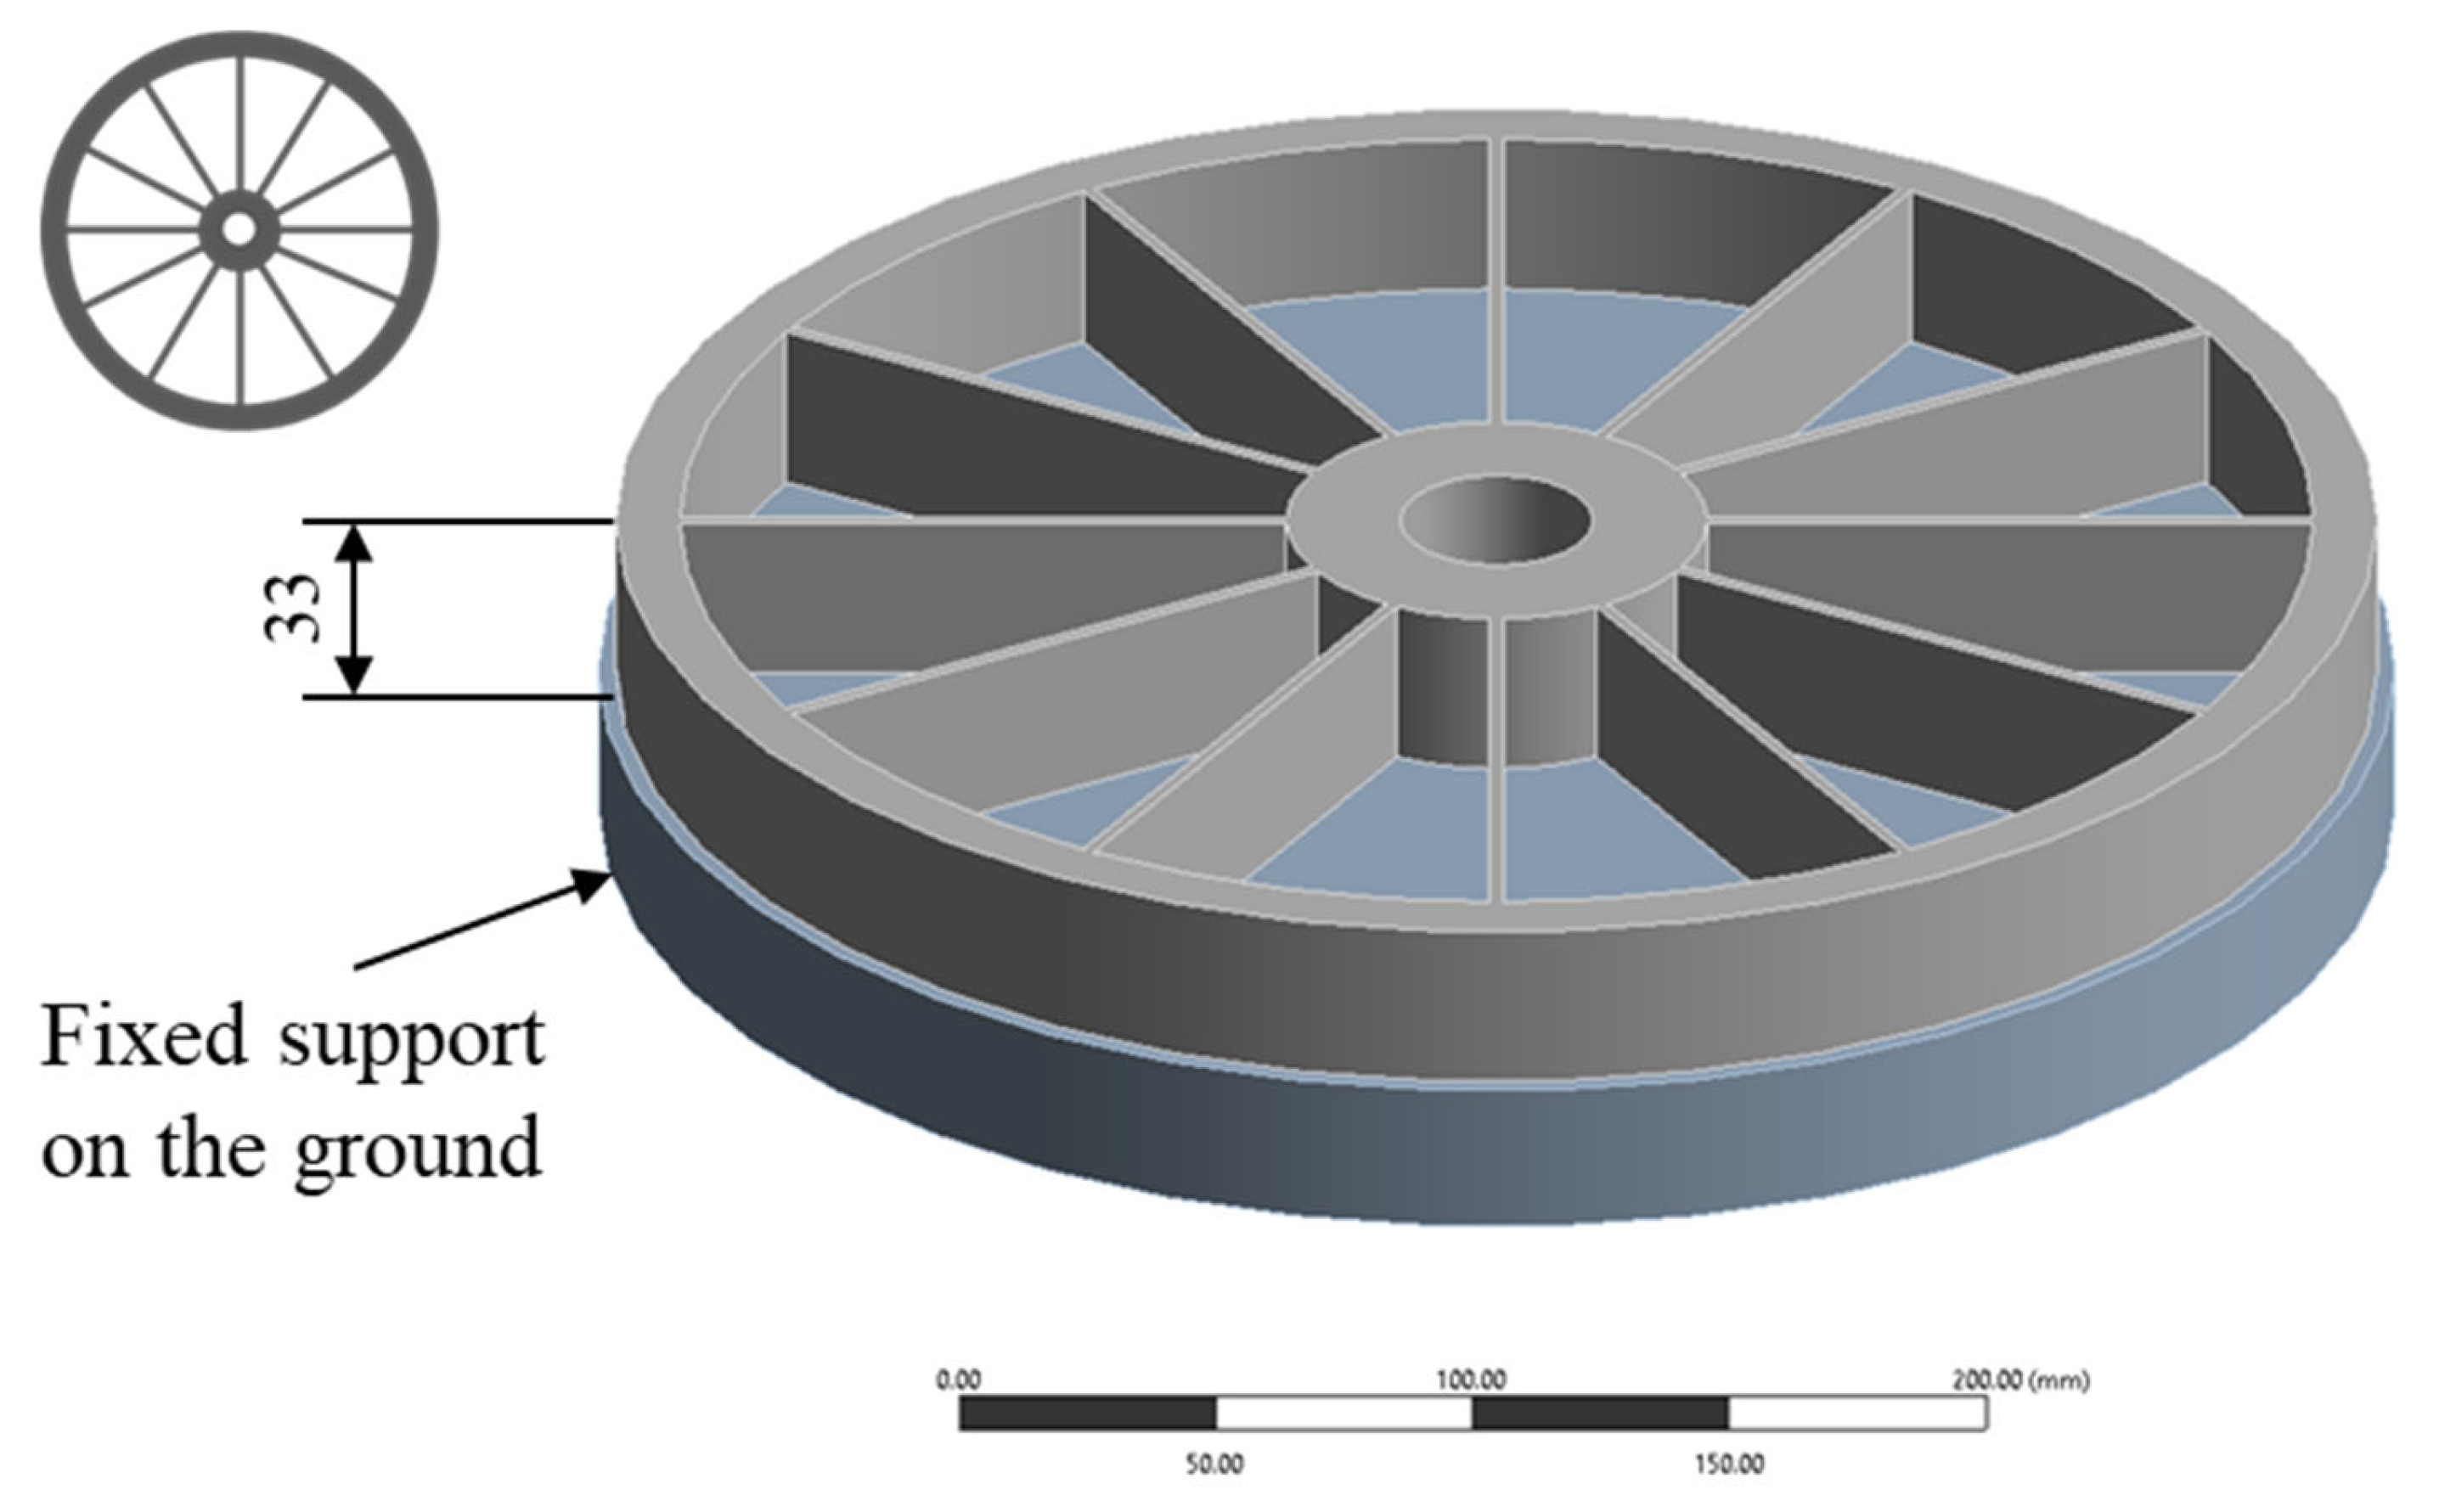
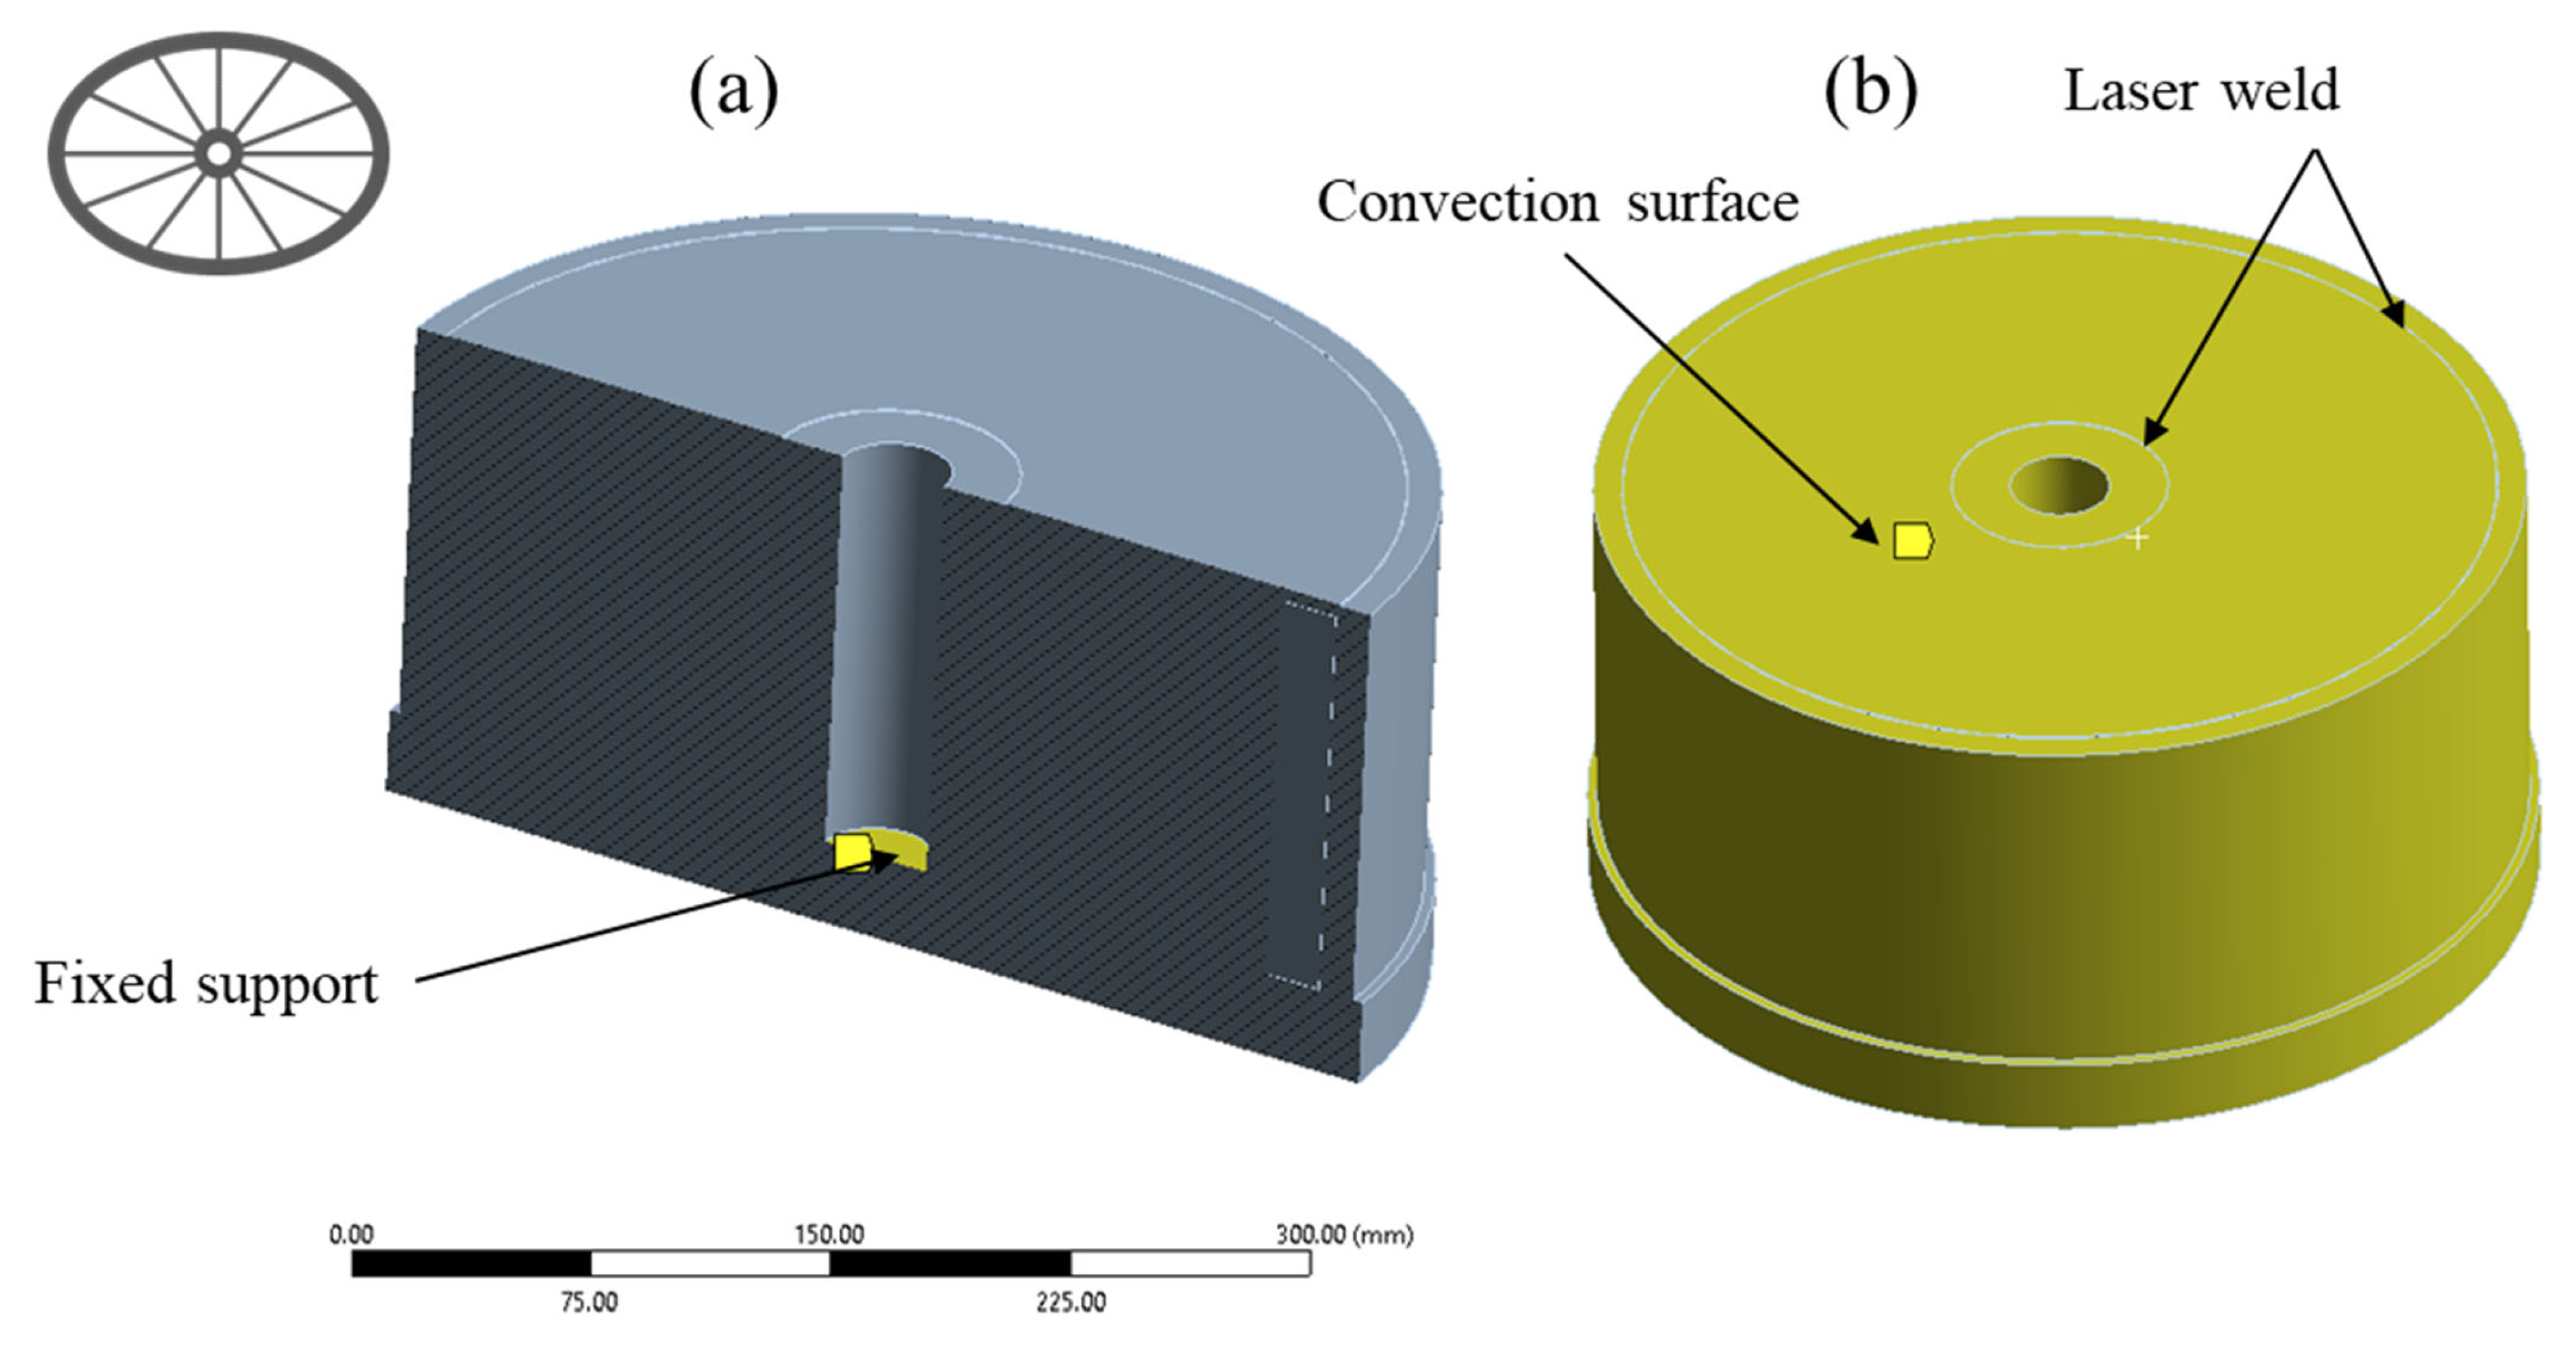
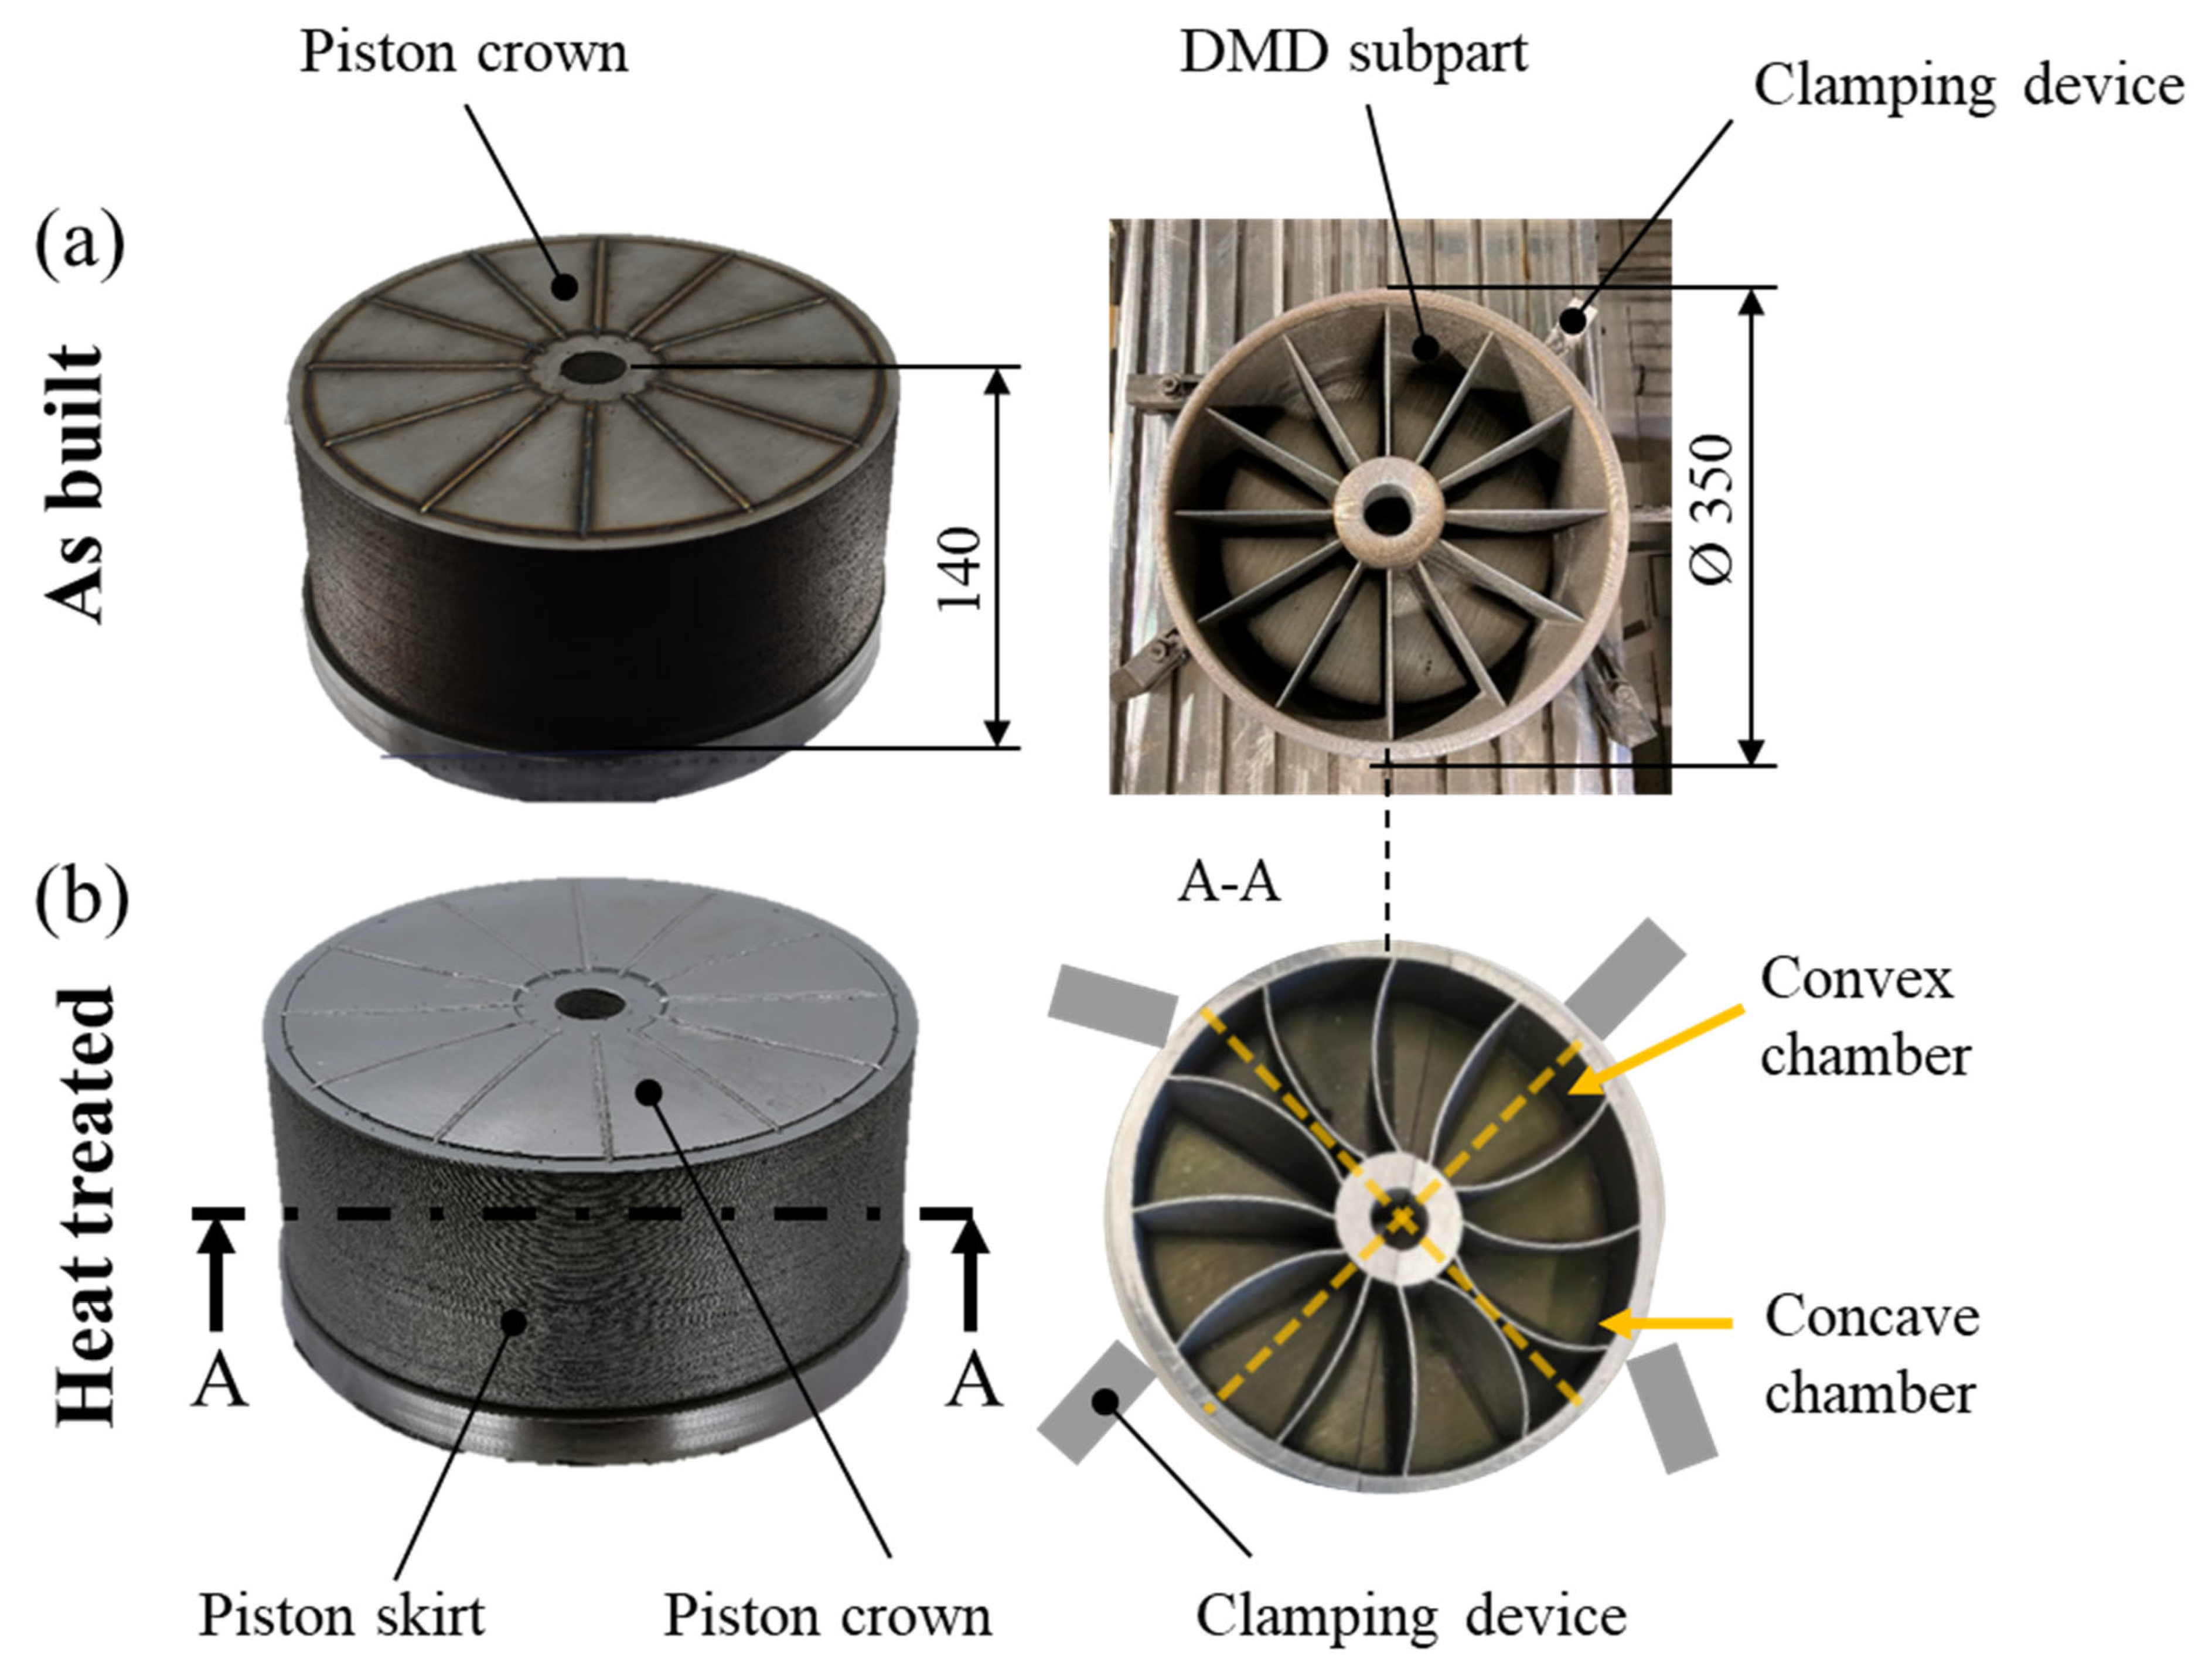
In a previous study, Dey et al. [5] successfully produced a piston for a gas compressor through DMD and laser welding using martensitic steel. The prototype was characterised by a massive outer wall and core interconnected by thin walls. The piston was completely sealed from both sides. The main manufacturing steps were as follows: (i) additively manufacturing the DMD subpart on a substrate, (ii) laser welding a conventionally manufactured piston crown on top of the DMD subpart, and (iii) annealing of the final prototype. The piston design and its thin walls are exposed to a high risk of buckling. In most cases, the focus is rather on the critical buckling load instead of the behaviour of the distortion pattern since this is less measurable. The piston is used as a case study to analyse the buckling distortion of a large part of soft martensitic steel, including the process history. To solve buckling, analytical approaches can be used, as described by Meyer [16], to calculate the critical load. Furthermore, linear or nonlinear eigenvalue analysis including imperfections can be employed to predict the distortion shape, as presented in [17]. Malekjafarian et al. [18] previously investigated the buckling capacity of additive manufactured parts experimentally.
To investigate, predict, and reduce part distortion, it is important to understand the origin of distortions. Gray et al. [19] reviewed analytical models of welding distortion based on the thermo-mechanical effects in thin-plate fabrication. They stated that the main global thermo-mechanical effects that drive distortion depend more on the thermal fields in the solid region, where the thermal fields are much smaller than in the welding zone and well below the melting point. Unlike a simple welding problem, the inherent strain in DMD is influenced by evolving mechanical boundaries and geometry as additional material is deposited in each layer.
If the residual stresses exceed the yield stress, the stresses are relieved by plastic deformation, as explained in [15]. This distortion can be used as an inexpensive and fast assessment of the amount of residual stresses in the part, described by Mishurova et al. [20], who extensively researched the distortion of additive manufactured structures. However, the distortion is primarily impacted by the geometry and the thermal expansion of geometrical features, resulting in specific patterns or shapes that prove difficult to quantify. There are two common types of stress measurement methods according to [21], either destructive by stress relaxation or non-destructive by measuring atom distances. The non-destructive methods have the advantage of specimen preservation, but they require detailed calibrations, relatively expensive equipment, and measuring effort for reliable results. In comparison, the destructive residual stress measurement methods generally require much less effort because they measure fundamental quantities, such as displacements or strains, thus giving them a wide range of application. The basic principle is to determine the residual stresses from the displacements measured as some stressed material is cut or removed from the specimen. The challenge of this method is that the stress is removed from one part of the specimen while the measurements are made in a different part. This feature significantly complicates the quantification. However, tomography is a common method to compare the actual geometry with the nominal geometry qualitatively. X-ray diffraction (XRD), on the other hand, is a valid non-destructive method to measure residual stresses based on the lattice spacing but only in a limited region of the part, as studied by Li et al. [22]. The experiments depend on the shape and size of the components, the nature of the stresses measured, sample preparation, and accuracy of XRD, as described in [23].
According to the small deformation theory, described in [24], the total strain (elastic and plastic) of an additively manufactured, laser-welded, and heat-treated martensitic steel part can be decomposed into several components, described by Equation (1),
ε tot = ε V +   ε DMD +   ε LW + ε HT
where εV escribes the volumetric strain induced by phase transformation, εDMD the strain due to DMD buildup, εLW the strain due to laser welding, and εHT the strain due to heat treatment. Furthermore, the alternating heating can cause an accumulation of plastic strain.
In DMD simulations, it is very challenging to reconstruct the thermal history since the moving heat source and continuously changing geometry during buildup cause spatial and time-dependent variations in temperature. In practice, thermal field calculations can be carried out using finite-element (FE) numerical models, in which nonlinear thermal properties, boundary conditions, and the real part geometry can be considered. However, it should be mentioned that thermo-mechanical analysis is more difficult than the purely thermal aspects, due to the complicated interaction of thermal and mechanical strains. According to Hajializadeh and Ince [25], all of the modelling approaches consist of nonlinear thermo-mechanical analysis. Decoupled approaches are usually preferred since the analysis time is significantly lower compared to coupled approaches, and the difference in results is negligible, as demonstrated in [26,27]. An incremental deposition of the material requires certain techniques in numerical analysis. The three most common methods are quiet element [28], inactive element [29], and hybrid activation [26,30]. In the quiet element activation method, the final geometry of the part is already present in the model prior to simulation. The material properties of those non-deposited elements (or layers) are scaled down in such a way that they are not considered anymore. However, this can lead to an ill-conditioned stiffness matrix, and the large number of inactive elements at the beginning increases the number of equations to solve. A common approach for DMD simulation is the inherent strain method, in which the model is discretised in three different scales (micro, meso, and macro), as presented in [31]. The result of the microscale model is the thermal history of a small cubic heat source based on a fully thermal analysis of the first layers. The small cubes are implemented as a fully coupled thermo-mechanical model, considering the layers and hatch distance. Afterwards, the resulting strain components are imposed on the thermoelastic macroscale model.
Although distortion simulations can be used to avoid cost-intensive trial-and-error approaches, most of the models are limited to simple geometries or sizes such as rectangles [32,33] and thin walls [34,35,36]. The reasons are extensive computational time and convergence errors on today’s software and computers. Furthermore, the calculation stability suffers from the high number of contact bodies in the model, and the general modelling effort is high [37]. Appropriate assumptions and simplifications have to be made for modelling distortion. Nevertheless, Biegler et al. [38] presented a study on simulating a turbine blade with a size of 75 mm × 20 mm × 50 mm. In their study, the whole component mesh is kept in one piece, and the fully transient, layer-by-layer material deposition is implemented via element sets. However, they did not consider the post-heat treatment in their model.
Kang and Rong [39] presented an analytical and numerical model to describe the heating process in heat treatment furnaces. They mainly described the radiation, convection, and conduction, depending on the location in the furnace. Furthermore, Deshpande [14] simulated butt joint welding and post-weld heat treatment using commercial software but was limited to a simple single-track study. Berglund et al. [40], on the other hand, modelled welding and stress relief heat treatment for an aero engine component but did not investigate a 3D but an axi-symmetrical model. Simulating large-scale parts becomes more time consuming since the parts are more susceptible to larger distortion. Huang et al. [24] presented a study on the large-scale simulation of residual stress and distortion by implementing adaptive mesh refinement and other methods. The assumptions of nonlinearity (distortion, material, and contact) described by Deng and Murakawa [41] are the basis for DMD process simulations.
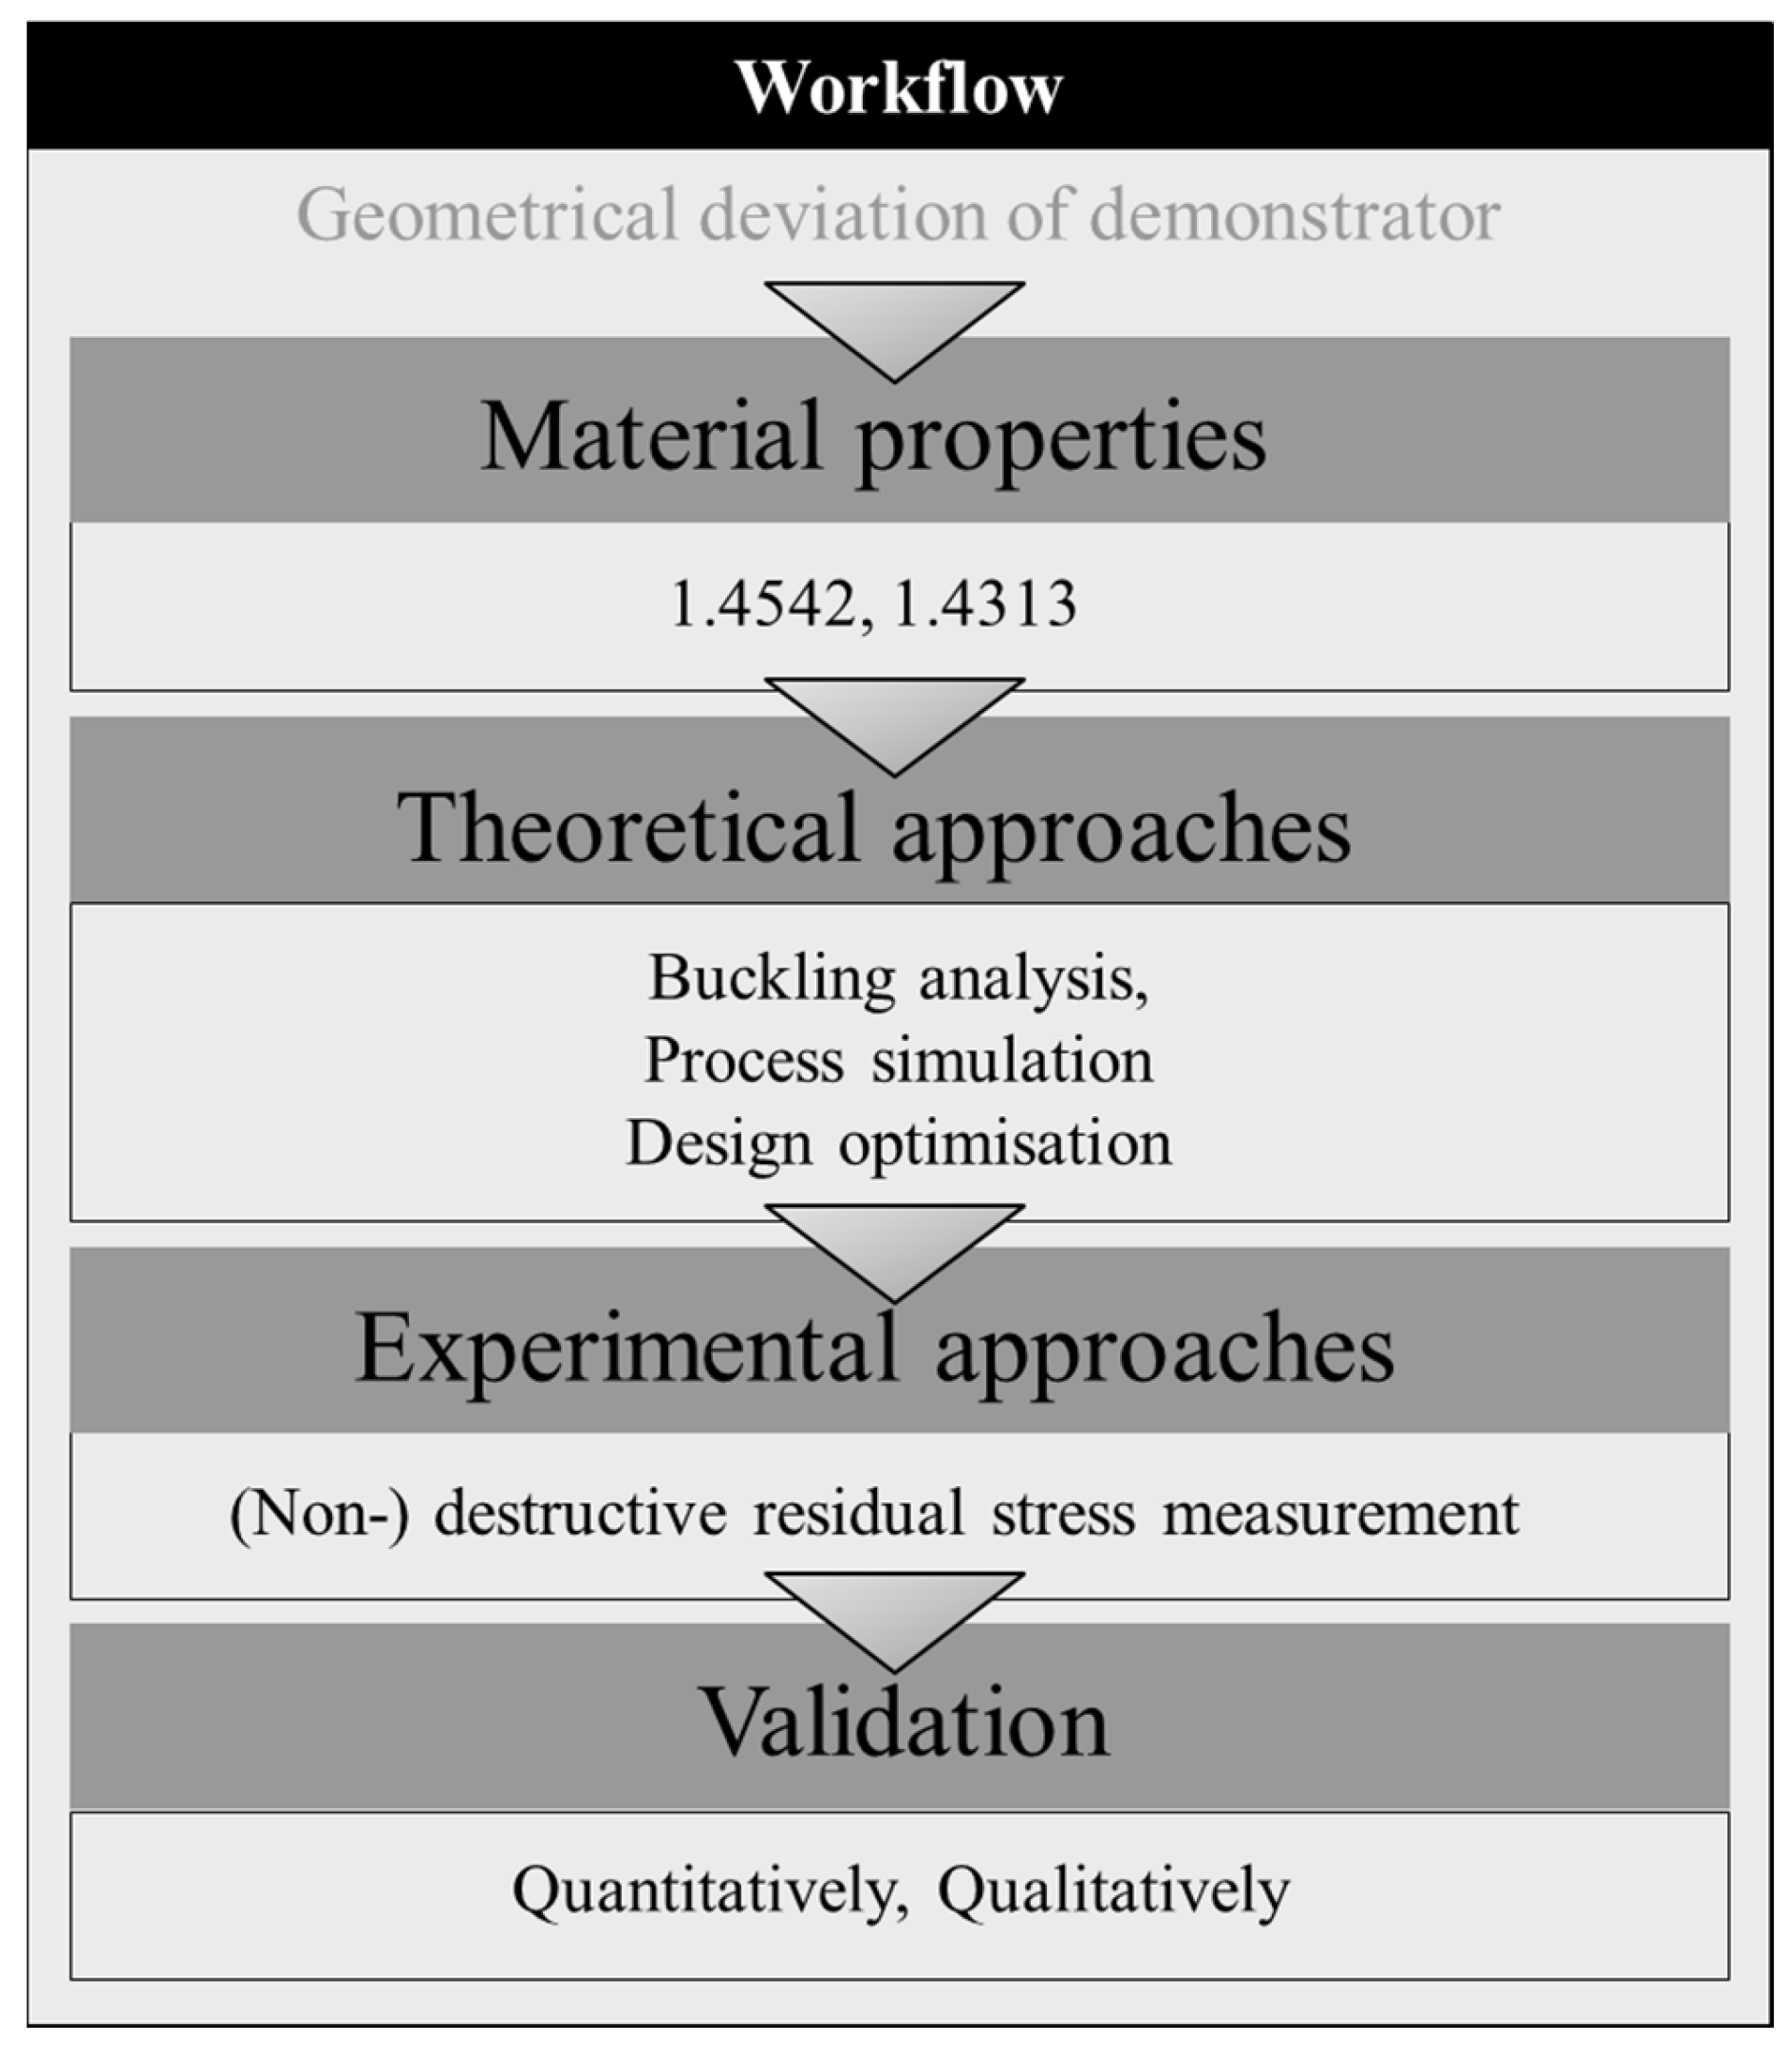
This study investigates the distortion behaviour of a large and complex-shaped part, including the part geometry, the DMD process, and the post-heat treatment. As discussed, in previous numerical research approaches and the inherent challenges, investigating the process history of a complex part produced by DMD, laser welding, and the heat treatment is very challenging. This study presents a method to predict the distortion of an additively manufactured piston, in which the piston crown was conventionally manufactured and joined by laser welding and, finally, heat treated. For this, two different numerical main approaches were developed, consisting of different subsets to test assumptions. The overarching goal is to understand the present distortion of the final prototype and to ensure geometrical integrity in the second manufacturing iteration.

2. Materials and Methods

The workflow, visualised in Figure 1, is presented to analyse theoretically and experimentally the present buckling distortion of a piston for a gas compressor. FE analysis was used to create numerical models, which were qualitatively validated by tomography and quantitively by XRD. Two process models for the crucial manufacturing steps affecting the global temperature field (DMD and heat treatment) were developed using ANSYS. The models were not coupled to save computational time.

2.1. Heat Treatment

The prototype was produced on a TruLaser Cell 7020 from Trumpf, Ditzingen, Germany on a flat and steady table by using DMD and laser welding, as described by Dey et al. [5]. In order to achieve the required toughness and avoid oxidation, the piston was annealed in a vacuum chamber with the temperature–time profile shown in Figure 2. A vacuum furnace with integrated thermocouples, a cooling fan, and inlet nozzles was employed. Two thermocouples were placed on the part. Only the annealing process was performed since the material was hardened during the DMD process. A vacuum pressure of pvac = 2.4 × 10⁻¹⁰ mbar was applied. The prototype was heated consistently at a rate of R = 65 °C/h until it reached a temperature of Tmax = 590 °C, where it was maintained for 11 h. Subsequently, the cooling was executed in three cooling steps: (i) Cooling from Tmax = 590 °C to T = 350 °C for 3 h while the heating system was turned off, leading to a cooling rate of R = 80 °C/h. (ii) Cooling from T = 350° to T = 200 °C while the underpressure was released and the atmospheric pressure restored. Additionally, nitrogen was injected through nozzles, leading to a cooling rate of R = 100 °C/h. (iii) Cooling from T = 200 °C to room temperature with a fan at full power, resulting in a cooling rate of R = 200 °C/h.

2.2. Material Properties and Raw Materials

The prototype was built of powder-shaped and hot-forged 1.4313, as described by Dey et al. [5]. The powder particles were in the range of 63–150 μm. As the thermal material properties of 1.4313 are not comprehensively documented in the available literature, a comparable martensitic steel from the ANSYS material library was used for the simulations. Further, 1.4542 (17-4PH) is a precipitation-hardening martensitic steel with a material composition similar to that of 1.4313, except for a higher chromium content of 16% instead of 13%. Precipitation-hardening steels are designed with a similar base alloy composition, but solutes such as Cu, Mo, and Nb enable precipitation hardening according to [42]. The chemical composition of 1.4542 is described in Table 1, and that of 1.4313 in Table 2.
Figure 3 illustrates the temperature-dependent material properties of both steels. The density, Young’s modulus, yield strength, coefficient of thermal expansion, melting point, specific heat capacity, and thermal conductivity of 1.4313 are based on the database of Matmatch [45], whereas the Poisson’s ratio, shear modulus, tangent modulus, and bulk modulus of 1.4542 are derived from the material library of ANSYS. The curves are comparable, except for the most notable difference in yield strength. At temperatures that are higher than the specified values, the properties are treated as constants.

2.3. Theoretical Approaches

Four approaches were investigated to analyse the buckling of the piston. First, an analytical approach was employed to investigate the critical buckling load. Second, an eigenvalue analysis considering the overpressure was performed. Third, the DMD process was simulated. ANSYS 2022 R1 Mechanical Workbench Additive, along with the DED process extension, was employed for the DMD simulation, considering the tool path and changes in geometry during buildup. Last, the heat treatment was simulated with ANSYS 2022 R1 Mechanical Workbench. In the DMD and heat treatment simulation, thermal-transient calculations were followed by static structural calculations.

2.3.1. Eigenvalue Buckling

The eigenmodes belonging to the lowest eigenvalue obtained by a bifurcation analysis were simulated to predict the buckling distortion pattern of the piston. Furthermore, geometrical and pressure-based imperfections were introduced to artificially approach the experimental distortion, which are presented in Figure 4.
An eigenvalue analysis was employed to solve the bifurcation point at which the structure starts to buckle. Outcome of the analysis is the load multiplier αi and the mode shape Ψi. The load multiplier is the multiplying factor to the applied load at which the structure buckles, and mode shape is the direction in which the structure buckles at corresponding load multiplier. It is known that the smallest eigenmode or load multiplier represents the critical load before the structure collapses; hence, only the first three modes were considered. A mesh refinement was performed in which the element size s was reduced from 15 mm, 12 mm, 10 mm, and 8 mm to 6 mm. To simulate the existing distortion, a non-cylindrical geometry was designed to capture the geometric deviations during the buildup. An elliptical shape deviation in the as-built stage of the final prototype was observed, with the major axis being longer than the minor axis, as presented in Figure 4a. This was accomplished for the elliptical piston geometry at the uniform pressure load case. Based on the results, the element size was set to s = 10 mm for the following simulations.
The temperature Tmax = 590 °C was set to the maximal temperature of the heat treatment. It was assumed that the vacuum during the heat treatment caused an overpressure in the chambers, which deformed the AM subpart according to the eigenmode. The interior piston was loaded by the maximum possible pressure pmax. It was assumed that the piston was completely sealed at ambient temperature p0 = 1 bar, and the volume stayed the same during heat treatment. The pressure of an enclosed gas increases with higher temperatures according to the ideal gas law. The resulting equation for the maximal pressure inside the piston is
p max = T max K T 0 K · p 0
where the maximal temperature is Tmax = 863 K, the ambient temperature T0 = 293 °C, and the ambient pressure p0 = 1 bar. This results in a maximal pressure pmax = 2.95 bar. Considering the very low vacuum pressure pvac = 2.4·10−10 MPa, the maximal pressure difference Δpmax = 0.295 MPa equals the maximal pressure or overpressure during the heat treatment.

Eigenvalue Buckling including Imperfections

Imperfections such as a single leak and a double leak were applied to the eigenvalue analysis in terms of pressure distributions. A leaking chamber was not loaded by pressure. It was assumed that a sealed chamber would have enlarged in vacuum, and a leaking chamber would have reduced its volume, affecting the mode shape and load multipliers. The cylindrical and elliptical double weld were simulated in any possible combination, as presented in Figure 4b.

2.3.2. DMD Simulation

The goal of the DMD process simulation was to predict the macro-level distortions and residual stresses during buildup. The simulation was performed for the material properties of 1.4313 and 1.4542. The model undergoes changes over time. Initially, the entire component is meshed using layered hexahedrons elements. Subsequently, the deposited material, be it wire or powder, becomes exposed by activating individual elements through the element birth technology at a specified temperature, typically equal to or near the melting point. The welding melt pool was not explicitly simulated. Instead of applying a heat flux, the weld seam zone was assigned to the melting temperature. The assumption is that the process parameters for the build are appropriately configured, ensuring that the developed temperature consistently matches or exceeds the melt, without significantly exceeding it. Clustering is used to split the weld tracks into smaller pieces, consisting of several mesh elements. The clusters are exposed to one temperature in a time step and can be controlled by the cluster volume. They are required to achieve accuracy while reducing the simulation time. A large implicit integration time step size of t = 0.01 s was used throughout the simulation. This was sufficient to capture the induced thermal and plastic strains driving the distortion. The phase transition was accounted for using temperature-dependent material data. Mayer et al. [46] proposed a layer height of 10–20-times the actual metal powder layer thickness for SLM simulations as an appropriate balance between accuracy and numerical effort. The DED process extension assumes perfect melt of a powder feedstock. The actual layer height of the process was hl = 0.73 mm. The modelled layer heights ranged between 3×, 5×, and 10× the actual layer height, resulting in h1 = 2.19 mm, h2 = 3.65 mm, and h3 = 7.3 mm. The melting temperature Tm = 1450 °C and convection coefficients of the surrounding air and shielding gas of α = 10 · W m 2 K . Furthermore, the initial build plate and room temperature were T = 23 °C. The element size for the build plate was set to se = 5 mm.
The main simulation work was performed on a server with 28 cores and 128 Gb RAM. However, the original height of the piston geometry could not be simulated. The reason is that exceeding a certain model size or simulation time results in failed cool-down steps. To prevent this error, the geometry was reduced in height from hp,a = 136 mm to hp,m = 33 mm. The reasons behind this were that new results can be generated quickly, although the distortion pattern remains unaffected by this approach. The pattern will be similar since the material deposition, which causes the deformations, remains continuous along the height. The model used for the simulation, in which the DMD buildup and substrate are considered, is displayed in Figure 5. The substrate and buildup material are the same.
The original G-code was slightly adapted with a self-written Python code to meet the requirements of ANSYS. The mesh is segmented into groups called clusters of constant, adjustable volume following the build sequence. These groups are sequentially activated as a cumulative sum each time the simulation is initialized. In DMD simulations, the two relevant mesh size parameters are in buildup and feed direction, namely the height and width of an element. The mesh refinement has to be balanced between accuracy and numerical effort.
The following assumptions and simplifications were made to reduce the calculation effort:
  • Neglecting the clamping elements;
  • Reducing the part height from hp,a = 136 mm to hp,m = 33 mm to reduce the model size.
In order to enhance the simulation quality and time, a sensitivity analysis for the simulation parameters was conducted. The effect of the mesh ratio on the maximal displacement and the simulation time was investigated on a simplified structure according to the mesh parameters listed in Table 3. The mesh aspect ratio α, ranging between α =1.1 and α = 0.2, is a measure for element quality and was considered during the evaluation. Furthermore, the deposition rate m ˙ was varied between 12 mm3/s and 120 mm3/s for a mesh height of h2 = 3.65 mm and a mesh width of w = 2.5 mm.

2.3.3. Heat Treatment Simulation

The goal of the heat treatment simulation is to predict the macro-level temperature-level distortions during heat treatment. The following assumptions and simplifications were made:
  • Neglecting the position of the piston in the oven.
  • Representing the laser welds between piston crown and DMD subpart by a contact surface.
  • Neglecting the dead weight of the piston on the distortion due to the levelled charging floor.
  • Neglecting the heating cycle as the shrinkage during cooling leads to compression and buckling of thin plates.
  • Elliptical geometry input due to thermo-mechanical errors in machine tools, as described by Mayr et al. [47].
Large deformations were enabled in all FE models, which allowed for unstable and geometrically nonlinear deformations of the structure. In this case, the stresses do not become infinitely high. Instead, after reaching the maximal load, the part deforms into a new shape and achieves a new stable equilibrium, which represents the most appropriate reality.
The nominal geometry of the piston used for the path planning is presented in Figure 6a. The heated piston is exposed to convection without any pressure load. The applied boundary conditions of remote displacement and convection are illustrated in Figure 6a,b. The contact surface of the laser weld was excluded from the convection.
Analogous to the DMD simulation, mesh refinement was performed. The relatively coarse mesh, in the beginning, was gradually refined. For this purpose, the element size s was reduced from 15 mm, 12 mm, 10 mm, and 8 mm to 6 mm. Furthermore, the convection coefficient α varied between 50 · W m 2 K , 100 · W m 2 K , and 600 · W m 2 K .
A simulation time of ts = 6000 s was imposed, modelling the highest cooling rate of R = 200°/h. The ambient temperature was set to Ta = 19.85 °C in the unloaded state. The ambient convection temperature of Tc = 50 °C was adopted. In order to represent the fan-cooling, the convection coefficient α10 = 100 · W m 2 K was set for an air speed of va = 10 m/s according to [48], as listed in Table 4.

Inhomogeneous Pressure Loads

An FE simulation without bifurcation analysis can lead to difficulties in solving equation systems or numerical stability issues. To overcome the problem of a singular stiffness problem, imperfections were introduced. These imperfections represent leakages due to welding defects and geometrical deviations due to kinematic errors, which could lead to different pressure distributions but are not considered in a continuum body. In order to describe the stochastic distortion pattern, the concave buckled chambers were loaded with a relatively lower pressure, whereas the convex chambers were loaded with a relatively higher pressure, as displayed in Figure 7. The intermediate chambers were pressurized to receive a continuous decrease in the piston crown distortion. The elliptical model and a simulation time of ts = 6000 s were applied.

2.3.4. Critical Buckling Load

Analytical methods for determining critical buckling loads are available in the literature to calculate the critical buckling load of various geometries, including rods and plates, as described by Meyer [16]. His approach was used for calculating the critical buckling load σc of a thin plate fixed at both ends according to Equation (3) and Table 5, where E is the Young’s Modulus and εc the critical compressive strain for plate buckling.
σ c =   ε c   ·   E
ε c = π λ 2
λ = 2 b s · 3 1 v 2 k
α = a b
α <   α g k = k 2 = C 1 +   C 2   ·   α 2 +   α 2

2.4. Experimental Approaches

2.4.1. Destructive Residual Stress Measurement

The heat treatment simulation was validated by tomography on the final prototype employing the ATOS Core 135 3D scanner from GOM, Braunschweig, Germany with a resolution of 50 µm and compared with the nominal data of the CAD model. After tomography, the final prototype was cut in four sections by sawing, first vertically and then horizontally, to expose the distortion of the thin walls. For EDM, the CUT AM 500 from + GF +, Losone, Switzerland with a 0.2 mm wire and an electrolyte mixture was used to ensure mild etching.
The DMD simulation was validated qualitatively by stress relaxation of the as-built DMD subpart. Hence, a 90°-section was cut out of the as-built DMD subpart (360°) by EDM, as indicated in Figure 8. This approach mirrors the common method used for measuring stresses due to external loads. The load is associated with residual stresses and is changed as the material is cut or removed. The 90°-section was measured afterwards by tomography again to measure whether shape deviations occurred. Since the surface of DMD parts is too rough for XRD, it was unavoidable to remove material from the stressed as-built DMD subpart. Electric discharge machining (EDM) was applied to achieve a flat surface without inducing surface stresses.

2.4.2. Non-Destructive Residual Stress Measurement

The DMD simulation was validated quantitatively by XRD of the as-built 90°-section DMD subpart. The sin2Ψ method of XRD technique is applicable for plane stress condition, as is the case in thin walls, and was, therefore, used to determine the magnitude of the residual stress to the depth of about 8 µm in the as-built piston. The XRD method for lattice strain measurement is based on well-established Braggs law according to
λ = 2 d · sin θ
where λ is the X-ray wavelength, d is the interatomic lattice spacing, and θ is the diffraction angle according to [49,50]. The technique measures elastic stress from diffraction elastic constants. The stresses are determined from measurable elastic strains, assuming linear elastic distortion in the crystal lattice plane. The lattice strains for the reflections ε ψ   h k l at angle ψ are calculated from the shift in interatomic lattice spacing. The lattice spacing varies according to the manufacturing process outlined in [50] and described as
ε ψ   hkl = d ψ   hkl d 0 d 0
where d0 is the stress-free lattice spacing derived from a reference and the dψ is the measured stressed lattice spacing.
The portable diffractometer Goniometer G3 from Stresstech, Rennerod, Germany was used for XRD. The diffractometer uses Xtronic 13 computer software for data processing and the analysis of results. Cr Kα radiation was used, which has wavelength λ = 0.229 nm as X-ray anode. The diffraction angle of the radiation was ψ = 156.4°, and the ferritic body centre cubic lattice {211} was assigned to the martensitic stainless-steel specimen. The measurements were conducted along the thin walls, starting from the massive core to the outer piston skirt. One measuring point was located at the massive piston core, 5 points equally distributed with a distance of 30 mm each along the thin wall, and the last measuring point located on the massive piston skirt.

3. Results

3.1. Present Distortion Pattern

The heat treatment caused severe buckling distortion, and the piston did not achieve the general tolerances of the technical drawing anymore. The erratic distortion pattern exhibited symmetry along two symmetry planes, as presented in Figure 9b. Two chambers decreased in volume (concave chamber), while two expanded their volume (convex chamber), and the remaining walls buckled towards the concave chamber. Both the piston crown and piston skirt also suffered buckling distortion. The maximal displacement of the piston crown and skirt measured around dmax = 4 mm, and the maximal displacement of the thin walls, measured dmax = 12 mm. In order to investigate the interior of the final prototype, it was sectioned by sawing into four segments.

3.1.1. Eigenvalue Buckling

The mesh sensitivity analysis revealed that the distortion pattern is highly dependent on the mesh size, as illustrated in Figure 10a. The findings indicate that an element size of se = 10 mm resulted in a distortion pattern that most accurately approximates the present distortion pattern. However, the exact same distortion pattern could not be simulated by the first three modes presented in Figure 10b. The maximal displacements of a buckled thin wall were dmax = 0.5 mm, even at an elevated temperature of Tmax = 590 °C.

Inhomogeneous Pressure Distribution

Different distortion patterns could be achieved by simulating the eigenshapes. The pressure distribution describes possible leakages, and the forces describe the clamping load. However, the present distortion pattern could not be predicted, as presented in Figure 10c.

3.1.2. DMD Simulation

The simulation results were qualitatively evaluated by visual inspection and categorized. The maximal deformation for three different layer heights (h1 = 2.2 mm, h2 = 3.7 mm, h3 = 7.3 mm) and a mesh width of w = 2.5 mm is illustrated in Figure 11b. A finer mesh with a lower mesh aspect ratio resulted in fewer irregularities and a maximal displacement, especially in areas with high gradient stresses.
The maximal displacement dmax and simulation time ts for the mesh heights h1 = 2.2 mm, h2 = 3.7 mm, and h3 = 7.3 mm and a mesh width of w = 2.5 mm are visualised in Figure 12a. The largest deformation occurred when using the largest mesh height. An increase in deposition rate V ˙ did not affect the simulation time and maximal displacement dmax significantly, as displayed in Figure 12b. A mesh aspect ratio of α = 1.1 resulted in good results without discontinuities, and the convergence of the simulation was compromised since more substeps had to be taken per simulation step.
The thin walls experienced normal tensile and compressive stresses during the buildup, as shown in Figure 13a. Normal tensile stresses in the x-direction achieved their maximum towards the massive core. The piston skirt revealed concave curvature towards the centre of the piston where compressive forces occurred, as displayed in Figure 13b. The results of the measured points are presented in Table 6. The massive core and piston skirt cooled down faster than the thin walls due to the higher conduction, resulting in tensile stresses near the core and compressive stresses near the piston skirt within the thin walls. According to the simulation, the tensile stresses were higher compared to the compressive stresses, which prevented buckling. Simulating 1.4313 resulted in a similar behaviour but with a maximum stress σmax = 1590 MPa instead of σmax = 1464 MPa, which supports the assumption that the simulation is insensitive to the material properties.

3.1.3. Heat Treatment Simulation

The sensitivity check resulted in a maximal displacement of dmax = 2.3 mm for α = 600 · W m 2 K compared to dmax = 1.04 mm for α = 50 · W m 2 K . A variation in the mesh did not lead to a significant change in the maximal displacement, as illustrated in Figure 14.
The maximal part temperature decreased from Tmax = 590 °C to T = 53 °C within a simulation time of ts = 6000 s. Since the piston was cooled by the surrounding atmosphere, an inhomogeneous temperature distribution occurred between the surface and the core of the piston. The piston skirt and crown cooled faster than the core and major parts of the thin walls, as illustrated in Figure 15a. At ts = 600 s, the temperature ranged from T = 135 °C at the piston crown to T = 428 °C at the core. The rapid cooling of the surface material resulted in displacement of the hot, and, therefore, still soft, thin walls, with a lower yield strength. Gradually, however, the core of the piston also cooled down and contracted. The surface areas, which had cooled and solidified already, could no longer follow this contraction of the core. The contraction of the core was consequently impeded, resulting in the remaining compressive stresses presented in Figure 16. No buckling distortion was observed, and the distortion of the piston crown seemed uniform, without major differences between the concave and convex chambers. A maximum displacement of dmax = 1.4 mm was achieved.

Inhomogeneous Pressure Distribution

The applied inhomogeneous pressure induced buckling in the centre, leading to the observed distortion pattern. By increasing the simulation time to ts = 6000 s, a maximum displacement of dmax = 2 mm was attained on the thin walls. The maximum total displacement of the piston crown ranged from dmax= −0.9 mm to −0.8 mm, as illustrated in Figure 15b. The symmetrical distortion pattern could be achieved as illustrated in Figure 15c.

3.1.4. Critical Buckling Load

The compressive stresses enhancing buckling were caused by the thermal compression of the massive piston skirt and the thermal expansion of the massive core, which was still warm due to the inhomogeneous temperature distribution during ambient cooling in the furnace. However, it should be mentioned that compressive loads on the thin wall are only present during the heat treatment, as during DMD, the massive core concurrently undergoes shrinkage and, therefore, applies tensile loads Fs on the thin wall. The critical stress can only be calculated for the load case during heat treatment, as presented in Figure 17b. The critical buckling load is σc,25 °C = −273.8 MPa around room temperature, as presented in Table 7. At temperatures around T = 600 °C, which are present during the heat treatment, the critical buckling load reduces to σc,612 °C = −153 MPa.

3.2. Experimental Approaches

3.2.1. Destructive Residual Stress Measurement

The tomography of the heat-treated final prototype visualised the symmetrical distortion pattern and how the piston skirt and piston crown suffered from buckling. The tomography of the as-built DMD subpart did not provide any indication for the distortion pattern present after the heat treatment. The deformations are caused by the very high surface roughness, as presented in Figure 18c. Part removal did not affect the tomographs of the part, as presented in Figure 18d.

3.2.2. Non-Destructive Residual Stress Measurement

The longitudinal stresses σxx of all three walls of the DMD subpart 90°-section were measured using XRD. Walls 1 and 3 showed a similar residual stress equilibrium between compressive and tensile loads, whereas wall 2 mostly presented tensile loads. The measurement showed an acceptable standard deviation, as shown in Table 8.

3.3. Validation

3.3.1. Qualitative

The eigenvalue buckling analysis did not predict the present distortion patterns. The maximal displacement of the thin walls was dmax = 0.5 mm, which can be explained by the lack of residual stress history. Including geometrical, force, and pressure-based imperfections did not result in the desired distortion pattern. Possible causes for the imperfections are geometrical deviations, welding errors, or nonlinear temperature distributions due to the oven design. However, it should be mentioned that only the first three modes were considered. Although it could not be simulated, it is very likely that the eigenshape influenced the distortion patterns since they came close to the present distortion pattern but were missing symmetry.
The simulated normal stresses of the DMD simulation exceeded the yield strength, but no distortion could be measured by tomography, as presented in Figure 18d. However, the XRD measurements, which are below the yield strength, are in alignment with unmeasurable elastic deformations. Furthermore, the DMD simulation did not provide any evidence for the distortion pattern.
The distortion pattern could be validated successfully by the heat treatment simulation, including inhomogeneous pressure distribution, as illustrated in Figure 19. However, the maximal displacement dmax = 12 mm could not be simulated. Furthermore, the angle at the T-joints β differed between the simulation and the experiment. The simulation resulted in an angle of β = 90°, whereas the present distortion resulted in an angle of β = 80°. The heating cycle might have induced creep and stresses, which were not considered in the heat treatment simulation. Furthermore, the inhomogeneous temperature distribution during heating might introduce new internal stresses. The convection coefficient might not accurately represent the experimental setup due to the lack of specific measurements of air velocity within the furnace, opening up another area for improvement.

3.3.2. Quantitative

The DMD simulation was quantitatively validated by the XRD measurement of the as-built 90°-section of the DMD subpart, as displayed in Figure 20. Longitudinal stresses σxx were measured on all three walls of the 90°-section. The simulated stress is substantially higher than the measured stress. Furthermore, the curve correlates with the experimental data of the walls. The simulation presents compressive stresses only towards the core, whereas the experiments result in compressive stresses in the middle and towards the piston skirt.
Hence, the simulation needs to be calibrated to reduce the peak stresses of the simulation. However, no calibration option is currently implemented in the present DED process extension. The basic assumption of the simulation is that the process parameters have been set in a way that the developed temperature never exceeds the melting temperature Tm = 1450 °C. To avoid the overestimation of the stresses, the melting temperature should be reduced. Moreover, the simplifications in the DED process extension might not fully capture all the physical phenomena to represent the stress state of a thin wall situated between two massive rings.
The theoretical position of the 90°-section presented in Figure 19 indicates a different buckling direction of wall 1; however, wall 2 is the outlier in the XRD measurements. However, the predominant stress state (2 out of 3) found in the centre of the thin walls is compressive stress, enhancing the buckling.

4. Discussion

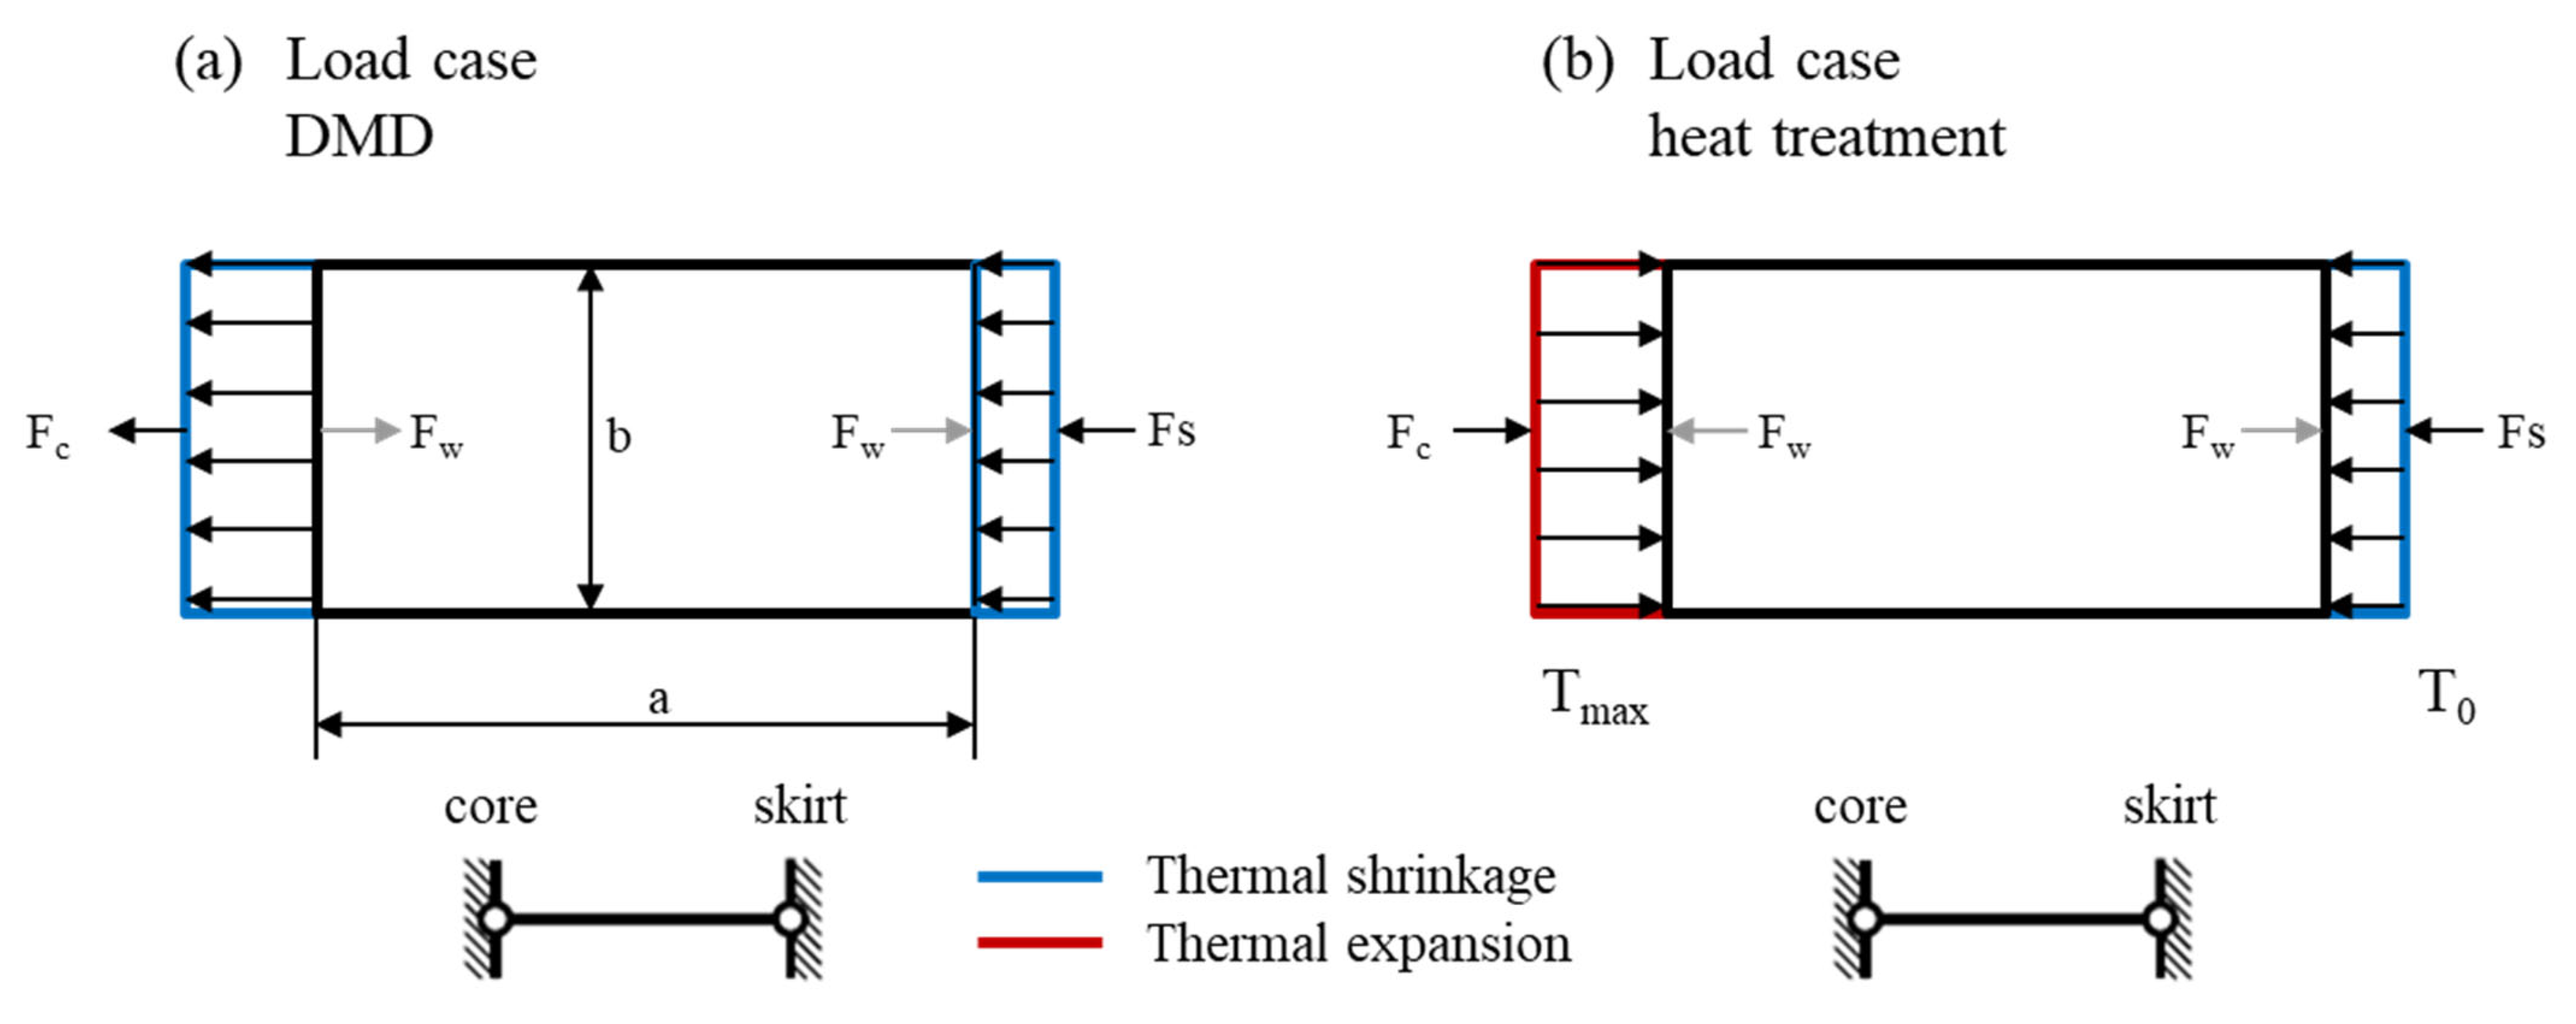
The applied double-weld strategy to weld the piston crown always started at the same side of the thin wall. The welding caused the buckling of each wall towards the same direction. Furthermore, the heat-affected zone of the welding zone is limited to the piston crown and does not explain the convex/concave distortion of the piston skirt. Therefore, it is unlikely that the laser welding process affected the distortion pattern.
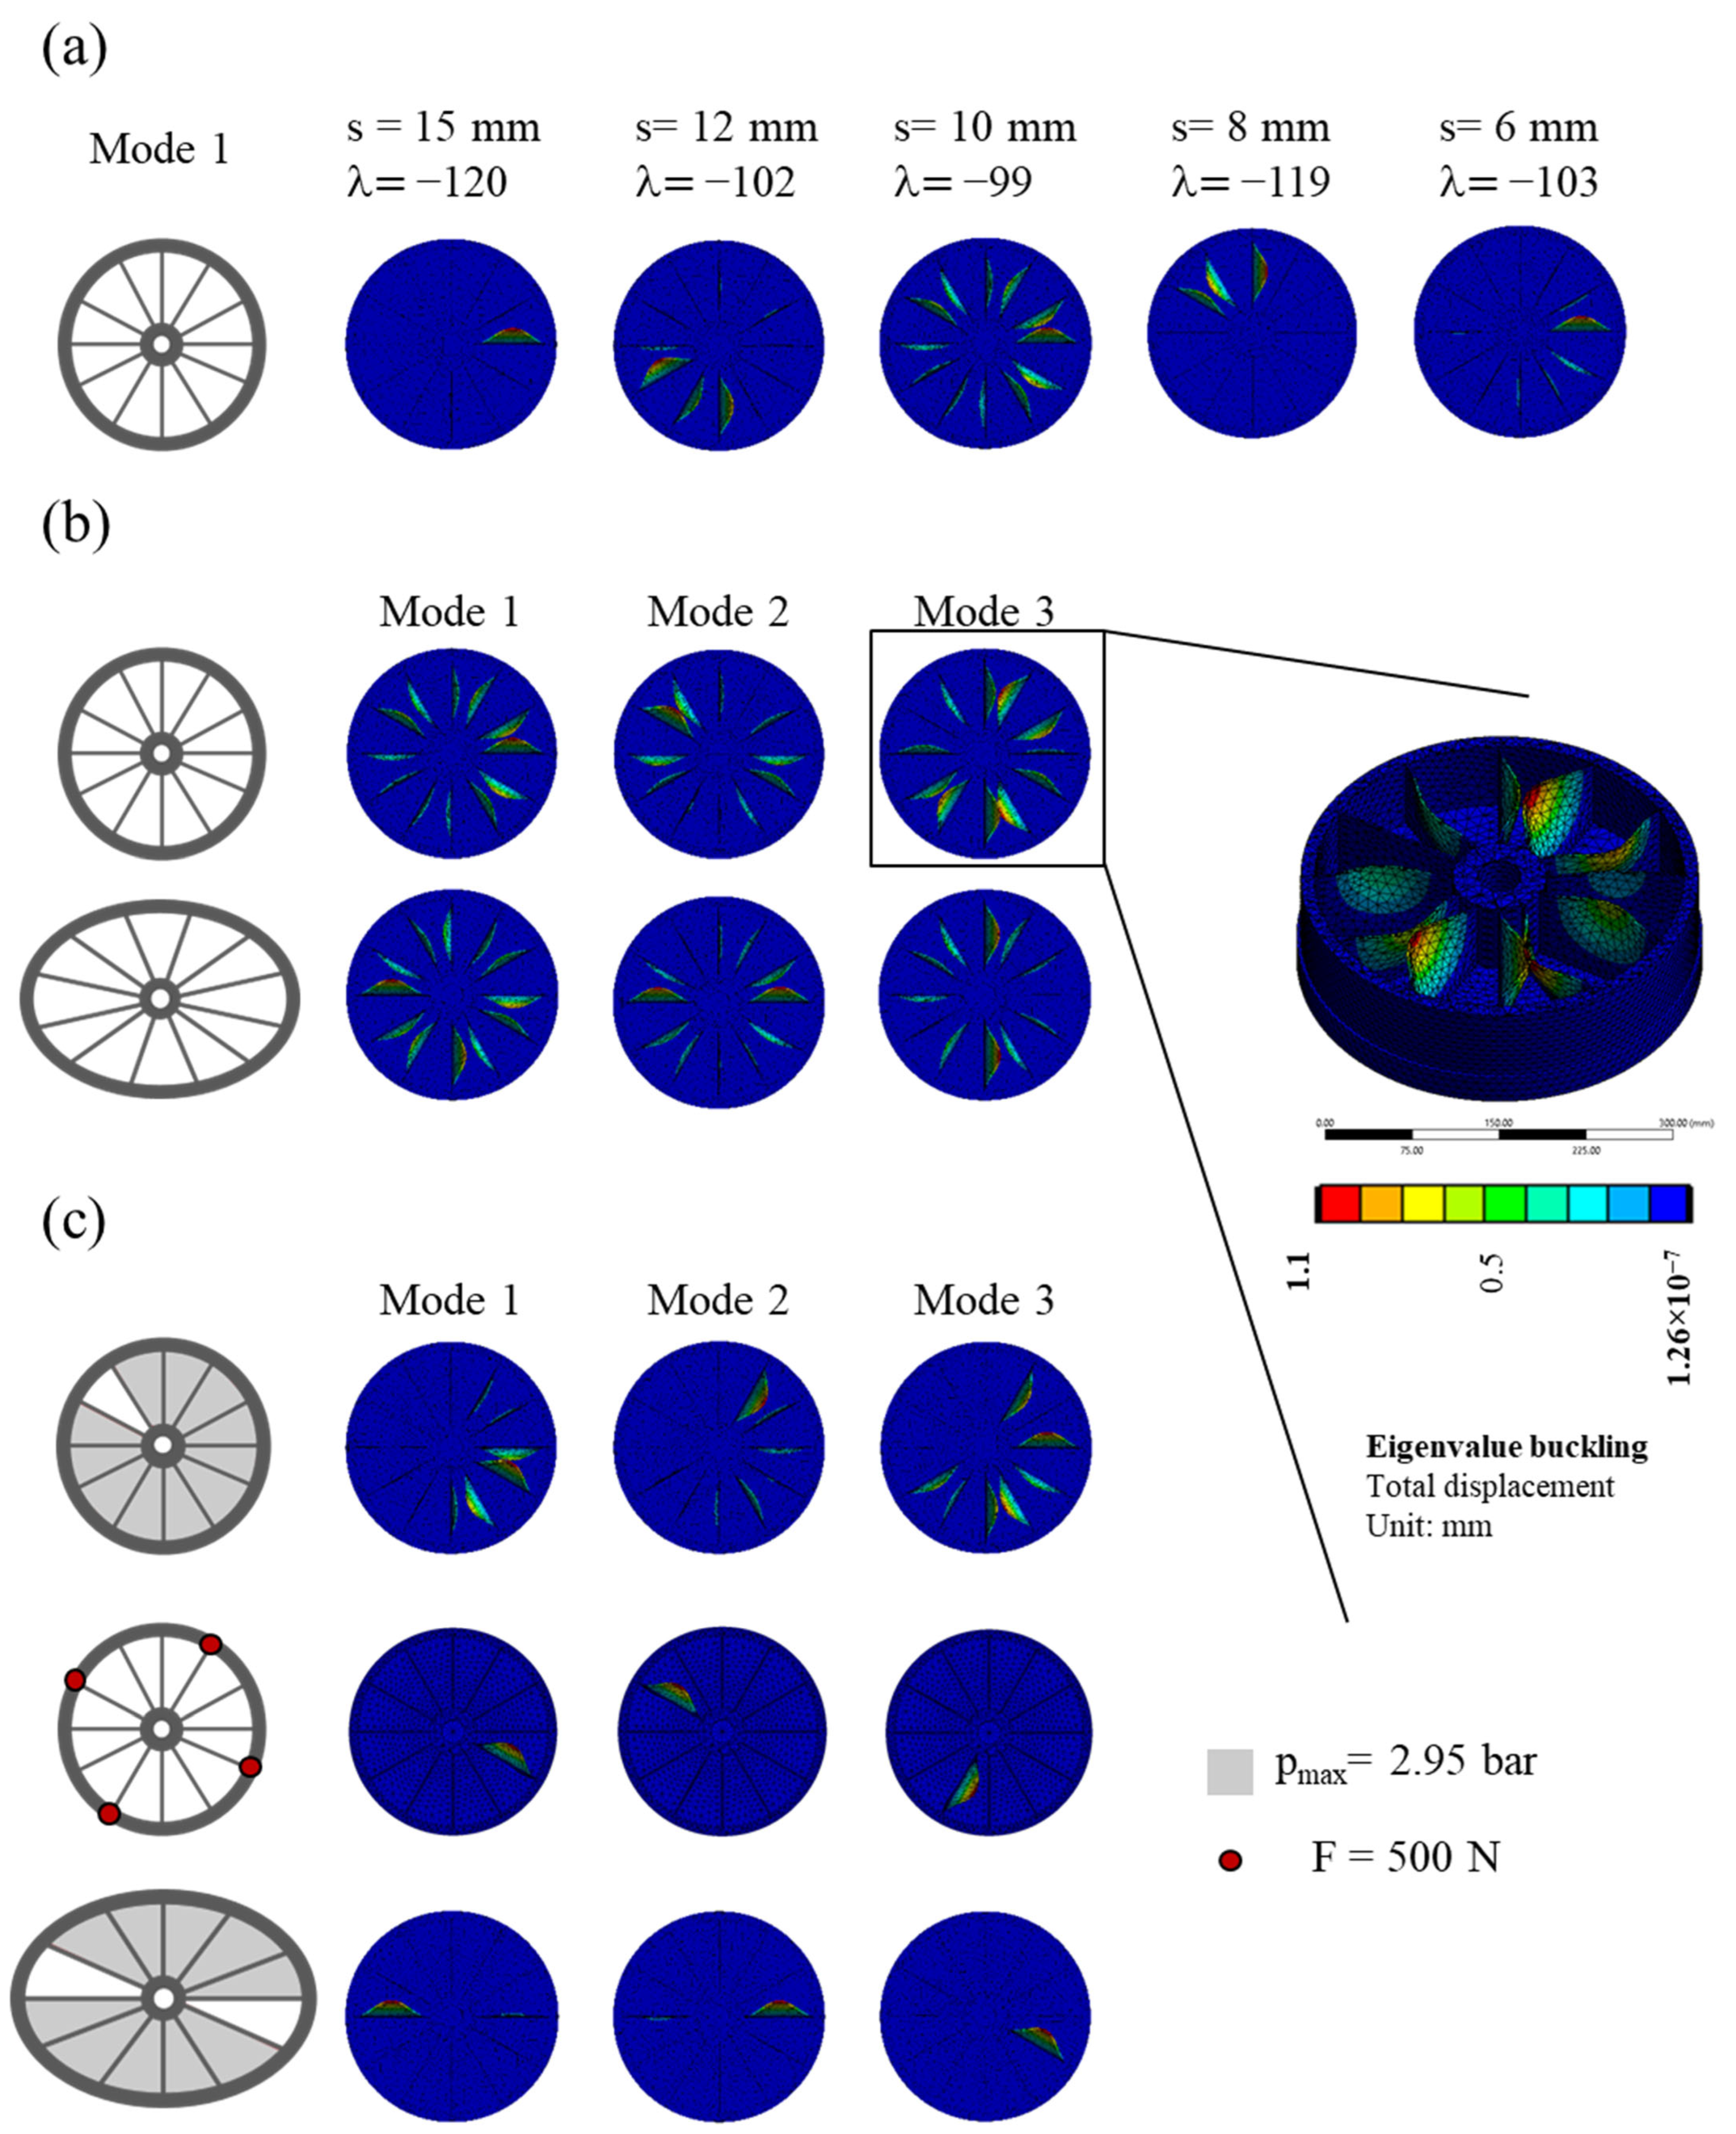
The eigenvalue buckling analysis could not be validated considering the first three modes. According to Uzun [51], the as-printed body is under the influence of high-magnitude thermal cycles that result in highly complex distribution of eigenstrains, which are impossible to predict with simplified assumption regular functions. Further modes and residual stresses should be considered in future to achieve the desired displacements and symmetrical distortion patterns. A possible explanation for the symmetry is the clamping devices causing anticlastic bending. It appears when a sheet material is bent, as outlined in [52,53]. In the present study, the mechanical load was induced by the thermal shrinkage of the massive outer piston skirt putting pressure on the piston crown. Anticlastic bending is characterised by a transverse and longitudinal axis, which could explain the formation of convex and concave chambers. Further analysis is required to simulate anticlastic bending of a complex structure. Moreover, the inherent residual stresses of the conventional manufactured piston crown might have contributed to the distortion behaviour.
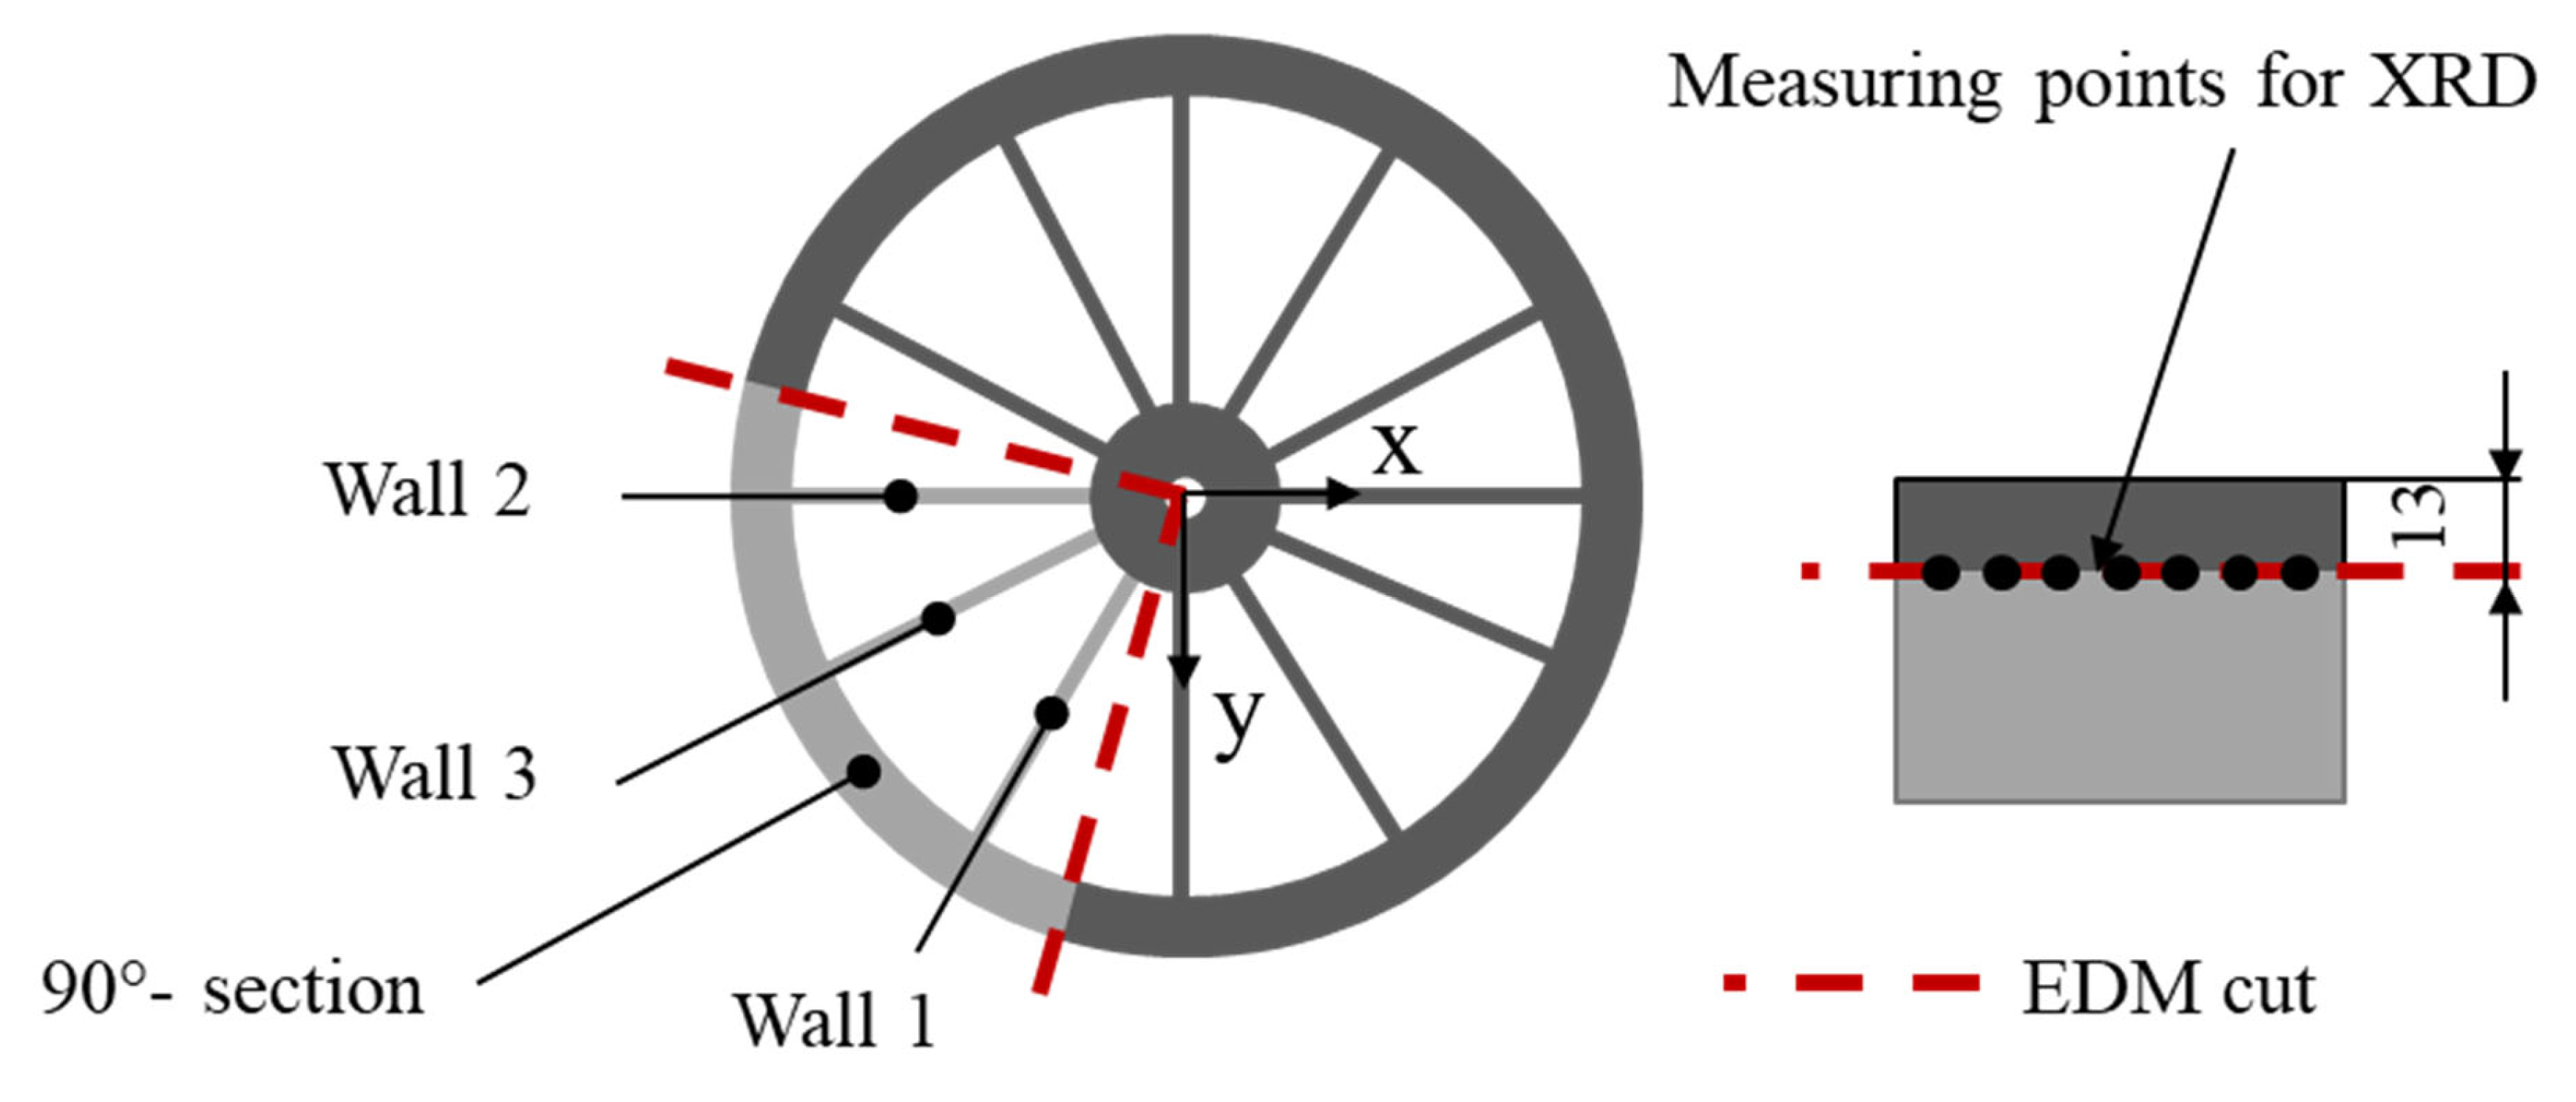
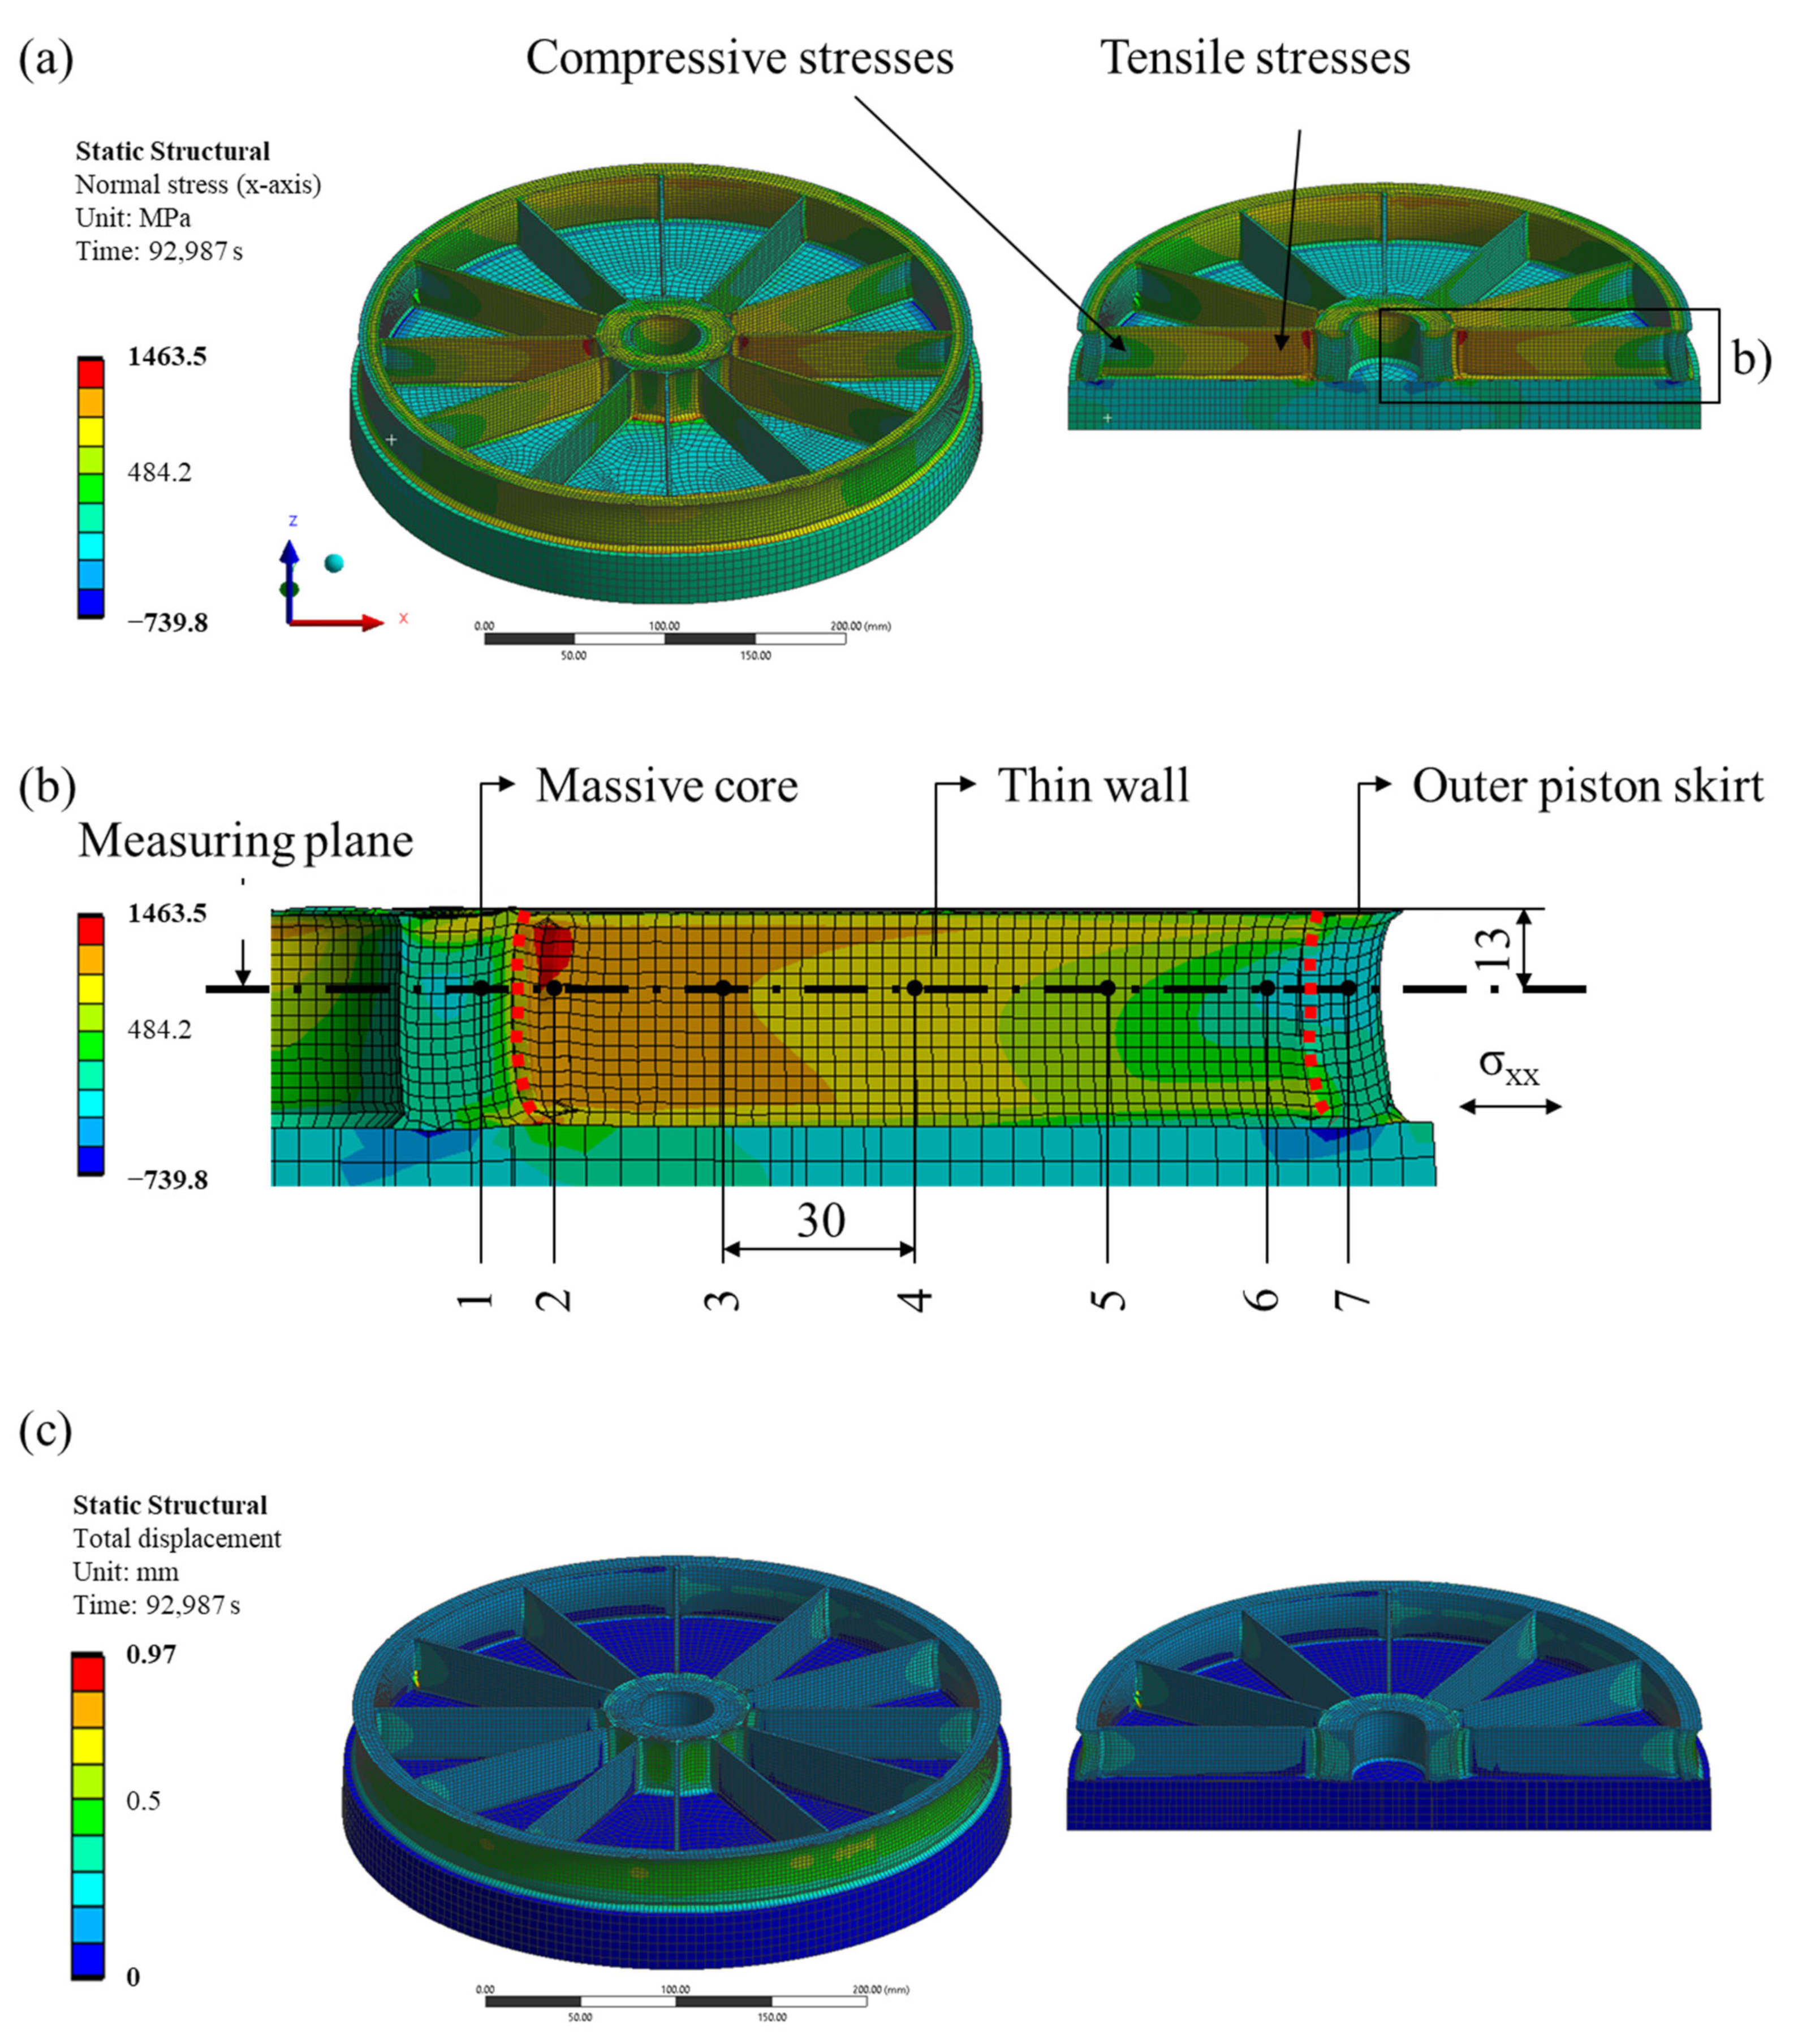
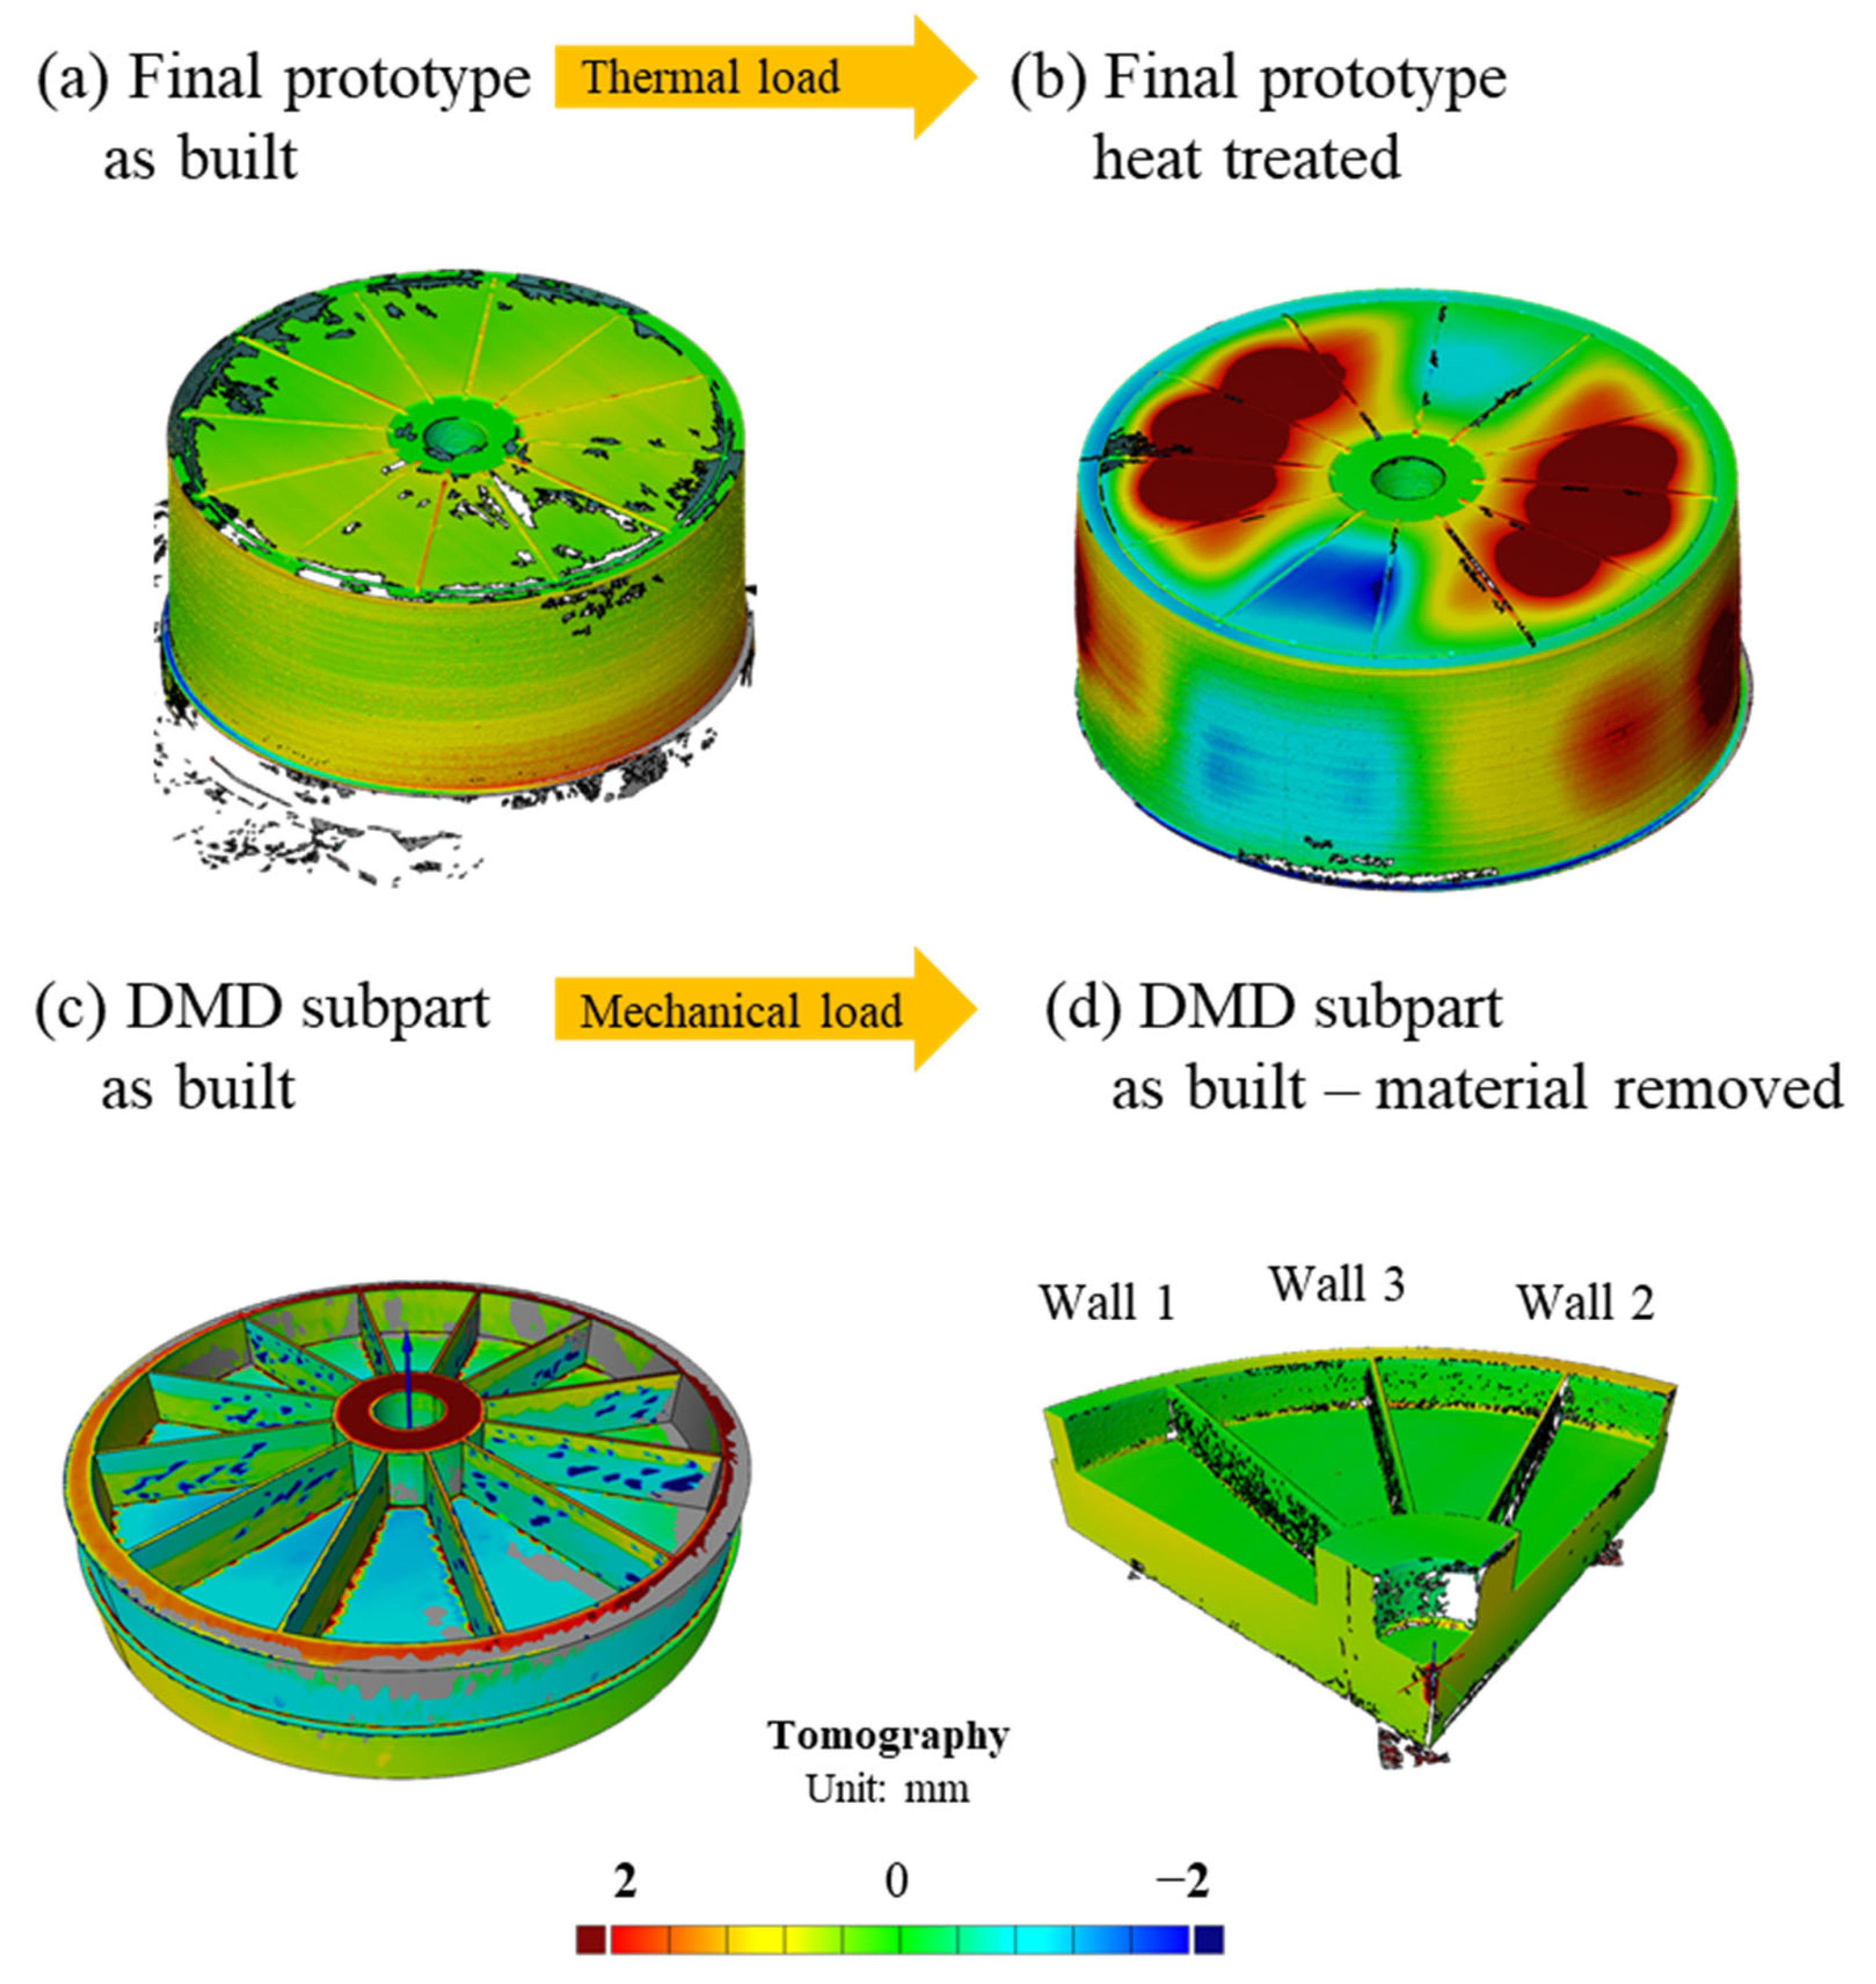
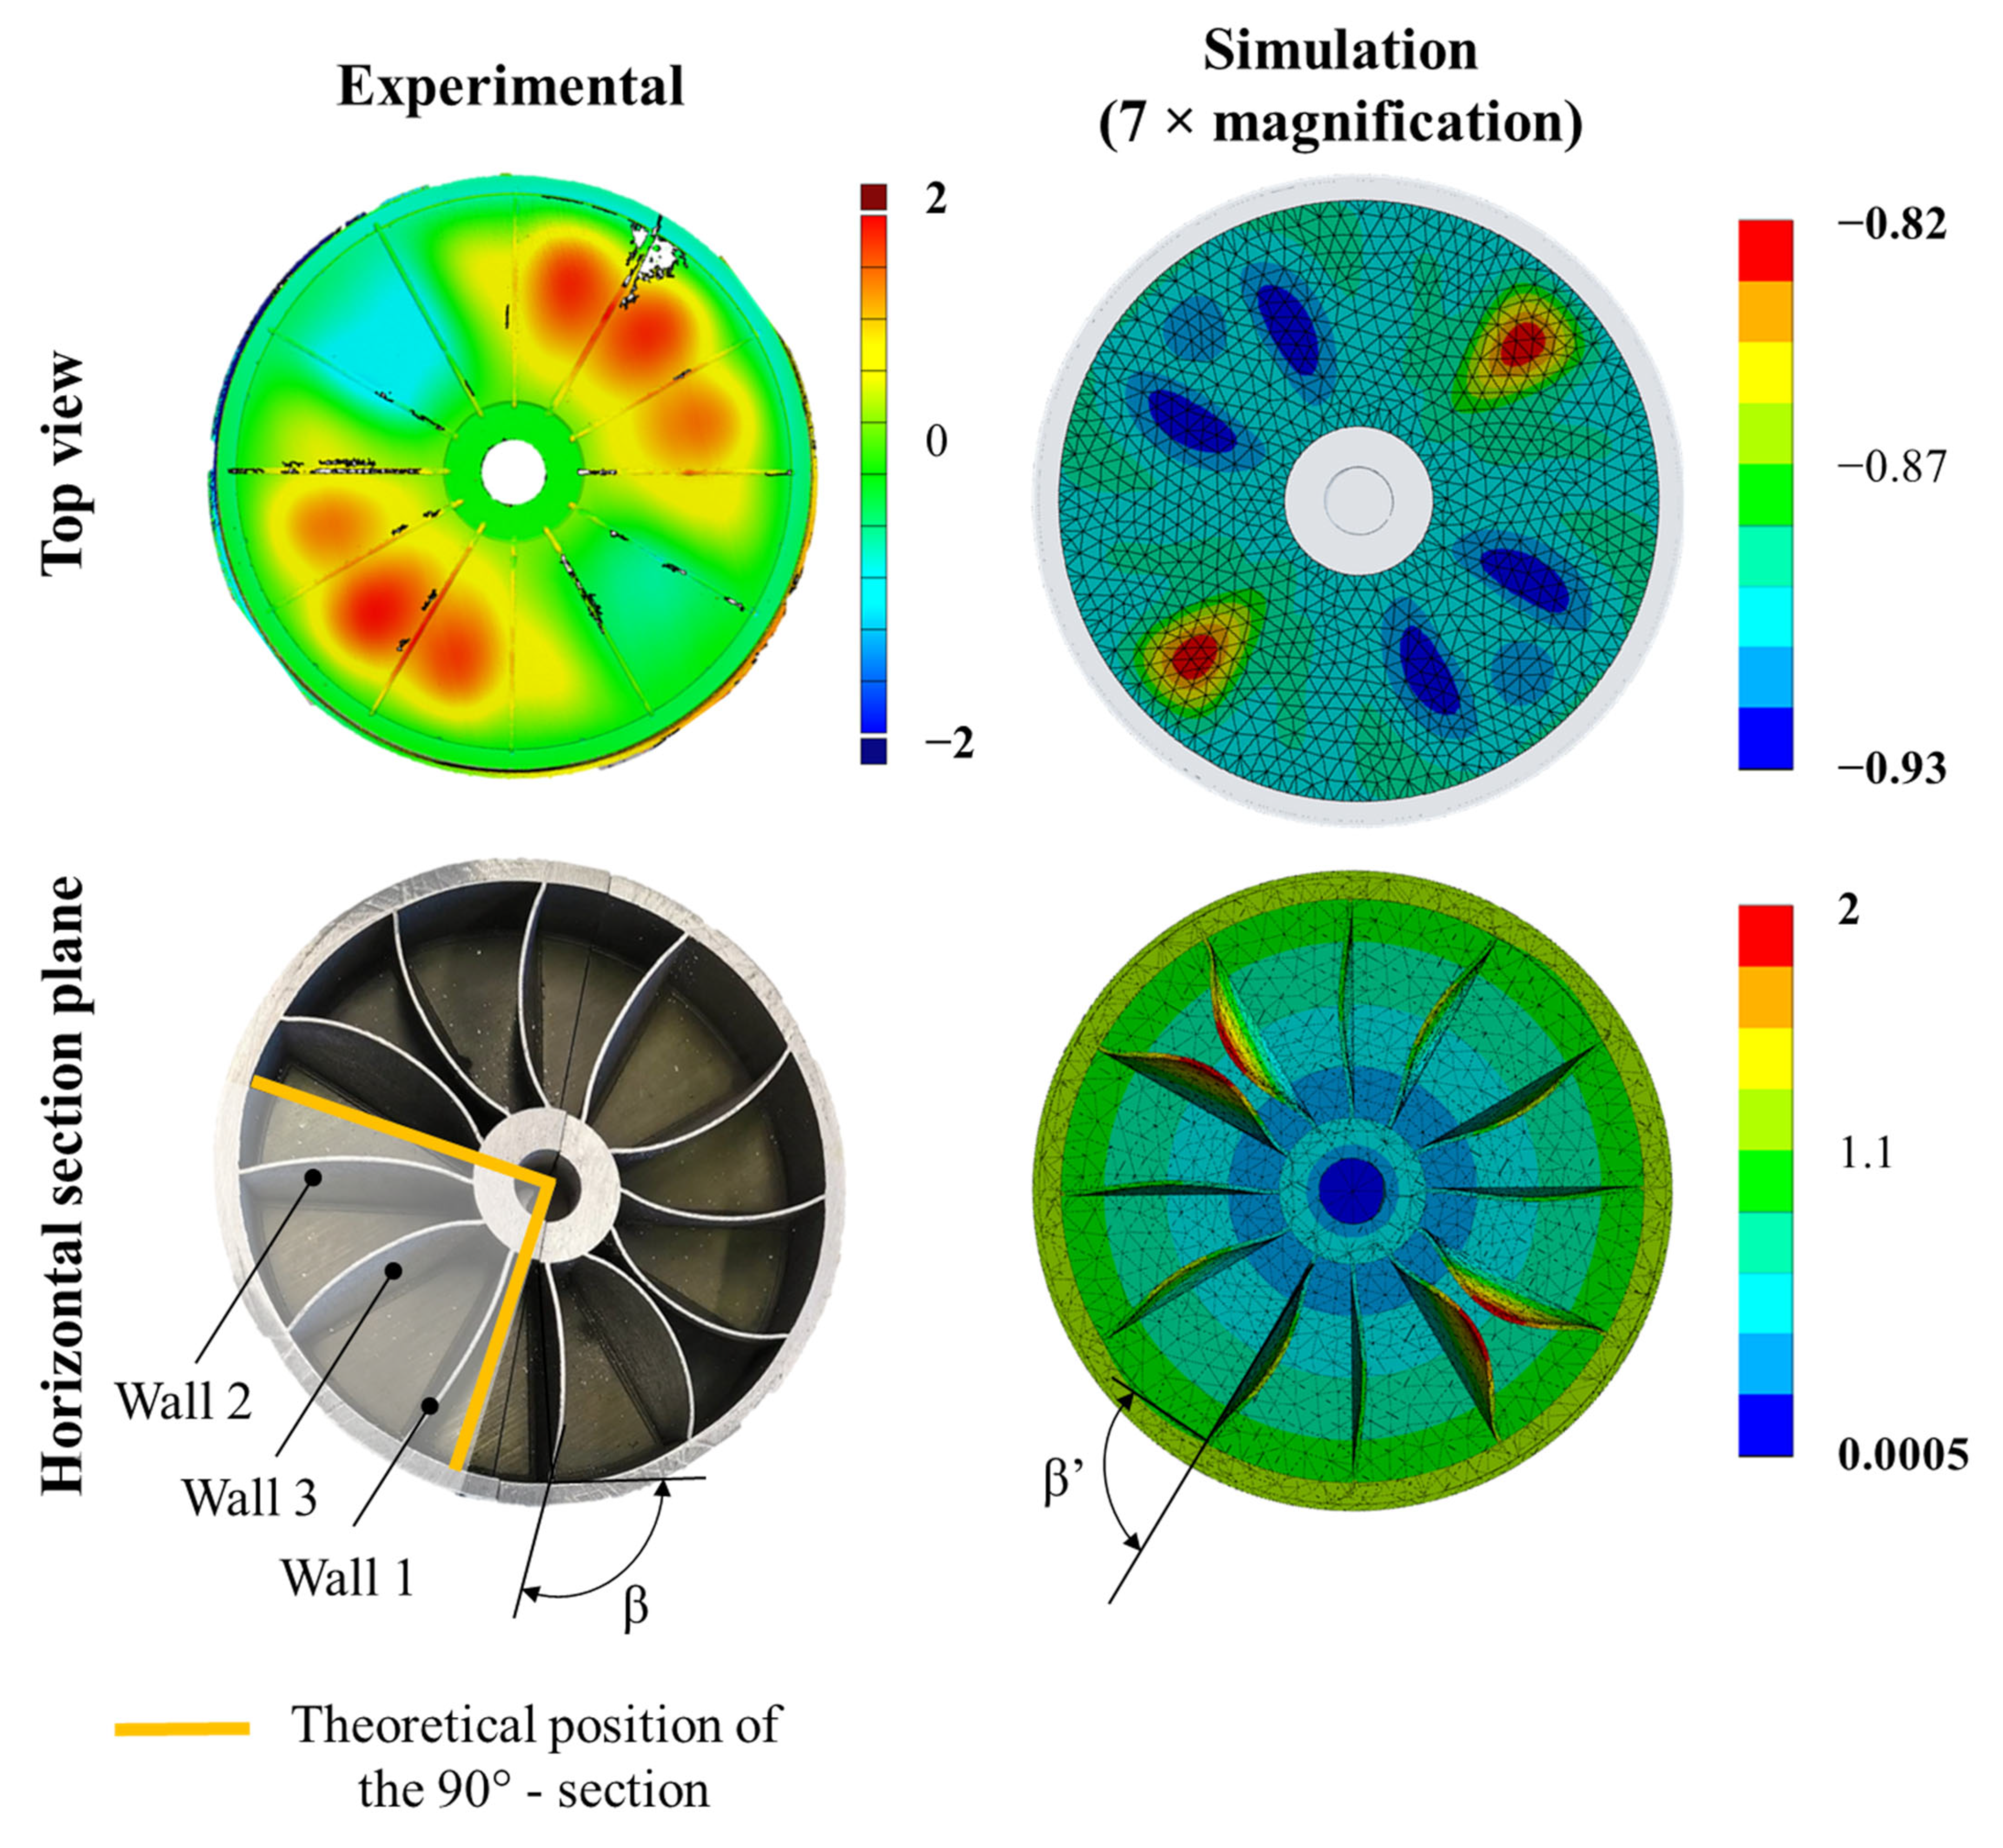
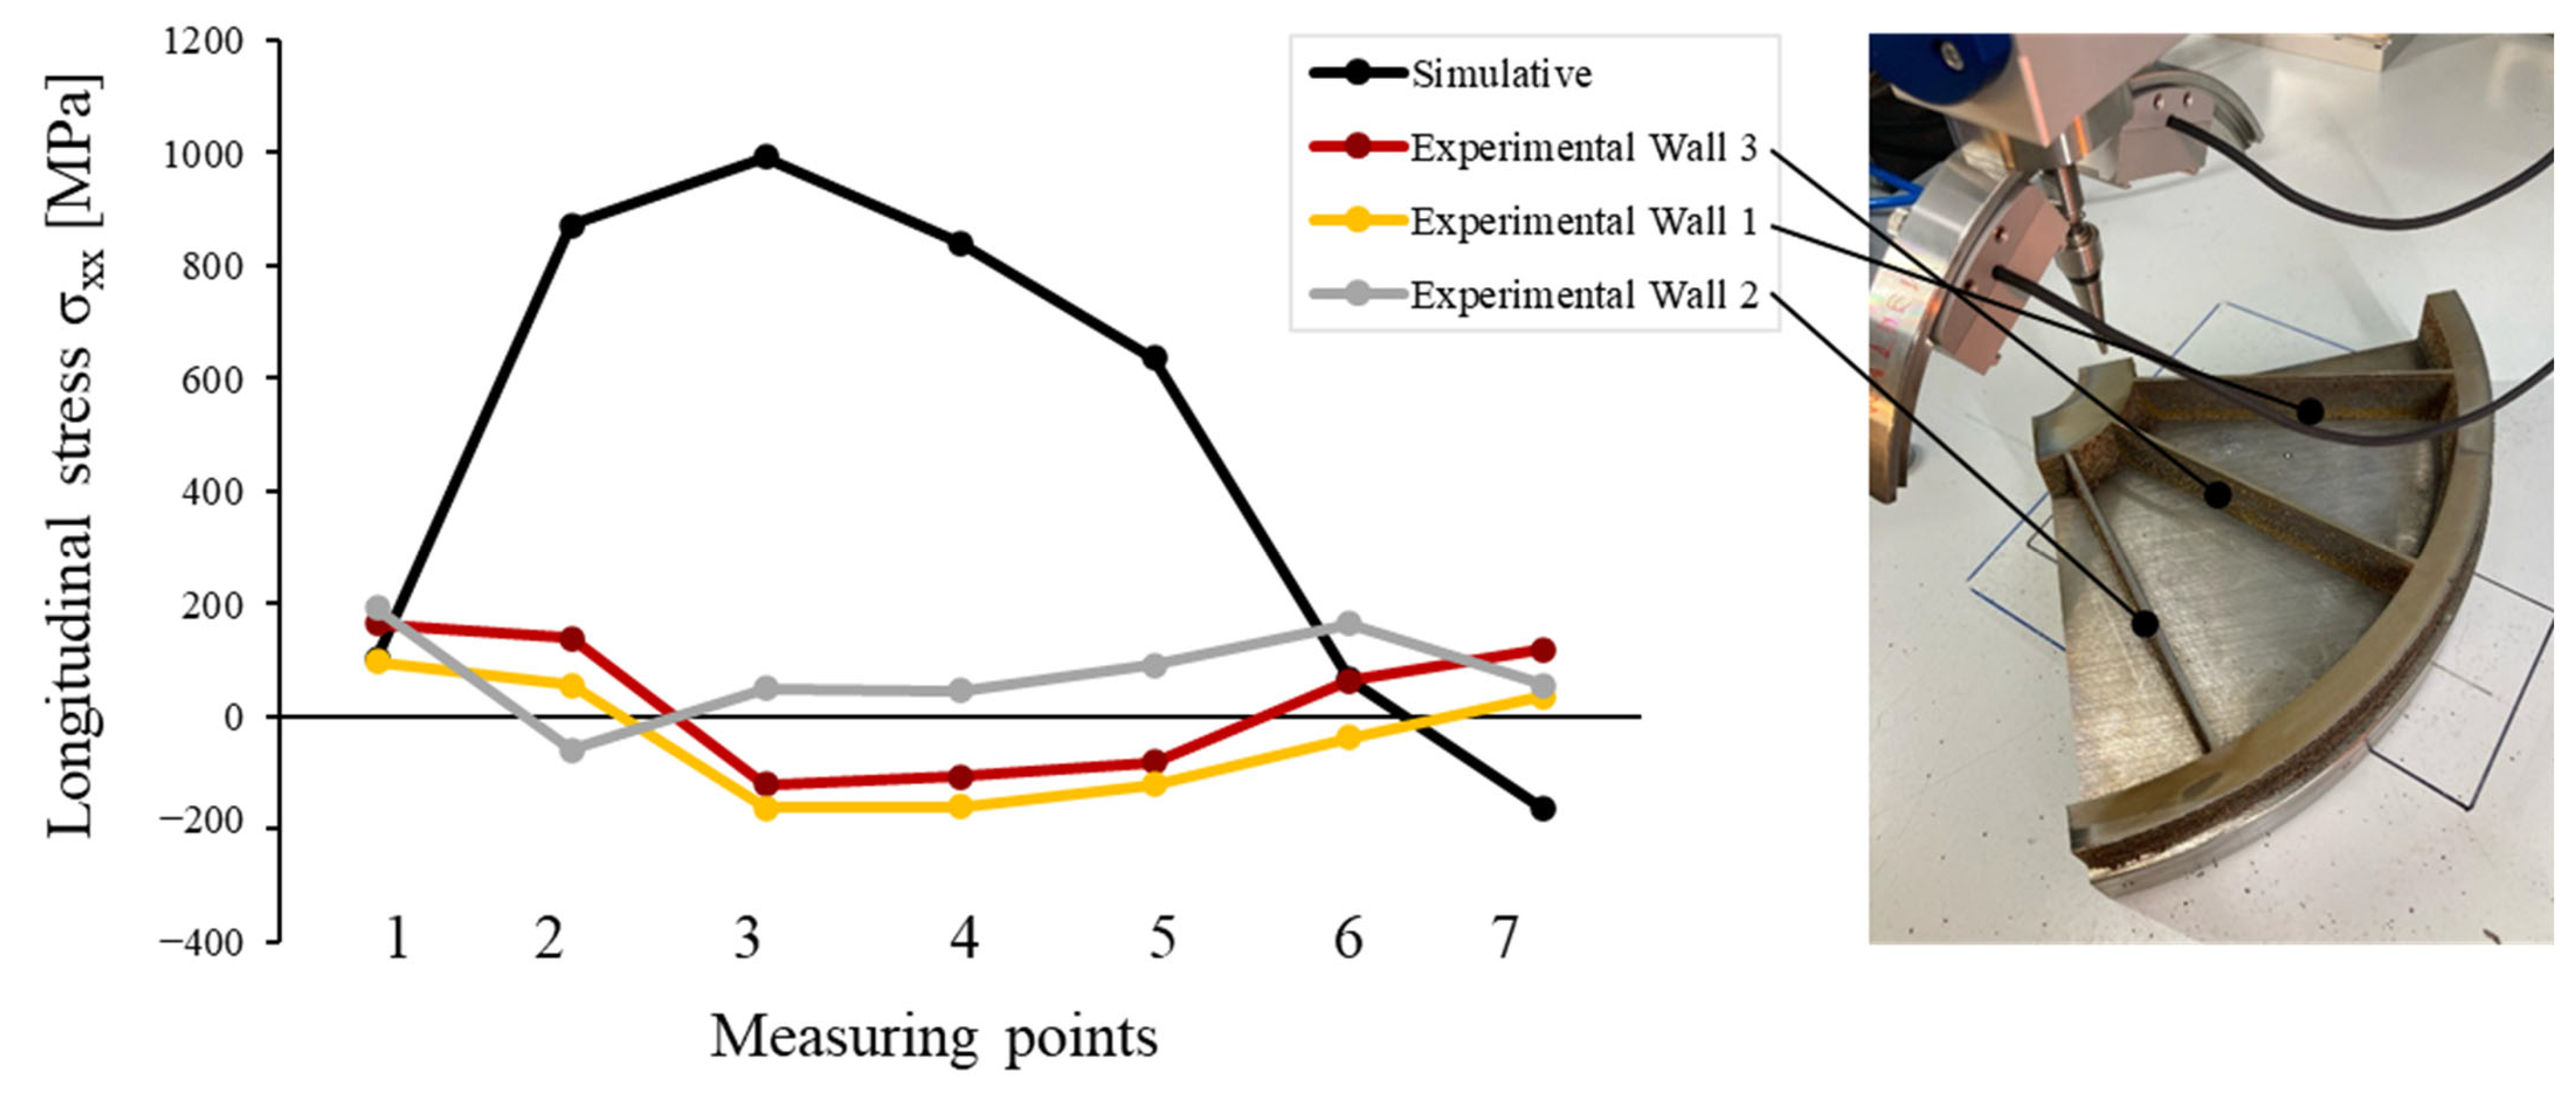
The requirement of a stress-free and even surface to facilitate XRD measurements required part removal by EDM. The removal of a 90°-section aimed to methodically disrupt the equilibrium state for subsequent measurement by tomography. The asymmetry simplified the alignment process during the tomographic examination. However, the intention of stress relaxation stands, in contrast, to maintain residual stresses, essential for validation purposes. Consequently, further research into residual stress relaxation is required to comprehensively characterise the effect of part removal on XRD. This explains why the DMD simulation could not be validated by XRD measurements on the 90°-section. Moreover, the simulation provides an understanding of the longitudinal stress distribution but highlights the need for calibration based on the extensive overestimation of the residual stresses. However, it is questionable whether the stresses in the DMD subpart were elastic, since tomography only captures relative shape deviations. To measure displacements, more sensitive strain gauges should be employed in future.
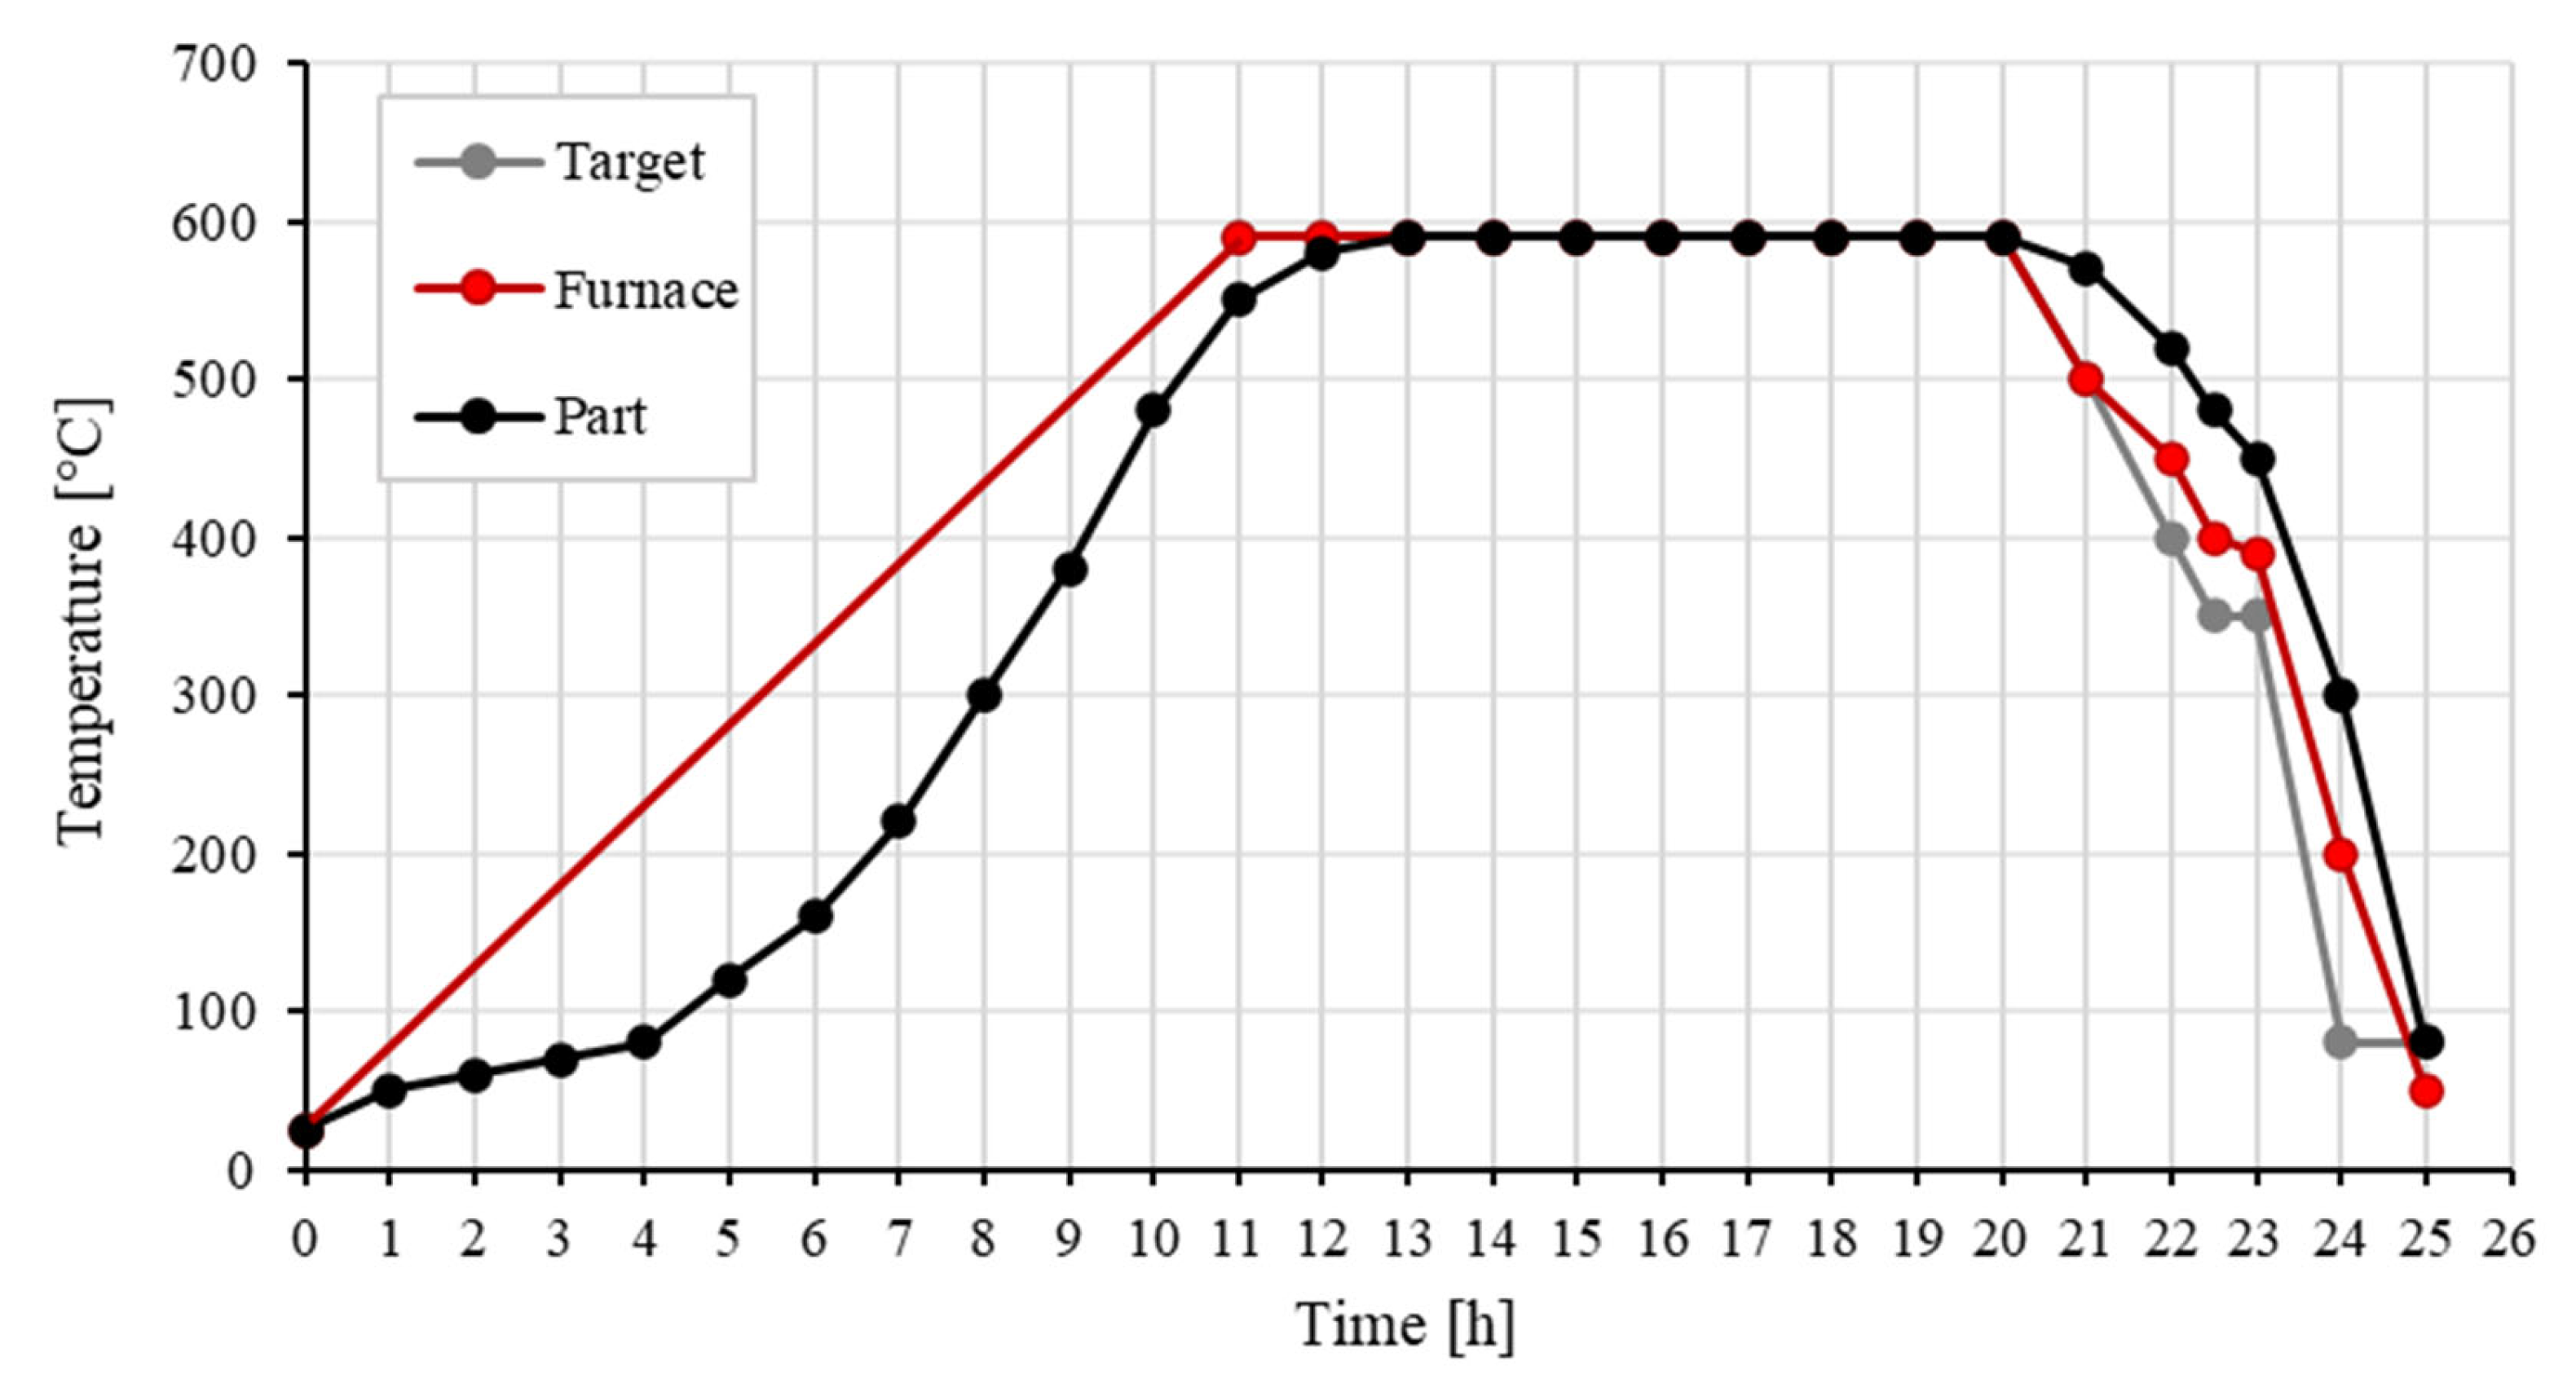
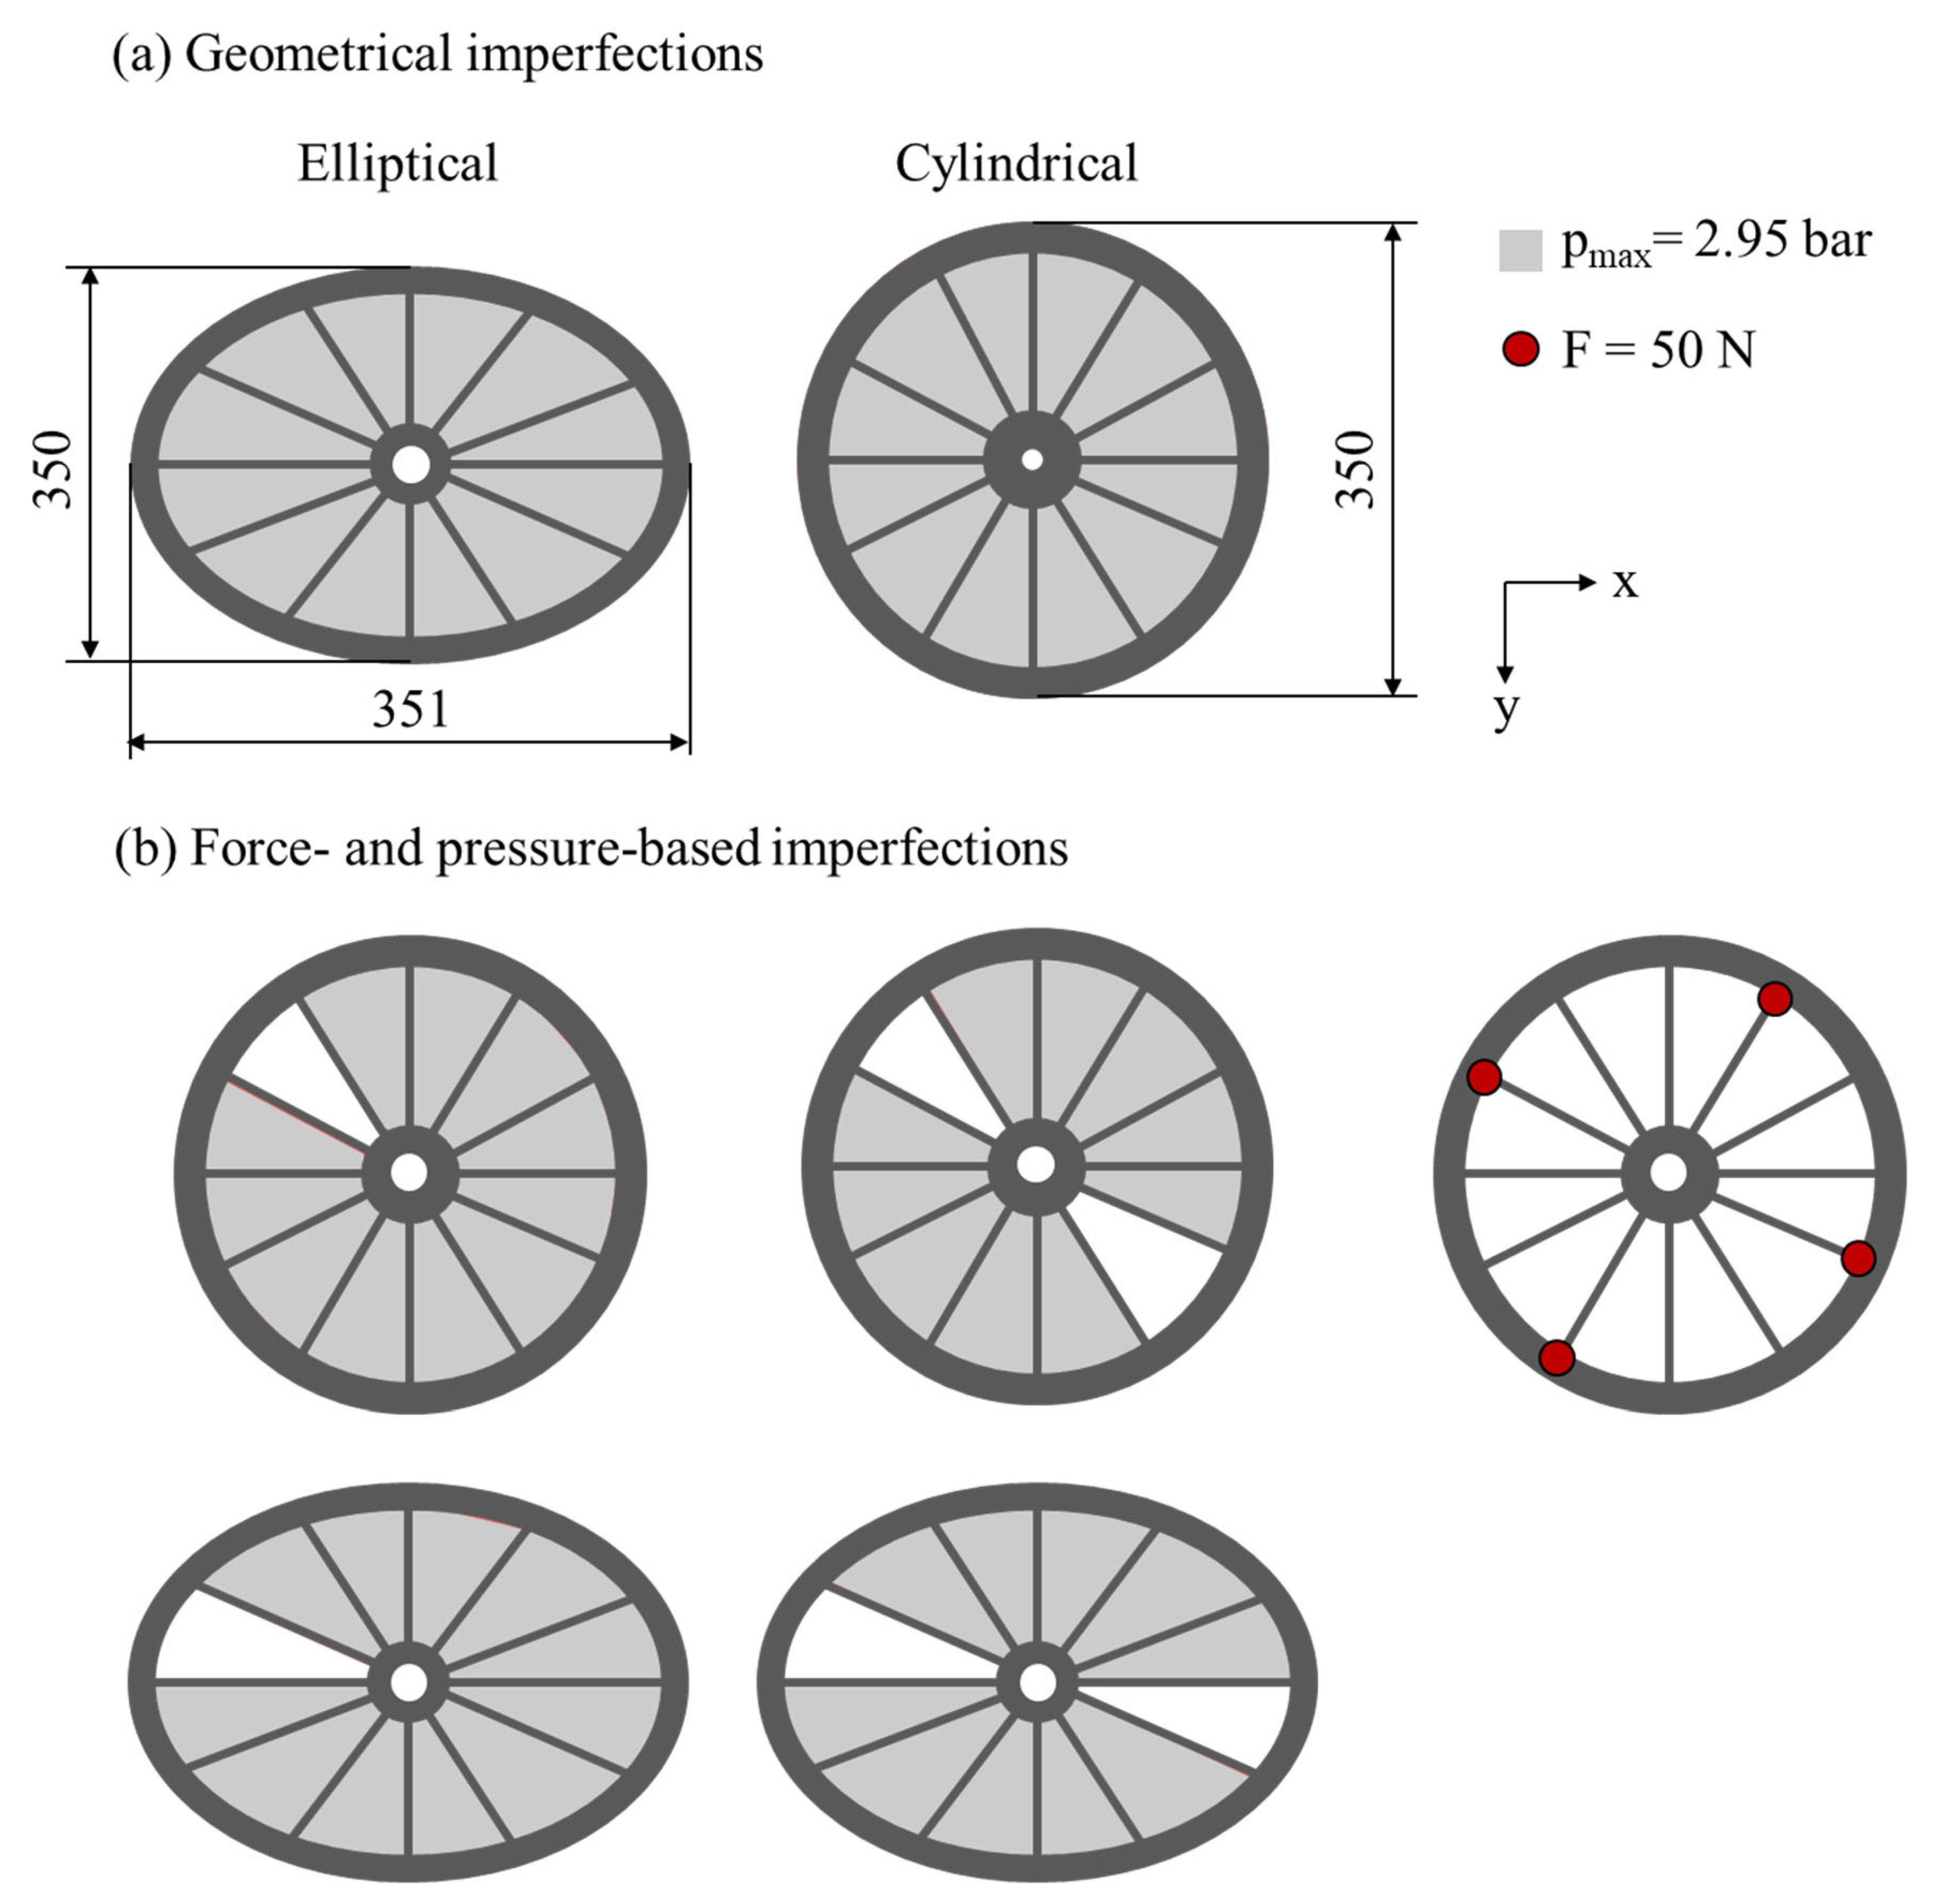
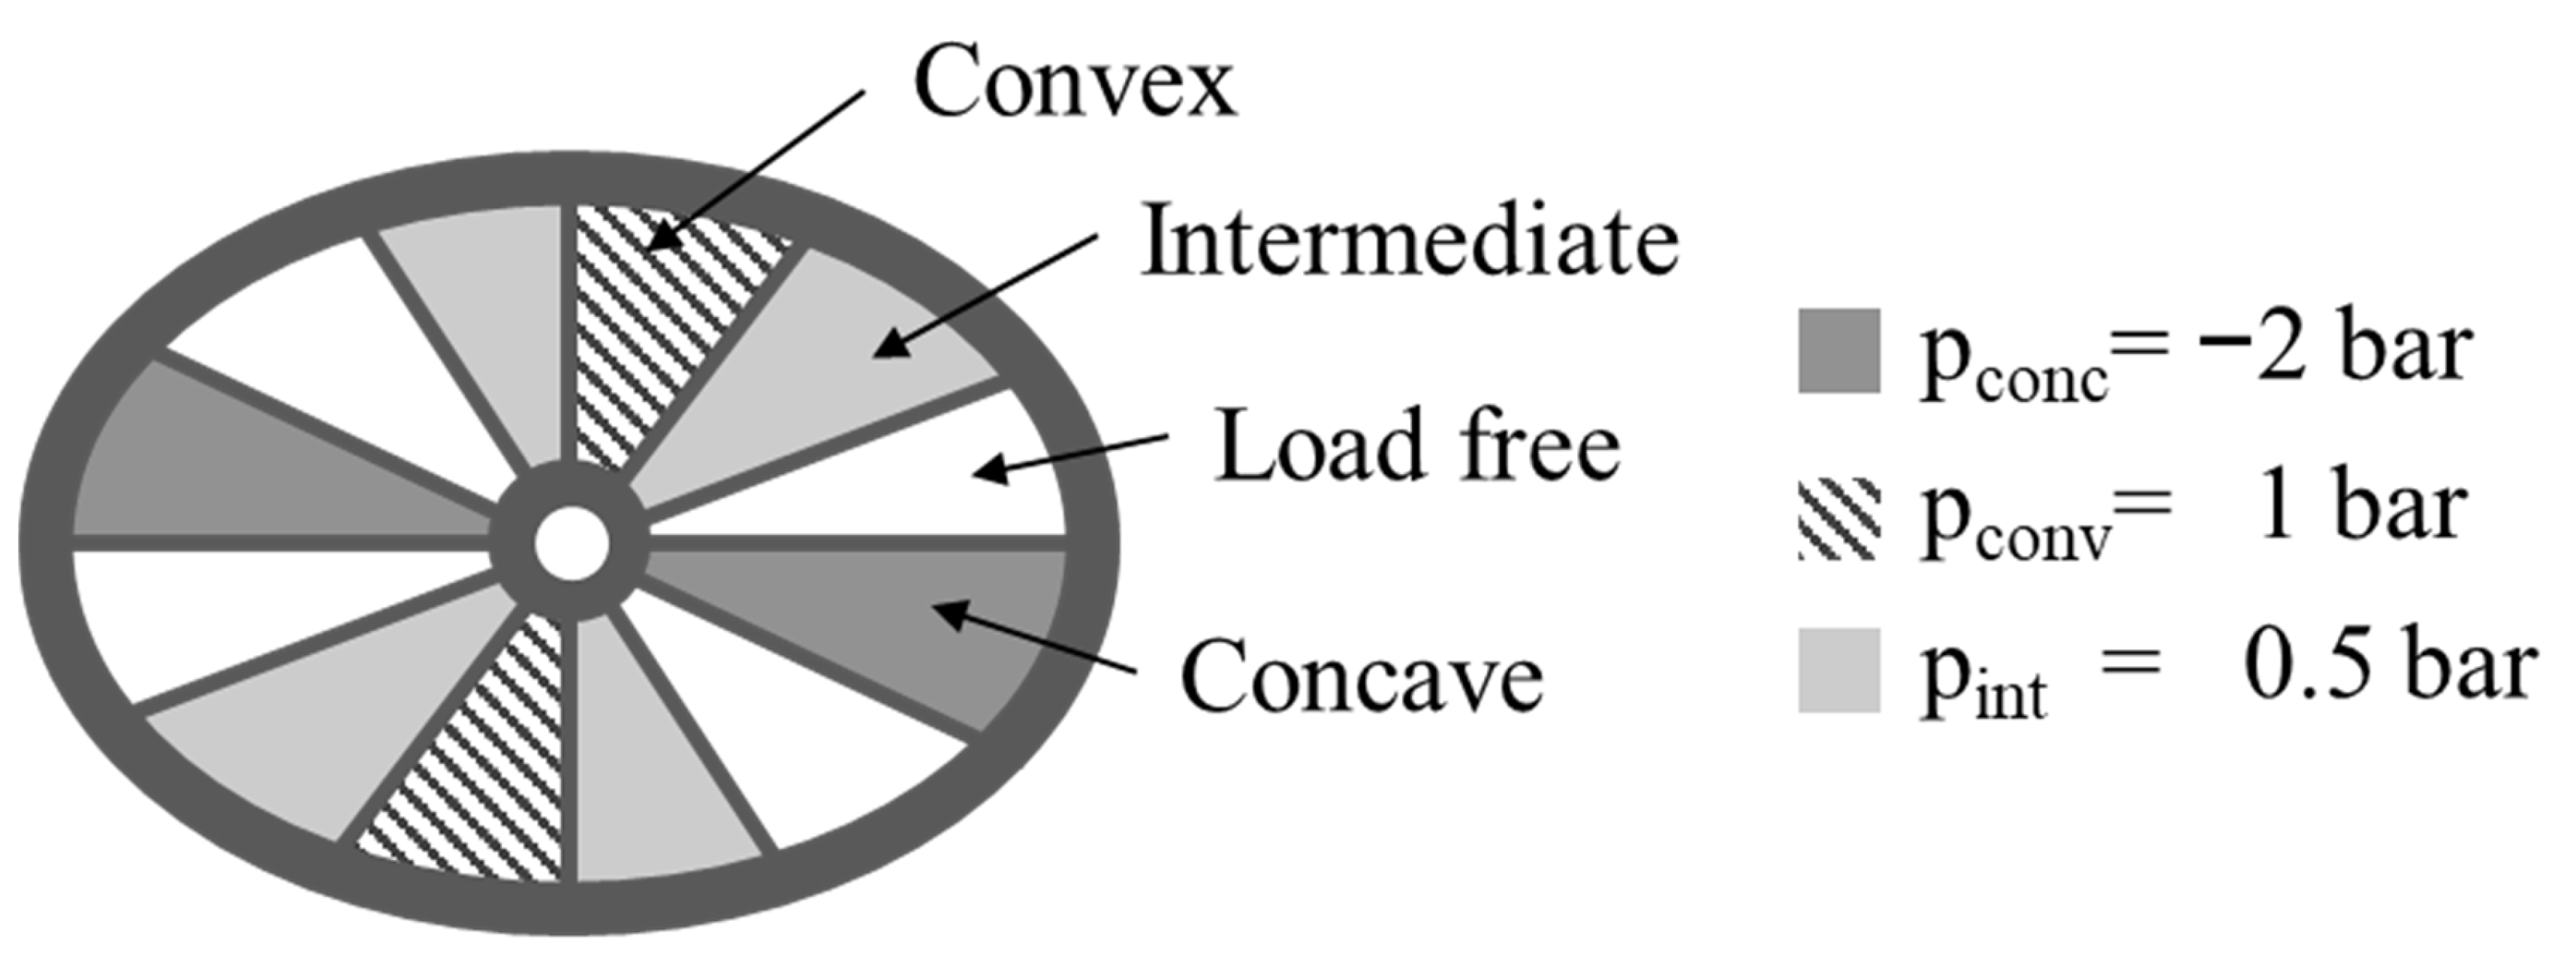
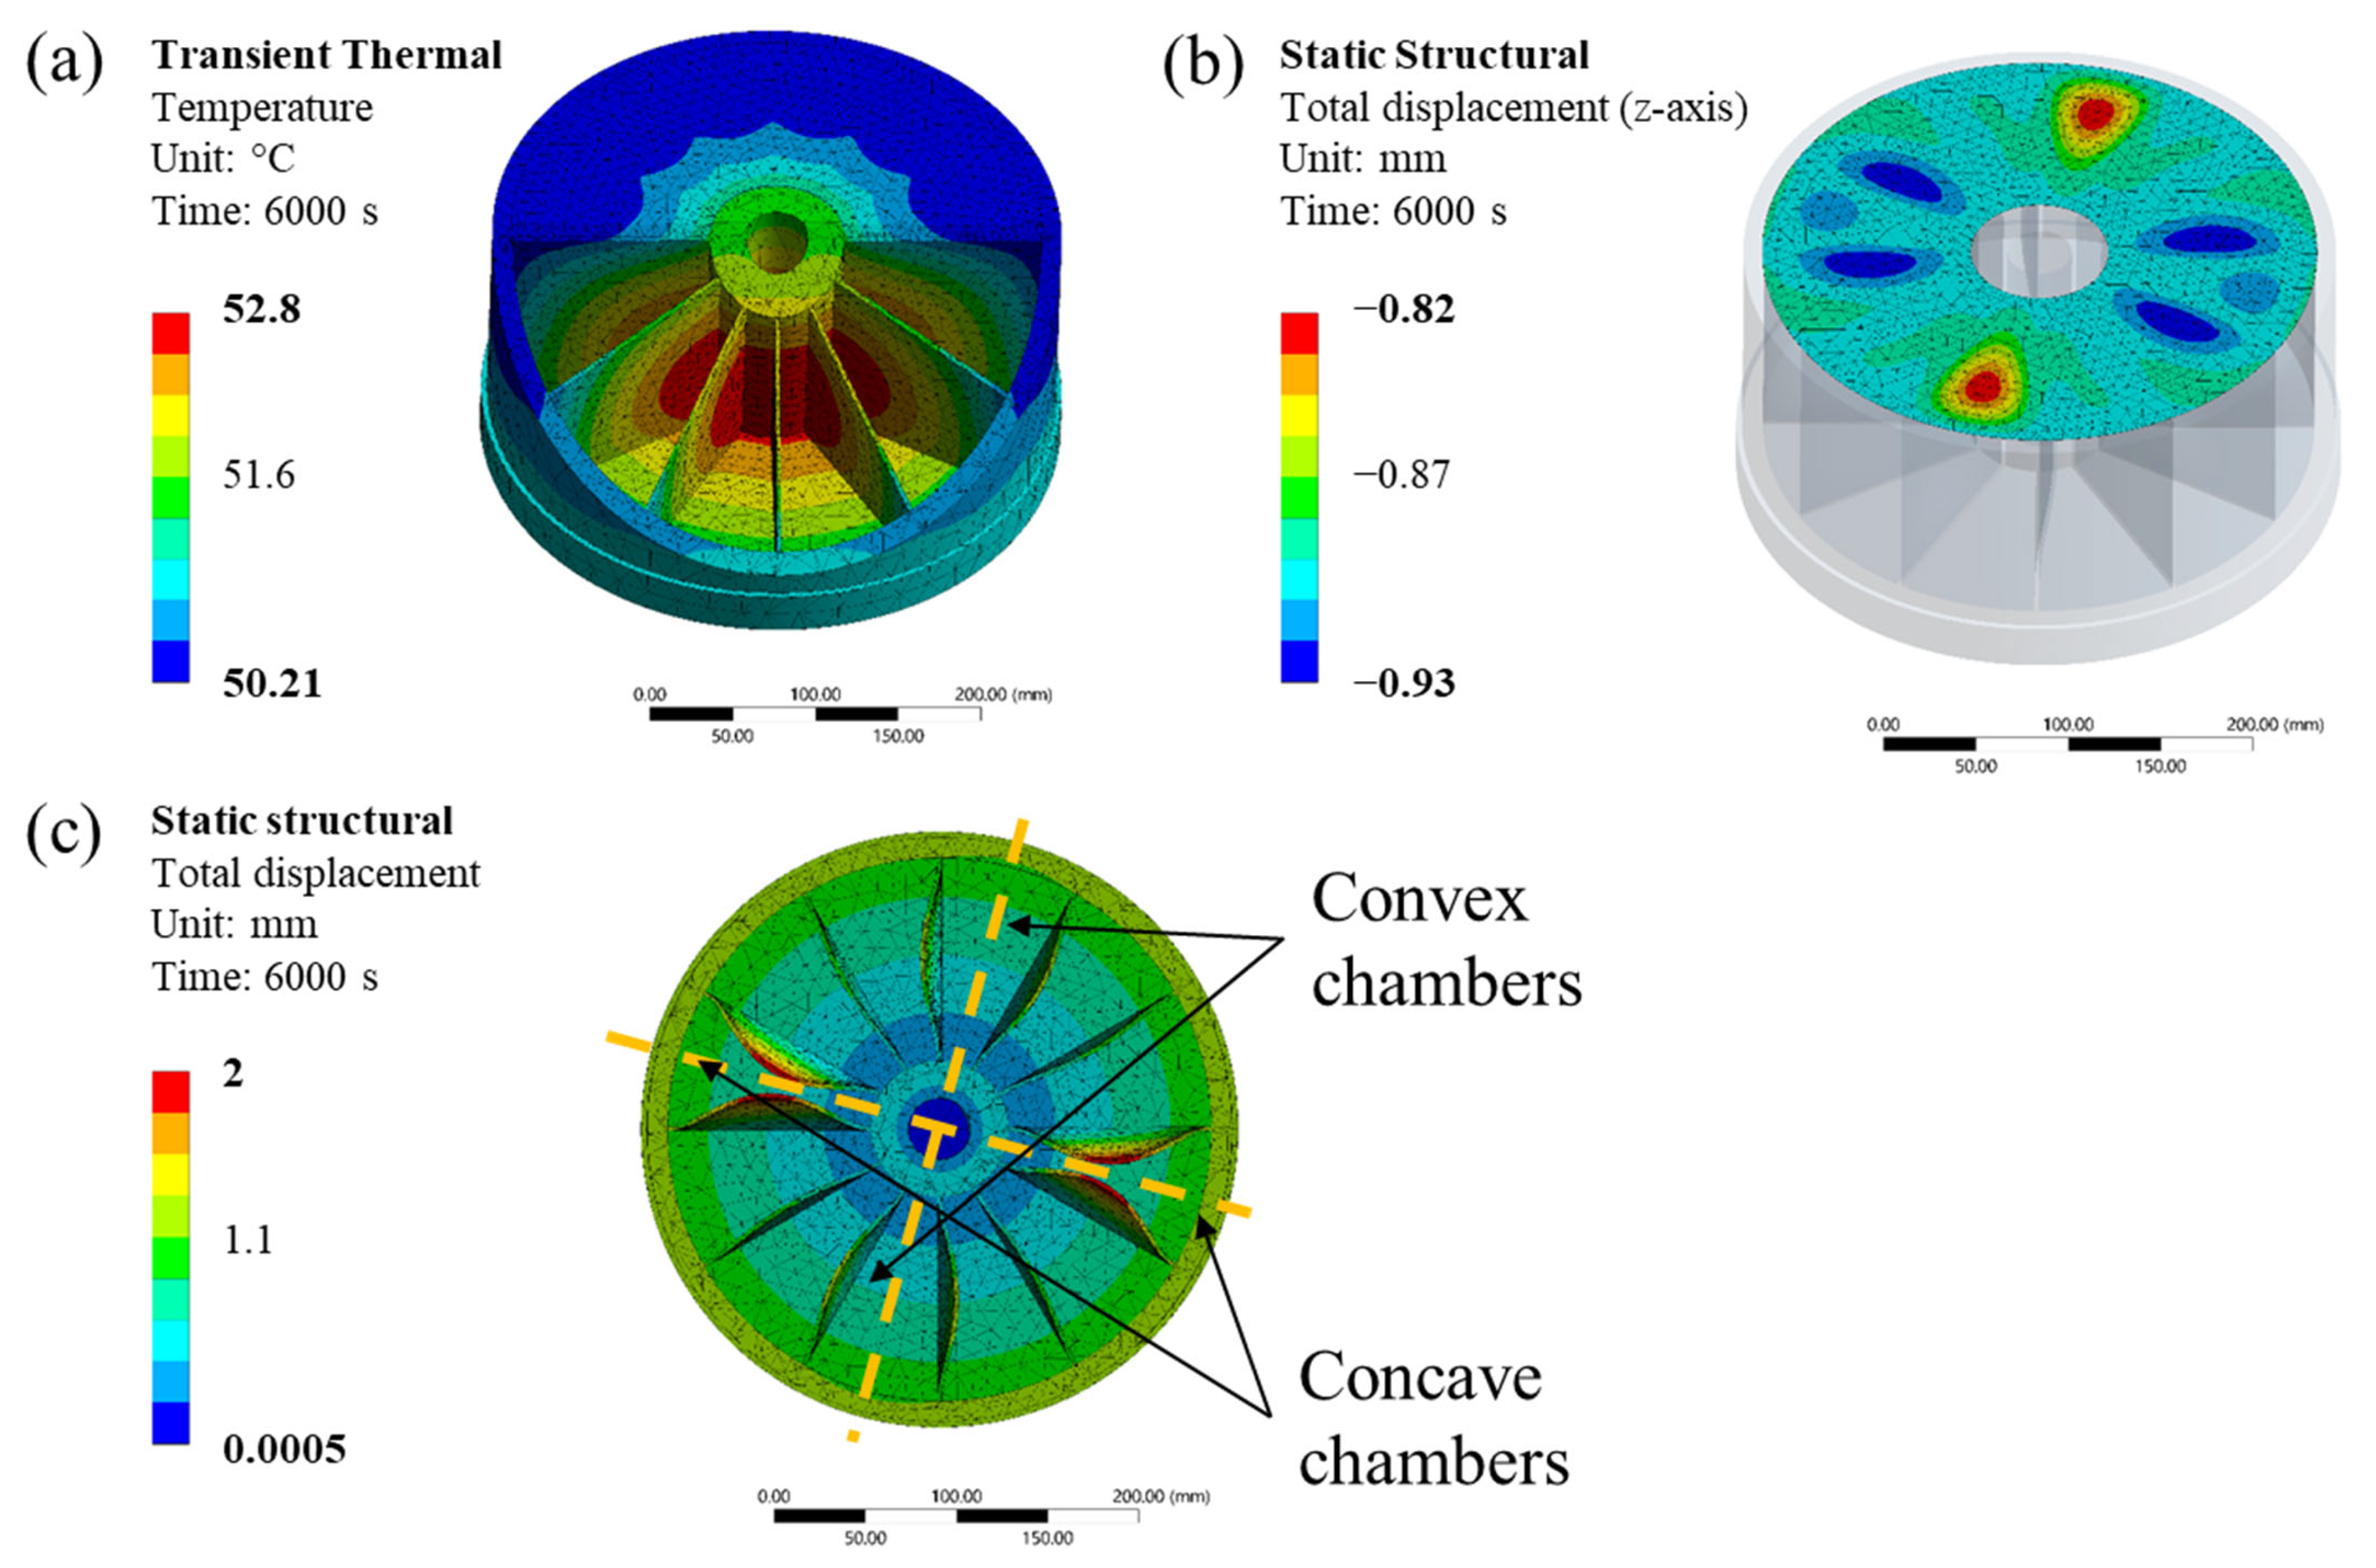
The heat treatment simulation was able to predict the distortion pattern of the piston. Since the piston skirt shrinks faster than the core, an inhomogeneous temperature distribution within the part is achieved. However, the maximal displacement of the thin walls was limited to dmax = 2 by thermal shrinkage and inhomogeneous pressure distribution. The uncoupled approach used in this simulation does not include the residual stresses from the phase transformation, the DMD process, and the laser welding process. The strains add up and exceed the elastic region during heat treatment. A coupled approach including the residual stresses measured in the DMD subpart might predict the present maximal displacement. However, large deflections require extensive nonlinearity and need further investigations in FE simulations.
In theory, the critical compressive buckling load is reduced from σc,25 °C = −273.8 MPa to σc,612 °C = −218.8 MPa when heating up to T = 612 °C. The thermal load during heat treatment has a significantly higher effect on the distortion compared to material removal in the as-built condition, which explains why the maximal displacement of the thin walls was dmax = 12 mm and only present in the heat-treated condition. This means that the boundary conditions and support values for buckling should be optimised within the simulation. Furthermore, experimental buckling analysis should be performed to validate the critical buckling load.

5. Conclusions

A workflow was developed to analyse the distortion of a large and complex turbo machinery piston for a gas compressor produced by DMD, laser welding, and post-heat treatment. The distortion was caused by a combination of residual stresses of the process history and compressive stresses induced during the heat treatment. The load during the vacuum heat treatment induces compressive stresses that exceeded the critical buckling load. Hence, the thin walls started to buckle. It could not be clarified whether the symmetrical distortion pattern was by random imperfections during the process, such as inhomogeneous pressure distribution, the eigenmode of the piston or anticlastic bending induced by the clamping forces. In general, constrained straight thin-walled structures are very sensitive to buckling and should be avoided, especially in DMD applications. The reason is that the residual stress history affects the strains, which add up and result in plastic deformation, especially during the heat treatment. Furthermore, many imperfections complicate the prediction of the distortion, which should be accounted for in the design of the part.
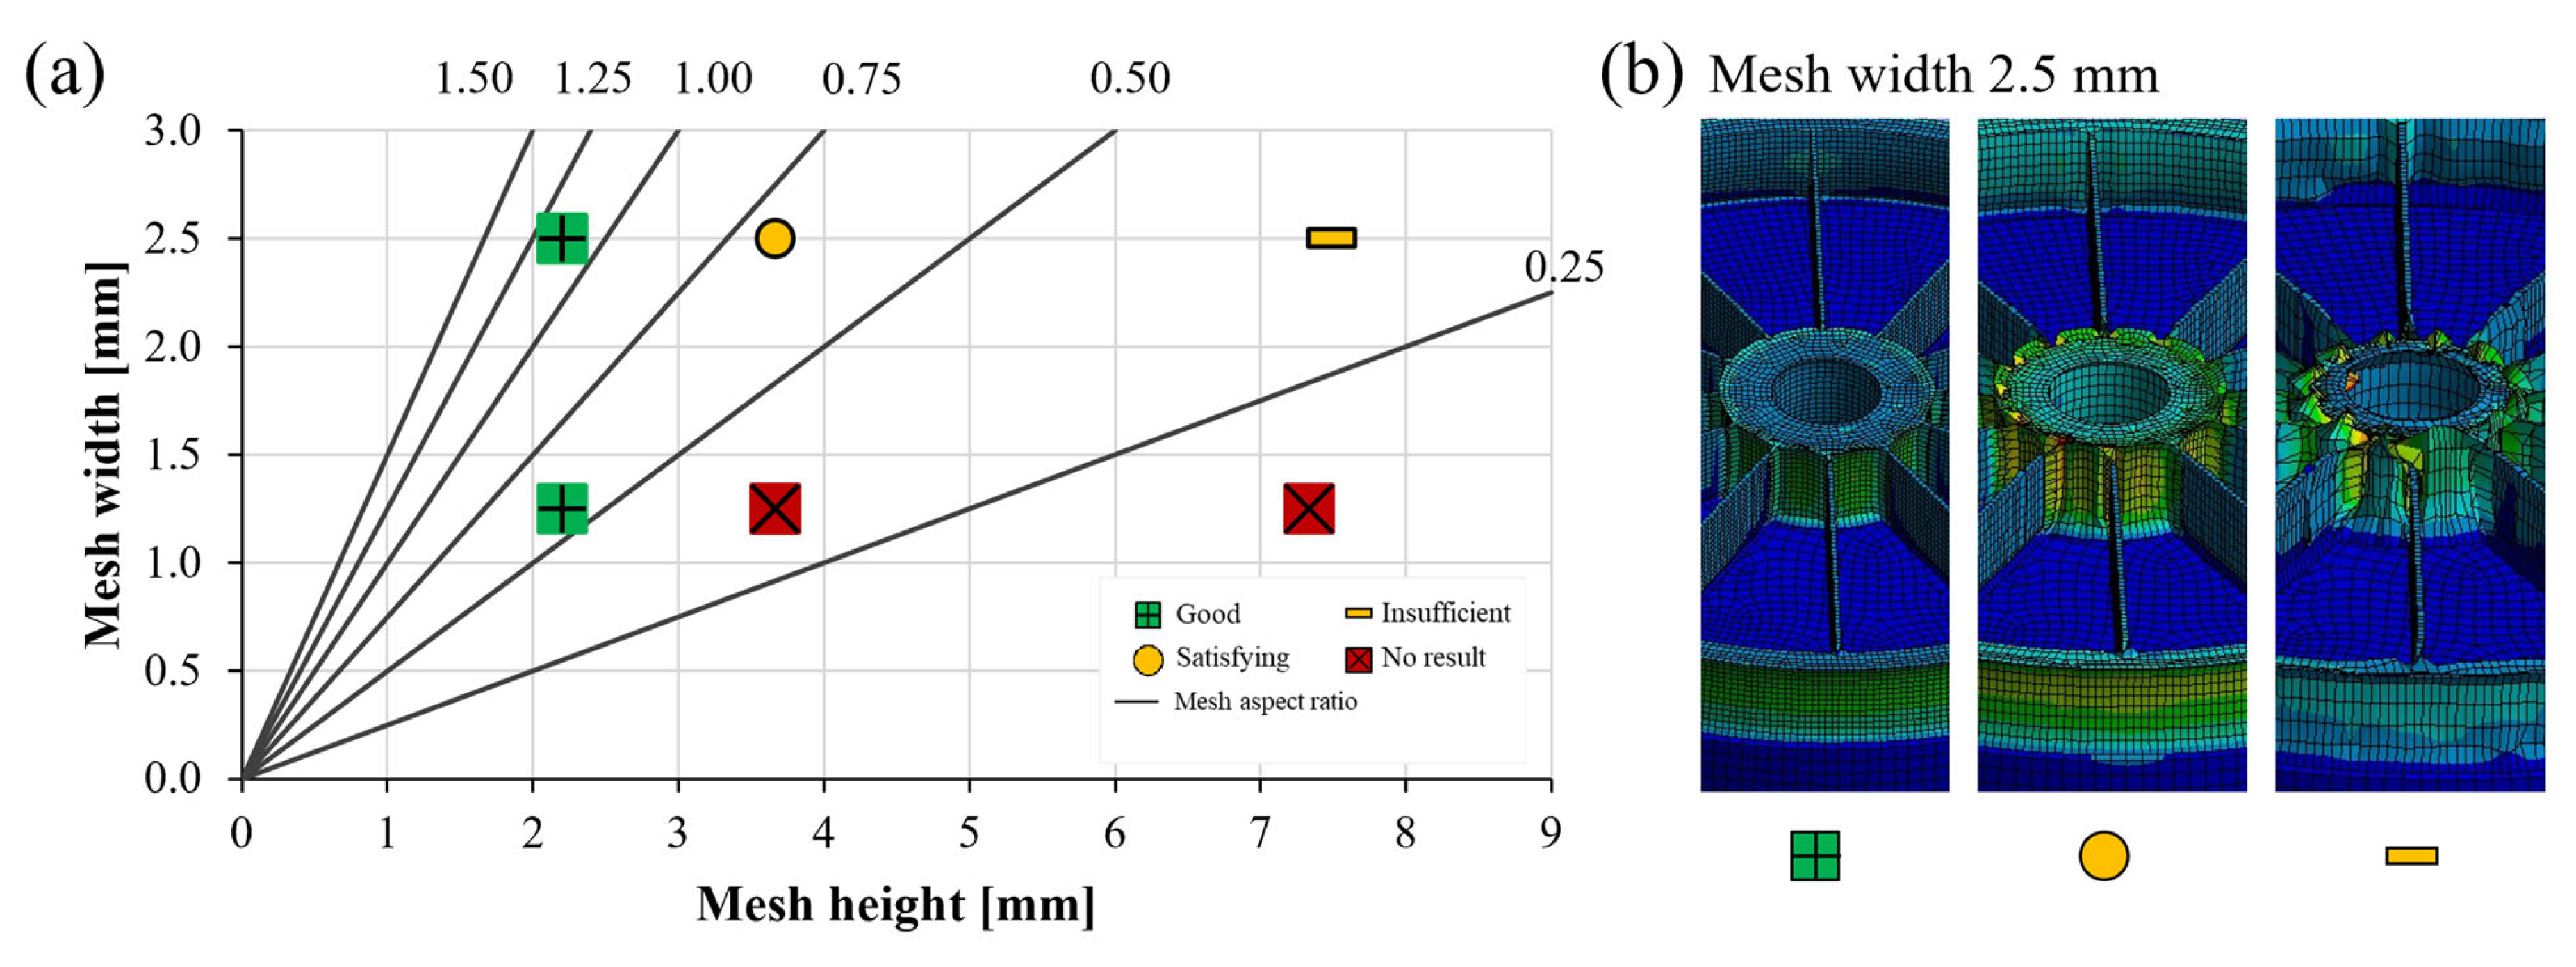
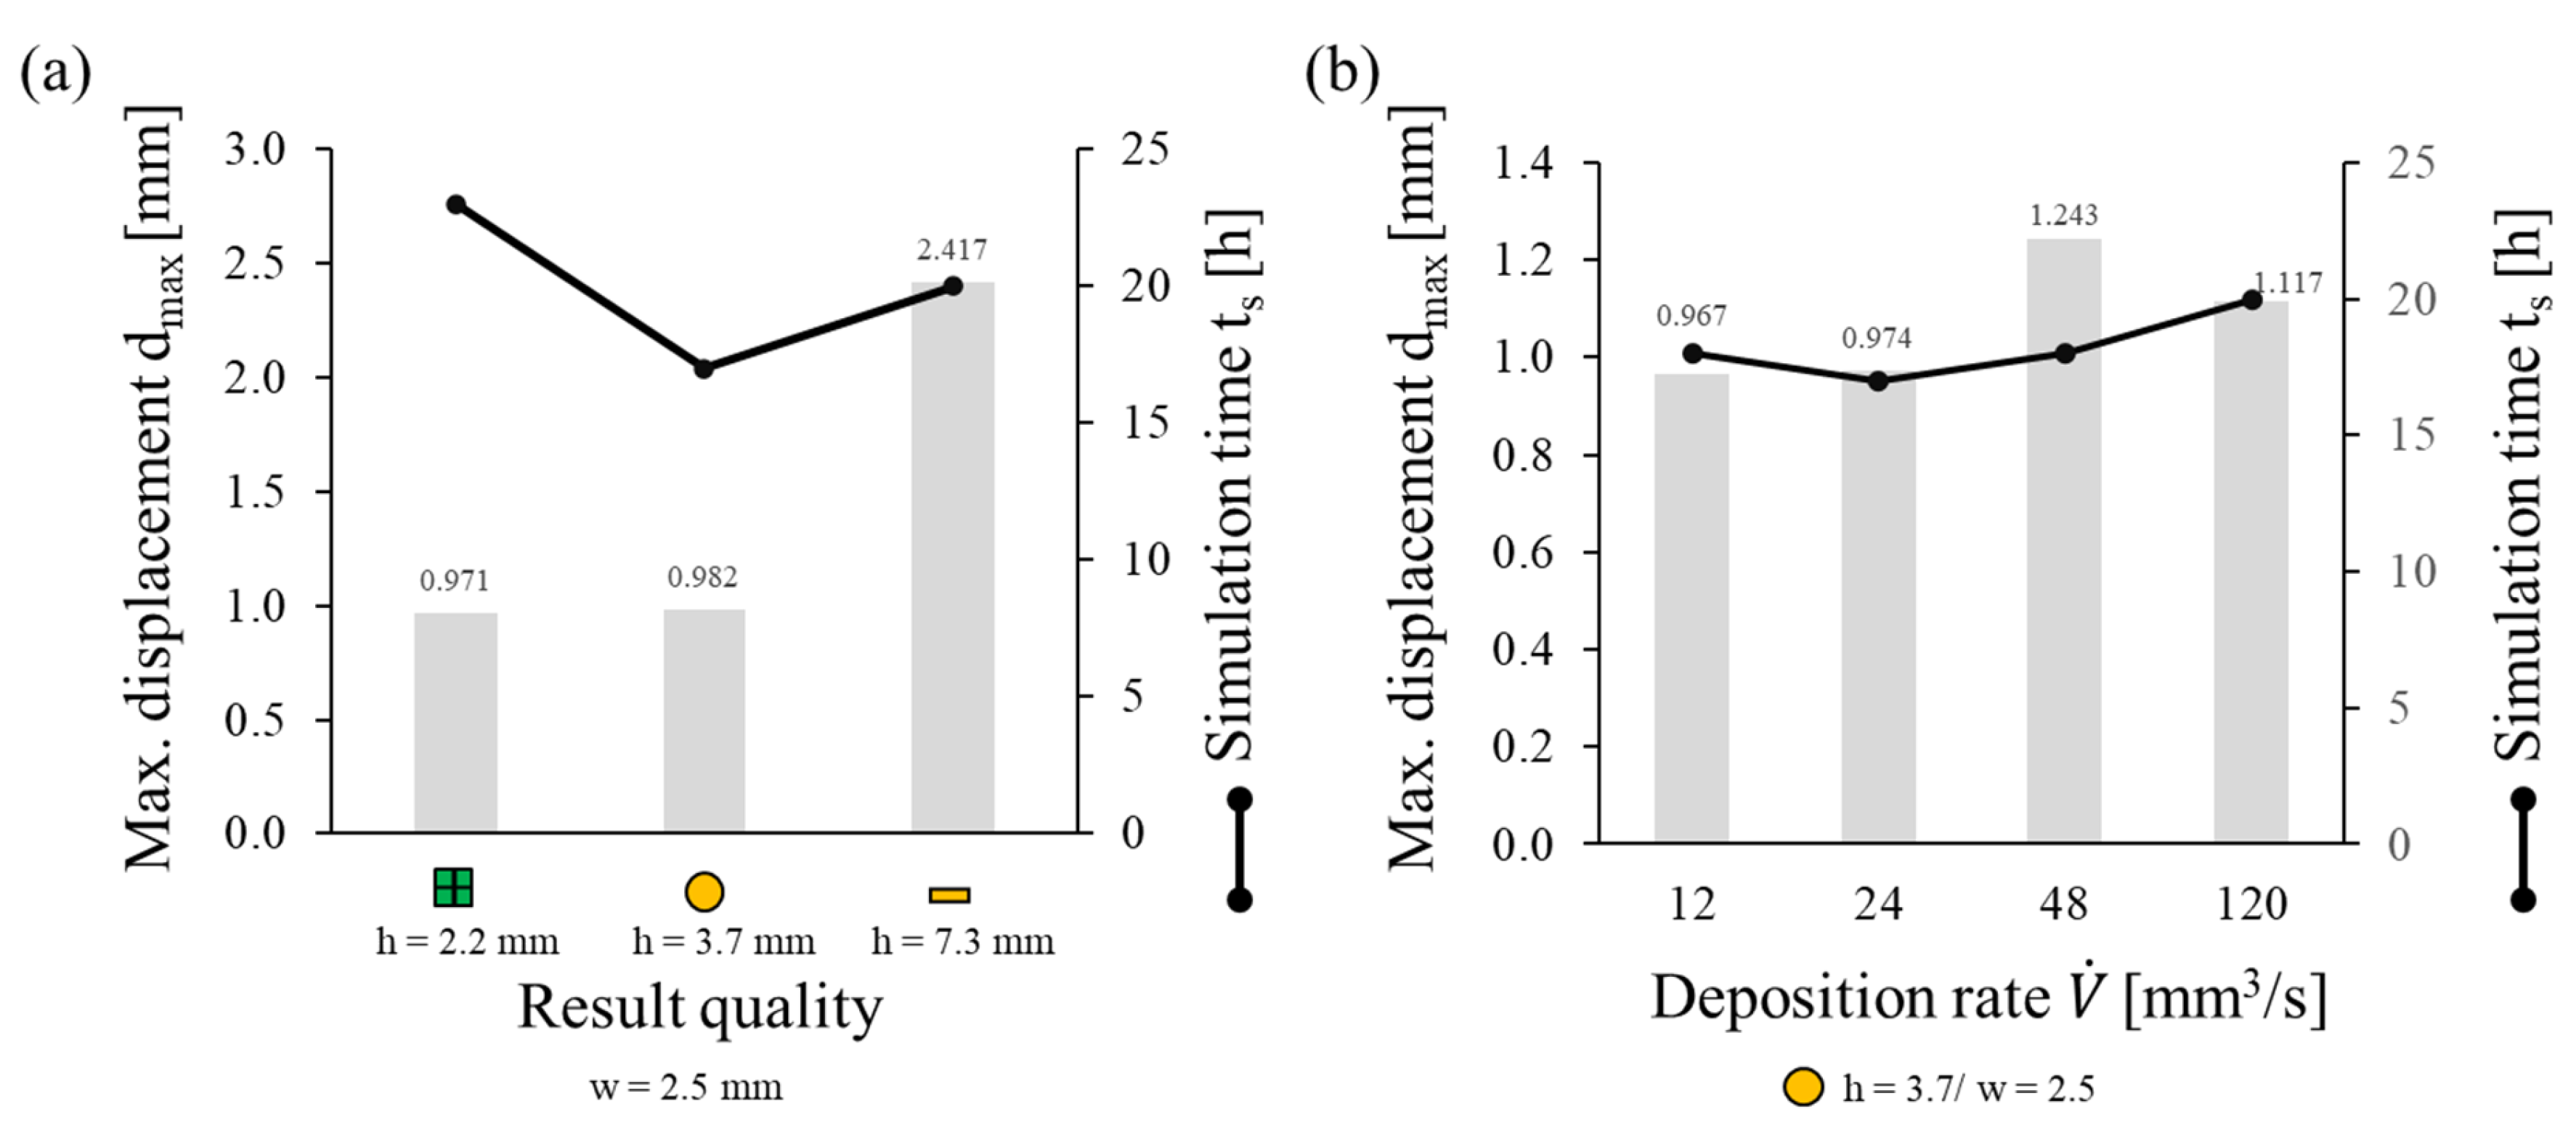
This study showed that commercial FE simulation models are sufficient to investigate distortion but not accurately predict the present distortion without considering the residual stress history. Parameter analysis and part modification were necessary to accommodate the limited number of elements that FE analysis can solve. The DMD process extension of ANSYS needs further calibration to predict more realistic maximal stresses. The heat treatment simulation including imperfections qualitatively represented the distortion pattern but did not predict the boundary conditions at the T-joint and maximal displacement of the present distortion.
Future research on the proposed models should involve the calibration of the DED process extension and coupling mechanisms to include the residual stress history to the heat treatment simulation. Further imperfections, such as additional forces of the clamping, dwell time, and laser weld, would increase the complexity of the model but not necessarily provide more information. Anticlastic bending, design optimisations, interaction between part removal and XRD, and experimental buckling analysis could be the subject of future research.

Author Contributions

Conceptualization, I.D.; methodology, I.D.; software, R.S. and R.F.; validation, I.D.; formal analysis, I.D.; investigation, I.D., R.F. and R.S.; resources, T.S. and K.W.; data curation, I.D., R.F. and R.S.; writing—original draft preparation, I.D.; writing—review and editing, I.D. and K.W.; visualization, I.D., R.F. and R.S.; supervision, T.S. and K.W.; project administration, K.W.; funding acquisition, K.W. All authors have read and agreed to the published version of the manuscript.

Funding

This research received no external funding.

Data Availability Statement

Dataset available on request from the authors.

Acknowledgments

The author thanks Noémie Martin, Maicol Fabbri, and Thomas Mayer for their helpful discussions on the structure and methods.

Conflicts of Interest

The authors declare no conflicts of interest.

References

  1. Thompson, S.M.; Bian, L.; Shamsaei, N.; Yadollahi, A. An overview of Direct Laser Deposition for additive manufacturing; Part I: Transport phenomena, modeling and diagnostics. Addit. Manuf. 2015, 8, 36–62. [Google Scholar] [CrossRef]
  2. Dass, A.; Moridi, A. State of the Art in Directed Energy Deposition: From Additive Manufacturing to Materials Design. Coatings 2019, 9, 418. [Google Scholar] [CrossRef]
  3. Korsmik, R.; Tsybulskiy, I.; Rodionov, A.; Klimova-Korsmik, O.; Gogolukhina, M.; Ivanov, S.; Zadykyan, G.; Mendagaliev, R. The approaches to design and manufacturing of large-sized marine machinery parts by direct laser deposition. Procedia CIRP 2020, 94, 298–303. [Google Scholar] [CrossRef]
  4. Rettberg, R.; Kraenzler, T. Hybrid manufacturing: A new additive manufacturing approach for closed pump impellers. In Industrializing Additive Manufacturing: Proceedings of AMPA2020; Springer: Cham, Switzerland, 2021; pp. 146–159. [Google Scholar]
  5. Dey, I.; Fabbri, M.; Gemmet, S.; Dalaee, M.; Wessel, M.; Wegener, K. Manufacturing a prototype with laser direct metal deposition and laser welding made from martensitic steel 1.4313. Int. J. Adv. Manuf. Technol. 2023, 124, 1993–2009. [Google Scholar] [CrossRef]
  6. Eisenbarth, D.; Soffel, F.; Wegener, K. Buildup stability and height prediction for DMD. In Proceedings of the Lasers in Manufacturing 2019, Munich, Germany, 24 July 2019. [Google Scholar]
  7. Ebrahimnia, M.; Xie, Y.; Chi, C. Effect of cladding parameters on microstructure and defects in direct laser metal deposition of 24CrNiMo steel. J. Laser Appl. 2020, 33, 012007. [Google Scholar] [CrossRef]
  8. Shamsaei, N.; Yadollahi, A.; Bian, L.; Thompson, S.M. An overview of Direct Laser Deposition for additive manufacturing; Part II: Mechanical behavior, process parameter optimization and control. Addit. Manuf. 2015, 8, 12–35. [Google Scholar] [CrossRef]
  9. Rangaswamy, P.; Griffith, M.L.; Prime, M.B.; Holden, T.M.; Rogge, R.B.; Edwards, J.M.; Sebring, R.J. Residual stresses in LENS® components using neutron diffraction and contour method. Mater. Sci. Eng. A 2005, 399, 72–83. [Google Scholar] [CrossRef]
  10. Xie, D.; Lv, F.; Yang, Y.; Shen, L.; Tian, Z.; Shuai, C.; Chen, B.; Zhao, J. A Review on Distortion and Residual Stress in Additive Manufacturing. Chin. J. Mech. Eng. Addit. Manuf. Front. 2022, 1, 100039. [Google Scholar] [CrossRef]
  11. Turichin, G.; Zemlyakov, E.; Babkin, K.; Ivanov, S.; Vildanov, A. Analysis of distortion during laser metal deposition of large parts. Procedia CIRP 2018, 74, 154–157. [Google Scholar] [CrossRef]
  12. Laleh, M.; Sadeghi, E.; Revilla, R.I.; Chao, Q.; Haghdadi, N.; Hughes, A.E.; Xu, W.; De Graeve, I.; Qian, M.; Gibson, I.; et al. Heat treatment for metal additive manufacturing. Prog. Mater. Sci. 2023, 133, 101051. [Google Scholar] [CrossRef]
  13. Seede, R.; Zhang, B.; Whitt, A.; Picak, S.; Gibbons, S.; Flater, P.; Elwany, A.; Arroyave, R.; Karaman, I. Effect of heat treatments on the microstructure and mechanical properties of an ultra-high strength martensitic steel fabricated via laser powder bed fusion additive manufacturing. Addit. Manuf. 2021, 47, 102255. [Google Scholar] [CrossRef]
  14. Deshpande, A.A.; Tanner, D.; Sun, W.; Hyde, T.; McCartney, G. Combined butt joint welding and post weld heat treatment simulation using SYSWELD and ABAQUS. Proc. Inst. Mech. Eng. Part L J. Mater. Des. Appl. 2011, 225, 1–10. [Google Scholar] [CrossRef]
  15. Läpple, V. Wärmebehandlung des Stahls, 11th ed.; Europa-Lehrmittel: Haan, Germany, 2014; p. 296. [Google Scholar]
  16. Meyer, B.-R. Entwicklung und Konstruktion von Kunststoffteilen; Nachweis der Knick-, Kipp- und Beulstabilität für Leichtbaukonstruktionen; Hanser Fachbuch: Munich, Germany, 2021. [Google Scholar] [CrossRef]
  17. Schenk, C.A.; Schuëller, G.I. Buckling analysis of cylindrical shells with random geometric imperfections. Int. J. Non-Linear Mech. 2003, 38, 1119–1132. [Google Scholar] [CrossRef]
  18. Malekjafarian, A.; OBrien, E.J.; Micu, L.A. Investigation of buckling capacity of metal materials manufactured by laser 3D printing. Procedia Manuf. 2017, 7, 696–700. [Google Scholar] [CrossRef]
  19. Gray, T.; Camilleri, D.; McPherson, N. 4—Understanding welding distortion: Thermal fields thermo-mechanical effects. In Control of Welding Distortion in Thin-Plate Fabrication; Gray, T., Camilleri, D., McPherson, N., Eds.; Woodhead Publishing: Sawston, UK, 2014; pp. 53–76. [Google Scholar]
  20. Mishurova, T.; Cabeza, S.; Artzt, K.; Haubrich, J.; Klaus, M.; Genzel, C.; Requena, G.; Bruno, G. An assessment of subsurface residual stress analysis in SLM Ti-6Al-4V. Materials 2017, 10, 348. [Google Scholar] [CrossRef] [PubMed]
  21. Schajer, G.S. Relaxation methods for measuring residual stresses: Techniques and opportunities. Exp. Mech. 2010, 50, 1117–1127. [Google Scholar] [CrossRef]
  22. Li, S.; Ren, S.; Zhang, Y.; Deng, D.; Murakawa, H. Numerical investigation of formation mechanism of welding residual stress in P92 steel multi-pass joints. J. Mater. Process. Technol. 2017, 244, 240–252. [Google Scholar] [CrossRef]
  23. Withers, P.J.; Bhadeshia, H.K.D.H. Residual stress. Part 1—Measurement techniques. Mater. Sci. Technol. 2001, 17, 355–365. [Google Scholar] [CrossRef]
  24. Huang, H.; Ma, N.; Chen, J.; Feng, Z.; Murakawa, H. Toward large-scale simulation of residual stress and distortion in wire and arc additive manufacturing. Addit. Manuf. 2020, 34, 101248. [Google Scholar] [CrossRef]
  25. Hajializadeh, F.; Ince, A. Short review on modeling approaches for metal additive manufacturing process. Mater. Des. Process. Commun. 2020, 2, e56. [Google Scholar] [CrossRef]
  26. Hajializadeh, F.; Ince, A. Finite element–based numerical modeling framework for additive manufacturing process. Mater. Des. Process. Commun. 2019, 1, e28. [Google Scholar] [CrossRef]
  27. DebRoy, T.; Wei, H.L.; Zuback, J.S.; Mukherjee, T.; Elmer, J.W.; Milewski, J.O.; Beese, A.M.; Wilson-Heid, A.; De, A.; Zhang, W. Additive manufacturing of metallic components—Process, structure and properties. Prog. Mater. Sci. 2018, 92, 112–224. [Google Scholar] [CrossRef]
  28. Michaleris, P. Modeling metal deposition in heat transfer analyses of additive manufacturing processes. Finite Elem. Anal. Des. 2014, 86, 51–60. [Google Scholar] [CrossRef]
  29. Peyre, P.; Aubry, P.; Fabbro, R.; Neveu, R.; Longuet, A. Analytical and numerical modelling of the direct metal deposition laser process. J. Phys. D Appl. Phys. 2008, 41, 025403. [Google Scholar] [CrossRef]
  30. Denlinger, E.R.; Irwin, J.; Michaleris, P. Thermomechanical modeling of additive manufacturing large parts. J. Manuf. Sci. Eng. 2014, 136, 061007. [Google Scholar] [CrossRef]
  31. Liang, X.; Cheng, L.; Chen, Q.; Yang, Q.; To, A.C. A modified method for estimating inherent strains from detailed process simulation for fast residual distortion prediction of single-walled structures fabricated by directed energy deposition. Addit. Manuf. 2018, 23, 471–486. [Google Scholar] [CrossRef]
  32. Lu, X.; Lin, X.; Chiumenti, M.; Cervera, M.; Hu, Y.; Ji, X.; Ma, L.; Yang, H.; Huang, W. Residual stress and distortion of rectangular and S-shaped Ti-6Al-4V parts by Directed Energy Deposition: Modelling and experimental calibration. Addit. Manuf. 2019, 26, 166–179. [Google Scholar] [CrossRef]
  33. Yang, Q.; Zhang, P.; Cheng, L.; Min, Z.; Chyu, M.; To, A.C. Finite element modeling and validation of thermomechanical behavior of Ti-6Al-4V in directed energy deposition additive manufacturing. Addit. Manuf. 2016, 12, 169–177. [Google Scholar] [CrossRef]
  34. Ivanov, S.; Artinov, A.; Zemlyakov, E.; Karpov, I.; Rylov, S.; Em, V. Spatiotemporal Evolution of Stress Field during Direct Laser Deposition of Multilayer Thin Wall of Ti-6Al-4V. Materials 2021, 15, 263. [Google Scholar] [CrossRef]
  35. Xie, R.; Zhao, Y.; Chen, G.; Zhang, S.; Lin, X.; Shi, Q. Development of efficient distortion prediction numerical method for laser additive manufactured parts. J. Laser Appl. 2019, 31, 022314. [Google Scholar] [CrossRef]
  36. Mukherjee, T.; Zhang, W.; DebRoy, T. An improved prediction of residual stresses and distortion in additive manufacturing. Comput. Mater. Sci. 2017, 126, 360–372. [Google Scholar] [CrossRef]
  37. Biegler, M.; Khazan, P.; Gazen, M.; Rethmeier, M. Improvement of numerical simulation model setup and calculation time in additive manufacturing-laser-metal-deposition components with an advanced modelling strategy. In Mathematical Modelling of Weld Phenomena 12; Verlag der Technischen Universität Graz: Graz, Austria, 2019; Volume 2019, pp. 979–1003. [Google Scholar]
  38. Biegler, M.; Elsner, B.A.; Graf, B.; Rethmeier, M. Geometric distortion-compensation via transient numerical simulation for directed energy deposition additive manufacturing. Sci. Technol. Weld. Join. 2020, 25, 468–475. [Google Scholar] [CrossRef]
  39. Kang, J.; Rong, Y. Modeling and simulation of load heating in heat treatment furnaces. J. Mater. Process. Technol. 2006, 174, 109–114. [Google Scholar] [CrossRef]
  40. Berglund, D.; Alberg, H.; Runnemalm, H. Simulation of welding and stress relief heat treatment of an aero engine component. Finite Elem. Anal. Des. 2003, 39, 865–881. [Google Scholar] [CrossRef]
  41. Deng, D.; Murakawa, H. FEM prediction of buckling distortion induced by welding in thin plate panel structures. Comput. Mater. Sci. 2008, 43, 591–607. [Google Scholar] [CrossRef]
  42. Niessen, F. Austenite reversion in low-carbon martensitic stainless steels—A CALPHAD-assisted review. Mater. Sci. Technol. 2018, 34, 1401–1414. [Google Scholar] [CrossRef]
  43. Boniardi, M.; Casaroli, A. Stainless Steels; Lucefin, G., Ed.; Esine: Brescia, Italy, 2014. [Google Scholar]
  44. Freital, Data sheet, B.E. Inspection Report of 1.4313 Bar steel forged. 1996.
  45. Matmach. Material Search Platform. Available online: https://matmatch.com/ (accessed on 19 November 2023).
  46. Mayer, T.; Brändle, G.; Schönenberger, A.; Eberlein, R. Simulation and validation of residual deformations in additive manufacturing of metal parts. Heliyon 2020, 6, e03987. [Google Scholar] [CrossRef]
  47. Mayr, J.; Jedrzejewski, J.; Uhlmann, E.; Alkan Donmez, M.; Knapp, W.; Härtig, F.; Wendt, K.; Moriwaki, T.; Shore, P.; Schmitt, R.; et al. Thermal issues in machine tools. CIRP Ann. 2012, 61, 771–791. [Google Scholar] [CrossRef]
  48. Böge, A. Vieweg Handbuch Maschinenbau; Vieweg+Teubner: Berlin, Germany, 2007. [Google Scholar]
  49. Cullity, B.D. Elements of X-ray Diffraction; Addison-Wesley Publishing: Boston, MA, USA, 1956. [Google Scholar]
  50. Fitzpatrick, M.E.; Fry, A.T.; Holdway, P.; Kandil, F.; Shackleton, J.; Suominen, L. Determination of residual stresses by X-ray diffraction. A National Measurement Good Practice Guide. 2005. Available online: https://eprintspublications.npl.co.uk/2391/1/mgpg52.pdf (accessed on 13 April 2024).
  51. Uzun, F.; Basoalto, H.; Liogas, K.; Chen, J.; Dolbnya, I.P.; Wang, Z.I.; Korsunsky, A.M. Voxel-based full-field eigenstrain reconstruction of residual stresses in additive manufacturing parts using height digital image correlation. Addit. Manuf. 2023, 77, 103822. [Google Scholar] [CrossRef]
  52. Wang, J.F.; Wagoner, R.H.; Matlock, D.K.; Barlat, F. Anticlastic curvature in draw-bend springback. Int. J. Solids Struct. 2005, 42, 1287–1307. [Google Scholar] [CrossRef]
  53. Falope, F.; Lanzoni, L.; Tarantino, A. Bending device and anticlastic surface measurement of solids under large deformations and displacements. Mech. Res. Commun. 2019, 97, 52–56. [Google Scholar] [CrossRef]
Figure 1. Workflow for distortion analysis of a large and complex prototype.
Jmmp 08 00078 g001
Figure 2. Temperature of the part and furnace during annealing.
Jmmp 08 00078 g002
Figure 3. Temperature-dependent material properties of 1.4313 and 1.4542.
Jmmp 08 00078 g003
Figure 4. (a) geometrical-based (b) force- and pressure-based imperfections applied in the eigenvalue analysis.
Jmmp 08 00078 g004
Figure 5. CAD model for DMD simulation and corresponding nominal cylindrical shape.
Jmmp 08 00078 g005
Figure 6. Boundary conditions of the heat treatment simulation highlighted in yellow with a flag: (a) remote displacement; (b) surfaces where convection was applied and corresponding nominal elliptical shape.
Jmmp 08 00078 g006
Figure 7. Inhomogeneous pressure distribution representing imperfections.
Jmmp 08 00078 g007
Figure 8. Part removal by EDM cutting for destructive residual stress measurement.
Jmmp 08 00078 g008
Figure 9. Final prototype (a) in the as-built condition (b) after heat treatment revealing the distortion pattern.
Jmmp 08 00078 g009
Figure 10. Results of the eigenvalue buckling analysis: (a) mesh sensitivity (b) including geometrical imperfections (c) including geometrical-, force-, and pressure-based imperfections.
Jmmp 08 00078 g010
Figure 11. (a) Simulation process parameter map and (b) simulation quality categories (10× magnification).
Jmmp 08 00078 g011
Figure 12. Simulation time and maximal displacement of (a) different mesh heights and (b) deposition rates.
Jmmp 08 00078 g012
Figure 13. (a) Normal stresses σxx (left) which are only relevant in the cross section along the x-axis (right) (b) XRD measuring points along the x-axis (c) displacement results of the DMD simulation.
Jmmp 08 00078 g013
Figure 14. Sensitivity analysis on mesh size s (left) and convection coefficient α (right).
Jmmp 08 00078 g014
Figure 15. Simulation results of the heat treatment simulation with inhomogeneous pressure distribution (a) temperature distribution during the cooling of the piston (b) directional deformation in z-direction of the piston crown (c) total distortion of thin walls.
Jmmp 08 00078 g015
Figure 16. Normal stresses σxx (left) which are only relevant in the cross section along the x-axis (right).
Jmmp 08 00078 g016
Figure 17. Load case during (a) DMD and (b) heat treatment.
Jmmp 08 00078 g017
Figure 18. Results of the tomography at room temperature of the (a) as-built final prototype (b) final prototype after heat treatment (c) as built DMD subpart (d) as built 90°-section after part removal.
Jmmp 08 00078 g018
Figure 19. Geometrical validation of the distortion pattern between the experimental (left) and simulative (right) results.
Jmmp 08 00078 g019
Figure 20. Validation of the DMD simulation on the 90°-section using XRD.
Jmmp 08 00078 g020
Table 1. Chemical composition of 1.4542 (wt%) referring to [43].
CrNiMnMoSiCSPFe
15–173.50–5.00<1.5<0.60<0.70<0.07<0.015<0.040Bal
Table 2. Chemical composition of 1.4313 (wt%) referring to [44].
CrNiMnMoSiCSPFe
12–143.50–4.50<1.50.30–0.70<0.70<0.05<0.015<0.040Bal
Table 3. Simulation parameter for the DMD simulation parameter study.
Simulation Parameter
Layer thickness or mesh height h [mm]2.22.23.73.77.37.3
Mesh width w [mm]2.51.252.51.252.51.25
Mesh aspect ratio α = w/h1.10.60.70.30.30.2
Deposition rate m ˙ [mm3/s] 12/24/48/120
Table 4. Simulation properties for heat treatment.
PropertyValue
Ambient temperature T0 [°C]19.85
Maximal temperature Tmax [°C]590
Ambient convection temperature T0conv [°C]50
Ambient pressure p0 [bar]1
Vacuum pressure pvac [bar]2.4 · 10−13
Maximal pressure inside the piston pmax [bar]2.945
Overpressure Δpmax [bar]3.945
Convection coefficient at 10 m/s air speed α10 · [ W m 2 K ] 50
Convection coefficient at 10 m/s air speed α20 · [ W m 2 K ] 100
Convection coefficient of still water αw · [ W m 2 K ] 600
Table 5. Variables to calculate the critical buckling load σ c .
ParameterValue
Load-free side of plate a [mm]118
Loaded side of plate b [mm]132
Length ratio of load-free and loaded side α0.894
Critical length ratio for case distinction αg1
Plate thickness s [mm]2.5
Poisson’s ratio ν0.3
Buckling coefficient k24.05
Load case dependent coefficients C12
Load case dependent coefficients C21
Table 6. Simulation results of the normal stresses σxx along x-axis of the DMD subpart.
Longitudinal Stress σxx [MPa]
1234567
103.7 872.2993.5 840.7 636 65.9 −163.99
Table 7. Critical buckling load and critical thermal load.
ParameterValue
Slenderness ratio λ (Equation (5))86.7
Critical compressive strain for plate buckling ε (Equation (4))−1.31 · 10−3
Young Modulus (25 °C) E25 °C209,000 MPa
Young Modulus (612 °C) E612 °C167,000 MPa
Young Modulus (889 °C) E889 °C117,000 MPa
Critical buckling load (25 °C) σc,25 °C (Equation (3))−273.8 MPa
Critical buckling load (612 °C) σc,612 °C (Equation (3))−218.8 MPa
Critical buckling load (889 °C) σc,889 °C (Equation (3))−153.3 MPa
Table 8. Results of the residual stress measurement on the 90°-section of the DMD subpart.
Longitudinal Stress σxx [MPa]
Point1234567
Wall 197.6 ± 6.3 55.4 ± 2.6 −161.5 ± 3.6 −159.9 ± 4.4 −120.8 ± 2.3 −36.8 ± 4.1 35.7 ± 3.3
Wall 2193.5 ± 6.2 −59.6 ± 4.9 49.9 ± 3.2 46.1 ± 4.2 −92.4 ± 5.9 164.4 ± 6.5 56.1 ± 8.7
Wall 3165.1 ± 5.4 138.2 ± 5.6 −121.2 ± 3.1 −106 ± 5.9 −79.8 ± 2.7 63 ± 4.5 119.4 ± 6.6
Disclaimer/Publisher’s Note: The statements, opinions and data contained in all publications are solely those of the individual author(s) and contributor(s) and not of MDPI and/or the editor(s). MDPI and/or the editor(s) disclaim responsibility for any injury to people or property resulting from any ideas, methods, instructions or products referred to in the content.

