Article

Evaluation of Porosity in AISI 316L Samples Processed by Laser Powder Directed Energy Deposition

by
Alessandro Salmi
*,
Gabriele Piscopo
,
Adriano Nicola Pilagatti
and
Eleonora Atzeni
Department of Management and Production Engineering (DIGEP), Politecnico di Torino, Corso Duca degli Abruzzi 24, 10129 Torino, Italy
*
Author to whom correspondence should be addressed.
J. Manuf. Mater. Process. 2024, 8(4), 129; https://doi.org/10.3390/jmmp8040129
Submission received: 1 May 2024 / Revised: 7 June 2024 / Accepted: 19 June 2024 / Published: 24 June 2024
(This article belongs to the Special Issue Advances in Directed Energy Deposition Additive Manufacturing)

Abstract

:
Directed energy deposition-laser beam/powder (DED-LB/Powder) is an additive manufacturing process that is gaining popularity in the manufacturing industry due to its numerous advantages, particularly in repairing operations. However, its application is often limited to case studies due to some critical issues that need to be addressed, such as the degree of internal porosity. This paper investigates the effect of the most relevant process parameters of the DED-LB/Powder process on the level and distribution of porosity. Results indicate that, among the process parameters examined, porosity is less affected by travel speed and more influenced by powder mass flow rate and laser power. Additionally, a three-dimensional finite element transient model was introduced, which was able to predict the development and location of lack-of-fusion pores along the building direction.

1. Introduction

Additive manufacturing (AM) processes have already been adopted by many industrial sectors such as biomedical, energy, oil and gas, aerospace and nuclear [1]. The interest in AM over conventional manufacturing methods is driven by several advantages in relation to geometrical complexity, material usage, time-saving and added value [2]. Among the metal AM processes, directed energy deposition (DED) processes are currently at the forefront of innovation. As a matter of fact, the revenue market shares of powder bed fusion (PBF) and DED processes in 2019 were around 85% and 8.3%, respectively; by 2025, the revenue of PBF processes is expected to fall to 63%, while the DED processes will rise to 11.1% [3]. The possibility to produce large components (length larger than one meter), to change the material during the process of realizing multi-graded materials, and the possibility to repair components by depositing directly onto an existing planar or non-planar surface are only a few of the main advantages of DED over PBF or conventional processes [4,5]. Hence, focusing the attention on DED processes, the ASTM standard [6] classifies the different variants with respect to the heat sources (laser, electron beam or plasma arc) and to the feedstock material (powder or wire). In more specific terms, the DED process that uses a laser as an energy source and a powder as a feedstock material is the most used [7] and this process is referred as DED-LB/Powder [7,8]. Despite the enormous potentialities, the industrial application of the DED-LB/Powder process is still limited [7] and one of the main reasons is that the components produced are prone to a high level of porosity [9]. The presence of pores negatively affects both the density and the mechanical characteristics such as the yield strength, the ultimate tensile strength, and the Young’s modulus [10]. In addition, they can act as stress concentrators and crack growth sites [11]. Hence, several efforts are needed to understand and minimize the porosity level that arises from the deposition process.
The literature distinguishes three basic types of pores in DED components: (a) keyhole, (b) gas-induced and (c) lack-of-fusion pores, which result from different mechanisms [12,13]. Specifically, keyhole pores appear elongated along the building direction [12] and result from material evaporation and melt pool collapse. They are typically the consequence of unstable melt pool dynamics at high energy density [14]. Gas-induced pores, instead, are spherical in shape (sphericity higher than 0.6 [15]) and smaller, and are usually caused by the presence of gas in the feedstock material [16], the selective evaporation of an element of the specific alloy used [17] or by the entrapment of the shielding gas [13]. Finally, lack-of-fusion pores are characterized by an elongated irregular shape (sphericity lower than 0.6 [15]) and their size is comparable to the melt pool scale [12] and arise from an inadequate penetration of the melt pool into the substrate due to insufficient energy [9]. Focusing the attention on gas-induced and lack-of-fusion pores, it was observed that the first ones are mainly located inside the deposited track and they are mostly influenced by the melt pool depth, while the latter are influenced by melt pool width and occur at the interface between two consecutive tracks [18].
Susan et al. [19] and Ahsan et al. [20] showed an important relation between the powder production method and the sample porosity. It was observed that the porosity of the powder particles and the shape of the powder were directly related to the powder production method. Furthermore, these factors influenced the porosity level of the produced samples, with the sample porosity increasing with porosity inside the powder particles and when non-spherical powder particles were used. As a rule of thumb, it is a good practice to characterize the feedstock material prior to deposition. Rahman Rashid et al. [21] observed porosities of the order of 5 μm to 15 μm in AISI 316L single layers. These porosities were mainly located at both ends of each track due to the gas entrapped into the melt pool. Furthermore, Pragana et al. [22] demonstrated that the type of shielding gas employed also affects the porosity level, with the samples produced with argon exhibiting a higher porosity level than those produced with nitrogen. By characterizing the porosity of AISI 316L samples, Tan et al. [11] found that the dense part was not uniform, but the samples were denser in the upper zone farthest from the substrate. Small and almost spherical pores were prevalent in that area. The bottom zone’s porosity in these samples was greater than 150 μm in diameter. Furthermore, Zheng et al. [23] showed that the lack-of-fusion pores occurring at the layer boundaries were correlated with an improper Z-increment combined with the selected process parameters, resulting in reduced growth of the part, which caused the laser to be out of focus. Consequently, the most straightforward approach used in the literature to minimize the porosity level is to adjust the process parameters, namely laser power, travel speed, hatching distance and powder mass flow rate [8,12,24].
There are several works in the literature concerning the effect of process parameters on the part’s porosity. Amar et al. [25] produced 10 × 10 × 10 mm3 AISI 316L samples and using a response surface methodology observed that the most significant parameter influencing the porosity was the powder mass flow rate; in detail, the porosity increased with powder mass flow rate due to the track overgrowing. In their study, Majumdar et al. [26] observed that porosity increased when powder mass flow rate values were too low or too high. This was achieved by varying the powder mass flow rate from 3.8   m g · min −1 to 12.2   m g · min −1. Analogously, Lin et al. [27] showed that for low values of powder mass flow rate, the energy provided to the material was higher and this led to a higher quantity of gas-induced pores. When the powder mass flow rate was increased, a reduction in porosity was observed; however, for a higher powder mass flow rate, the porosity increased due to lack-of-fusion pores.
As for laser power and travel speed, the literature on the topic of porosity presents contrasting points of view. During the deposition of AISI 316L single-track thin wall, Majumdar et al. [26] observed that porosity decreased with increasing travel speed and was almost independent from laser power. On the contrary, Kartikeya Sarma et al. [28], for the deposition of AISI 316L cylinder ( Φ 10 × 25   m m 3 ), showed that the porosity was mainly influenced by laser power, but the effects of travel speed and powder mass flow rate were less significant. Savitha et al. [29] highlighted that the porosity was significantly influenced by the interaction between laser power and travel speed. Lin et al. [27] performed three one-factor-at-a-time experiments on 3 m m thin-walled AISI 316L cylinders and observed that porosity decreased from 0.23% to 0.13%, with an increase in the laser power from 1200 W to 1800 W . However, at a laser power of 2000 W , a slight increase to 0.14% was observed. Amar et al. [25] observed that the laser power and the travel speed did not significantly affect the porosity.
This analysis of the literature highlights the complexity of the phenomena governing the DED-LB/Powder process, as confirmed by several reviews [5,8,30,31]. Numerical simulation coupled with experiments can be used to deepen the understanding of the DED-LB/Powder process. More specifically, the macro-scale approaches typically used to study the temperature distribution and the thermal cycles during the deposition process, which are able to predict the microstructure evolution and the residual stresses [32], could be extended to the analysis of porosity in analogy to casting simulations [12,30,33].
In this study, a characterization of pores in AISI 316L massive samples produced under different process parameters was first performed using computed tomography (CT) analysis. The effect of the main process parameters was then evaluated. CT scan analysis provided a volumetric understanding of the porosity type and distribution as a function of the process parameters adopted. The pores were characterized by considering their position, size and shape. Furthermore, an attempt was made to ascertain a correlation between the porosities and the thermal history that were generated during the production process. Subsequently, a macro-scale three-dimensional FE thermal model was employed, with the objective of evaluating its suitability for forecasting the probability and location of pores in DED samples.

2. Materials and Methods

The following subsections describe the experimental procedure adopted in this work. Firstly, the sample geometry and the equipment used for sample production and characterization are illustrated. Then, the selection of the process parameters and their values in the experimental tests are detailed. Finally, the thermal numerical model is presented.

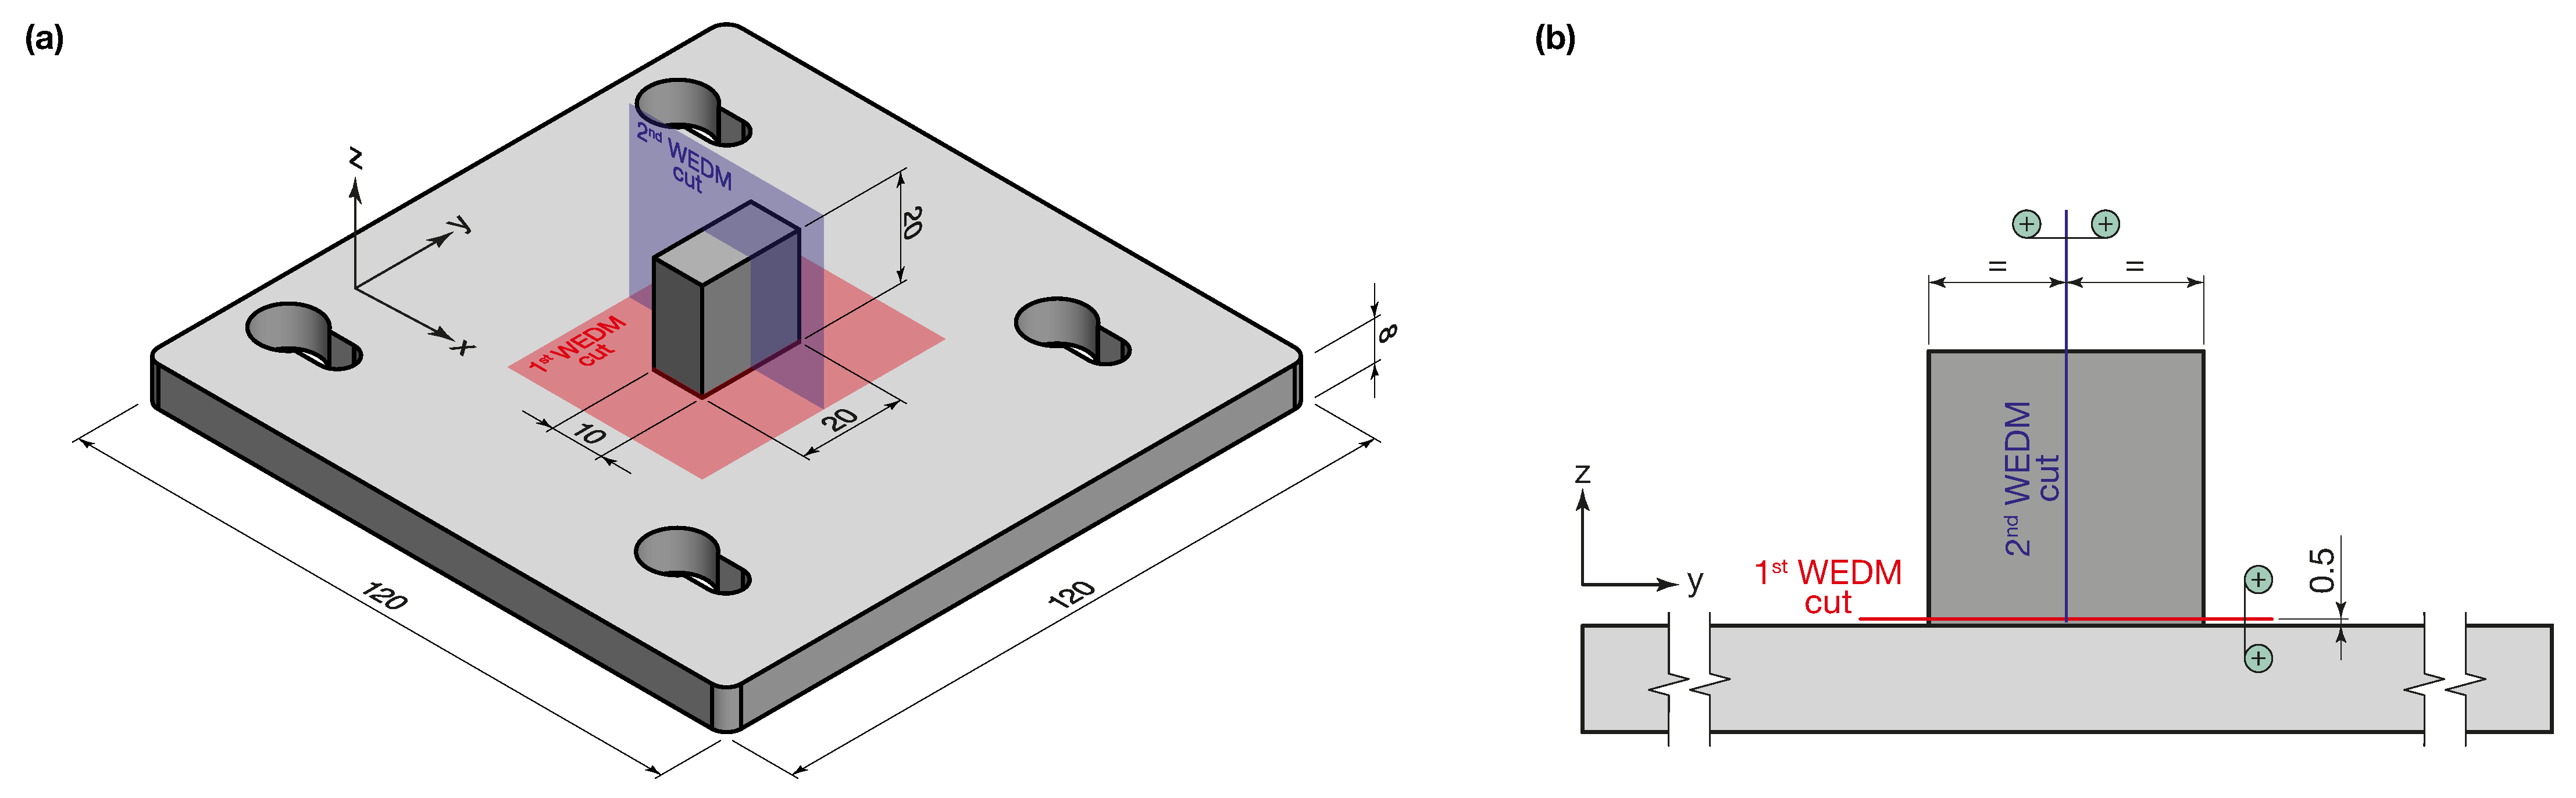
2.1. Sample Geometry, Production and Characterization

AISI 316L parallelepiped samples with dimensions of 10 × 20 × 20 mm3 were deposited on substrates of the same material. The dimensions of the sample were selected as the best compromise between the characteristic thicknesses of DED components and the capabilities of CT scan analysis, with the objective of achieving a reasonable level of accuracy. The geometry is illustrated in Figure 1a. In this work, MetcoAdd 316L gas atomized powder provided by Oerlikon Metco Inc. (Troy, MI, USA) was used [34]. Powder particles had an almost spherical shape with few satellites and a diameter ranging from 45 μm to 106 μm. Specifically, the particle size distribution of the powder showed a unimodal and Gaussian pattern, with D 10 at 49.2   μ m , D 50 at 60.9   μ m , and D 90 at 74.6   μ m . A detailed characterization of the powder particles is reported in [35]. The production of the samples was performed on a LASERDYNE® 430 by Prima Additive (Collegno, Italy). This DED-LB/Powder system was equipped with a 1000 W fiber laser. The laser beam had a top-hat distribution and the nominal diameter was 2 m m at the focal plane. The deposition head included 4 coaxial nozzles which generate a Gaussian powder flow with a diameter of around 4 m m at the focal plane of the laser. The powder particles were delivered in the working area by means of a constant flux of argon.
The process parameters recognized in the literature as the most relevant [4,8,31] were considered, namely travel speed (v), powder mass flow rate ( Q p ), and laser power (P). Specifically, a one-factor design was used to test the effect of process parameters individually and identify critical parameters for porosity. Consequently, three sets of samples were produced, one for each parameter tested. As a starting point for the design of experiment, the parameter values previously utilized for the production of AISI 316L bulk samples using the same DED-LB/Powder system were employed, which had resulted in satisfactory outcomes in terms of dimensional accuracy with a deviation of less than 0.5   m m on the lateral surfaces and less than 0.1   m m on the height [36]. In detail, the process parameter values were P = 500 W , Q p = 4.5   g · min −1, and v = 850 m m · min −1, and will be referred to as reference values.
Initially, due to its relevance, the effect on the porosity of an increased laser power value was tested. Three levels of laser power were considered, leading to a first set of samples. Then, the effect of an increased powder mass flow rate was tested to evaluate its influence on porosity at the best laser power level determined from the first set (Set 1). The samples realized by only varying the powder mass flow rate were the second set of samples to be analyzed (Set 2). Finally, the less porous sample was selected to evaluate the effect of a variation of the travel speed. This was the third and last set of samples (Set 3). Table 1 lists the values of process parameters analyzed in this work. Other process parameters were always kept constant during the production process. In detail, a hatching distance of 1 m m , a Z-increment of 0.5   m m and a stand-off distance of 7.5   m m were used. The deposition was performed using a raster deposition strategy with a rotation of 90° at each layer, and a contour path with the same process parameters as the core.
After the production, samples were removed from the substrate through the Wire-Electrical Discharge Machining (W-EDM) system by Suzhou Baoma (Suzhou, China). Subsequently, samples were split into two halves, left and right, and subjected to CT. The CT acquisition was performed on a Phoenix V|tome|x S240 by Baker Hughes (Houston, TX, USA). The parameter values set during CT acquisition, in combination with the dimensions of the split sample, allowed for a good balance between the sample and background gray values. This resulted in a voxel size of 22.5   μ m . The acquisition was performed by capturing 1500 images in a full 360° rotation. The process parameter values used during CT scans are listed in Table 2.
After the acquisition, the raw data were processed using Phoenix datos|x (release 2.8.0-RTM) reconstruction software to remove spurious information and compensate for possible sample and detector drifts. Then, the corrected data were introduced into the software VGSTUDIO MAX 3.5, developed by Volume Graphics (Heidelberg, Germany), in order to perform the porosity analysis. In detail, after the determination of the external surface from the CT histogram using an ISO value of 50%, which corresponds to the mean value between the background gray value and the material gray value, the VGDefX/Only threshold algorithm was used in order to detect the internal defects by comparing the gray values between two adjacent voxels. In the algorithm, the material definition was performed using the determined surface and setting an interpolation threshold factor of 1.05. The material definition was then used to define the maximum gray value of voids. Based on the voxel size, defects were considered to be present if their size exceeded 45 μ m , which is equivalent to two voxels.

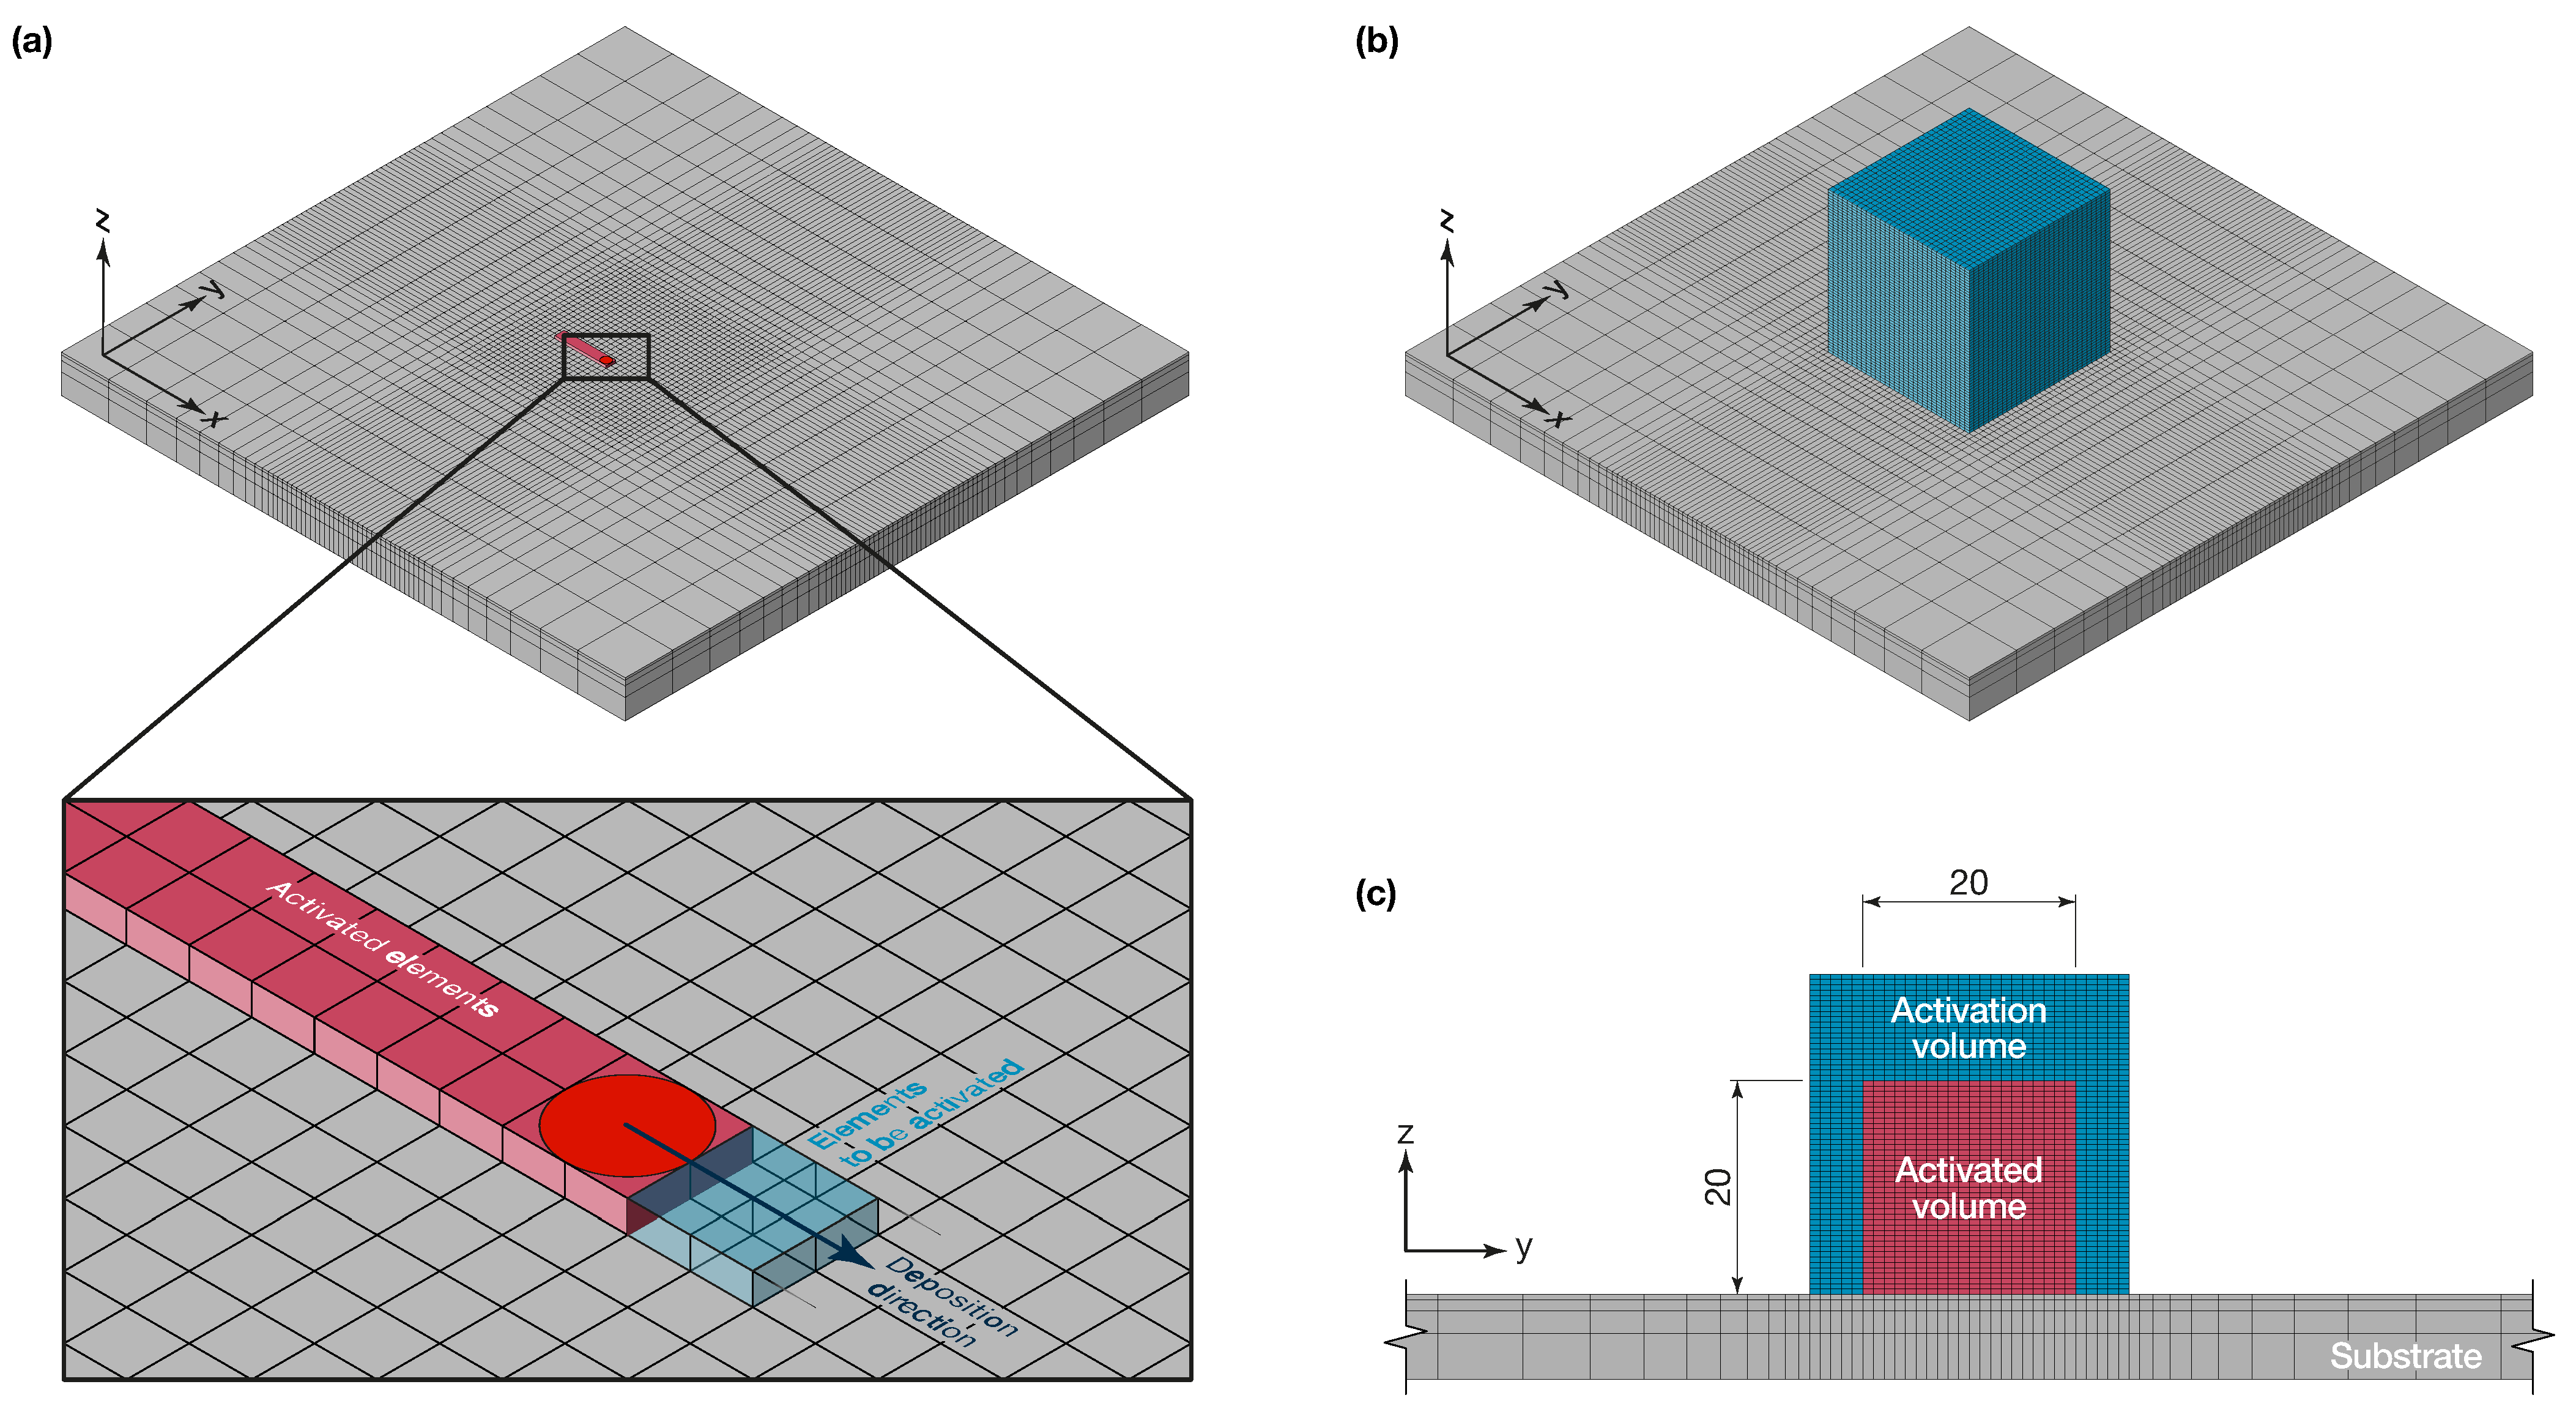
2.2. Three-Dimensional Numerical Thermal Model

In order to relate the porosity developed during the DED-LB/Powder process with the thermal history and temperature distribution in the samples, a thermal three-dimensional numerical model was used.
The model was implemented in Abaqus/Standard 2023 by Dassault Systèmes® and the geometry, illustrated in Figure 2, consisted of a substrate (gray geometry) with dimensions of 120 × 120 × 8 m m 3 and an activation volume (light blue geometry) with overall dimensions of 30 × 30 × 30 m m 3. The activation volume represents and simulates the overall material that can be deposited during the DED-LB/Powder process and is larger than the geometry of 10 × 20 × 20 m m 3 to be activated. At the beginning of the analysis, the elements of the activation volume are not included in the computational domain and an activation strategy is required. The activation strategy, which is used to progressively add elements of the activation volume into the computational domain simulating the addition of material during the process, is based on the UEPACTIVATIONVOL user subroutine. Essentially, the algorithm employs a time-dependent activation strategy, whereby it follows the movement of the laser beam (heat source) and progressively activates all elements within the area of the laser beam. The position of the heat source according to the deposition path was controlled as a function of time (and travel speed) in the specific user subroutine, DFLUX. A detailed explanation of the subroutine and how it works is reported in [37].
The geometry was discretized using a structured mesh with 20-node quadratic heat transfer elements (DC3D20 type) and consisted of a finer mesh in the activation volume and a coarser mesh in the substrate. The meshing strategy adopted was to define larger elements away from the deposition area, where the information is less important, and refine the element size closer to the deposition area. According to the approach widely used in the scientific literature, the minimum element size is equal to the radius of the laser beam in order to obtain at least 4 elements in the area of influence of the laser beam. The height of the elements was assumed to be equal to the layer height. This approach has shown good convergence in the literature [38]. The resulting mesh is shown in Figure 2. This discretization strategy allowed to obtain a good balance between the computational time and the resolution and the accuracy of the results. Specifically, the elements of the activation volume were 1 m m wide, 1 m m long and 0.5   m m high. In the substrate, starting from the deposition area, the mesh size was gradually increased and the maximum element dimensions were 15.4   m m in width, 15.4   m m long and 4.4   m m in height.
The transient temperature distribution T ( x , y , z , t ) was calculated by solving the general heat conduction equation without energy generation, as reported in Equation (1):
ρ c p T t = x k T x + y k T y + z k T z
where ρ is the material density, c p is the heat capacity and k is the thermal conductivity.
The boundary conditions allow the effect of the moving heat source and the phenomena of convection and radiation to be added in the numerical model. They are expressed by Equation (2):
k ( T · n ) | Π = I L ( x , y , z , t ) h c ( T T 0 ) ϵ r σ ( T 4 T 0 4 ) if Π Π L h c ( T T 0 ) ϵ r σ ( T 4 T 0 4 ) if Π Π L
where Π is the heat exchange surface, n is the normal vector to the surface Π , I L ( x , y , z , t ) is the intensity provided by the laser beam, h c is the specific heat coefficient, ϵ r is the surface emissivity, σ is the Stefan–Boltzmann constant and Π L is the surface intensified by the laser beam. Two different initial conditions were defined at the substrate and to the activation volume. At the beginning of the process at the time t = 0 , the substrate was at ambient temperature; hence, the initial condition for the elements of the substrate was defined by Equation (3):
T ( x , t , z , t = 0 ) = T 0
The initial condition for the elements that were introduced in the numerical domain at the time t = t a c t is defined by Equation (4). This condition considers the temperature increment of powder particles caused by energy absorption during the in-flight time.
T ( x , t , z , t = t a c t ) = T a c t

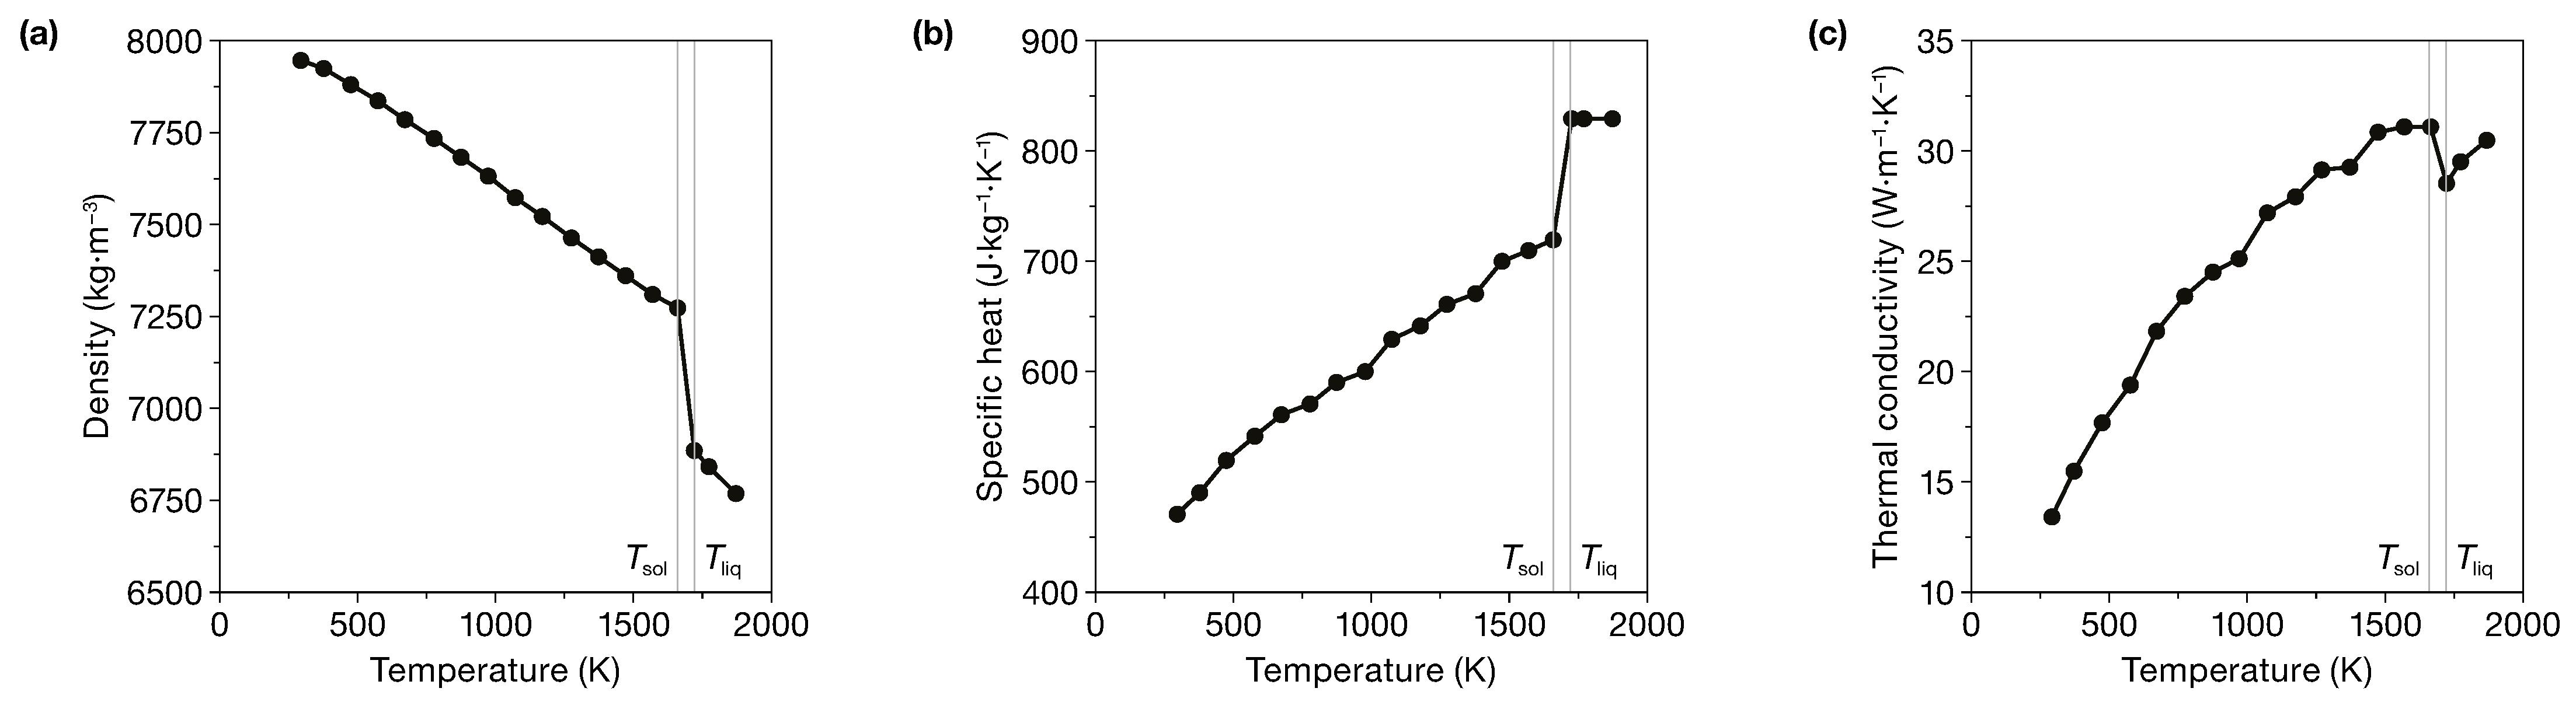
Assumptions and Material Properties

The mesoscale model previously developed by Piscopo et al. [37] was adapted to a macro-scale level in this work. In particular, some assumptions were introduced in order to limit the computational time required to obtain the desired results and these assumptions are strictly dependent on the macro-scale simulation approach.
Firstly, since the prediction of the melt pool and track dimensions are out of the scope of a macro-scale simulation, the track width was assumed to be equal to the laser beam diameter and the height equal to the Z-increment.
The reduction in laser power due to the absorption, scattering and reflection phenomena of powder mass flow rate and substrate was taken into account by a correction coefficient β of 0.4 [39] that was used to reduce the laser intensity. A detailed analysis of the mechanisms of absorption, scattering and reflectivity of powder particles and how they are influenced by process parameters can be found in [8,32]. Activation temperature, which simulates the temperature of powder particles just before they enter the melt pool is a critical factor in the micro-scale and mesoscale approaches since the initial thermal gradient highly influences the melt pool behavior and phenomena. In a macro-scale approach, in which the production of a whole component is analyzed, the thermal energy provided by the powder particles is negligible with respect to the energy provided by the laser beam during the process. For this reason, the activation temperature was set to be equal to the ambient temperature.
According to Gouge et al. [40], in the deposition area, turbulent flows are generated by the shielding gas; hence, a forced convection should be considered. In this work, it was assumed that the forced convection acted on the deposited material and on the upper surface of the substrate. On the lateral and the bottom surfaces of the substrate, a natural convection was considered. The values of forced and natural convection were set to 40 W · m −2· K −1 and 10 W −2· m · K −1, respectively [37]. The emissivity value was 0.6 [41].
Temperature-dependent material properties of AISI 316L were used. Figure 3 shows the values of density, specific heat and thermal conductivity as a function of the temperature [37]. In addition, the phase transformation was considered by including in the model the latent heat of fusion and the non-equilibrium temperatures.

3. Results

In the following, the results of the experimental campaign are discussed in terms of the porosity evaluated by CT analysis. The thermal behavior resulting from the numerical simulation allowed to correlate porosities and thermal history, and the results are presented in the final subsection.

3.1. Porosity Analysis and Effect of Process Parameters

For each sample, both halves were analyzed to provide repeatability data. Good repeatability was observed with an absolute deviation of ± 0.01 for the porosity. In the following, the results refer to the left half of each sample. The porosity results are summarized in Table 3. In general, it was observed that, among the process parameters, the laser power mostly affected the overall porosity value, with porosity decreasing from 0.26% to 0.07% as the laser power was increased from 500 W to 650 W . A further increase in laser power did not alter the porosity value; however, other mechanisms were observed, as detailed in Section 3.1.1. CT scans revealed that the increase in the powder mass flow rate from 4.5   g · min −1 to 6.0   g · min −1 worsened the porosity, which increased from 0.07% to 0.10%. With regard to the travel speed, it was noted that the porosity level was not significantly influenced by the value of travel speed and was on average 0.07% at P = 650   W and Q p = 4.5   g · min −1.

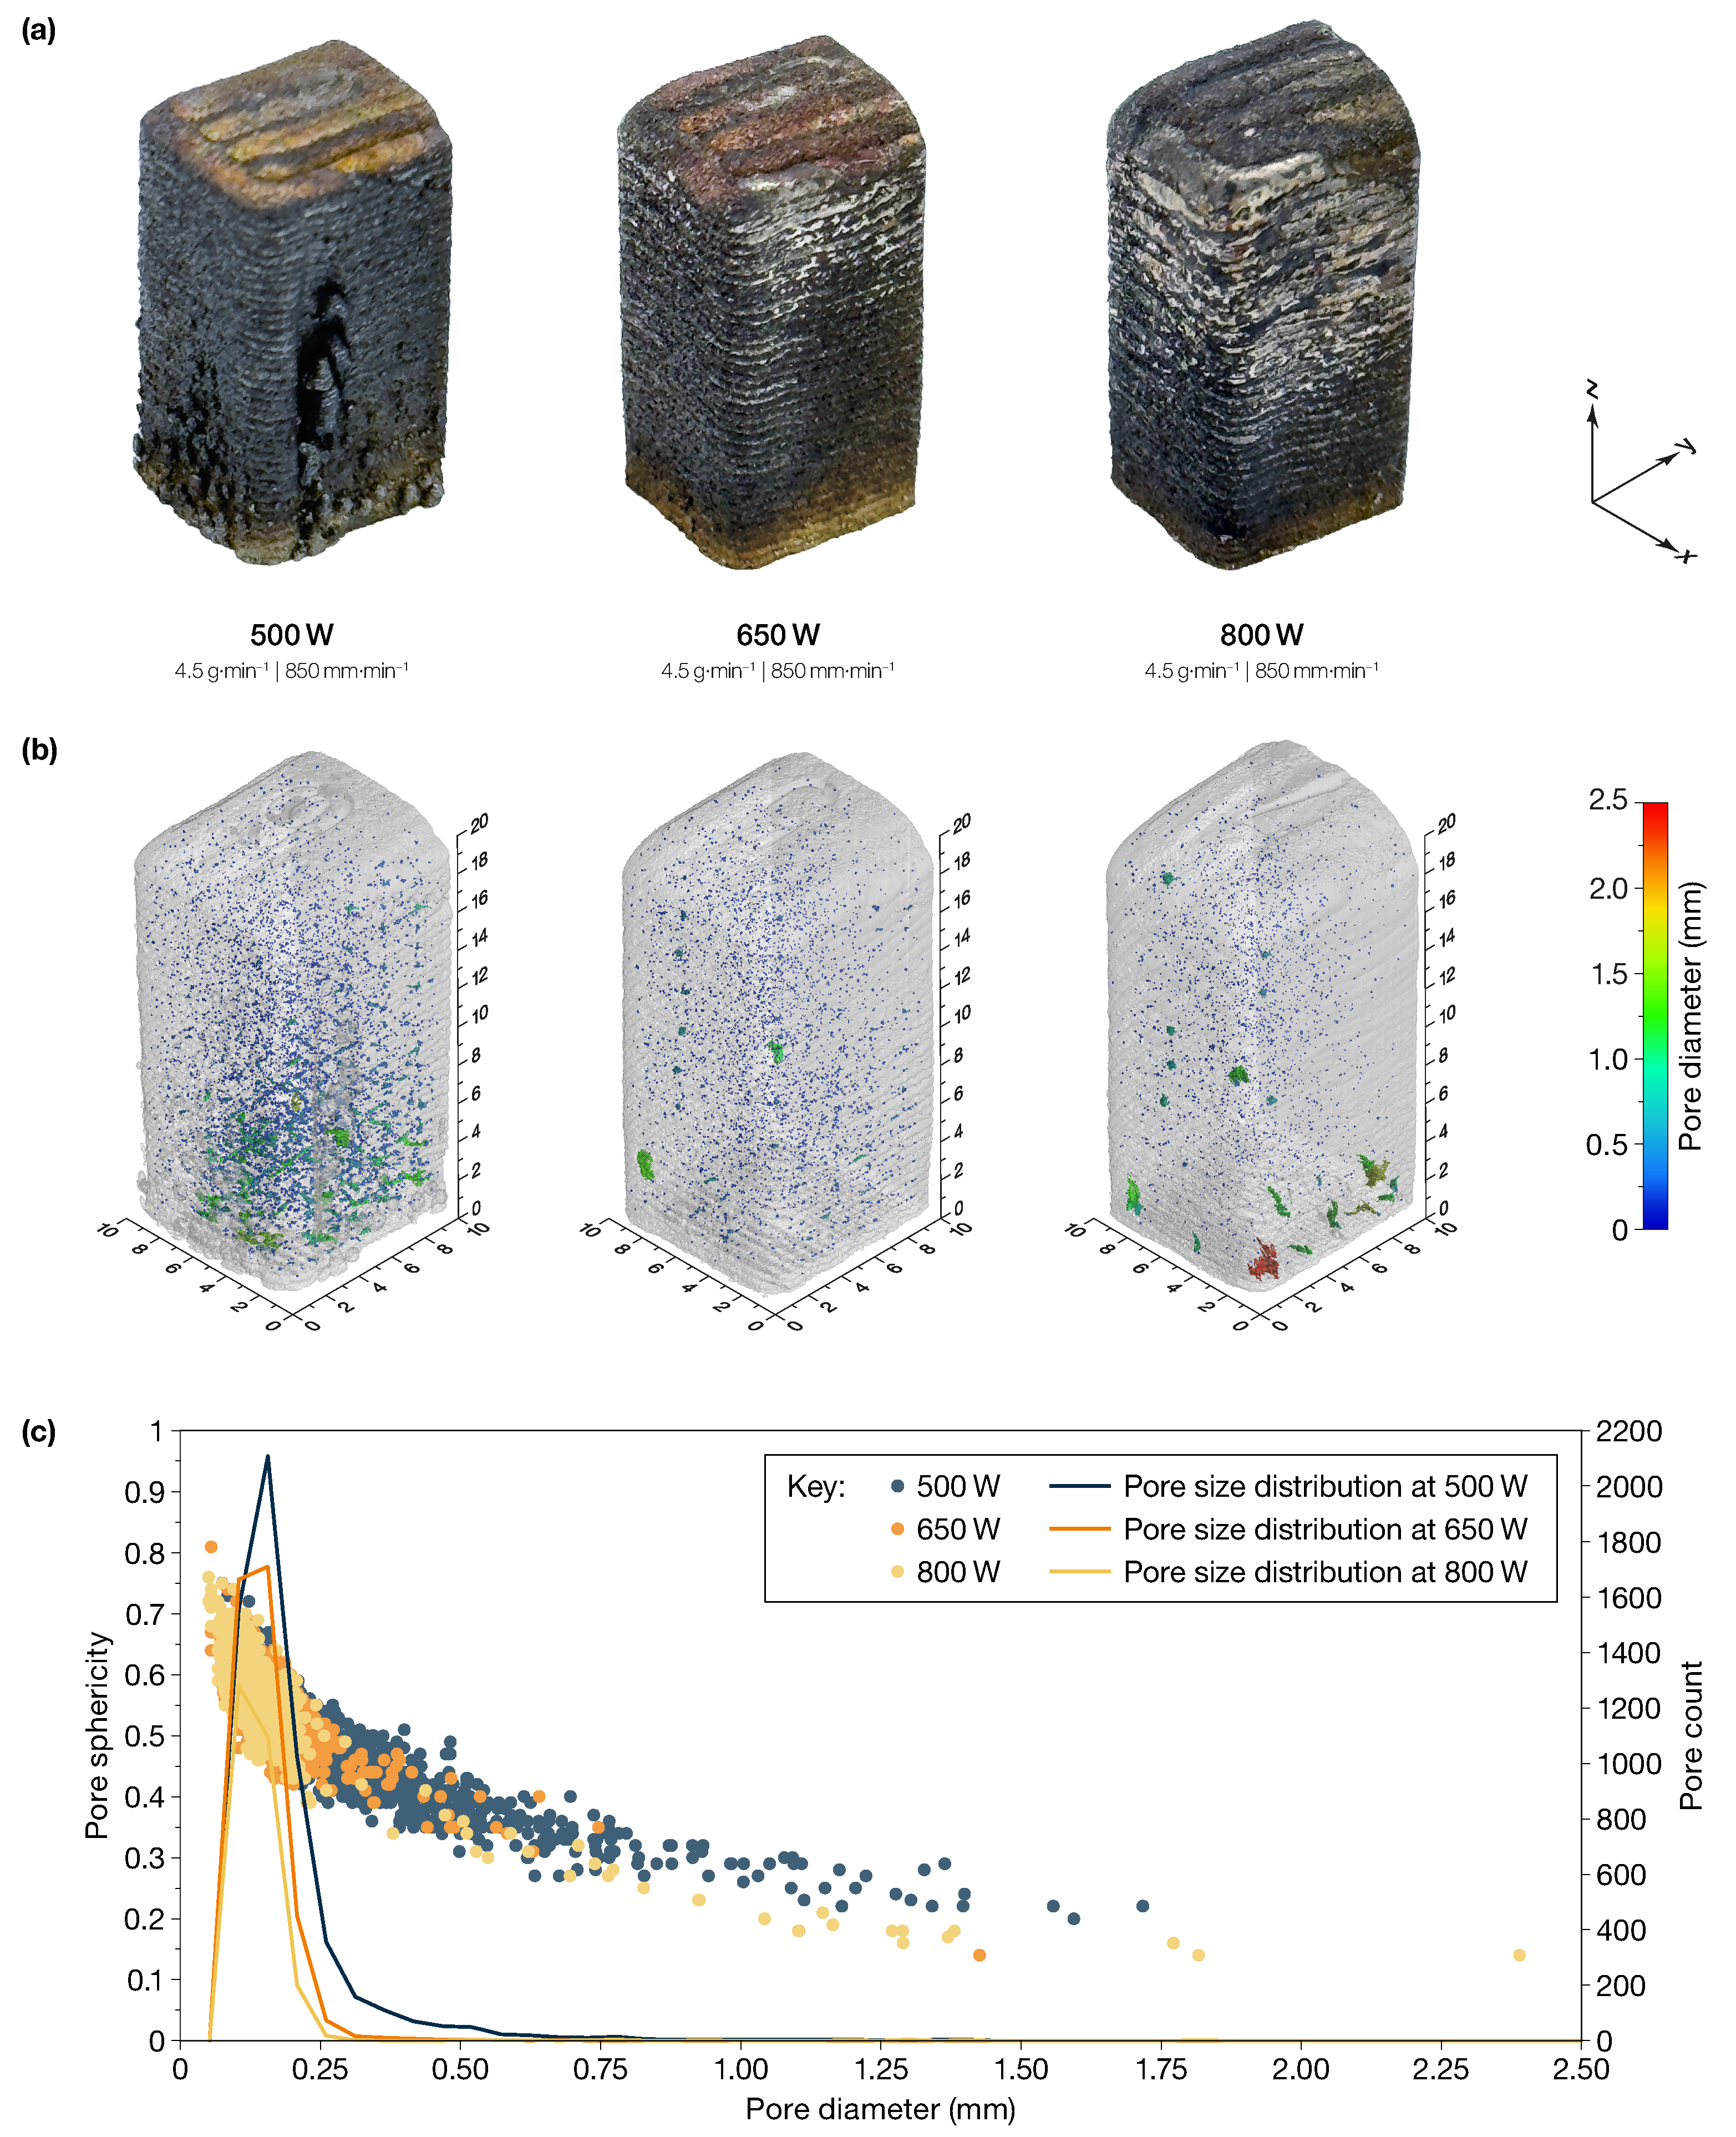
3.1.1. Effect of Laser Power

Figure 4a illustrates the samples produced with different levels of laser power. It was observed that although all the samples were successfully produced, the one realized with the lower laser power, that was 500 W , was characterized by an uneven deposition and powder agglomeration on the external surface, especially in the bottom area. These defects were attributed to the low energy density [43]. Energy density is defined as the energy delivered by the laser beam to the substrate or to the previously deposited layer per unit area along the travel speed direction. It is calculated by the ratio of the laser power to the product of travel speed and laser beam diameter, E = P / ( v · D ) . Increasing the laser power and/or reducing the travel speed results in a higher energy density. Typical deposition strategies include a contour path with a higher energy density than that used for core hatching, which allows for better surface quality. Contouring at a higher energy density also has the effect of reducing the surface defects that were identified in the experiments performed with the contour pass at the same energy density as the core. The porosity level measured in this sample was 0.26%, which is the highest measured in the experiments, as reported in Table 3. The degree of internal porosity indicates that 500 W of laser power, corresponding to 17.65   J · m m −2 of energy density at a travel speed of 850 m m · min −1, was inadequate to produce a fully dense sample. Gas-induced pores and lack-of-fusion pores were observed in the CT scan images. While the gas-induced pores were randomly distributed in the analyzed volume, the lack-of-fusion pores were concentrated in the bottom part of the samples. The lack-of-fusion pores are a direct consequence of low energy density and low substrate temperature. In fact, at the beginning of the process, the deposition is performed on a substrate at ambient temperature. The energy provided to the substrate locally results in an increase in the temperature above the melting point. The high temperature difference between the substrate and the melt pool causes a high rate of heat transfer, predominantly through conduction, which results in a loss of temperature in the melt pool. Under these conditions, the energy may be insufficient to fully melt the incoming powder and produce a stable melt pool.
As the deposition progresses, the temperature of the part gradually increases and the deposition is carried out on surfaces with a higher temperature compared to the initial temperature of the substrate. Therefore, the heat transfer rate becomes lower and the energy density required to generate a stable deposition progressively decreases. The use of a laser power of 500 W may have resulted in a too low energy density to produce proper and stable melt pool dimensions in the first layers of the deposition process. Consequently, a good overlap between two consecutive tracks or between two consecutive layers was not achieved. As the deposition progressed, the temperature of the part gradually increased, with the deposition carried out on surfaces with a higher temperature than that of the initial substrate. In this condition, the heat transfer rate decreased, and the energy density required to generate a stable deposition decreased as well. Thus, the lack of fusion pores gradually disappeared. In Appendix A, specific cross-section views of this sample are reported.
By increasing the laser power from 500 W to 650 W , surface defects were minimized and internal porosity was dramatically reduced to 0.07%. By analyzing the pore distribution, size and shape in Figure 4b,c, the reduction in porosity value was attributed to a reduction in both gas-induced and lack-of-fusion pores. By further increasing the laser power from 650 W to 800 W , the porosity level remained almost constant. However, when analyzing the pore characteristics in Figure 4b,c, it was observed that the number of pores smaller than 0.3   m m decreased slightly while the number of pores with a size greater than 1 m m increased. These voids were mainly elongated along the building direction and located in the bottom area. They were thus attributed to the formation of hot cracks due to high stresses [44]. The formation of these cracks is in agreement with the findings of Huang et al. [45] and Lim et al. [46], which showed the tendency of the stainless steel to form cracks, especially at the edge of the sample and when high laser power values are used [46]. A more detailed representation of these defects is reported in Appendix A.
These results highlighted that, within the range of process parameters used in this work, a laser power of 650 W should be preferred as a lower power level resulted in lack-of-fusion pores, while a higher laser power level resulted in the formation of hot cracks. This laser power value was thus selected for the next experiments.

3.1.2. Effect of Powder Mass Flow Rate

Figure 5a illustrates the second set of samples, produced with 650 W laser power, 850 m m · min −1 travel speed and different values of powder mass flow rate. No visible defects, such as powder agglomerates, were present on the external surfaces of the samples. From the pore characteristics shown in Figure 5b,c, it was observed that by increasing the powder mass flow rate from 4.5   g · min −1 to 6.0   g · min −1, the porosity increased from 0.07% to 0.10% (Table 3). In all the samples, both gas-induced pores—spherical and small—and lack-of-fusion pores—large and elongated—were detected. As a general consideration, it should be noted that by increasing the powder mass flow rate, a greater amount of delivered powder slightly reduces the useful power to melt the substrate as more energy is absorbed, reflected and scattered by the incoming powder particles. Hence, for a constant value of energy density, by increasing the powder mass flow rate, a lower amount of thermal energy is available at the substrate.
Gas-induced pores, which are intra-track porosities, were randomly distributed into the analyzed volume, and a slight reduction by increasing the powder mass flow rate was observed. The presence of gas-induced pores can be related to the Marangoni flows, which drive the gas pores toward the bottom of the melt pool, preventing them from escaping [47]. The reduction in gas-induced pores, from 4.5   g · min −1 to 6.0   g · min −1, was related to a decrease in melt pool depth as the powder mass flow rate increased [48] according to Jeon et al. [49]. On the other hand, lack-of-fusion pores, which typically occur between two adjacent tracks, increased slightly and were concentrated in the first layers. This phenomenon can be attributed to the reduction in thermal energy available at the substrate as the powder mass flow rate is increased, coupled with the lower temperature in the initial layers, where steady-state conditions have not yet been reached and the temperature is lower. This has resulted in improper melt pool formation, with the fed material not having enough energy to be completely melted. Consequently, lack-of-fusion pores developed and an increased number of pores was detected with a mean diameter bigger than 1 m m , as observed in Figure 5c.
Based on these results, it was possible to state that, within the range of process parameters used in this work, the use of the lower powder mass flow rate should be favored and, for this reason, the value of 4.5   g · min −1 was used in the subsequent analysis.

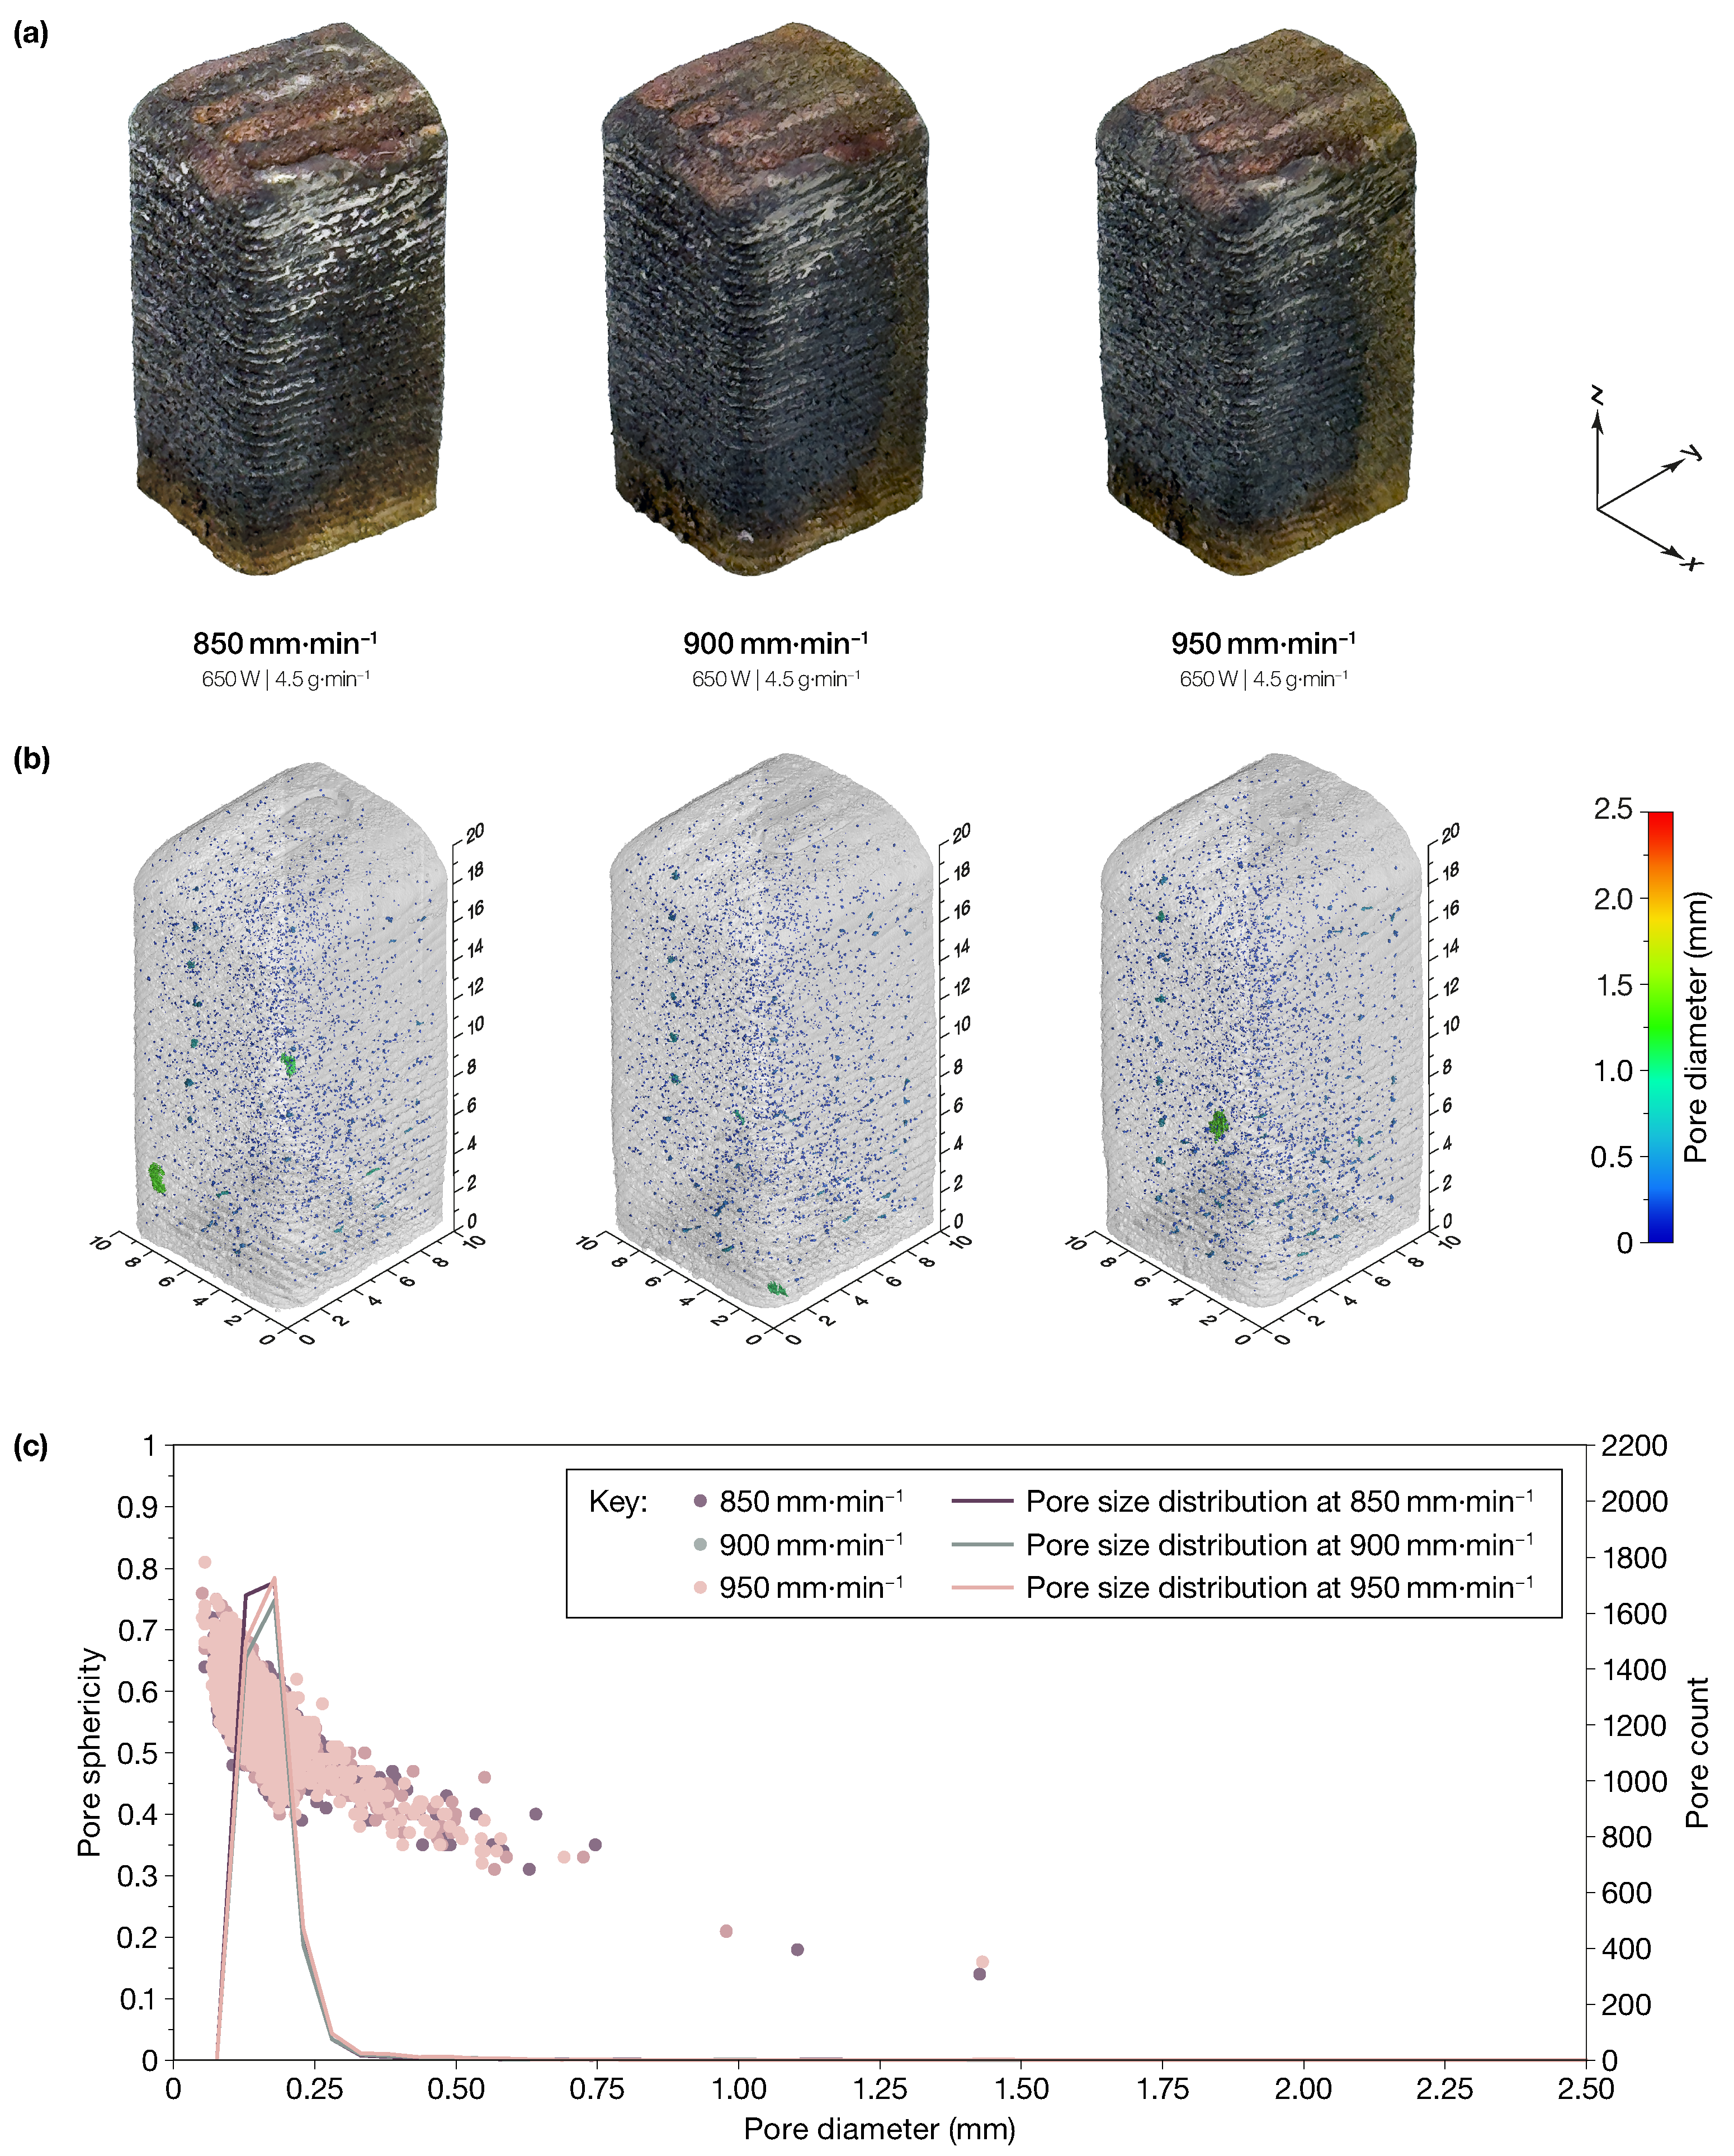
3.1.3. Effect of Travel Speed

Samples produced by setting P = 650   W , Q p = 4.5   g · min −1 and by varying the travel speed are shown in Figure 6a. No visible defects were observed on the external surfaces. The spatial distribution of the pores inside the samples is illustrated in Figure 6b. In general, the porosity level was not influenced by the travel speed value and remained almost constant with an average value of 0.07%. Specifically, both gas-induced pores and lack-of-fusion pores appeared to be insensitive to travel speed values. In fact, Figure 6c shows that the distribution of pore sphericity over their diameter was almost the same for all the samples.
Based on the obtained results, it was possible to observe that, within the range of process parameters analyzed in this work, the value of travel speed did not modify the porosity of the samples and consequently, the porosity cannot be used as a discriminator parameter for the selection of travel speed value.
However, it should be noted that process parameters, and hence also the value of travel speed, significantly influence the mechanical properties and the tolerances of the produced part [5,8,31]. For instance, in previous work, the authors showed that a lower travel speed value led to a lower value of residual stress [50], and Zhang et al. [51] observed that a lower value of travel speed corresponds to lower mechanical characteristics in terms of yield strength and elongation.

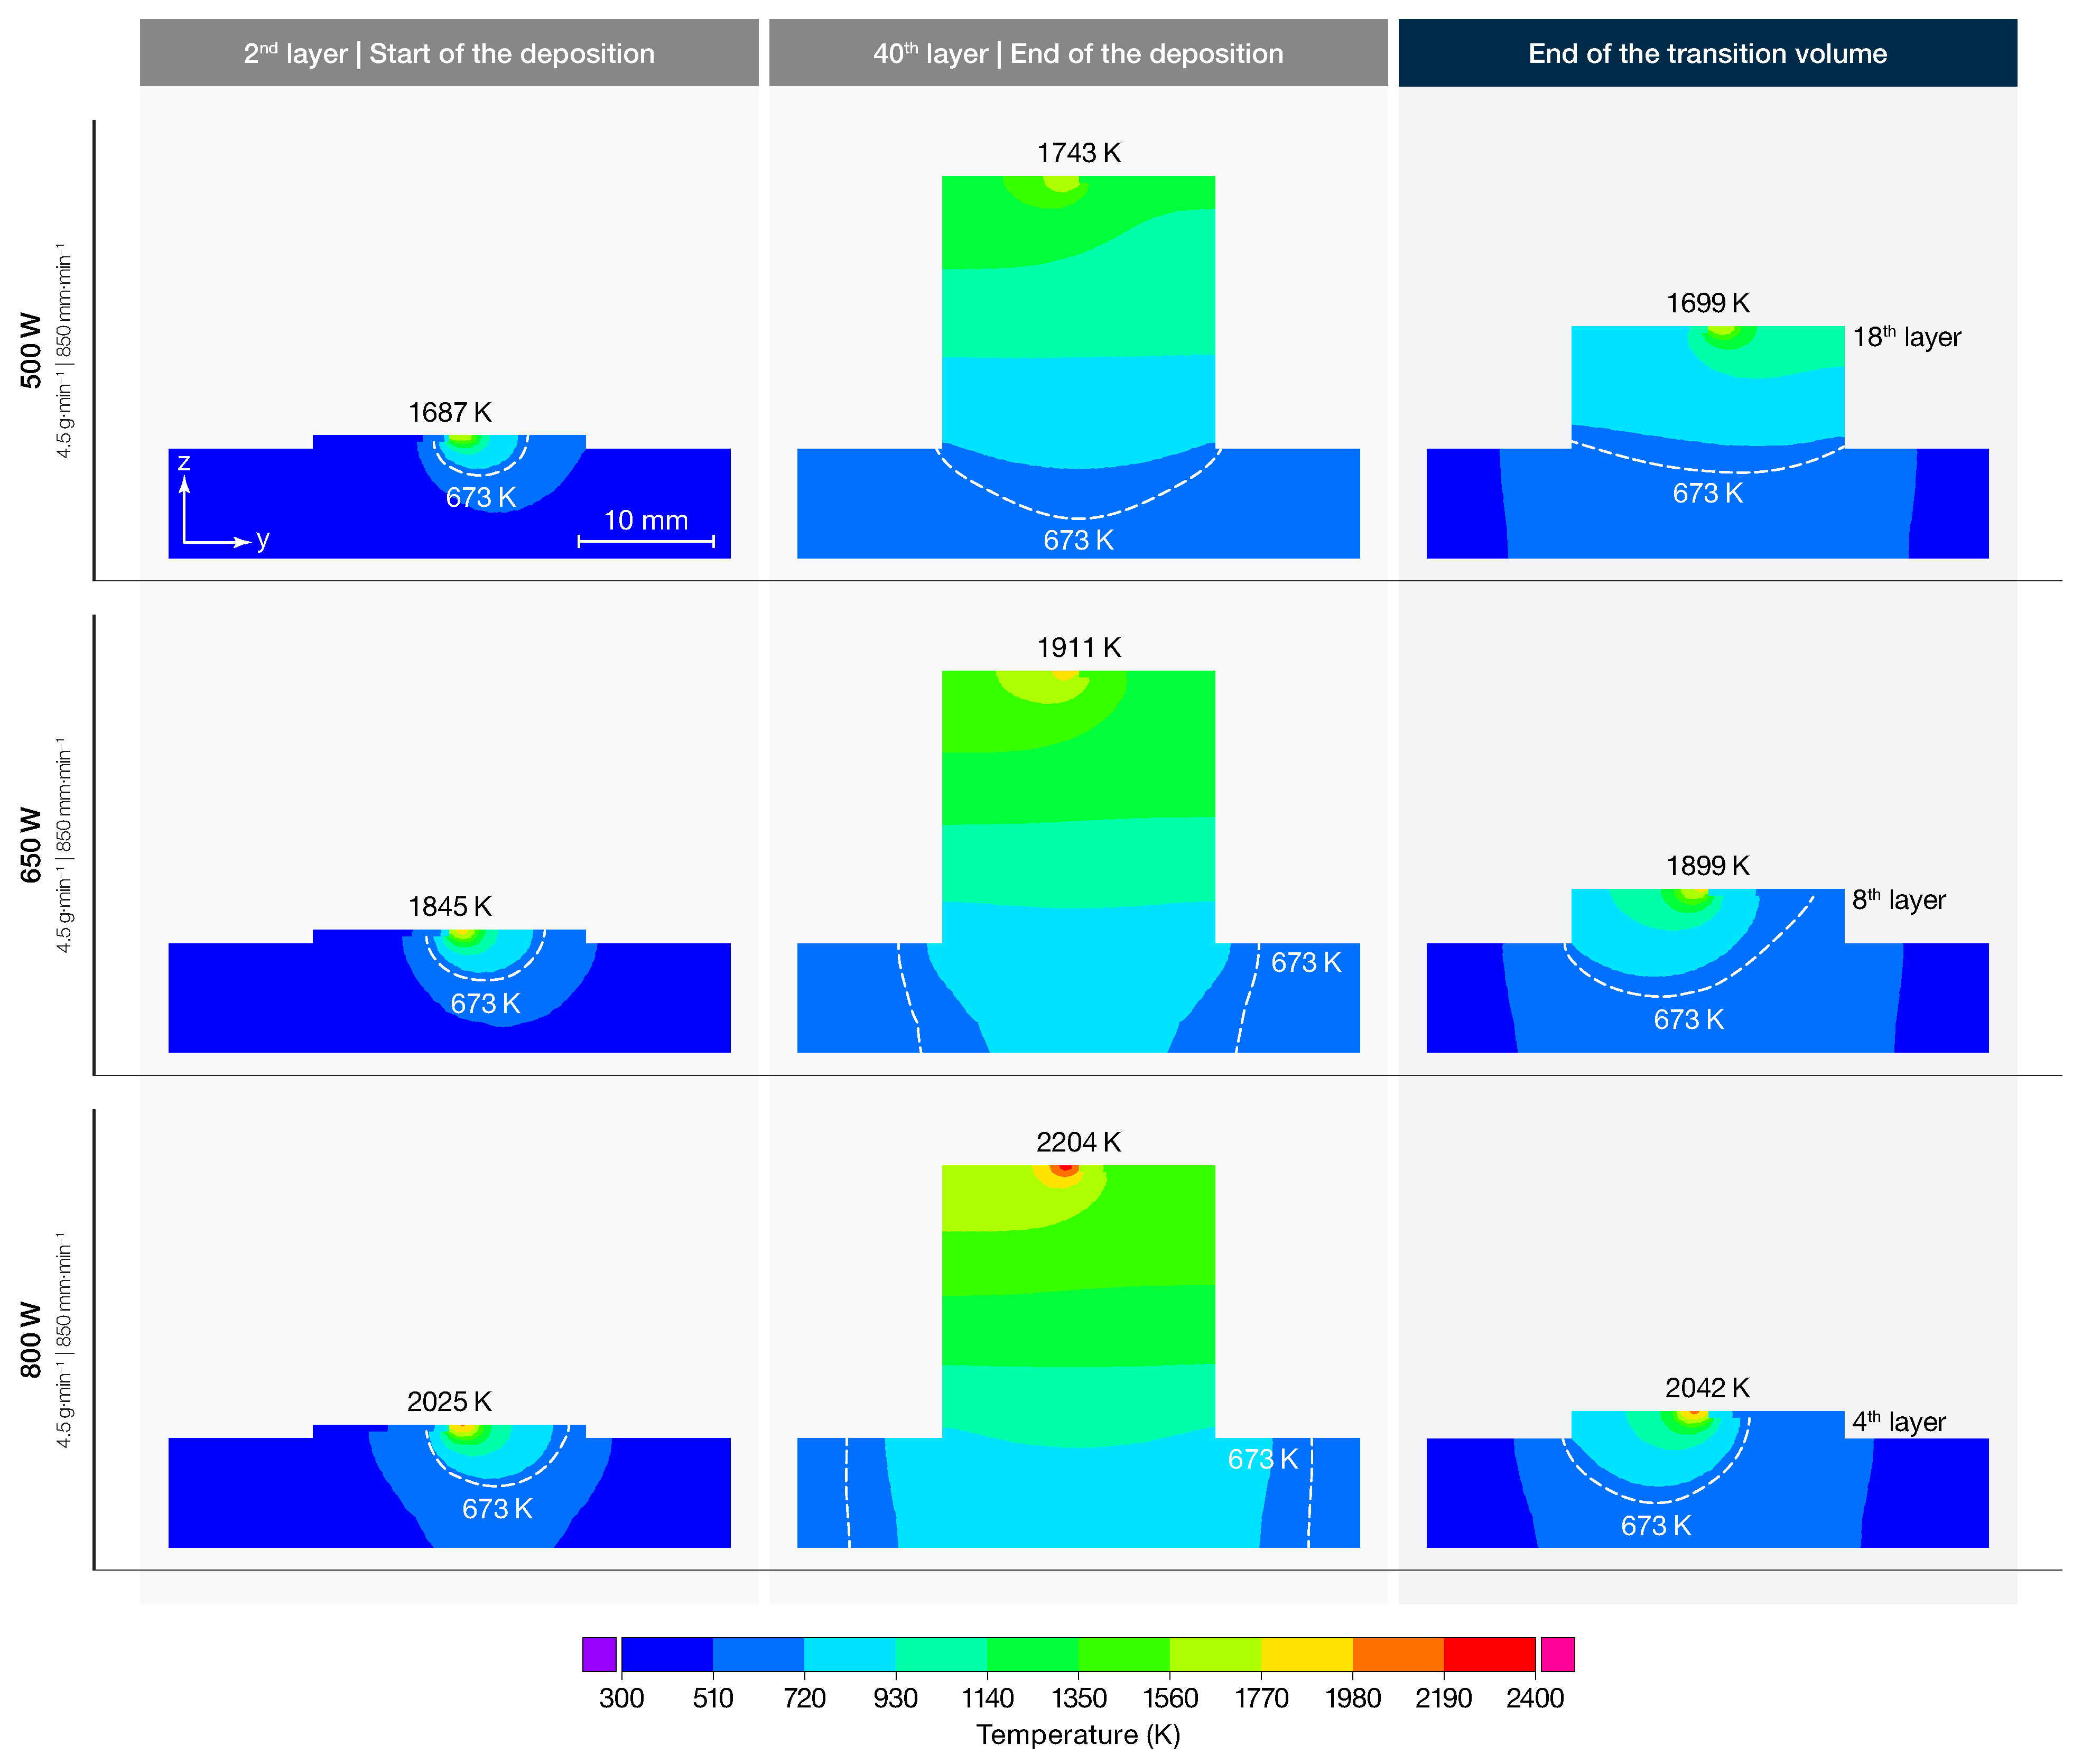
3.2. Temperature Distribution

In the following paragraphs, the results obtained from the numerical simulation are presented and correlated to the experimental results. The simulations were carried out using an HP Z4 G8 workstation equipped with two Intel®Xeon® Gold 5222 processors at 3.8   G Hz and 256 G B of RAM memory using four CPUs. The duration of the simulations was dependent on the process parameters used, with a maximum of 72 h .
From the experiments, it was observed that the laser power was the most relevant parameter on porosities. Therefore, the results of the thermal numerical simulation are presented for the conditions of Set 1. Figure 7 shows the temperature distribution in the middle cross-sections of the samples of Set 1 at different process times. The temperature distributions at the second layer and at the fortieth layer were selected for analysis. From the temperature maps, it can be observed that the laser power value significantly affected the temperature distribution within the deposited material. An increase in laser power by 150 W resulted in a 10% increase in the temperature peak and a faster accumulation of heat, which is typical of DED-LB/Powder processes. Furthermore, Figure 7 illustrates the affected area, as evidenced by the isothermal curve at 673 K (used as a reference since carbide precipitation does not occur at lower temperatures). This isothermal curve is represented by the white dashed line in Figure 7. It can be observed that the extent of the affected area and its evolution are influenced by both the laser power and the process time. The temperatures in the substrate are in general lower due to thermal inertia and convective phenomena on the top and bottom surfaces. This is evidenced by the significant temperature rise on the bottom surface when the laser power reaches 800 W .

Correlation between Temperature and Lack-of-Fusion Porosity

This work proposes a correlation between the presence of lack-of-fusion pores along the building direction and the temperature evolution obtained from a macroscopic numerical model. Two basic assumptions were considered. The first assumption is that a specific combination of process parameters leads to a particular temperature evolution in the produced part. The second assumption is that low energy densities, in conjunction with high heat transfer rates due to low deposit temperatures, may result in the formation of lack-of-fusion pores. This is because such conditions may lead to unstable melt pools and an improper overlap between consecutive tracks or layers.
From Figure 8a, it is possible to observe that in each sample of Set 1, three different volumes can be identified. The lowermost volume is characterized by a greater concentration of pores and elongated defects. This volume will hereafter be referred to as the lack-of-fusion pore volume. The porosity and defects decreased progressively in the transition volume. This was followed by an almost uniform porosity, which mainly comprised gas-induced pores. This volume is identified as the low porosity volume. A correlation between thermal history and porosity distribution can be inferred from the results of the thermal simulation. For ease of analysis, the sample produced with a laser power of 500 W , which is the most porous sample, is initially analyzed. In fact, in this sample, the three volumes can be easily identified. The lack-of-fusion pore volume is restricted to the first 10 layers, corresponding to a height of approximately 5 m m . Above a height of 9 m m , that is, from the 18th layer, the transition volume is exceeded. For comparison, the temperature as a function of time of the node at the center of the interface surface between the deposit and the substrate (node N in Figure 8b) was extracted from the FE thermal simulation output. This enabled the thermal history corresponding to the deposition of successive layers to be visualized. Considering the sample produced at 500 W , it can be observed that the temperature at the end of each thermal cycle (i.e., at the point when all tracks of a single layer have been deposited) is gradually increasing, exhibiting a more pronounced slope in the first layers, toward a steady-state condition that is almost reached at the 18th layer. The steady-state condition is reached when the temperature at the N node is almost constant. This implies that the energy introduced by the laser beam during the deposition growth process no longer significantly alters the temperature at the substrate just below the deposition. In the transition layers (11th to 18th layers), the thermal cycles are still discernible. However, the temperature rise after each thermal cycle is significantly reduced in comparison to the previous layers. In this processing condition, the temperatures reached after the deposition of the 10th and 18th layers, 675 K and 707 K , respectively, were extracted as defining the transition volume. Subsequently, for the other two samples produced at a higher laser power, the heights at which the same limit temperatures are reached at the end of the layer thermal cycle were selected for comparison with the thermal history using the computed tomography results. This was performed to verify whether the transition volume was effectively evidenced in the intermediate layers.
Considering the sample produced at 650 W of laser power, the analysis suggested that the transition volume included the fifth and eighth layers. This indication is verified by the experimental evidence, with lack-of-fusion pores present below this volume and absent above. Two large porosities were detected in the transition volume and were attributed to inter-track porosities between the contour and the core deposition tracks. Agreement between the temperature history and experimental results was also found in the sample produced at 800 W of laser power, with the transition volume including the third and fourth layers. However, the detected defects, aligned along the building direction, were recognized as cracks rather than lack-of-fusion pores.
The comparison conducted between the results of the numerical simulation, which identified the volume where lack-of-fusion pores/defects were likely to be present, and the experimental results from the CT analysis, allows for some conclusions to be drawn. The findings demonstrated that the numerical model was capable of predicting the presence of lack-of-fusion pores or defects along the building direction, with an average error of approximately 0.5   m m (one layer).

4. Conclusions

In this work, the effect on porosity of the main process parameters of the DED-LB/Powder process, namely laser power, powder mass flow rate and travel speed, was investigated. Results showed that all the samples were characterized by a porosity level lower than 0.26% and that this value was mainly influenced by laser power. In addition, two main pore types were identified: gas-induced pores, which were uniformly distributed in volume, and lack-of-fusion pores, which were mainly located in the bottom part of the samples. Then, a transient macro-scale numerical model was developed with the purpose of analyzing the thermal history. The main results can be summarized as follows:
  • Laser power had a higher influence on porosity. Increasing laser power has a beneficial effect in reducing porosity. However, excessive laser power could lead to the formation of cracks at the interface with the substrate.
  • The powder mass flow rate influenced both gas-induced pores and lack-of-fusion pores. In detail, the increase in powder mass flow rate led to a reduction in gas-induced pores and this was related to the reduction in melt pool depth. On the other hand, the lack-of-fusion pores increased due to a reduction in the melt pool width.
  • The travel speed had no significant influence on the porosity level, with deviations in line with process variability.
  • A correlation was found between the thermal history and the presence and position of lack-of-fusion pores. This suggests that the numerical model can be a useful tool to predict the presence of such porosity.

Author Contributions

Conceptualization, G.P.; methodology, A.S., G.P. and E.A.; validation, G.P.; formal analysis, A.S., G.P. and E.A.; investigation, G.P.; writing—original draft preparation, G.P.; writing—review and editing, A.S., E.A. and A.N.P.; visualization, A.S. and G.P.; supervision, A.S. and E.A. All authors have read and agreed to the published version of the manuscript.

Funding

This research received no external funding.

Data Availability Statement

The original contributions presented in the study are included in the article, further inquiries can be directed to the corresponding author.

Acknowledgments

The authors would like to acknowledge the Interdepartmental Centre for Integrated Additive Manufacturing (IAM@PoliTo) at the Politecnico di Torino, Torino, Italy, for the resources to perform the research activities.

Conflicts of Interest

The authors declare no conflicts of interest.

Abbreviations

The following abbreviations are used in this manuscript:
AMAdditive Manufacturing
DEDDirected Energy Deposition
PBFPowder Bed Fusion
DED-LB/PowderDirected Energy Deposition-Laser Beam/Powder
CTComputed Tomography
FEFinite Element

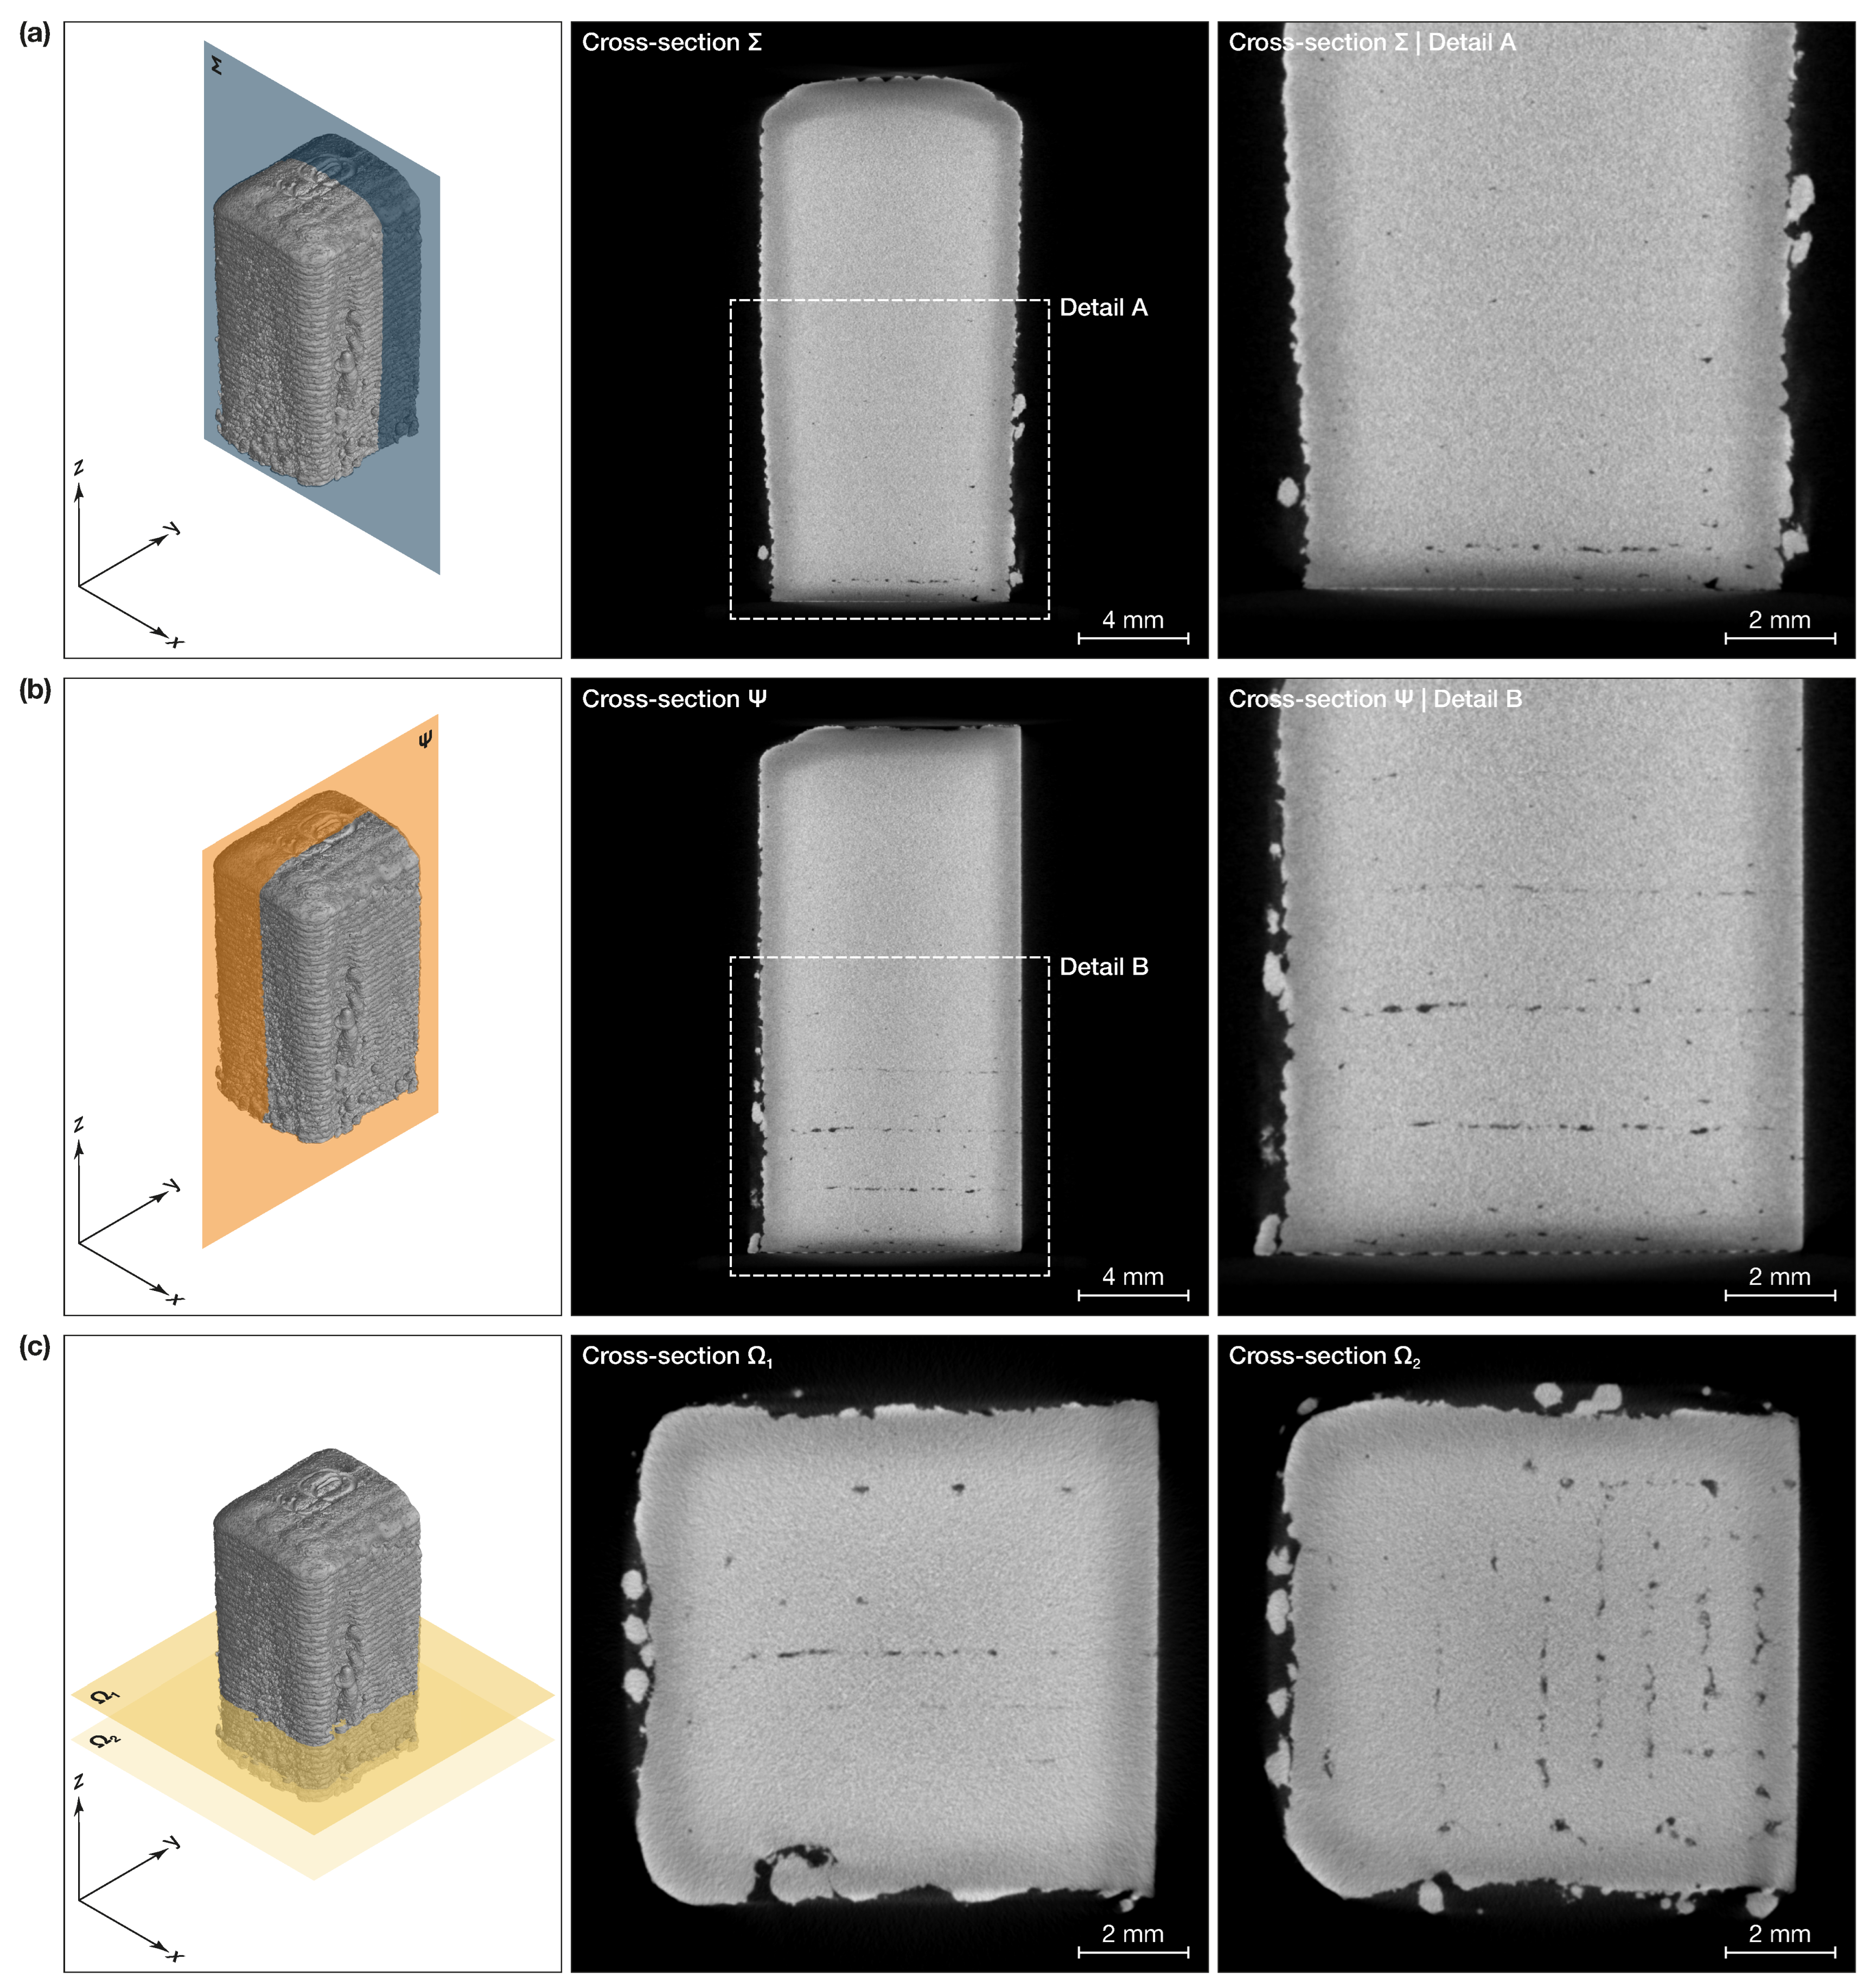
Appendix A. Detailed Cross-Section Views for Porosity Analysis

Figure A1 shows different cross-section views of the sample produced with a laser power of 500 W , a travel speed of 650 m m · min −1, and a powder mass flow rate of 4.5   g · min −1. Figure A1a,b show the cross-section perpendicular to the y-axis (cross-section Σ ) and the cross-section perpendicular to x-axis (cross-section Ψ ), respectively. From these sections, it was possible to verify that the lack-of-fusion pores were aligned with the deposition path.
Figure A1. Cross-section views in the sample produced with a laser power of P = 500   W , a travel speed of v = 850   m m · min −1 and a powder mass flow rate of Q p = 4.5   g · min −1. (a) Cross-section Σ perpendicular to the y-axis. (b) Cross-section Ψ perpendicular to the x-axis. (c) Cross-sections Ω 1 and Ω 2 perpendicular to the building direction (z-axis).
Jmmp 08 00129 g0a1
Figure A2 shows some relevant cross-section views obtained in the sample produced with a laser power of 800 W , a travel speed of 650 m m · min −1 and a powder mass flow rate of 4.5   g · min −1. In fact, the analysis reported in Section 3.1.1 revealed that some cracks developed in the bottom zone of this sample. Consequently, a further characterization of the defects was developed in order to understand the significance of these cracks.
Figure A2. Cross-section views of the sample produced with a laser power of P = 800   W , a travel speed of v = 850   m m · min −1 and a powder mass flow rate of Q p = 4.5   g · min −1. (a) Cross-section Σ perpendicular to the y-axis. (b) Cross-section Ψ perpendicular to the x-axis. (c) Cross-sections Ω 1 and Ω 2 perpendicular to the building direction (z-axis).
Jmmp 08 00129 g0a2
From Figure A2a,b, which represent two perpendicular cross-sections along the building direction of the sample, it was possible to observe that the cracks were elongated along the building direction and they developed starting from the WEDM cutting plane.
In Figure A1c, two cross-sections perpendicular to the building direction are presented. In the lowermost section (cross-section Ω 2 ), located at a height of about 1.2   m m , the large amount of lack-of-fusion pores is clearly visible. In the cross-section Ω 1 , obtained at a distance of 4.6   m m , the lack-of-fusion pores are significantly reduced. In addition, these sections highlight the irregularities on the lateral surface caused by the low energy density.
Figure A2c shows cross-section views perpendicular to the building direction obtained at two different heights of the sample. The cross-section Ω 2 obtained at a distance of about 1.3   m m from the building platform revealed that these cracks were present on almost all parts of the surface; however, as discussed in Section 3.1.1, they were more pronounced on the external areas of the sample. On the other hand, the cross-section Ω 1 obtained at a distance of 3.8   m m was free of defects.

References

  1. Praveena, B.; Lokesh, N.; Buradi, A.; Santhosh, N.; Praveena, B.L.; Vignesh, R. A comprehensive review of emerging additive manufacturing (3D printing technology): Methods, materials, applications, challenges, trends and future potential. Mater. Today Proc. 2022, 52, 1309–1313. [Google Scholar] [CrossRef]
  2. Bandyopadhyay, A.; Traxel, K.D.; Lang, M.; Juhasz, M.; Eliaz, N.; Bose, S. Alloy design via additive manufacturing: Advantages, challenges, applications and perspectives. Mater. Today 2022, 52, 207–224. [Google Scholar] [CrossRef]
  3. Ampower GmbH & Co. KG. Metal Additive Manufacturing Report. AMPOWER Report 2020. 2020. Available online: http://www.additive-manufacturing-report.com (accessed on 27 January 2021).
  4. Ahn, D.G. Directed Energy Deposition (DED) Process: State of the Art. Int. J. Precis. Eng. Manuf. Green Technol. 2021, 8, 703–742. [Google Scholar] [CrossRef]
  5. Izadi, M.; Farzaneh, A.; Mohammed, M.; Gibson, I.; Rolfe, B. A review of laser engineered net shaping (LENS) build and process parameters of metallic parts. Rapid Prototyp. J. 2020, 26, 1059–1078. [Google Scholar] [CrossRef]
  6. ASTM F3187-16; Standard Guide for Directed Energy Deposition of Metals. ASTM International: West Conshohocken, PA, USA, 2016. Available online: https://www.astm.org/f3187-16.html (accessed on 25 April 2024).
  7. Piscopo, G.; Iuliano, L. Current research and industrial application of laser powder directed energy deposition. Int. J. Adv. Manuf. Technol. 2022, 119, 6893–6917. [Google Scholar] [CrossRef]
  8. Piscopo, G.; Atzeni, E.; Saboori, A.; Salmi, A. An Overview of the Process Mechanisms in the Laser Powder Directed Energy Deposition. Appl. Sci. 2023, 13, 117. [Google Scholar] [CrossRef]
  9. Sohn, H.; Liu, P.; Yoon, H.; Yi, K.; Yang, L.; Kim, S. Real-time porosity reduction during metal directed energy deposition using a pulse laser. J. Mater. Sci. Technol. 2022, 116, 214–223. [Google Scholar] [CrossRef]
  10. Al-Maharma, A.Y.; Patil, S.P.; Markert, B. Effects of porosity on the mechanical properties of additively manufactured components: A critical review. Mater. Res. Express 2020, 7, 122001. [Google Scholar] [CrossRef]
  11. Tan, Z.E.; Pang, J.H.L.; Kaminski, J.; Pepin, H. Characterisation of porosity, density, and microstructure of directed energy deposited stainless steel AISI 316L. Addit. Manuf. 2019, 25, 286–296. [Google Scholar] [CrossRef]
  12. Svetlizky, D.; Das, M.; Zheng, B.; Vyatskikh, A.L.; Bose, S.; Bandyopadhyay, A.; Schoenung, J.M.; Lavernia, E.J.; Eliaz, N. Directed energy deposition (DED) additive manufacturing: Physical characteristics, defects, challenges and applications. Mater. Today 2021, 49, 271–295. [Google Scholar] [CrossRef]
  13. DebRoy, T.; Wei, H.L.; Zuback, J.S.; Mukherjee, T.; Elmer, J.W.; Milewski, J.O.; Beese, A.M.; Wilson-Heid, A.; De, A.; Zhang, W. Additive manufacturing of metallic components—Process, structure and properties. Prog. Mater. Sci. 2018, 92, 112–224. [Google Scholar] [CrossRef]
  14. Chen, L.; Yao, X.; Tan, C.; He, W.; Su, J.; Weng, F.; Chew, Y.; Ng, N.P.H.; Moon, S.K. In-situ crack and keyhole pore detection in laser directed energy deposition through acoustic signal and deep learning. Addit. Manuf. 2023, 69, 103547. [Google Scholar] [CrossRef]
  15. Poudel, A.; Yasin, M.S.; Ye, J.; Liu, J.; Vinel, A.; Shao, S.; Shamsaei, N. Feature-based volumetric defect classification in metal additive manufacturing. Nat. Commun. 2022, 13, 6369. [Google Scholar] [CrossRef] [PubMed]
  16. Wolff, S.J.; Wang, H.; Gould, B.; Parab, N.; Wu, Z.; Zhao, C.; Greco, A.; Sun, T. In situ X-ray imaging of pore formation mechanisms and dynamics in laser powder-blown directed energy deposition additive manufacturing. Int. J. Mach. Tools Manuf. 2021, 166, 103743. [Google Scholar] [CrossRef]
  17. Svetlizky, D.; Zheng, B.; Buta, T.; Zhou, Y.; Golan, O.; Breiman, U.; Haj-Ali, R.; Schoenung, J.M.; Lavernia, E.J.; Eliaz, N. Directed energy deposition of Al 5xxx alloy using Laser Engineered Net Shaping (LENS®). Mater. Des. 2020, 192, 108763. [Google Scholar] [CrossRef]
  18. Dass, A.; Moridi, A. State of the Art in Directed Energy Deposition: From Additive Manufacturing to Materials Design. Coatings 2019, 9, 418. [Google Scholar] [CrossRef]
  19. Susan, D.F.; Puskar, J.D.; Brooks, J.A.; Robino, C.V. Quantitative characterization of porosity in stainless steel LENS powders and deposits. Mater. Charact. 2006, 57, 36–43. [Google Scholar] [CrossRef]
  20. Ahsan, M.N.; Bradley, R.; Pinkerton, A.J. Microcomputed tomography analysis of intralayer porosity generation in laser direct metal deposition and its causes. J. Laser Appl. 2011, 23, 022009. [Google Scholar] [CrossRef]
  21. Rahman Rashid, R.A.; Abaspour, S.; Palanisamy, S.; Matthews, N.; Dargusch, M.S. Metallurgical and geometrical characterisation of the 316L stainless steel clad deposited on a mild steel substrate. Surf. Coat. Technol. 2017, 327, 174–184. [Google Scholar] [CrossRef]
  22. Pragana, J.P.; Pombinha, P.; Duarte, V.R.; Rodrigues, T.A.; Oliveira, J.P.; Bragança, I.M.; Santos, T.G.; Miranda, R.M.; Coutinho, L.; Silva, C.M. Influence of processing parameters on the density of 316L stainless steel parts manufactured through laser powder bed fusion. Proc. Inst. Mech. Eng. Part B J. Eng. Manuf. 2020, 234, 1246–1257. [Google Scholar] [CrossRef]
  23. Zheng, B.; Haley, J.C.; Yang, N.; Yee, J.; Terrassa, K.W.; Zhou, Y.; Lavernia, E.J.; Schoenung, J.M. On the evolution of microstructure and defect control in 316L SS components fabricated via directed energy deposition. Mater. Sci. Eng. A 2019, 764, 138243. [Google Scholar] [CrossRef]
  24. Mahamood, R.M.; Akinlabi, E.T. Modelling of Process Parameters Influence on Degree of Porosity in Laser Metal Deposition Process. In Transactions on Engineering Technologies; Springer: Dordrecht, The Netherlands, 2015; Book Section Chapter 3; pp. 31–42. [Google Scholar] [CrossRef]
  25. Amar, E.; Popov, V.; Sharma, V.M.; Andreev Batat, S.; Halperin, D.; Eliaz, N. Response Surface Methodology (RSM) Approach for Optimizing the Processing Parameters of 316L SS in Directed Energy Deposition. Materials 2023, 16, 7253. [Google Scholar] [CrossRef] [PubMed]
  26. Majumdar, J.D.; Pinkerton, A.; Liu, Z.; Manna, I.; Li, L. Microstructure characterisation and process optimization of laser assisted rapid fabrication of 316L stainless steel. Appl. Surf. Sci. 2005, 247, 320–327. [Google Scholar] [CrossRef]
  27. Lin, P.Y.; Shen, F.C.; Wu, K.T.; Hwang, S.J.; Lee, H.H. Process optimization for directed energy deposition of SS316L components. Int. J. Adv. Manuf. Technol. 2020, 111, 1387–1400. [Google Scholar] [CrossRef]
  28. Kartikeya Sarma, I.; Srinivas, V.; Kanmani Subbu, S. Effect of process parameters on micro hardness, bulk hardness and porosity of LENSTM deposited SS 316L alloy. Mater. Today Proc. 2021, 46, 2616–2624. [Google Scholar] [CrossRef]
  29. Savitha, U.; Reddy, G.J.; Venkataramana, A.; Gokhale, A.A.; Sundararaman, M. Effect of Process Parameters on Solidification Structure and Properties of Laser Deposited SS316 Alloy. Trans. Indian Inst. Met. 2015, 68, 1017–1022. [Google Scholar] [CrossRef]
  30. Thompson, S.M.; Bian, L.; Shamsaei, N.; Yadollahi, A. An overview of Direct Laser Deposition for additive manufacturing; Part I: Transport phenomena, modeling and diagnostics. Addit. Manuf. 2015, 8, 36–62. [Google Scholar] [CrossRef]
  31. Gibson, I.; Rosen, D.; Stucker, B. Directed Energy Deposition Processes, 2nd ed.; Springer: New York, NY, USA, 2015; Book Section Chapter 10; pp. 245–268. [Google Scholar] [CrossRef]
  32. Piscopo, G.; Atzeni, E.; Salmi, A.; Iuliano, L.; Gatto, A.; Marchiandi, G.; Balestrucci, A. Mesoscale modelling of laser powder-based directed energy deposition process. Procedia CIRP 2020, 88, 393–398. [Google Scholar] [CrossRef]
  33. Guan, X.; Zhao, Y.F. Modeling of the laser powder–based directed energy deposition process for additive manufacturing: A review. Int. J. Adv. Manuf. Technol. 2020, 107, 1959–1982. [Google Scholar] [CrossRef]
  34. Oerlikon Metco Inc. MetcoAdd 316L-A. Available online: https://mymetco-europe.oerlikon.com/it-it/product/metcoadd316la (accessed on 18 June 2024).
  35. Vincic, J. Laser Directed Energy Deposition for Processing and Repairing Steels. Ph.D. Thesis, Politecnico di Torino, Torino, Italy, 2024. [Google Scholar]
  36. Piscopo, G.; Salmi, A.; Atzeni, E. Investigation of dimensional and geometrical tolerances of laser powder directed energy deposition process. Precis. Eng. 2024, 85, 217–225. [Google Scholar] [CrossRef]
  37. Piscopo, G.; Atzeni, E.; Salmi, A. A Hybrid Modeling of the Physics-Driven Evolution of Material Addition and Track Generation in Laser Powder Directed Energy Deposition. Materials 2019, 12, 2819. [Google Scholar] [CrossRef] [PubMed]
  38. Buhl, J.; Israr, R.; Bambach, M. Modeling and convergence analysis of directed energy deposition simulations with hybrid implicit/explicit and implicit solutions. J. Mach. Eng. 2019, 19, 94–107. [Google Scholar] [CrossRef]
  39. Unocic, R.R.; DuPont, J.N. Process efficiency measurements in the laser engineered net shaping process. Metall. Mater. Trans. B 2004, 35, 143–152. [Google Scholar] [CrossRef]
  40. Gouge, M.F.; Heigel, J.C.; Michaleris, P.; Palmer, T.A. Modeling forced convection in the thermal simulation of laser cladding processes. Int. J. Adv. Manuf. Technol. 2015, 79, 307–320. [Google Scholar] [CrossRef]
  41. Touloukian, Y.; DeWitt, D. Thermophysical Properties of Matter—The TPRC Data Series. Volume 8. Thermal Radiative Properties—Nonmetallic Solids. (Reannouncement); Report AD-A-951942/2/XAB; Other: CNN: DSA900-73-C-2101 NTIS GRA English; Data Book; Thermophysical and Electronic Properties Information Center, Purdue University: Lafayette, IN, USA, 1972. [Google Scholar]
  42. Mills, K. Recommended Values of Thermophysical Properties for Selected Commercial Alloys; Woodhead Publishing: Sawston, UK; Elsevier: Cambridge, UK, 2002; p. 142. [Google Scholar]
  43. Yadav, S.; Paul, C.; Jinoop, A.; Rai, A.; Bindra, K. Laser Directed Energy Deposition based Additive Manufacturing of Copper: Process Development and Material Characterizations. J. Manuf. Process. 2020, 58, 984–997. [Google Scholar] [CrossRef]
  44. Zhang, W.; Xu, C.; Li, C.; Wu, S. Advances in Ultrasonic-Assisted Directed Energy Deposition (DED) for Metal Additive Manufacturing. Crystals 2024, 14, 114. [Google Scholar] [CrossRef]
  45. Huang, G.; Wei, K.; Deng, J.; Liu, M.; Zeng, X. High-power laser powder bed fusion of 316L stainless steel: Defects, microstructure, and mechanical properties. J. Manuf. Process. 2022, 83, 235–245. [Google Scholar] [CrossRef]
  46. Lim, S.H.; Ryou, K.; Jang, K.; Choi, W.S.; Lee, H.M.; Choi, P.P. Hot cracking behavior of additively manufactured D2 steel. Mater. Charact. 2021, 178, 111217. [Google Scholar] [CrossRef]
  47. Bennett, J.; Webster, S.; Byers, J.; Johnson, O.; Wolff, S.; Ehmann, K.; Cao, J. Powder-borne porosity in directed energy deposition. J. Manuf. Process. 2022, 80, 69–74. [Google Scholar] [CrossRef]
  48. Biyikli, M.; Karagoz, T.; Calli, M.; Muslim, T.; Ozalp, A.A.; Bayram, A. Single Track Geometry Prediction of Laser Metal Deposited 316L-Si Via Multi-Physics Modelling and Regression Analysis with Experimental Validation. Met. Mater. Int. 2022, 29, 807–820. [Google Scholar] [CrossRef]
  49. Jeon, I.; Liu, P.; Sohn, H. Real-time melt pool depth estimation and control during metal-directed energy deposition for porosity reduction. Int. J. Adv. Manuf. Technol. 2023. [Google Scholar] [CrossRef]
  50. Piscopo, G.; Salmi, A.; Atzeni, E. Influence of High-Productivity Process Parameters on the Surface Quality and Residual Stress State of AISI 316L Components Produced by Directed Energy Deposition. J. Mater. Eng. Perform. 2021, 30, 6691–6702. [Google Scholar] [CrossRef]
  51. Zhang, K.; Wang, S.; Liu, W.; Shang, X. Characterization of stainless steel parts by Laser Metal Deposition Shaping. Mater. Des. 2014, 55, 104–119. [Google Scholar] [CrossRef]
Figure 1. (a) Geometry and dimensions of the sample and the substrate. (b) Position of the two WEDM cuts (all dimensions are in m m ).
Jmmp 08 00129 g001
Figure 2. (a) Moving heat source and activation of the elements. (b) Mesh discretization of the model: the gray volume represents the substrate, the light blue volume represents the activation volume. (c) The activated volume, in light red, is included in the activation volume.
Jmmp 08 00129 g002
Figure 3. AISI 316L stainless steel temperature-dependent thermal material properties: (a) density, (b) specific heat and (c) thermal conductivity [42].
Jmmp 08 00129 g003
Figure 4. (a) Surface aspect, (b) pore distribution, and (c) pore diameter vs. sphericity of samples produced with different laser power values. The powder mass flow rate was Q p = 4.5   g · min −1 and the travel speed was v = 850   m m · min −1.
Jmmp 08 00129 g004
Figure 5. (a) Surface aspect, (b) pore distribution, and (c) pore diameter vs. sphericity of samples produced with different powder mass flow rate values. The laser power was P = 650   W and the travel speed was v = 850   m m · min −1.
Jmmp 08 00129 g005
Figure 6. (a) Surface aspect, (b) pore distribution and (c) pore diameter vs. sphericity of samples produced with different travel speed values. The laser power was P = 650   W and the powder mass flow rate was Q p = 4.5   g · min −1.
Jmmp 08 00129 g006
Figure 7. Temperature distribution obtained from a numerical FE model at different process times (second layer, fortieth layer and end of transition volume) in samples produced with different laser power: 500 W , 650 W and 800 W . The powder mass flow rate was Q p = 4.5   g · min −1 and the travel speed was v = 850   m m · min −1.
Jmmp 08 00129 g007
Figure 8. (a) Pore distribution (side view) and (b) temperature distribution extracted from FE numerical model in the node N of the samples of Set 1. The pink, purple and dark-green boxes indicate the transition volume in the sample produced at 500 W , 650 W and 800 W , respectively. The powder mass flow rate was Q p = 4.5   g · min −1 and the travel speed was v = 850   m m · min −1. (c) Detail of temperature distribution in the transition volume.
Jmmp 08 00129 g008
Table 1. Process parameters and their values (the bold values are the reference values).
Process ParameterValues
Laser power, P ( W )500–650–800
Powder mass flow rate, Q p ( g · min −1)4.5–6.0
Travel speed, v ( m m · min −1)850–900–950
Table 2. Setup and parameters values used during computed tomography acquisition.
CT ParameterValue
Voltage, V ( k V )200
Current, I ( μ A )110
Filter 0.5   m m of copper
Timing ( m s )333
Averaging3
Skip frames2
Table 3. Process parameters (the bold values are the reference values) and resulting porosities.
DepositsP ( W ) Q p ( g · min −1)v ( m m · min −1)Porosity (%)
Set 15004.58500.26
650 *0.07
8000.07
Set 2650 *4.5 *8500.07
6.00.10
Set 3650 *4.5 *850 *0.07
9000.07
9500.08
Note: * best parameter value in the set.
Disclaimer/Publisher’s Note: The statements, opinions and data contained in all publications are solely those of the individual author(s) and contributor(s) and not of MDPI and/or the editor(s). MDPI and/or the editor(s) disclaim responsibility for any injury to people or property resulting from any ideas, methods, instructions or products referred to in the content.

