Article

Digital Image Correlation for Elastic Strain Evaluation during Focused Ion Beam Ring-Core Milling

by
Fatih Uzun
1,* and
Alexander M. Korsunsky
2
1
Department of Engineering Science, University of Oxford, Oxford OX1 3PJ, UK
2
Trinity College, University of Oxford, Oxford OX1 3PJ, UK
*
Author to whom correspondence should be addressed.
J. Manuf. Mater. Process. 2024, 8(4), 144; https://doi.org/10.3390/jmmp8040144
Submission received: 21 May 2024 / Revised: 25 June 2024 / Accepted: 3 July 2024 / Published: 4 July 2024

Abstract

:
This paper details the utilization of the focused ion beam digital image correlation (FIB-DIC) technique for measuring in-plane displacements and the employment of the height digital image correlation (hDIC) technique as a two-step DIC method for determining displacements without an out-of-plane component within the region of interest. Consideration is given to the microscopy data’s measurement scale and resolution to confirm the capability of both techniques to conduct micro-scale correlations with nano-scale sensitivity, making them suitable for investigating the residual elastic strains formed due to processing. The sequential correlation procedure of the FIB-DIC technique has been optimized to balance accuracy and performance for correlating sequential scanning electron microscope (SEM) images. Conversely, the hDIC technique prioritizes the accurate correlation of SEM images directly with the reference state without a sequential procedure, offering optimal computational performance through advanced parallel computing tools, particularly suited for correlating profilometry data related to large-scale displacements. In this study, the algorithm of the hDIC technique is applied as a two-step DIC to evaluate the elastic strain relaxation on the surface of a ring core drilled using a focused ion beam. Both techniques are utilized to correlate the same SEM images collected during the monitoring of the ring drilling process. A comparison of the correlation results of both techniques is undertaken to quantify the near-surface residual elastic strains, with an analysis conducted to discern the accuracy of the hDIC algorithm. Furthermore, the distinctions between the two techniques are delineated and discussed.

1. Introduction

Surface processing techniques [1] are widely employed in the manufacturing of metallic parts to achieve desired functionalities like improved wear resistance [2,3,4], fatigue strength [5,6,7] and corrosion protection [8,9,10,11]. However, these processes can introduce residual elastic strains [12,13] within the material’s microstructure. Quantifying these residual strains is crucial for understanding their impact on a part’s performance. Residual elastic strains can influence material properties such as hardness, ductility and fracture [14,15,16] behavior. Accurately quantifying these strains allows engineers to optimize the parameters of processes like welding [17], casting [18,19] and machining [20] using surface processing [21,22,23], predict material performance under service loads [24,25] and design more durable metallic parts.
Digital image correlation (DIC) has emerged as a powerful technique for analyzing microscopic strain and deformation in various materials, leveraging high-resolution imaging modalities. Previous studies have advanced DIC methodologies using different types of microscopy data to enhance accuracy and application scope. One study developed a microscopic strain mapping technique utilizing scanning electron microscopy (SEM) images, effectively capturing local strain distributions via surface topography features such as slip traces, validated through in situ deformation experiments on an aluminum alloy [26]. Another approach combined high-resolution transmission electron microscopy with DIC, achieving nano-scale deformation analysis with high displacement detection sensitivity, particularly useful for studying amorphous silicon [27]. High-spatial resolution DIC was also integrated with electron backscatter diffraction to investigate crack initiation mechanisms in nickel-based superalloys under controlled bending tests, providing insights into strain distributions and micro-crack nucleation [28]. Furthermore, optical coherence elastography enhanced with DIC algorithms demonstrated the precise mapping of soft tissue properties, distinguishing between different tissue layers and structural components [29]. In the realm of nano-scale wear analysis, a novel combination of atomic force microscopy and DIC revealed the initiation and progression of nano-wear in gold coatings, quantified through changes in the correlation coefficient [30]. Integrating confocal microscopy with 2D-DIC also facilitated high-accuracy displacement measurements on microscopically smooth surfaces, proving effective in tensile and hardness testing scenarios [31]. These advancements underscore the versatility and accuracy of DIC in microscopic and nano-scale deformation analysis across diverse materials and applications.
The combined use of focused ion beam (FIB) milling [32], SEM imaging and DIC allows for the measurement of residual stresses [33] in gauge volumes less than one cubic micron. Among four common milling techniques, which are hole drilling [34], surface slitting [35], H-bar milling [36] and ring-core milling [37], ring-core milling allows for depth-resolved residual stress analysis [36]. Micro-scale ring-core FIB milling combined with digital image correlation (FIB-DIC) was introduced by Korsunsky et al. [38] at the Microscopy-based Laboratory for Experimental Mechanics (MBLEM) at the University of Oxford to determine gradual strain relief as a result of FIB ring drilling. The FIB-DIC technique was optimized to determine averaged residual stresses within ring-core volume and has been successfully used for residual stress evaluation in various applications, such as PVD coatings [38], thin films and additively manufactured [39,40,41] and shot-peened nickel superalloys [42], and validated by X-ray diffraction [43,44] measurements.
Height digital image correlation (hDIC) was introduced as an alternative to the conventional DIC technique for the identification of triaxial displacements [45]. This technique correlates out-of-plane surface height data and its variation tracked during the deformation. Agreement was found between hDIC analysis during a mechanical test and the results of a tensile test [45]. The closeness of the hDIC technique strain evaluation with X-ray diffraction measurements after three-point bending [46] confirmed this technique’s ability to perform highly reliable correlations. The hDIC technique was optimized for the achievement of accurate correlation, and the GPU implementation of the hDIC technique allowed for the identification of discontinuous displacements [47]. This modified form of the hDIC algorithm allowed for an accurate determination of discontinuous edges around cracks and fracture zones without the requirement for further smoothing steps.
The application of the hDIC as a two-step DIC technique in this study demonstrates a significant advancement in tracking strain relaxation during the nano-scale ring-core focused ion beam (FIB) milling of the Cu/W multilayer Si substrate [48]. Leveraging scanning electron microscopy (SEM) images acquired during this process, the hDIC as two-step DIC algorithm offers a novel approach to analyzing strain relaxation compared to the conventional FIB-DIC technique. The comparison between the results obtained from the two techniques provides valuable insights into the efficacy of the two-step DIC in accurately characterizing elastic strain relaxation phenomena. Specifically, the improvements afforded by this approach are elucidated through comprehensive assessments of elastic strain relaxation patterns and the associated relative error ratios, showcasing its enhanced accuracy and reliability in evaluating residual stresses induced by surface processing. This comparative analysis not only highlights the improvements brought about by the two-step DIC but also underscores its potential to advance the understanding of material behavior under various processing conditions, thus contributing to the optimization of surface engineering strategies for enhanced performance and durability.

2. FIB-DIC Technique

The FIB-DIC technique for the evaluation of residual stresses is based on the principle of the introduction of traction-free surfaces at the location of interest and the observation of elastic strain change in the regions around the milling zone using SEM imaging. Elastic strain changes are quantified after the correlation of SEM images. This process is able to reach nano-scale precision related to the FIB milling size, and the DIC analysis of SEM images allows for quantification with sub-micron accuracy. The main advantages of the FIB-DIC technique when compared to other nano-micron-scale residual stress analysis techniques are the ability to perform absolute residual stress evaluation and applicability to amorphous or polymeric substrates [49,50]. As it was stated in the review on the FIB-DIC technique by Lunt and Korsunsky [36], improvements in technical capabilities and reductions in cost eased access to SEM, and FIB microscopy systems made the FIB-DIC technique residual stress quantification a cost-effective and highly competitive technique when compared to synchrotron or other techniques that require expensive facilities.
FIB has the capability of the milling of different ranges of geometries that have advantages and limitations related to the stress state of interest. Current applications of FIB milling-based DIC techniques cover four techniques which are surface slotting, H-bar milling, hole drilling and ring-core milling. Kang et al. [51] introduced FIB micro surface slotting for the in situ measurement of the residual stress in thin films, and the applications of this technique were expanded to depth-resolved [52] and spatially resolved analysis [53,54]. H-bar FIB milling was originally proposed by Krottenthaler et al. [37] for one-dimensional stress analysis, and Sebastini et al. [55] extended this technique to two dimensions. G. Shajer miniaturized macro-scale blind hole drilling techniques, and Sabate et al. used FIB micro hole drilling for the purpose of residual stress measurement based on that approach. Micro-scale ring-core FIB milling combined with DIC to obtain full elastic strain relief using an annular milling pattern, which allows for depth-resolved analysis [56], was found by Korsunsky et al. [38]. The isotropic milling geometry of the ring-core provides complete two-dimensional in-plane elastic strain relief that is predominantly uniform across the center of the core and can be effectively averaged for the purpose of residual stress quantification.
The FIB-DIC technique is based on incremental ring drilling [55], SEM imaging and DIC analysis. A total of 10 to 100 images are collected during the incremental ring drilling process and image averaging, or slow scanning is practiced while recording SEM images [36] in order to reduce the influence of noise. The DIC analysis of the FIB-DIC technique uses the subset DIC approach that allows for the representation of the displacement field by a vector shift between the reference and the target conditions calculated by 2D normalized cross-correlation whose formulation can be found in the pre-mentioned papers [36]. The DIC analysis of this technique is able to reach an elastic strain resolution of 10-4 or better by combining four approaches. The first improvement is the estimation of the peak position after fitting the cross-correlation surface to a polynomial function subsequent to the determination of the vector shift at the integer-pixel level. Lunt and Korsunsky [36] reported that two-dimensional polynomial fitting is performed on a 3 × 3 window of pixels of a cross-correlation surface by locating the center of the window at the peak position. In the case of micro-scale ring-core FIB milling, DIC subset averaging by calculating the linear relationship between displacement measurements is the second improvement for obtaining high elastic strain resolution. The third improvement is achieved by high-magnification SEM imaging with a minimum resolution of 1024 × 1024 pixels that have a nominal size of 5 nm or less. The final improvement is creating SEM images with high contrast to ensure that the cross-correlation peak is sharp.
The analysis of error estimation and propagation is a major step of the FIB-DIC technique. The error estimation begins with the DIC analysis because the precision and accuracy of the correlation process are affected by the image noise, beam focus and contrast. After the DIC error estimation, poorly tracked DIC subsets [57] are removed through a five-step process that consists of correlation coefficient thresholding, peak position standard deviation thresholding, subsets moving relative to neighbors, outliers to expected displacement fields and manual subset removal. The elastic strain error estimation is the next stage of the analysis of error estimation and propagation that is based on the assumption that the elastic strain relief observed on the surface of the core has to be uniform with a linear variation corresponding to the displacement of DIC subsets. The incremental milling process allows for the determination of the elastic strain relief as a function of depth [38] that was first investigated after finite element simulations [38]. The resulting elastic strain relief curves can be used to estimate elastic strain relief and standard deviation in different directions at each section of the depth including the infinite depth. Finally, the non-equi-biaxial principal stresses on the surface and their independent standard deviations are calculated using Young’s modulus and Poisson’s ratio based on the assumption that the gauge volume is homogeneous and isotropic [38]. The details of this process and formulations of the numerical methods for the necessary calculations can be found in previous studies [58].

3. hDIC Technique

The hDIC technique [45] was utilized for determining discontinuous displacements around cracks [47]. The algorithm for this process comprises two stages: integer-pixel-level cross-correlation followed by sub-pixel-level correlation. The GPU implementation of this technique has facilitated the generation of sharply visible representations of discontinuous displacements [47]. This technique relies on correlating pixel intensities from height data acquired from the surface under reference and target conditions using a 3D optical profilometer instrument. In this study, the same hDIC algorithm was applied as two-step DIC to correlate pixel intensities from SEM images under reference and target conditions, without any smoothing process, to assess the quality of correlation achieved by the hDIC technique.
The integer-pixel-level cross-correlation stage determines the matching pixels of reference and target conditions using the subsets with dimensions of ( 2 N + 1 ) × ( 2 N + 1 ) where N is an odd number and the zero-mean normalized cross-correlation method as given in Equation (1). In this equation, Ci is the cross-correlation coefficient of the i t h subset, R ( x , y ) is the intensity of the pixel at coordinates ( x , y ) in the reference subset, T ( x , y ) is the intensity of the pixel at coordinates ( x , y ) in the target subset, R m is the mean intensity of the pixels in the reference subset and T m is the mean intensity of the pixels in the target subset.
C i = R x , y R m T x , y T m R x , y R m 2 T x , y T m 2
After integer-pixel-level cross-correlation, displacements are calculated using Equations (2a) and (2b) where u and v are the displacements in the x - and y -axes.
x = x + u x , y
y = y + v x , y
Sub-pixel-level correlation is accomplished around pixels within the minimum cross-correlation coefficient of the reference pixel in the target condition with predetermined dimensions. The 3 × 3 window of pixels in the target condition is defined as a cost function using the bi-cubic interpolation method, which is given in Equation (3), which has continuous derivatives [59], and is distributed on a grid surface of unit squares. In this equation, T s x , y is the intensity at coordinates x , y in the target, and ω i , j is the coefficient at the dimensions of i and j .
T s x , y = i = 0 3 j = 0 3 ω i , j ( x ) i ( y ) j
The cost function corresponding to each pixel in the reference subset, given in Equation (4), is determined using the interpolation function. The cost function is minimized using the gradient descent optimization method.
J x , y = T s x , y R x , y 2

4. Case Study

For the case study, Copper/Tungsten nano-multilayers were deposited on a silicon substrate, and residual stress analysis was performed using FIB-DIC techniques. SEM images of a stepwise milled ring-core with a 3 µm diameter were captured at each milling step to compare with elastic strain relief calculations, using specific FIB parameters and 16 milling steps to achieve the desired depth-to-diameter ratio. The comparison of the FIB-DIC and hDIC techniques was conducted using the same SEM images collected from this specimen.

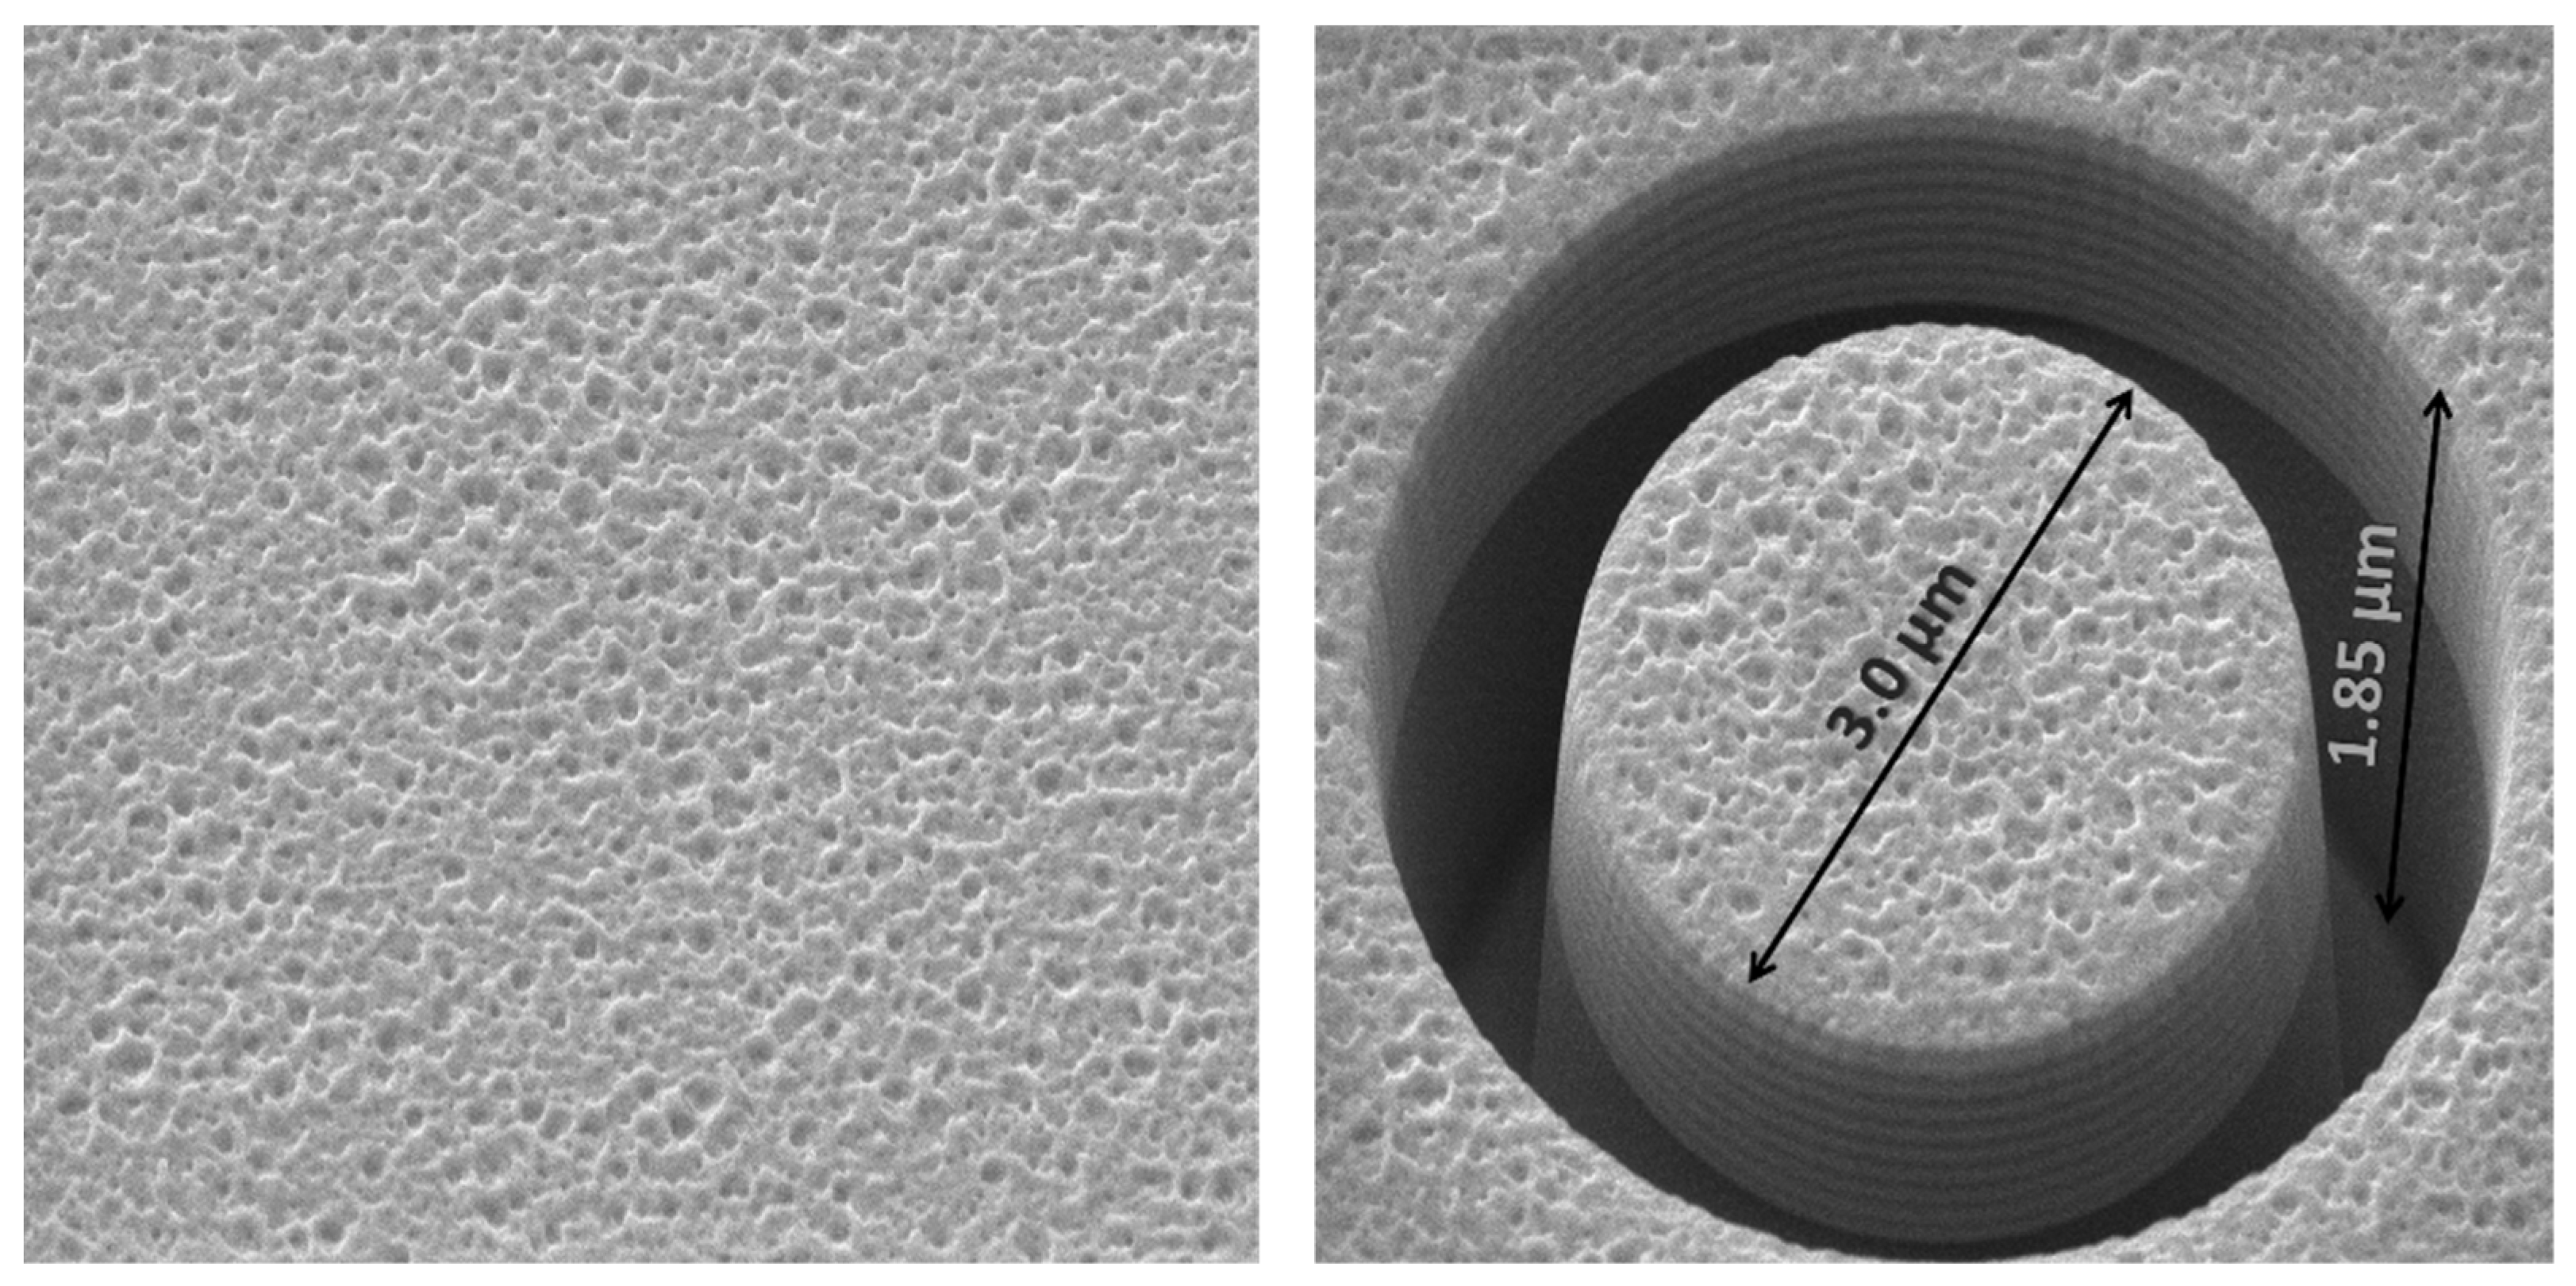
4.1. Sample Preparation and Data Collection

Copper/Tungsten nano-multilayers enable the design of materials with high thermal and electrical conductivity, high mechanical strength and low thermal expansion. The nano-scale residual stress analysis of these coatings requires techniques with high resolution. Romano-Brandt et al. [48] conducted residual stress depth profiling on a silicon substrate with Copper/Tungsten multilayers, achieving a resolution of 50 nm using the FIB-DIC technique, and the calculations were validated by synchrotron XRD measurements. In this study, SEM images of a stepwise milled ring-core with a diameter of 3 µm were used with the hDIC technique algorithm to compare with elastic strain relief calculations obtained through the FIB-DIC technique. The FIB parameters were set to a beam energy of 30 keV and a beam current of 0.20 nA. The ring-core underwent 16 milling steps, each with an equal depth size, until reaching a depth-to-diameter ratio of 0.6154. Starting from the zero-depth reference condition, five SEM images with a resolution of 1600 × 1600 pixels were captured at each step for statistical averaging. Figure 1 illustrates two images representing the zero milling state reference and the final state of the milling process.

4.2. Utilizations of FIB-DIC and hDIC
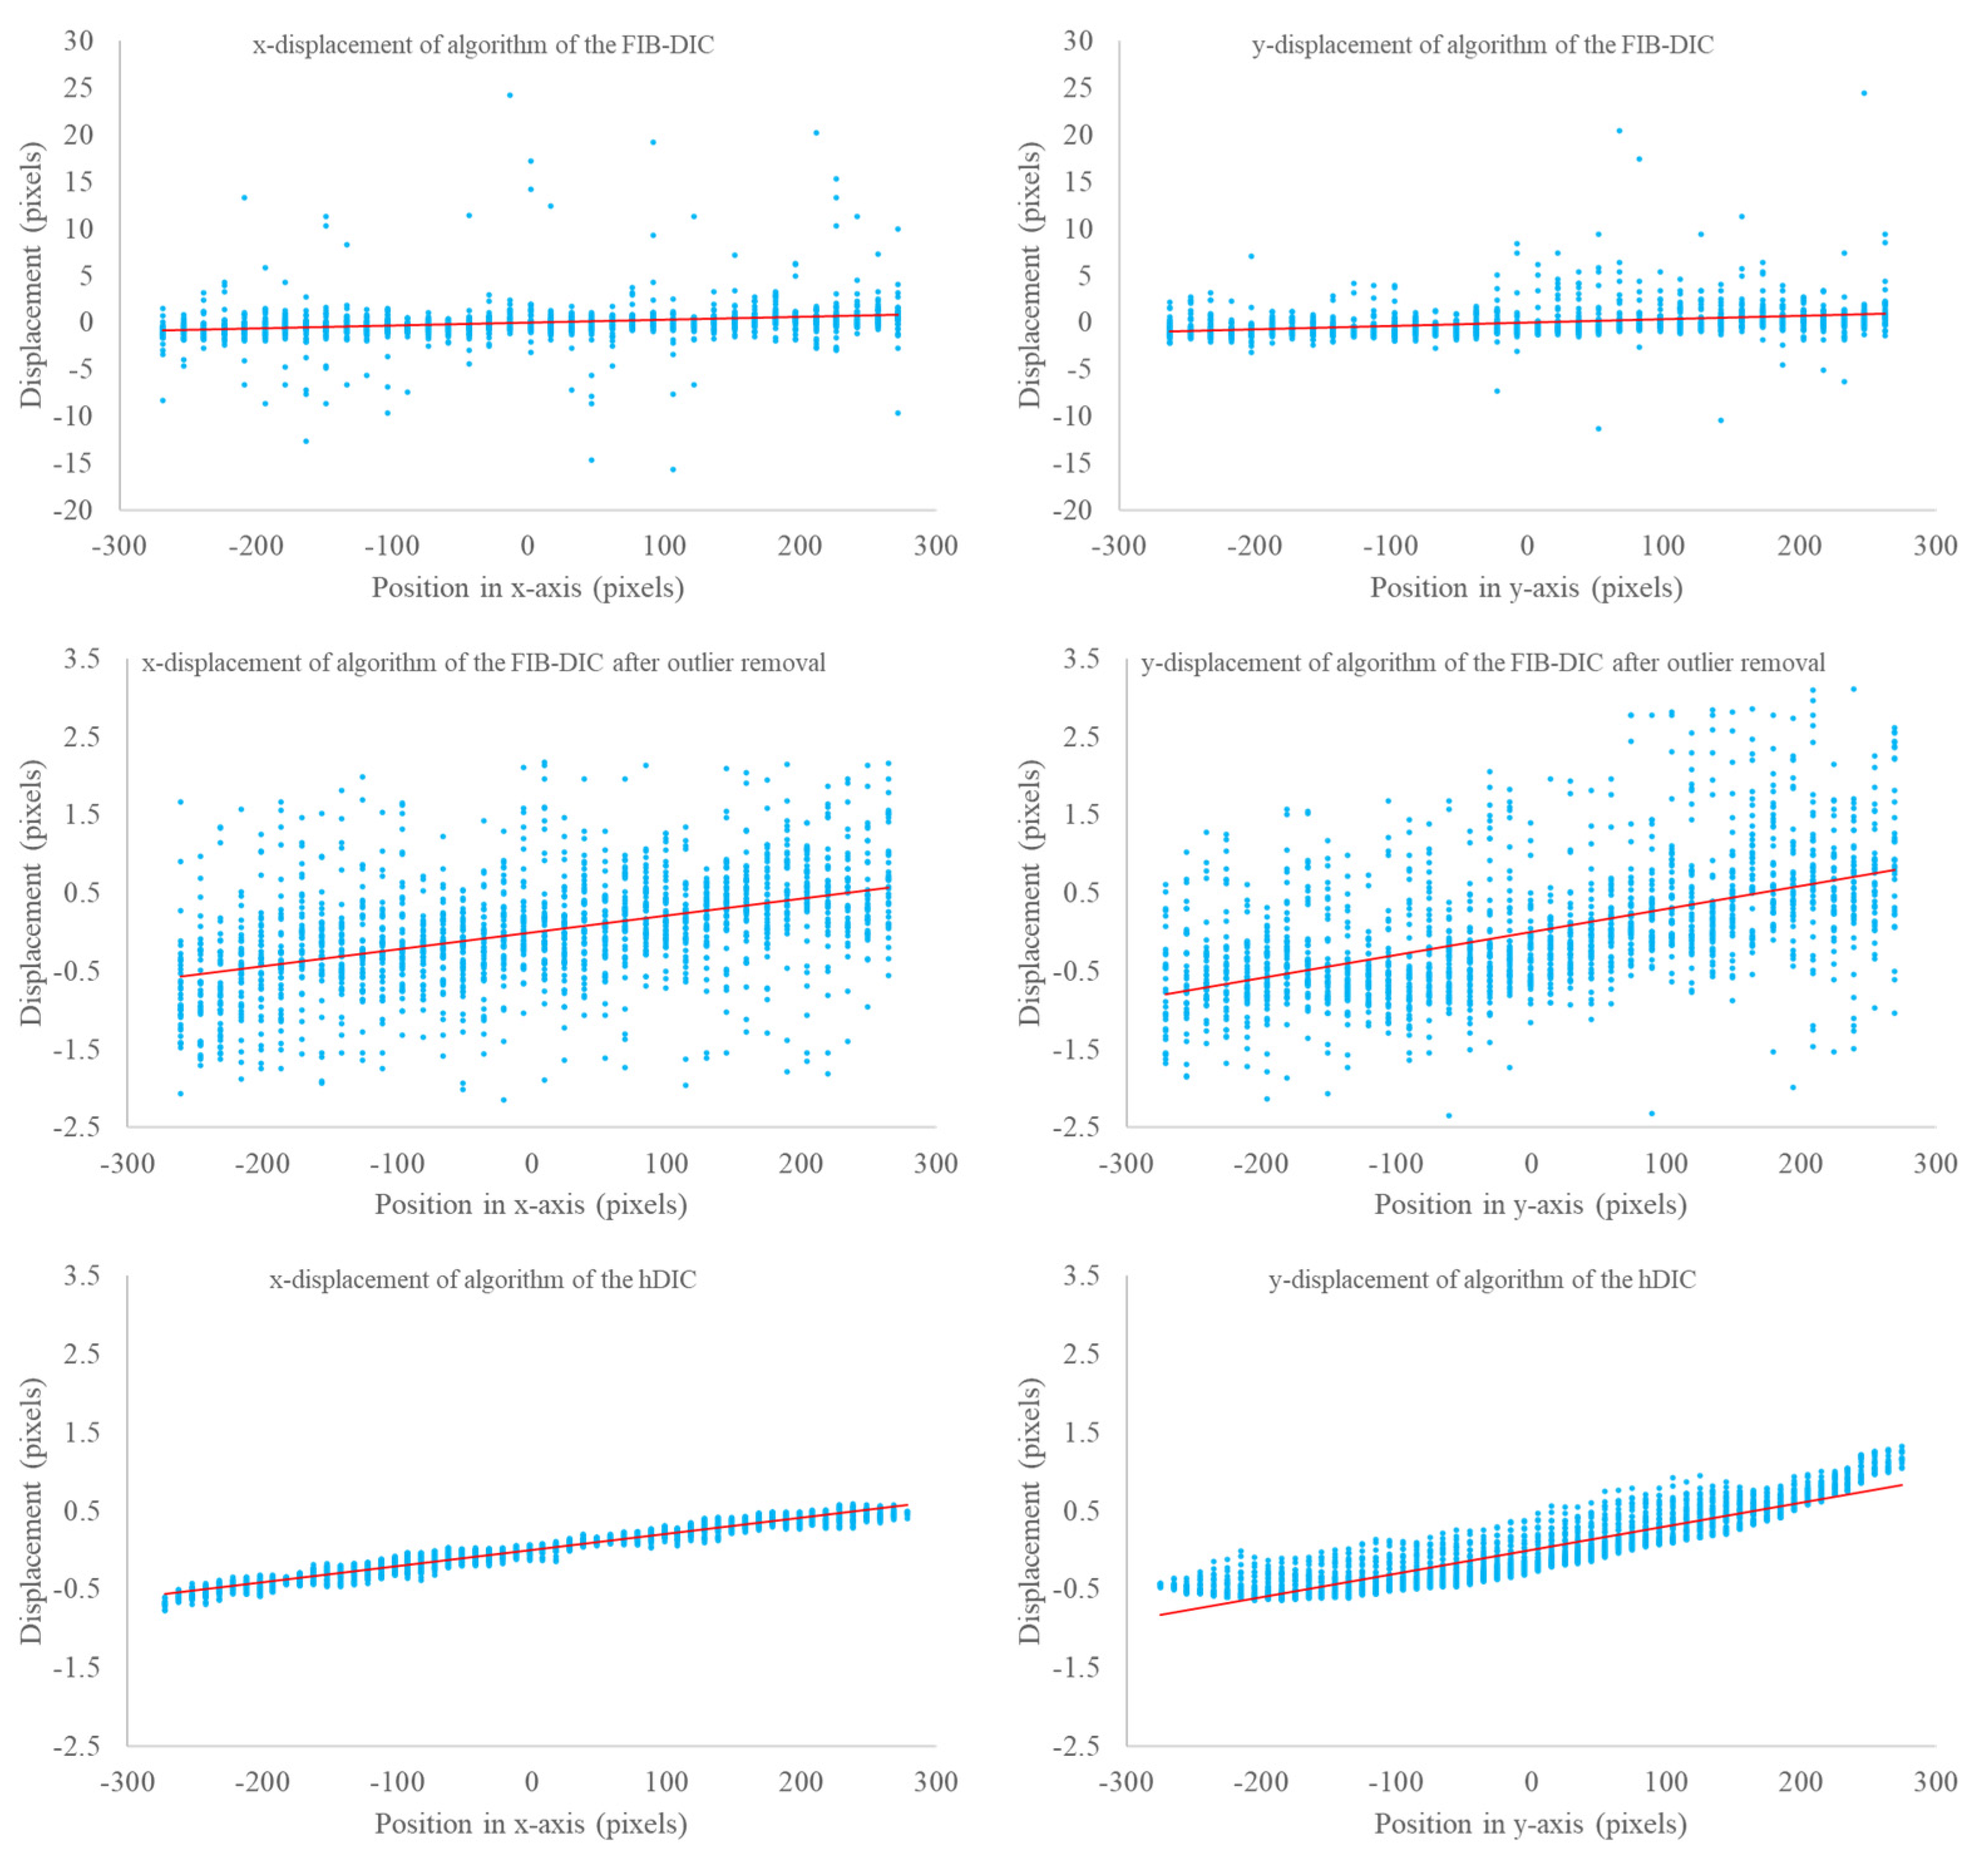
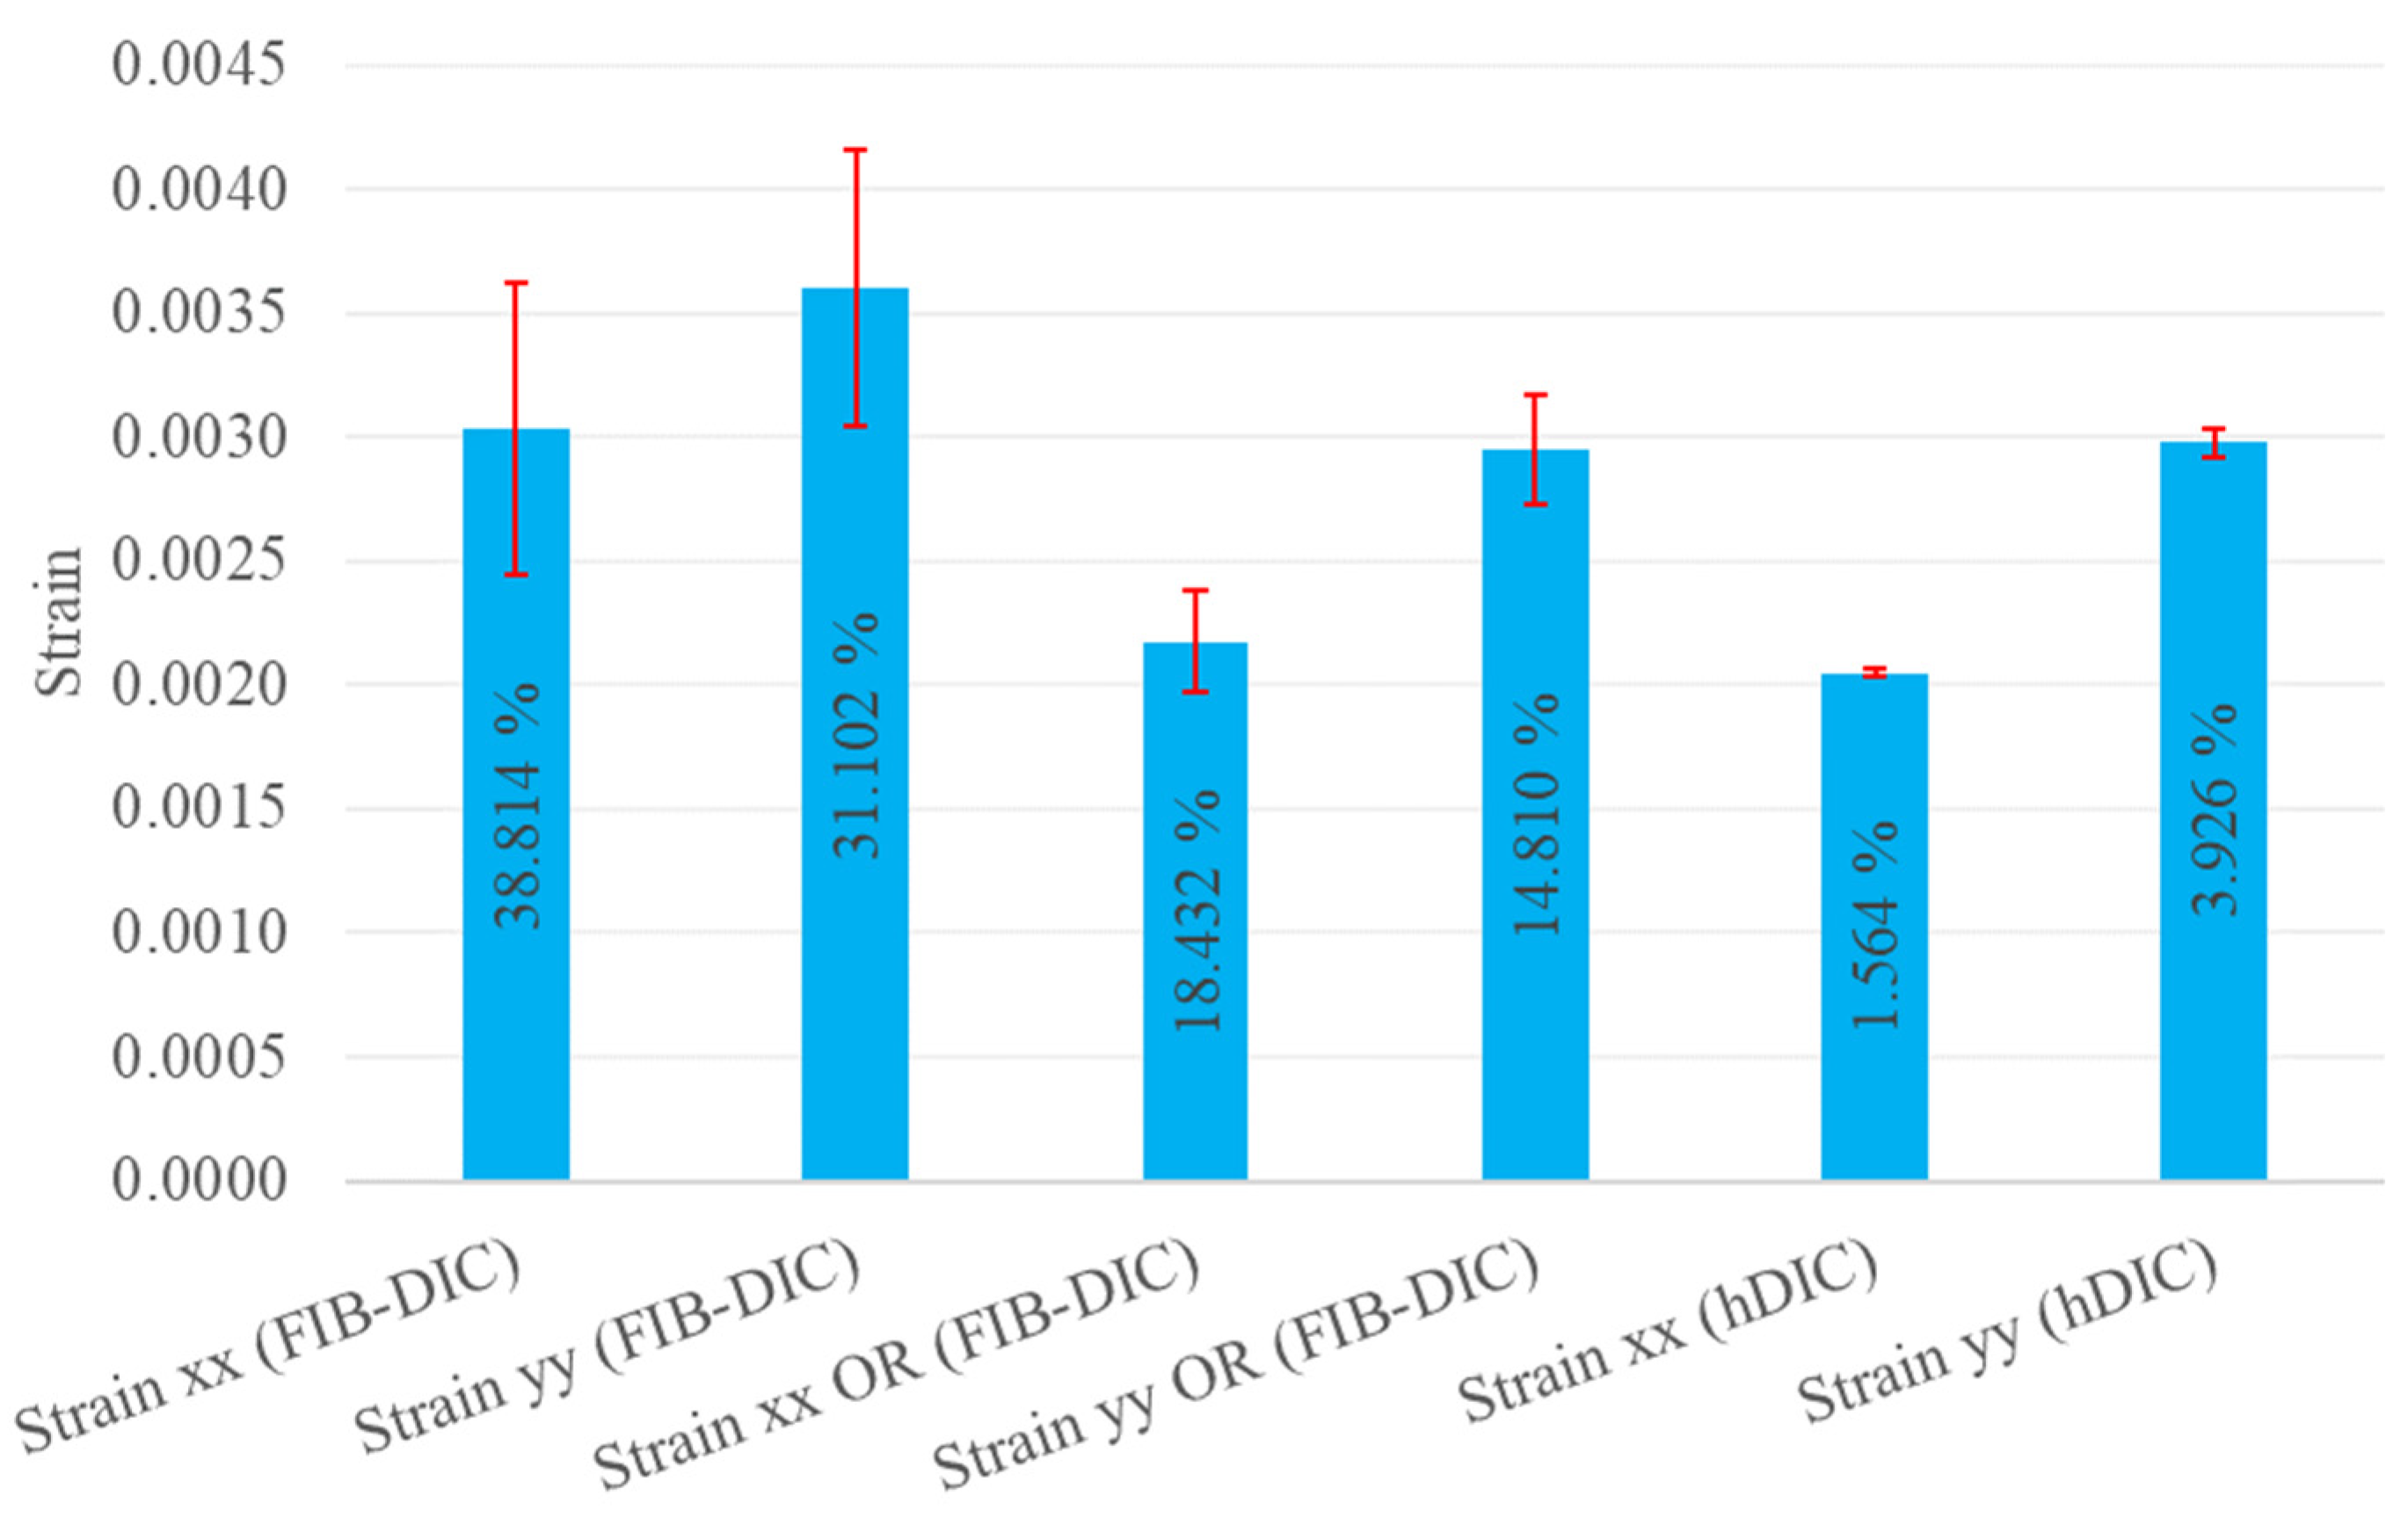
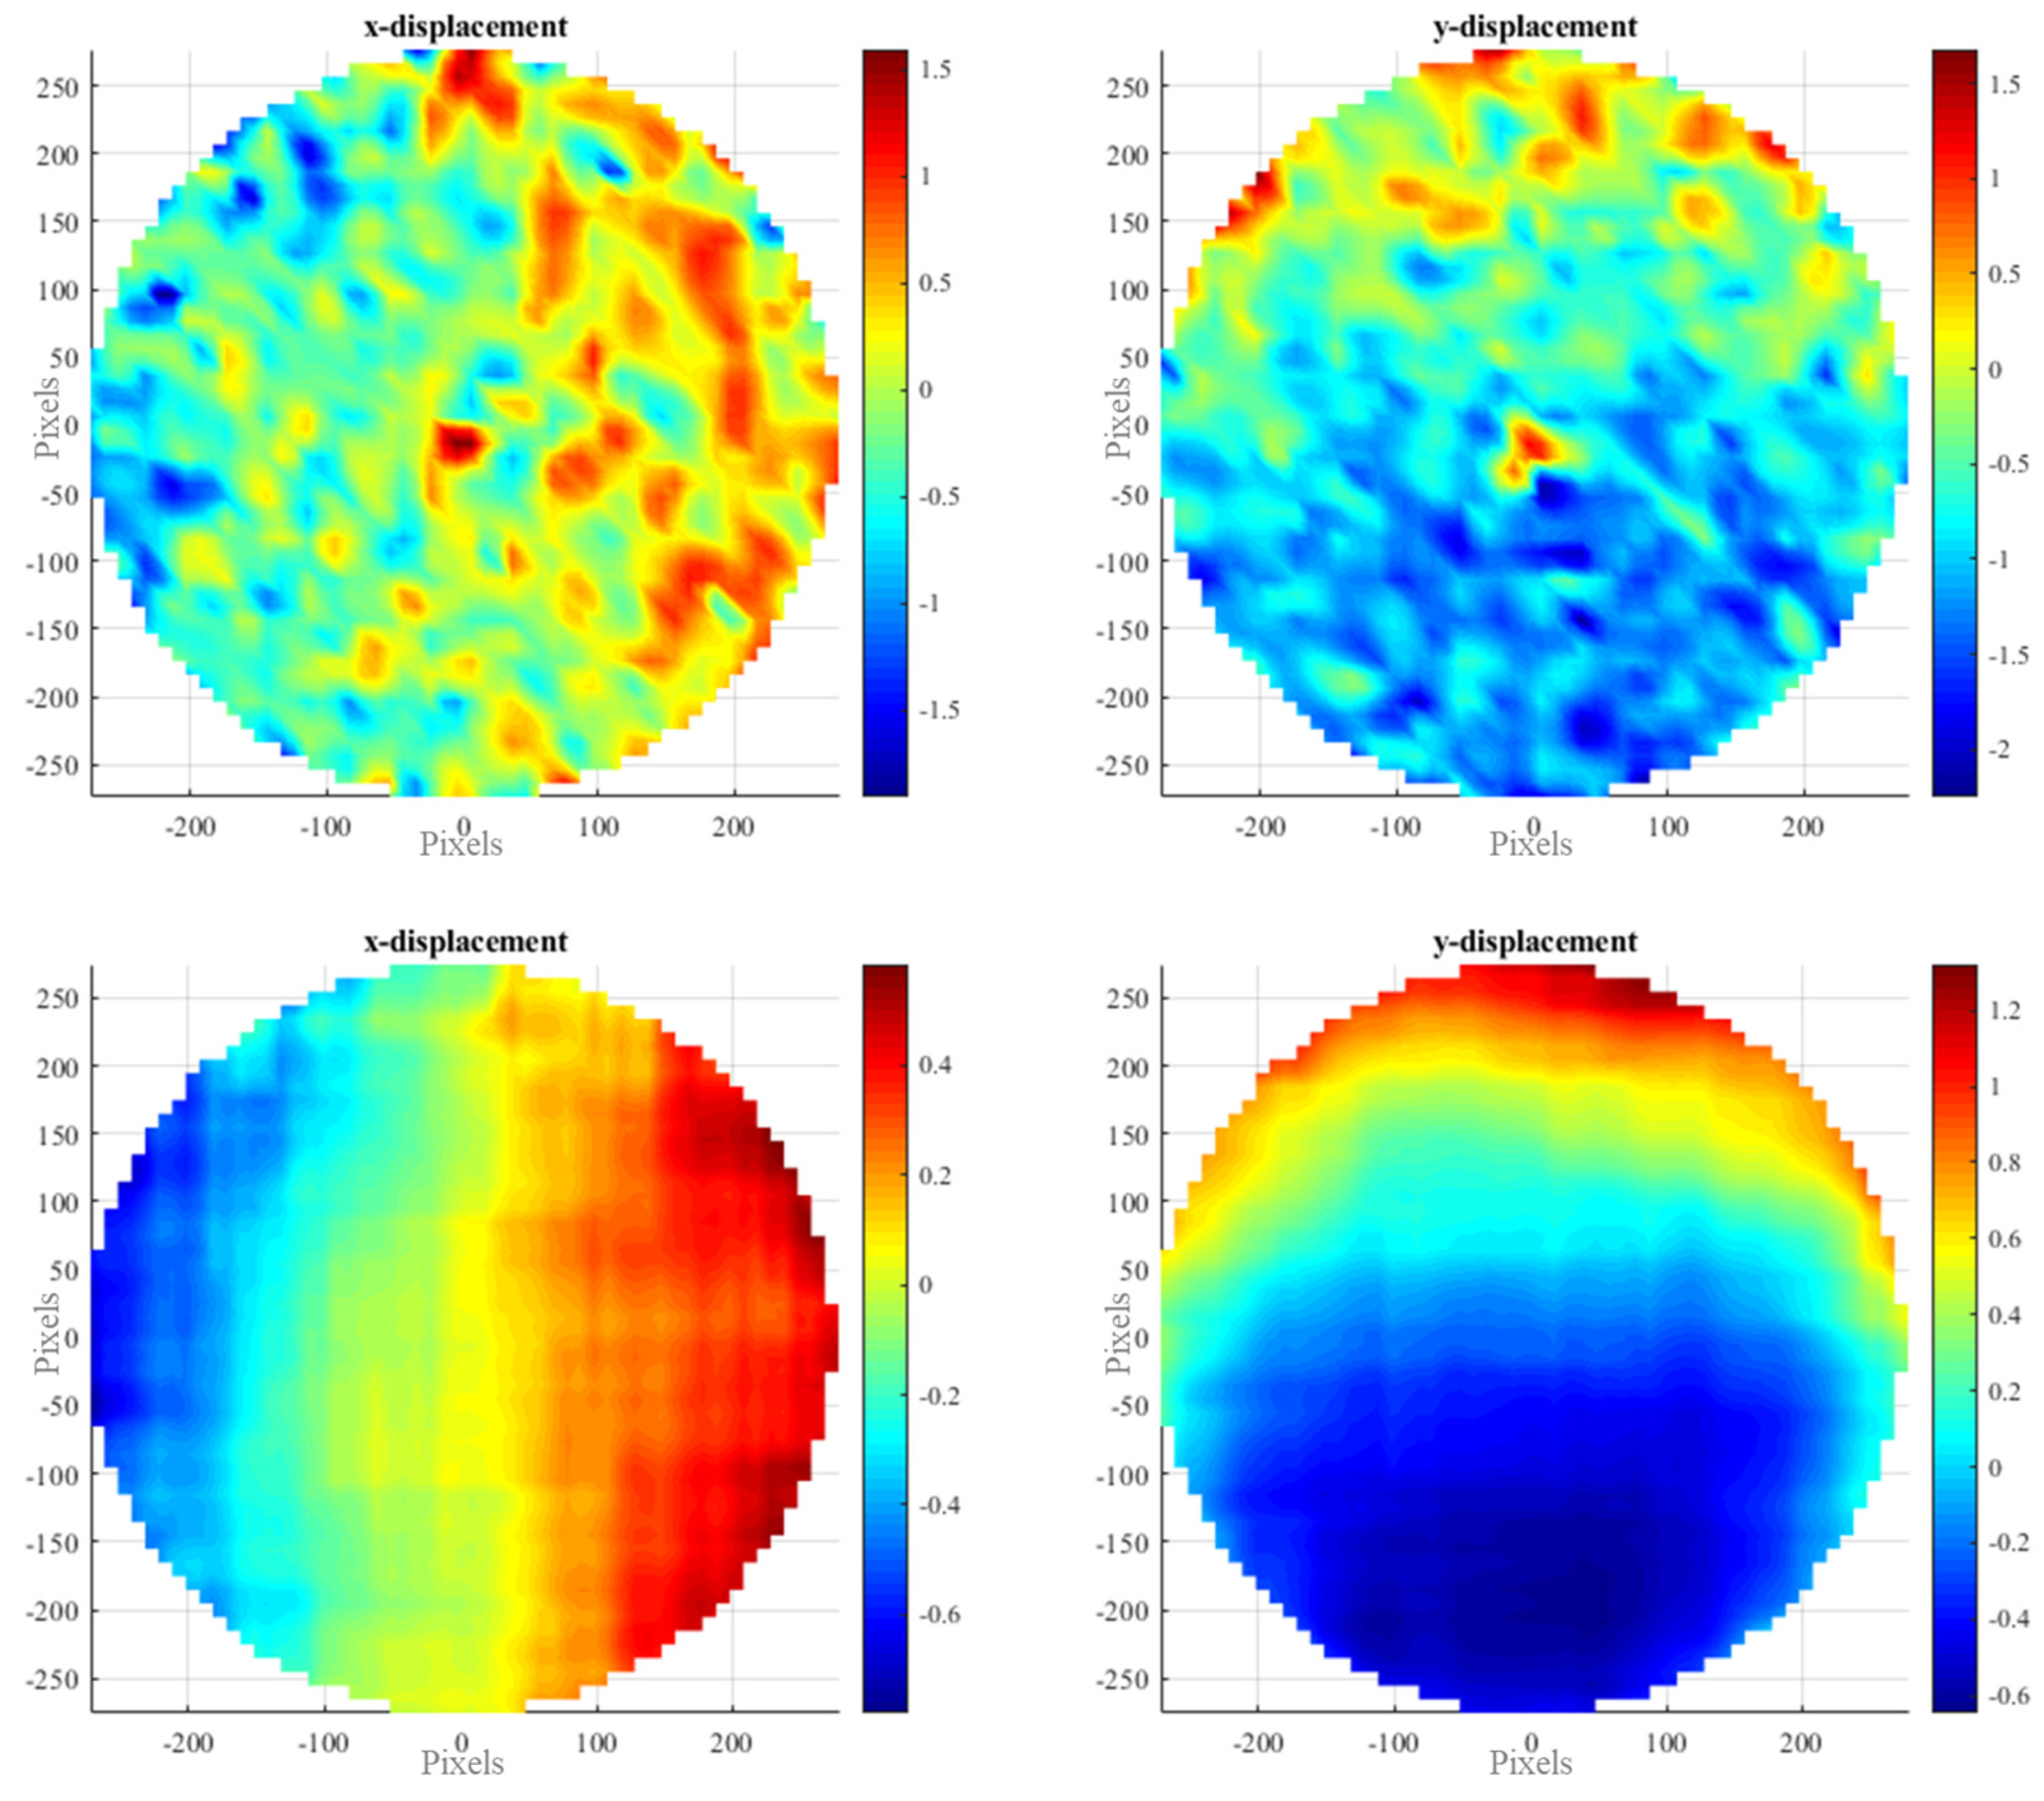
The FIB-DIC technique involves the sequential correlation of a series of images collected during the FIB milling process, starting from the correlation between image i and image ( i 1 ) and continuing up to the correlation between images n and ( i 1 ) , where the number of milling steps represented by i varies from 2 to n . In contrast, the algorithm of the hDIC technique performs non-sequential direct correlation between image 1 and image i . The algorithm of hDIC technique utilized as two-step DIC is based on a two-stage correlation process, in which integer-pixel-level cross-correlation is followed by sub-pixel-level correlation. During the integer-pixel-level cross-correlation stage, the best matching pixel in the target is determined, serving as the starting point for the iterations of the sub-pixel-level correlation stage. In the case of FIB ring-core drilling and correlation using the algorithm of the hDIC technique, a single large subset covering a significant portion of the region of interest with dimensions of 50 × 50 pixels is selected to determine the shift between reference and target SEM images in the first stage of the correlation. Additionally, the step size of pixels in the region of interest selected for the correlation process was determined to be 5 pixels for both correlation techniques.
The FIB-DIC technique incorporates a dedicated error estimation and analysis stage aimed at removing outliers associated with correlation errors. In contrast, the algorithm of the hDIC technique, utilized for determining elastic strain relaxation resulting from FIB milling, conducts correlation without employing any smoothing or error estimation stage. While a comprehensive error analysis and outlier removal procedure have been proposed for the FIB-DIC technique [36], this study employs the outlier removal of the correlation results using a single-step localized median outlier removal technique. The analysis of the influence of the percent of localization of the median outlier removal on the relative error of elastic strain determination and elastic strain calculations reveals that the outlier removal approach reaches a saturation point in terms of error and elastic strain between 2% and 20% localization, as depicted in Figure 2. A further increase beyond this range leads to deviation from the saturation range. In this representation, error is quantified as the percent range of relative error, which denotes the ratio between the range of the relative error of elastic strain determination and elastic strain calculation. Elastic strain values, concerning the percent of localization, vary within a band of error and elastic strain range. While this study does not propose an outlier removal procedure for the FIB-DIC technique, it is recommended to collect samples within the localization range and determine the average value of the percent of localization for elastic strain determination using the FIB-DIC technique. However, for the sake of comparison with the calculations of the hDIC technique, the percentage of localization was kept at 10% as a standard solution procedure in this study.

4.3. Results

Figure 3 illustrates the x - and y -components of displacement at the end of the milling and best fitting lines before and after the removal of the outliers corresponding to the calculation of the FIB-DIC technique and algorithm of the hDIC technique. After the removal of the outliers, 89.74 and 90.24% of pixels remained belonging to the x - and y -components of displacement, respectively. This process eliminated outlier pixels with displacements that reach up to the 25-pixel range or more. According to these results, it can be stated that the FIB-DIC technique has a high level of error when compared to the calculations of the algorithm of the hDIC technique.
The results of the algorithm of the hDIC technique are given in Figure 3 without any outlier removal or smoothing. These results show that the x -component of displacements is distributed around the best fitting line in a very narrow band within a range of 1 pixel, while the y -component of displacements has a 1.5-pixel range with a similar distribution behavior. On the other hand, the x - and y -components of the displacements calculated by the FIB-DIC technique are distributed in a wider range that exceeds the 5-pixel range even after outlier removal. The variation in the y -component of displacement across a ring-core from its edges to the center, following milling by a focused ion beam (FIB), exhibits a non-linear distribution, which is crucially influenced by the perspective in SEM images. This non-linearity is attributed to the inherent geometry of the ring-core, where the outer edges experience more substantial deformation due to their proximity to the milling interface. As the distance from the edges increases towards the center, the displacement gradients diminish, leading to a more uniform strain profile. The highly accurate quantifications provided by the hDIC technique reflect these variations by precisely capturing the subtle changes in displacement across the SEM image perspective, thereby elucidating the localized strain fields induced by FIB milling.
Elastic strain relaxations, calculated using the slope of linear fitting functions with 95% confidence bounds, are depicted in Figure 4. The results indicate that the percentage range of relative error for the x x -component of elastic strain relaxation, calculated using the FIB-DIC technique, is 38.8% without outlier removal and reduces to 18.4% after outlier removal. In contrast, the algorithm of the hDIC technique yields an x x -component of elastic strain relaxation with a range of relative error of only 1.6%, significantly lower than the FIB-DIC technique even after outlier removal. The error range of the FIB-DIC technique is 24.8 times higher than that of the hDIC technique and 11.8 times higher after outlier removal. Furthermore, the y -component of displacements along the y -axis does not exhibit a linear distribution, as evidenced by the results of the hDIC technique in Figure 3. However, this non-linearity is difficult to discern from the correlation results of the FIB-DIC technique due to its noisy displacement results. Consequently, the percentage range of relative error for y -displacement is higher in both correlation techniques due to the low linearity of the distribution of the y -component of displacement.
Contour plots illustrating the distribution of the x - and y -components of displacement are presented in Figure 5. From the displacement distribution, it can be inferred that the relaxation of the x x -component of elastic strain is more homogeneous compared to the relaxation of the y y -component. This disparity accounts for the lower linearity observed in the distribution of y -component of displacement. To achieve a higher level of homogeneity in the y y -component of elastic strain, smaller rings should be utilized. Furthermore, this illustration highlights the higher error rate in the calculations of the FIB-DIC technique compared to those of the algorithm of the hDIC technique. Displacements resulting from elastic strain relaxations manifest as distinct hot spots in the FIB-DIC calculations due to correlation errors. Conversely, displacements exhibit a smoother distribution in the calculations of the hDIC technique, eliminating the need for any additional smoothing process.
Elastic strain relaxation as a function of the depth-to-diameter ratio, calculated using both the FIB-DIC and hDIC techniques, is illustrated in Figure 6. As previously mentioned, FIB-DIC correlations are conducted sequentially, transferring displacement results from each step to the next, whereas the hDIC technique performs direct correlation between the initial condition and each step of the milling process separately. The results indicate that the calculations from both the FIB-DIC technique after outlier removal and the algorithm of the hDIC technique yield similar distributions of the x x - and y y -components of elastic strain relaxation concerning the depth-to-diameter ratio. However, the distribution of the y y -component of elastic strain relaxation is not entirely linear due to the lack of homogeneity in its distribution within the ring. Consequently, the peak at a relative trench depth of 0.4 did not appear in the distribution of the y y -component of elastic strain relaxation in either the FIB-DIC or the hDIC calculations. On the other hand, the saturation of elastic strain relaxation occurs after reaching the peak value at a relative trench depth of 0.2 in the calculations of the hDIC technique, while the FIB-DIC calculations do not show such saturation without outlier removal. The error analysis illustrated in Figure 6, in terms of the percentage of error range of elastic strain relaxation to the quantified elastic strain, indicates that the error relative to elastic strain decreases with increasing depth, but the error is much higher in the FIB-DIC calculations compared to the calculations of the hDIC technique.
The application of surface processing techniques in manufacturing metallic parts introduces residual elastic strains within the material’s microstructure, influencing properties such as wear resistance, fatigue strength and corrosion protection. An accurate quantification of these residual strains is pivotal for optimizing manufacturing processes and predicting material performance under service conditions. The combined use of FIB milling, SEM imaging and DIC offers a method for measuring residual stresses with high resolution and sensitivity.
The FIB-DIC technique has been extensively used for nano-scale residual stress analysis, particularly in materials such as PVD coatings, thin films and additively manufactured alloys. However, the technique’s sequential correlation process and reliance on outlier removal procedures pose challenges in accurately quantifying elastic strain relaxation, especially in non-homogeneous surfaces like ring-cores.
In contrast, the hDIC technique offers improved accuracy and efficiency in capturing displacements within the region of interest. By correlating pixel intensities from SEM images directly with the reference state without a sequential procedure, the hDIC achieves reliable sub-pixel-level correlation without the need for error analysis or outlier removal procedures. Its seamless integration with SEM imaging during the drilling process provides a clear visualization of surface features, enhancing correlation accuracy.
The comparative analysis between the FIB-DIC and hDIC techniques reveals the superior accuracy of the hDIC in quantifying elastic strain relaxation. While the FIB-DIC calculations exhibit higher error rates and obscure variations in strain relaxation, hDIC’s clarity enables the observation of subtle nuances in strain distribution. Moreover, the absence of error analysis and smoothing stages in hDIC streamlines the correlation process, ensuring robust results without compromising accuracy.
Although this study focuses primarily on hDIC’s application to image correlation, its findings offer valuable insights for advancing the FIB-DIC technique. By highlighting the limitations of FIB-DIC and showcasing the strengths of hDIC, this research lays the groundwork for refining the correlations of the FIB-DIC technique, ultimately enhancing our ability to investigate residual stresses and surface processing effects with greater precision and accuracy.

5. Conclusions

The comparison of two digital image correlation (DIC) techniques underscores the efficacy of hDIC as two-step DIC over FIC-DIC for investigating residual stresses resulting from surface processing. The accuracy of hDIC in capturing displacements within the region of interest is particularly notable, as evidenced by its significantly lower error rates compared to FIC-DIC. This heightened accuracy facilitates the observation of variations in elastic strain relaxation, especially on non-homogeneous surfaces like the ring-core studied here. Unlike FIB-DIC, where high error rates obscure such variations, hDIC’s clarity reveals subtle nuances in elastic strain relaxation, thus enhancing our understanding of material behavior.
The accuracy of hDIC is further underscored by its seamless integration with scanning electron microscopy (SEM) images during the drilling process, providing a clear view of the surface and enabling reliable sub-pixel-level correlation without the loss of data. Critically, the absence of error analysis, smoothing stages or outlier removal procedures in hDIC streamlines the correlation process, ensuring robust results without compromising accuracy.
While this study primarily focuses on hDIC’s application to image correlation rather than surface profilometry data, its findings offer valuable insights for advancing FIB-DIC techniques. By highlighting the limitations of FIB-DIC and showcasing the strengths of hDIC, this research lays the groundwork for refining digital image correlation methods, ultimately enhancing our ability to investigate residual stresses and surface processing effects with greater precision and accuracy.

Author Contributions

Conceptualization, F.U.; methodology, F.U.; software, F.U.; validation, F.U.; formal analysis, F.U.; investigation, F.U.; resources, F.U.; data curation, F.U.; writing—original draft preparation, F.U.; writing—review and editing, F.U.; visualization, F.U.; supervision, A.M.K.; project administration, A.M.K.; funding acquisition, A.M.K. All authors have read and agreed to the published version of the manuscript.

Funding

This research received no external funding.

Data Availability Statement

The data that support the findings of this study are available from the corresponding author upon reasonable request.

Acknowledgments

The authors acknowledge León Romano-Brandt for providing the SEM images of the nano-scale ring-core FIB milling of the Cu/W multilayer Si substrate, prepared at the Microscopy-based Laboratory for Experimental Mechanics (MBLEM), University of Oxford.

Conflicts of Interest

The authors declare no conflicts of interest.

References

  1. Pauleau, Y. Materials Surface Processing by Directed Energy Techniques. In Materials Surface Processing by Directed Energy Techniques; Elsevier: Amsterdam, The Netherlands, 2006; pp. 1–722. [Google Scholar] [CrossRef]
  2. Li, S.; Zhang, B.; Yang, L.; Zhang, J.; Wang, Y.; Kang, W. Study on Wear Properties of the Graphite-Sealing Surfaces in a Triple Eccentric Butterfly Valve Based on EDEM-Fluent Coupling. Machines 2023, 11, 463. [Google Scholar] [CrossRef]
  3. Wang, C.; Han, J.; Zhao, J.; Song, Y.; Man, J.; Zhu, H.; Sun, J.; Fang, L. Enhanced Wear Resistance of 316 L Stainless Steel with a Nanostructured Surface Layer Prepared by Ultrasonic Surface Rolling. Coatings 2019, 9, 276. [Google Scholar] [CrossRef]
  4. Chen, S.; Usta, A.D.; Eriten, M. Microstructure and Wear Resistance of Ti6Al4V Surfaces Processed by Pulsed Laser. Surf. Coat. Technol. 2017, 315, 220–231. [Google Scholar] [CrossRef]
  5. Dzionk, S.; Przybylski, W.; Ścibiorski, B. The Possibilities of Improving the Fatigue Durability of the Ship Propeller Shaft by Burnishing Process. Machines 2020, 8, 63. [Google Scholar] [CrossRef]
  6. Wen, Q.; Hu, J.; Yuan, Z. Sub-Fiber Scale Precision Dicing of Aramid Fiber-Reinforced Plastic Composites. Machines 2022, 10, 334. [Google Scholar] [CrossRef]
  7. Kahlin, M.; Ansell, H.; Basu, D.; Kerwin, A.; Newton, L.; Smith, B.; Moverare, J.J. Improved Fatigue Strength of Additively Manufactured Ti6Al4V by Surface Post Processing. Int. J. Fatigue 2020, 134, 105497. [Google Scholar] [CrossRef]
  8. Rogachev, S.O.; Bazhenov, V.E.; Komissarov, A.A.; Ten, D.V.; Li, A.V.; Andreev, V.A.; Statnik, E.S.; Sadykova, I.A.; Plegunova, S.V.; Yushchuk, V.V.; et al. High Strength and Ductility in a New Mg–Zn–Ga Biocompatible Alloy by Drawing and Rotary Forging. Results Mater. 2024, 21, 100524. [Google Scholar] [CrossRef]
  9. Au-Yeung, H.L.; Ataya, S.; Hassanin, H.; El-Sayed, M.A.; Ahmadein, M.; Alsaleh, N.A.; Ahmed, M.M.Z.; Essa, K. Non-Destructive Disassembly of Interference Fit under Wear Conditions for Sustainable Remanufacturing. Machines 2023, 11, 538. [Google Scholar] [CrossRef]
  10. Arackal Narayanan, J.; Kaji, F.; Zimny, M.; Toyserkani, E. Laser Directed Energy Deposition-Based Additive Manufacturing of Fe20Cr5.5AlY from Single Tracks to Bulk Structures: Statistical Analysis, Process Optimization, and Characterization. Machines 2023, 11, 58. [Google Scholar] [CrossRef]
  11. Kara, F.; Markopoulos, P.; Nas, E.; Kara, F. Optimization of EDM Machinability of Hastelloy C22 Super Alloys. Machines 2022, 10, 1131. [Google Scholar] [CrossRef]
  12. Schneller, W.; Leitner, M.; Pomberger, S.; Springer, S.; Beter, F.; Grün, F. Effect of Post Treatment on the Microstructure, Surface Roughness and Residual Stress Regarding the Fatigue Strength of Selectively Laser Melted AlSi10Mg Structures. J. Manuf. Mater. Process. 2019, 3, 89. [Google Scholar] [CrossRef]
  13. Ye, C.; Zhang, C.; Zhao, J.; Dong, Y. Effects of Post-Processing on the Surface Finish, Porosity, Residual Stresses, and Fatigue Performance of Additive Manufactured Metals: A Review. J. Mater. Eng. Perform. 2021, 30, 6407–6425. [Google Scholar] [CrossRef] [PubMed]
  14. Huchzermeyer, R.L. Measuring Mechanical Properties Using Digital Image Correlation: Extracting Tensile and Fracture Properties from a Single Sample. Doctoral Dissertation, Stellenbosch University, Stellenbosch, South Africa, 2017. [Google Scholar]
  15. Bárány, T.; Czigány, T.; Karger-Kocsis, J. Application of the Essential Work of Fracture (EWF) Concept for Polymers, Related Blends and Composites: A Review. Prog. Polym. Sci. 2010, 35, 1257–1287. [Google Scholar] [CrossRef]
  16. Abanto-Bueno, J.; Lambros, J. Investigation of Crack Growth in Functionally Graded Materials Using Digital Image Correlation. Eng. Fract. Mech. 2002, 69, 1695–1711. [Google Scholar] [CrossRef]
  17. Chen, J.; Chu, J.; Jiang, W.; Yao, B.; Zhou, F.; Wang, Z.; Zhao, P. Experimental and Numerical Simulation to Study the Reduction of Welding Residual Stress by Ultrasonic Impact Treatment. Materials 2020, 13, 837. [Google Scholar] [CrossRef] [PubMed]
  18. Johnson, E.M.; Watkins, T.R.; Schmidlin, J.E.; Dutler, S.A. A Benchmark Study on Casting Residual Stress. Metall. Mater. Trans. A Phys. Metall. Mater. Sci. 2012, 43, 1487–1496. [Google Scholar] [CrossRef]
  19. Oberreiter, M.; Horvath, M.; Stoschka, M.; Fladischer, S. Effect of Surface Finishing State on Fatigue Strength of Cast Aluminium and Steel Alloys. Materials 2023, 16, 4755. [Google Scholar] [CrossRef] [PubMed]
  20. Petersen, L.; Lima, B.; Vinícius Puydinger, M.; Santos, M.A.; Keiler, A.; Ribeiro, A.; Cerdeira, A.; Pavanello, M.A.; Inkson, B.J.; Leclere, D.; et al. The Effect of Focused Ion Beam Machining on Residual Stress and Crack Morphologies in Alumina. J. Phys. Conf. Ser. 2006, 26, 219. [Google Scholar] [CrossRef]
  21. Chelladurai, S.J.S.; Murugan, K.; Ray, A.P.; Upadhyaya, M.; Narasimharaj, V.; Gnanasekaran, S. Optimization of Process Parameters Using Response Surface Methodology: A Review. Mater. Today Proc. 2021, 37, 1301–1304. [Google Scholar] [CrossRef]
  22. Mozetič, M. Surface Modification to Improve Properties of Materials. Materials 2019, 12, 441. [Google Scholar] [CrossRef]
  23. Dinsmore, D.L.; Alexander, P.A. A Critical Discussion of Deep and Surface Processing: What It Means, How It Is Measured, the Role of Context, and Model Specification. Educ. Psychol. Rev. 2012, 24, 499–567. [Google Scholar] [CrossRef]
  24. Alexander, M.; Thomas, M. Service Life Prediction and Performance Testing—Current Developments and Practical Applications. Cem. Concr. Res. 2015, 78, 155–164. [Google Scholar] [CrossRef]
  25. Lee, L.J.; Fu, K.E.; Yang, J.N. Prediction of Fatigue Damage and Life for Composite Laminates under Service Loading Spectra. Compos. Sci. Technol. 1996, 56, 635–648. [Google Scholar] [CrossRef]
  26. Kang, J.; Wilkinson, D.S.; Embury, J.D.; Jain, M. Microscopic Strain Mapping Using Scanning Electron Microscopy Topography Image Correlation at Large Strain. J. Strain Anal. Eng. Des. 2005, 40, 559–570. [Google Scholar] [CrossRef]
  27. Wang, X.; Pan, Z.; Fan, F.; Wang, J.; Liu, Y.; Mao, S.X.; Zhu, T.; Xia, S. Nanoscale Deformation Analysis With High-Resolution Transmission Electron Microscopy and Digital Image Correlation. J. Appl. Mech. 2015, 82, 121001. [Google Scholar] [CrossRef]
  28. Jiang, J.; Yang, J.; Zhang, T.; Zou, J.; Wang, Y.; Dunne, F.P.E.; Britton, T.B. Microstructurally Sensitive Crack Nucleation around Inclusions in Powder Metallurgy Nickel-Based Superalloys. Acta Mater. 2016, 117, 333–344. [Google Scholar] [CrossRef]
  29. Sun, C.; Standish, B.; Vuong, B.; Wen, X.-Y.; Yang, V. Digital Image Correlation—Based Optical Coherence Elastography. J. Biomed. Opt. 2013, 18, 121515. [Google Scholar] [CrossRef]
  30. Xu, Z.H.; Sutton, M.A.; Li, X. Mapping Nanoscale Wear Field by Combined Atomic Force Microscopy and Digital Image Correlation Techniques. Acta Mater. 2008, 56, 6304–6309. [Google Scholar] [CrossRef]
  31. Bruno, L. Full-Field Measurement with Nanometric Accuracy of 3D Superficial Displacements by Digital Profile Correlation: A Powerful Tool for Mechanics of Materials. Mater. Des. 2018, 159, 170–185. [Google Scholar] [CrossRef]
  32. Watkins, R.E.J.; Rockett, P.; Thoms, S.; Clampitt, R.; Syms, R. Focused Ion Beam Milling. Vacuum 1986, 36, 961–967. [Google Scholar] [CrossRef]
  33. Zhu, B.; Leung, N.; Kockelmann, W.; Kabra, S.; London, A.J.; Gorley, M.; Whiting, M.J.; Wang, Y.; Sui, T. Revealing the Residual Stress Distribution in Laser Welded Eurofer97 Steel by Neutron Diffraction and Bragg Edge Imaging. J. Mater. Sci. Technol. 2022, 114, 249–260. [Google Scholar] [CrossRef]
  34. Winiarski, B.; Withers, P.J. Micron-Scale Residual Stress Measurement Using Micro-Hole Drilling and Digital Image Correlation. Conf. Proc. Soc. Exp. Mech. Ser. 2012, 4, 189–198. [Google Scholar] [CrossRef]
  35. Blair, A.; Daynes, N.; Hamilton, D.; Horne, G.; Heard, P.J.; Hodgson, D.Z.L.; Scott, T.B.; Shterenlikht, A. Residual Stress Relaxation Measurements across Interfaces at Macro-and Micro-Scales Using Slitting and DIC. J. Phys. Conf. Ser. 2009, 181, 012078. [Google Scholar] [CrossRef]
  36. Lunt, A.J.G.; Korsunsky, A.M. A Review of Micro-Scale Focused Ion Beam Milling and Digital Image Correlation Analysis for Residual Stress Evaluation and Error Estimation. Surf. Coat. Technol. 2015, 283, 373–388. [Google Scholar] [CrossRef]
  37. Krottenthaler, M.; Schmid, C.; Schaufler, J.; Durst, K.; Göken, M. A Simple Method for Residual Stress Measurements in Thin Films by Means of Focused Ion Beam Milling and Digital Image Correlation. Surf. Coat. Technol. 2013, 215, 247–252. [Google Scholar] [CrossRef]
  38. Korsunsky, A.M.; Sebastiani, M.; Bemporad, E. Focused Ion Beam Ring Drilling for Residual Stress Evaluation. Mater. Lett. 2009, 63, 1961–1963. [Google Scholar] [CrossRef]
  39. Dong, W.; Liang, X.; Chen, Q.; Hinnebusch, S.; Zhou, Z.; To, A.C. A New Procedure for Implementing the Modified Inherent Strain Method with Improved Accuracy in Predicting Both Residual Stress and Deformation for Laser Powder Bed Fusion. Addit. Manuf. 2021, 102345. [Google Scholar] [CrossRef]
  40. Chen, W.; Xu, L.; Han, Y.; Zhao, L.; Jing, H. Control of Residual Stress in Metal Additive Manufacturing by Low-Temperature Solid-State Phase Transformation: An Experimental and Numerical Study. Addit. Manuf. 2021, 42, 102016. [Google Scholar] [CrossRef]
  41. Wang, Z.; Denlinger, E.; Michaleris, P.; Stoica, A.D.; Ma, D.; Beese, A.M. Residual Stress Mapping in Inconel 625 Fabricated through Additive Manufacturing: Method for Neutron Diffraction Measurements to Validate Thermomechanical Model Predictions. Mater. Des. 2017, 113, 169–177. [Google Scholar] [CrossRef]
  42. Foss, B.J.; Gray, S.; Hardy, M.C.; Stekovic, S.; McPhail, D.S.; Shollock, B.A. Analysis of Shot-Peening and Residual Stress Relaxation in the Nickel-Based Superalloy RR1000. Acta Mater. 2013, 61, 2548–2559. [Google Scholar] [CrossRef]
  43. Bragg, W.L. The Specular Reflection of X-rays. Nature 1912, 90, 410. [Google Scholar] [CrossRef]
  44. Withers, P.J. Synchrotron X-Ray Diffraction. In Practical Residual Stress Measurement Methods; Schajer, G.S., Ed.; John Wiley & Sons, Ltd.: Hoboken, NJ, USA, 2013; pp. 163–194. ISBN 9781118402832. [Google Scholar]
  45. Uzun, F.; Korsunsky, A.M. The Height Digital Image Correlation (HDIC) Technique For The Identification Of Triaxial Surface Deformations. Int. J. Mech. Sci. 2019, 159, 417–423. [Google Scholar] [CrossRef]
  46. Uzun, F.; Salimon, A.I.; Statnik, E.S.; Besnard, C.; Chen, J.; Moxham, T.; Salvati, E.; Wang, Z.; Korsunsky, A.M. Polar Transformation of 2D X-Ray Diffraction Patterns and the Experimental Validation of the HDIC Technique. Measurement 2019, 151, 107193. [Google Scholar] [CrossRef]
  47. Uzun, F.; Korsunsky, A.M. The Use of Surface Topography for the Identification of Discontinuous Displacements Due to Cracks. Metals 2020, 10, 1037. [Google Scholar] [CrossRef]
  48. Romano-Brandt, L.; Salvati, E.; Le Bourhis, E.; Moxham, T.; Dolbnya, I.P.; Korsunsky, A.M. Nano-Scale Residual Stress Depth Profiling in Cu/W Nano-Multilayers as a Function of Magnetron Sputtering Pressure. Surf. Coat. Technol. 2019, 381, 125142. [Google Scholar] [CrossRef]
  49. Schajer, G.S.; Winiarski, B.; Withers, P.J. Hole-Drilling Residual Stress Measurement with Artifact Correction Using Full-Field DIC. In Proceedings of the Experimental and Applied Mechanics, Volume 4; Ventura, C.E., Crone, W.C., Furlong, C., Eds.; Springer: New York, NY, USA, 2013; pp. 403–414. [Google Scholar]
  50. Cao, Y.; Xie, X.; Antonaglia, J.; Winiarski, B.; Wang, G.; Shin, Y.C.; Withers, P.J.; Dahmen, K.A.; Liaw, P.K. Laser Shock Peening on Zr-Based Bulk Metallic Glass and Its Effect on Plasticity: Experiment and Modeling. Sci. Rep. 2015, 5, 10789. [Google Scholar] [CrossRef] [PubMed]
  51. Kang, K.J.; Yao, N.; He, M.Y.; Evans, A.G. A Method for in Situ Measurement of the Residual Stress in Thin Films by Using the Focused Ion Beam. Thin Solid. Films 2003, 443, 71–77. [Google Scholar] [CrossRef]
  52. Winiarski, B.; Gholinia, A.; Tian, J.; Yokoyama, Y.; Liaw, P.K.; Withers, P.J. Submicron-Scale Depth Profiling of Residual Stress in Amorphous Materials by Incremental Focused Ion Beam Slotting. Acta Mater. 2012, 60, 2337–2349. [Google Scholar] [CrossRef]
  53. Winiarski, B.; Langford, R.M.; Tian, J.; Yokoyama, Y.; Liaw, P.K.; Withers, P.J. Mapping Residual Stress Distributions at the Micron Scale in Amorphous Materials. Metall. Mater. Trans. A Phys. Metall. Mater. Sci. 2010, 41, 1743–1751. [Google Scholar] [CrossRef]
  54. Mansilla, C.; Martínez-Martínez, D.; Ocelík, V.; De Hosson, J.T.M. On the Determination of Local Residual Stress Gradients by the Slit Milling Method. J. Mater. Sci. 2015, 50, 3646–3655. [Google Scholar] [CrossRef]
  55. Sebastiani, M.; Eberl, C.; Bemporad, E.; Korsunsky, A.M.; Nix, W.D.; Carassiti, F. Focused Ion Beam Four-Slot Milling for Poisson’s Ratio and Residual Stress Evaluation at the Micron Scale. Surf. Coat. Technol. 2014, 251, 151–161. [Google Scholar] [CrossRef]
  56. Sebastiani, M.; Eberl, C.; Bemporad, E.; Pharr, G.M. Depth-Resolved Residual Stress Analysis of Thin Coatings by a New FIB-DIC Method. Mater. Sci. Eng. A 2011, 528, 7901–7908. [Google Scholar] [CrossRef]
  57. Huang, H.; Dabiri, D.; Gharib, M. On Errors of Digital Particle Image Velocimetry. Meas. Sci. Technol. 1997, 8, 1427–1440. [Google Scholar] [CrossRef]
  58. Farebrother, R.W. Linear Least Squares Computations; Marcel Dekker, Inc.: New York, NY, USA, 1988; ISBN 0-82-477661-5. [Google Scholar]
  59. Russell, W.S. Polynomial Interpolation Schemes for Internal Derivative Distributions on Structured Grids. Appl. Numer. Math. 1995, 17, 129–171. [Google Scholar] [CrossRef]
Figure 1. SEM images before (left) and after (right) the FIB milling process after drilling up to a depth of 1.85 µm to achieve a ring-core with a diameter of 3.0 µm.
Jmmp 08 00144 g001
Figure 2. Influence of percent of localization on elastic strain relaxation and percent range of relative error of elastic strain determination.
Jmmp 08 00144 g002
Figure 3. The distribution of x - and y -components of displacement along the x - and y -axes and linear fitting functions as a result of the FIB-DIC calculations before (top row) and after (middle row) outlier removal and calculations of algorithm of the hDIC technique (bottom row).
Jmmp 08 00144 g003
Figure 4. Slope of linear fitting functions with 95% confidence bounds (elastic strain relaxations) and percent range of relative error of elastic strain determination of FIB-DIC calculations with and without outlier removal and calculations of algorithm of hDIC technique.
Jmmp 08 00144 g004
Figure 5. Two-dimensional contour maps of final displacements calculated by FIB-DIC technique (top row) and algorithm of hDIC technique (bottom row).
Jmmp 08 00144 g005
Figure 6. Elastic strain relaxation and percent range of relative error of elastic strain to quantified elastic strain as function of drilling depth.
Jmmp 08 00144 g006
Disclaimer/Publisher’s Note: The statements, opinions and data contained in all publications are solely those of the individual author(s) and contributor(s) and not of MDPI and/or the editor(s). MDPI and/or the editor(s) disclaim responsibility for any injury to people or property resulting from any ideas, methods, instructions or products referred to in the content.

