Abstract
Heat storage is an emerging field of research, and, therefore, new materials with enhanced properties are being developed. Examples of phase change materials that provide high heat storage are inorganic salts and salt mixtures. They are commonly used for industrial applications due to their high operational temperature and latent heat. These parameters can be modified by combining different types of salts. This paper presents the experimental study of the impact of the composition of binary salts on their thermophysical properties. Unlike the literature data, this article provides a detailed analysis of the phase change process in both directions: solid–liquid and liquid–solid. The results indicate that the highest latent heat was observed for a 70% NaNO3 content in the NaNO3–KNO3 mixture. Therefore, when this salt is used for heat storage, the most favorable choice is a 70:30 ratio, which provides the highest heat storage density and the lowest phase transition temperature. In the case of the NaNO3–NaNO2 mixture, the highest value of latent heat occurs for a ratio of 80:20, resulting in phase transition temperatures of 267.0 °C for the solid–liquid transition, and 253.5 °C for the liquid–solid transition. For heat storage applications, it is recommended to use pure NaNO2 salt instead of the NaNO3–NaNO2 mixture.
1. Introduction
In the last 25 years, a global increase in energy production by 56% has been observed, which was primarily driven by the development of Asian countries [1,2]. Such a high demand for energy has influenced both the development and increased the use of devices that generate energy from renewable sources. These sources compete with conventional ones, leading to the challenge of matching the amount of energy produced to the current demand. Unfortunately, lower energy production from a source results in the decreased efficiency of energy generation. Additionally, there is an issue of the mismatch between energy supply and demand, which variates not only annually, but also daily. Therefore, energy storage in various forms is required to mitigate the supply–demand mismatch.
Among the energy storage technologies, heat storage plays an important role, and the technologies with the highest TRL values include water heat storage. This is due to the widespread availability of water, its low cost, and its relatively high thermal capacity. However, this technology is significantly limited by the operating temperature range, which primarily does not exceed the boiling point of water. Extending the temperature range requires pressurized systems, elevates investment costs, and reduces reliability. A major disadvantage of water heat storage is also its considerable size [3,4]. Therefore, finding new materials would significantly reduce the size of the storage, while simultaneously increasing the stored heat density.
The process of the solid–liquid phase change increases the heat storage capacity, especially in a narrow temperature range, where phase change occurs. This method significantly increases the volumetric heat storage density—up to several times when compared to water. Pagkalos et al. [5] presented a comparison of two heat storage tanks filled with water and A44 paraffin. The heat capacity of sensible heat storage with water was equal to 0.015 kWh, while PCM heat storage was 0.061 kWh, which results in a four-times-larger heat capacity at the same volume.
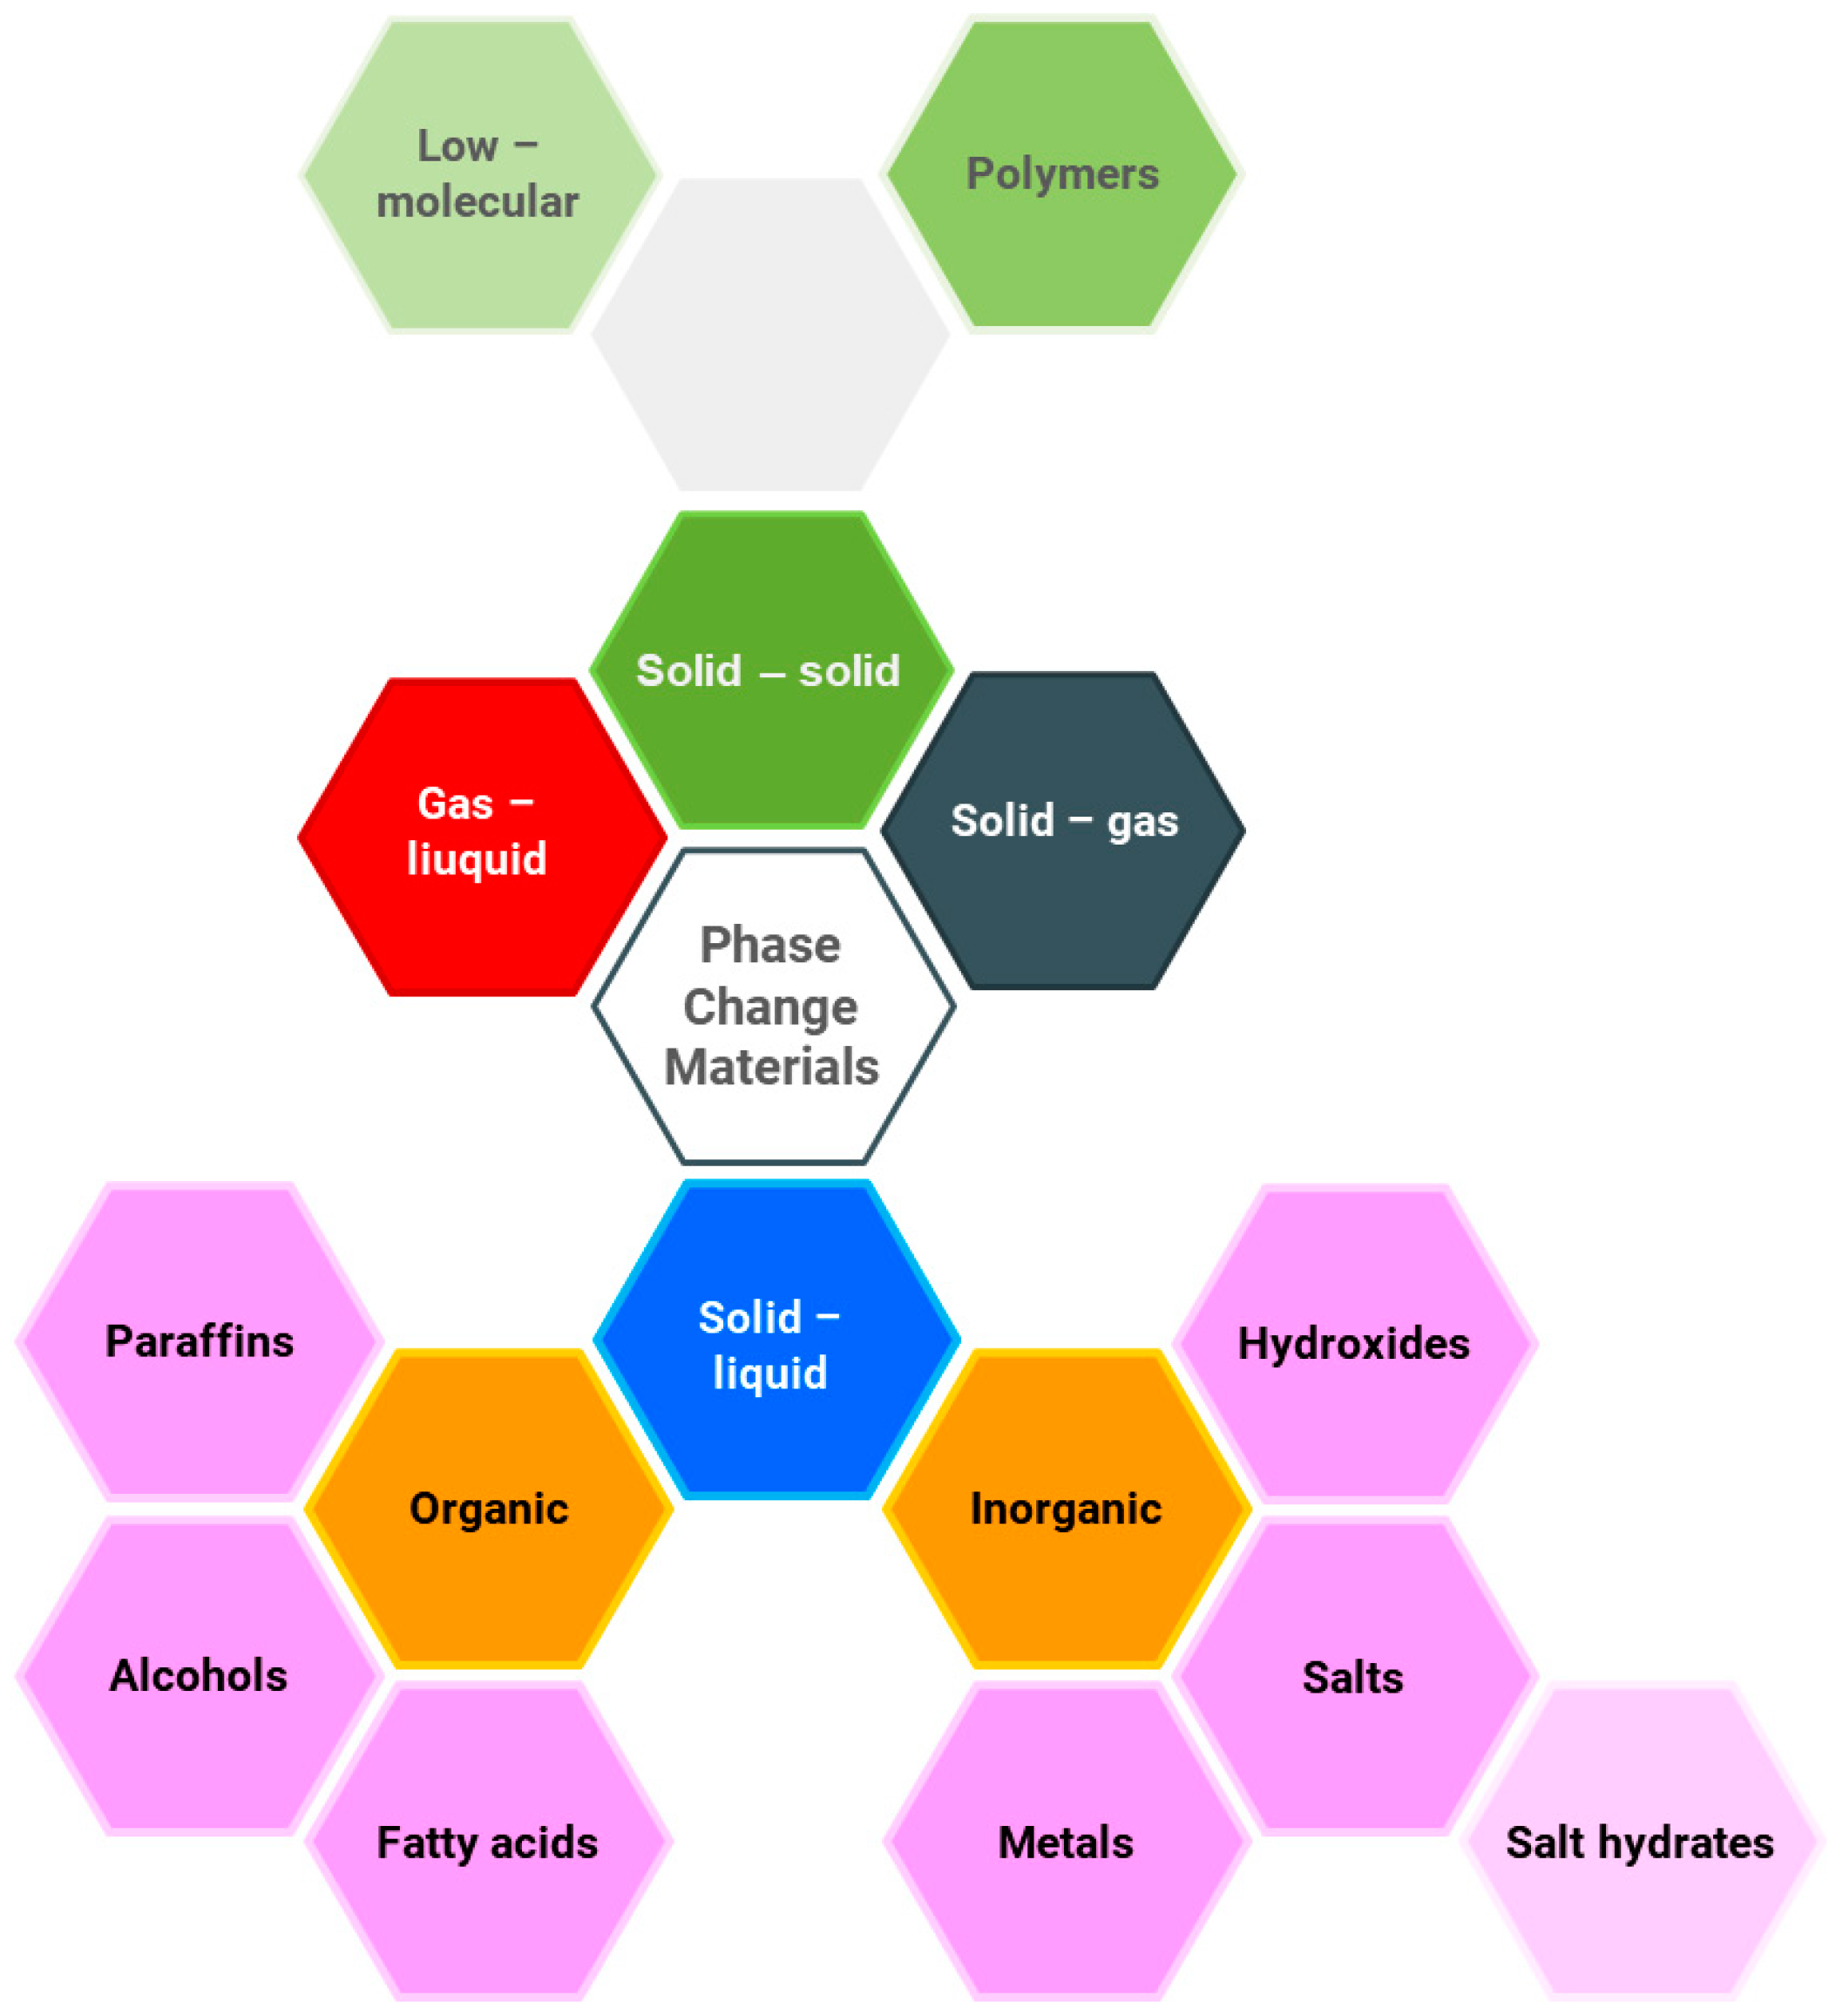
A key advantage of this process is the constant phase change temperature, which can be seen to be beneficial, e.g. for stabilizing fluctuations in heat [6]. The materials used for phase change heat storage (PCM) can be divided based on the phase change type: solid–solid, gas–liquid, solid–gas, and solid–liquid, as illustrated in Figure 1.

Figure 1.
Classification of phase change materials (PCMs), based on [7].
Solid–liquid phase change materials involve both organic and inorganic materials. Organic compounds include paraffins, alcohols, and fatty acids, while inorganic compounds consist of salts, hydroxides, metals, and salt hydrates. Another group comprises eutectic mixtures of organic or inorganic substances. In [8], a comprehensive review of PCMs is presented, including their thermophysical properties and a discussion of the methods for selecting appropriate materials for the analyzed process. The most commonly used phase change materials are inorganic salts and paraffins. This is due to their low cost and the lack of significant operational drawbacks. Paraffins are used in low- and medium-temperature processes; they are non-corrosive, chemically stable, and can be easily integrated with other materials. Eutectic salt mixtures are chosen for medium- and high-temperature applications, and are characterized by good thermal conductivity. Salts are also used for the chill [9] and low-temperature heat storage [10].
The phase change temperature range of paraffins goes up to 135 °C. In the case of salt mixtures, the phase change temperature range shifts towards higher values. For example, the eutectic mixture Na2CO3–NaCl has a phase change temperature of 637 °C [11]. The latent heat of salts and paraffins is similar, ranging from 120 to 280 kJ/kg for salts and from 180 to 250 kJ/kg for paraffins [12,13]. Both the temperature and latent heat of the phase change of PCMs are the two most important parameters that determine their suitability for a given process.
Both paraffins and salt mixtures have wide applications in industrial processes. Paraffins are used as an additive in building materials to maintain a constant temperature inside a building. Another application of paraffins includes their application for temperature-sensitive products, such as pharmaceuticals and food products [14]. In the electronics industry, paraffins are used in cooling systems for electronic components. Additionally, paraffins are utilized in smart textiles to regulate the temperature of clothing, in turn, enhancing comfort [15].
Currently, heat storage processes using phase change involve both single- and multi-component salts. Selecting a single-component salt with the desired parameters is challenging due to their thermophysical properties. Formulating multi-component salts allows us to obtain thermophysical properties that are significantly different from those of the individual components of the mixture. An example is Hitec salt, which is composed of three inorganic salts: NaNO3–KNO3–NaNO2 (7%:53%:40%). Table 1 presents the thermophysical properties and individual components of Hitec salt.

Table 1.
Thermophysical properties and individual components of Hitec salt [16].
The composition of multi-component PCMs also affects both the phase change temperature and latent heat values [17]. Additional advantages of preparing salt mixtures include an increased heat storage density, improved thermal conductivity, thermal stability at high temperatures, resistance to undesirable exothermic chemical reactions, low cost, and non-toxicity. Salt mixtures as phase change materials have several advantages when compared to paraffin-based materials. They include a higher thermal conductivity, non-flammability, a wide range of operating temperatures, lower cost, chemical stability, and lower environmental impact. A comparison of some selected properties of paraffins and salt mixtures is provided in Table 2. The materials were selected to show the lowest and highest melting point.
Table 2.
Examples of the thermal properties of the selected salt, salt mixtures, and paraffins.
The use of a salt mixture as both a heat storage material and a heat transfer fluid (HTF) is presented in [20]. The paper details the method for selecting materials for the applied process.
In [21], new salt compositions with operating temperatures ranging from 300 °C to 600 °C were proposed for use in concentrated solar power (CSP) plants. The study utilized four carbonate-based salt mixtures (Na2CO3, K2CO3, and Li2CO3) and two chloride-based salt mixtures (NaCl, MgCl2, and KCl). Thermophysical properties such as temperature, latent heat, and specific heat were measured using differential scanning calorimetry. The authors found that the calculated thermophysical properties of the salt mixtures diverged from the measured results.
In [22], a new mixture, NaCl–NaF–Na2CO3, was also developed for CSP applications. This mixture is advantageous due to its high thermal stability, and the fact that it maintains stability up to 750 °C, and even short-term stability up to 800 °C. This salt is 35% cheaper when compared to the commonly used NaNO3–KNO3 salts in solar systems.
Study [23] presents the results of research on the thermophysical properties and thermal stability of a new three-component salt mixture based on cuprous chloride (CuCl), potassium chloride (KCl), and sodium chloride (NaCl) for CSP applications. To enhance its thermophysical properties, 5% to 15% of CaCl2 was added. It was found that a 7% addition of CaCl2 slightly lowered the phase change temperature from 144 °C to 138 °C, but, at the same time, increased the operating temperature from 653 °C to 700 °C, thereby improving its thermal stability. The developed salt mixture has a very wide operating temperature range of up to 700 °C, which is significantly better than commonly used nitrate-based salt mixtures (Solar Salt, Hitec), as well as chloride-based salt mixtures. The addition of CaCl2 increased the heat capacity of the mixture from 0.74 kJ/(kg·K) to 0.85 kJ/(kg·K). However, the addition did not affect the thermal conductivity of the salt mixture, which was 0.72 W/(m·K), significantly higher than the conductivity of the Solar Salt and Hitec mixtures. These studies showed that even a small addition of another eutectic salt may significantly improve the properties of the entire mixture.
The application of salt mixtures in TES systems is determined not only by thermophysical properties, but also by thermal stability, which plays a crucial role. In study [24], the thermophysical properties of a binary salt mixture of CaCl2 (58 wt%) and LiCl (42 wt%) were examined. A thermal analyzer was used to measure the temperature and latent heat of melting and crystallization, as well as thermal stability. The mixture had a high melting temperature in the range of 480 °C to 520 °C, and a crystallization temperature between 390 °C and 480 °C. The latent heat of melting was 206.12 J/g, while the latent heat of crystallization was lower at 180 J/g. Thermal stability was investigated using TGA analysis by subjecting the salt sample to 30 cycles of melting and crystallization. The salt mixture showed significant instability, losing up to 21% of its mass in the first two cycles. In subsequent cycles, the mass loss was smaller and almost constant, at about 2% per cycle. Similar studies for other salt mixtures were conducted in [17,25]. In [26], 563 mixtures of two-, three-, and four-component salts were analyzed, which may be used in TES systems for a Brayton cycle generator using supercritical CO2. The authors estimated, using a mathematical model, the properties of the analyzed salt mixtures, such as the temperature and latent heat of the phase transition, density, thermal conductivity, and cost. The binary mixture of NaCl + CaCl2 is highly cost-effective and widely used in industrial application.
Research is also being conducted to improve the thermal stability of salt mixtures [27]. A new PCM polyelectrolyte composite was developed using sodium dextran sulfate as an additive. A significant increase in the thermal stability of the modified composite was observed. The material showed no degradation after more than 100 cycles of melting and crystallization. At the same time, the heat capacity increased by 290% when compared to pure hydrated salt, and the thermal conductivity increased by about 20%.
In [28], the thermophysical properties of a binary salt, LiNO3–NaCl, were experimentally optimized. Using TGA/DSC analysis, it was found that the phase transition temperature was the lowest, at 222.6 °C, for a mass ratio of LiNO3–NaCl of 88:12. The phase transition latent heat was also the highest at 389.3 J/g. Simultaneously, the degradation temperature of the salt mixture increased from 560 °C to 620 °C.
In [29], nanoparticles of Al2O3 and TiO2 were used as additives to alter the thermophysical properties of the binary salt NaNO3–KNO3. It was observed that, for an Al2O3 mass content not exceeding 3%, the phase transition temperature decreased, while the phase transition latent heat increased by 23.3%. However, when the Al2O3 content exceeded 3%, the trends reversed: the phase transition temperature increased, and the phase transition latent heat decreased by 14.23%. Therefore, the highest increase in phase transition latent heat occurred at an Al2O3 mass content of ca. 3%. The addition of TiO2 nanoparticles caused the phase transition temperature to decrease as its concentration increased, while the phase transition latent heat increased by up to 32.2%. Decreasing the concentration of TiO2 nanoparticles caused the opposite changes in phase transition temperature and latent heat. Increasing the content of Al2O3 and TiO2 nanoparticles also elevated the thermal conductivity of the mixture. After adding 3% (m/m) of Al2O3 and TiO2 nanoparticles, the thermal conductivity increased by 8.30% and 8.10%, respectively.
In study [30], it was noted that the method of preparing a salt mixture can significantly affect its thermophysical properties. The thermophysical properties of a binary NaNO3–KNO3 mixture were examined by preparing samples using six methods: tap water dissolution, dissolution, static melting, boiling evaporation, stirring evaporation, and grinding. It was found that the dissolution method leads to an inhomogeneous salt mixture due to the different solubilities and densities of NaNO3 and KNO3. A better homogeneity of the mixture was obtained with the stirring evaporation and boiling evaporation methods. In the case of dissolving salts in tap water, the impurities affect the DSC melting curves at the peak point. The grinding method is recommended, provided that the particle size of the mixture is less than 96 µm.
Apart from the thermophysical properties, the cost of the material is an important selection criterion. In [31], an economic analysis of commonly used salt mixtures in solar systems was conducted. Based on the analysis, three commercial salt mixtures were selected: Hitec (40% NaNO2, 7% NaNO3, 53% KNO3), HitecXL (48% Ca(NO3)2, 45% KNO3, 7% NaNO3), and Solar Salt (40% KNO3, 60% NaNO3). These salts have been used in CSP in Spain (CESA–1, Andasol) [32], Italy (Eurelios Station), and the USA (Solar Tres and Solar Two Station) [33,34,35]. They are also used as heat transfer fluids (HTFs), for example, in the Archimede power station (743 MW) in Priolo Gargallo, Syracuse, Italy [36,37]. In [38], an analysis was also conducted on the possibilities of reducing the costs of TES systems with encapsulated PCMs. It was found that the most favorable solution is to use SS304L steel as the tank material, inexpensive internal insulation, and ceramic coatings in both the tank and the capsules. Chloride-based salts are the most cost-effective.
In the literature, authors usually report the same phase change temperature for both the melting and solidification processes. In real conditions, the phase change is not an isothermal process and occurs over a certain temperature range [16,39,40]. The phase change temperature reported in the literature usually corresponds only to the peak point on the calorimetric curve. The phase change temperature range depends on the type of material, and typically varies from a few to several degrees Celsius, although materials with a larger phase change temperature range can also be found [41]. This fact is significant in the heat exchange process, and affects the melting and solidification of PCMs. Therefore, the article provides a detailed analysis of the phase change process in both directions: solid to liquid (S–L) and liquid to solid (L–S). For this purpose, it not only considers the peak phase change temperature, but also the onset and end temperatures of this process.
The studies presented in the literature review show that eutectic salt mixtures exhibit different thermophysical properties, depending on the quantity of mixed salts, their type, and the proportions of their mixing. This allows for the development of new phase change materials with desired parameters, and also the development of a methodology for their composition.
In [42], a computational study on predicting the phase change temperature of NaNO2, NaNO3, and KNO3 salt mixtures is presented. The solidus and liquidus curves obtained from the mathematical model were compared to the experimental values. However, in the study, a very simplified measurement setup was used. The solidus and liquidus temperatures were measured using a visual experiment that employed a thermocouple immersed in heated molten salt binary mixtures. The temperature was controlled until the salt began to liquefy.
The aim of the research presented in this article is to determine the impact of the composition of binary salt mixtures on their thermophysical properties. The study involved salt mixtures composed of NaNO2, NaNO3, and KNO3. Their phase change temperature range and latent heat were determined using the DSC method. The newly obtained materials were tested for their suitability for heat storage on a laboratory stand with a heat storage unit.
The literature generally reports the same phase change temperature for both melting and solidification. However, in real conditions, the phase change process is not isothermal and takes place over a range of temperatures. The phase change temperature commonly reported corresponds only to the peak on the calorimetric curve. The novelty of this study is its comprehensive analysis of the phase change process. It considers the onset and end points, and not only the peak temperature.
2. Materials and Methods
2.1. Phase Change Materials
For the research, custom mixtures of compounds composed of sodium nitrate (III) (manufacturer: Sigma Aldrich, analytical grade), sodium nitrate (V) (Sigma Aldrich, analytical grade), and potassium nitrate (V) (Sigma Aldrich, analytical grade) were prepared. The selected salts used in the study are the primary components of well-known high-temperature heat transfer fluids such as Solar Salt [43,44], Hitec [45,46], and Hitec XL [47,48]. These substances are chemically and thermally stable, and are characterized by high thermal capacity, a wide range of operating temperatures, and low corrosiveness towards many construction materials. Additionally, these salts occur naturally in large quantities, pose no threat to the environment, and are commonly used as components in mineral fertilizers. From the perspective of potential industrial-scale heat storage applications, their advantage lies in their high commercial availability and relatively low cost.
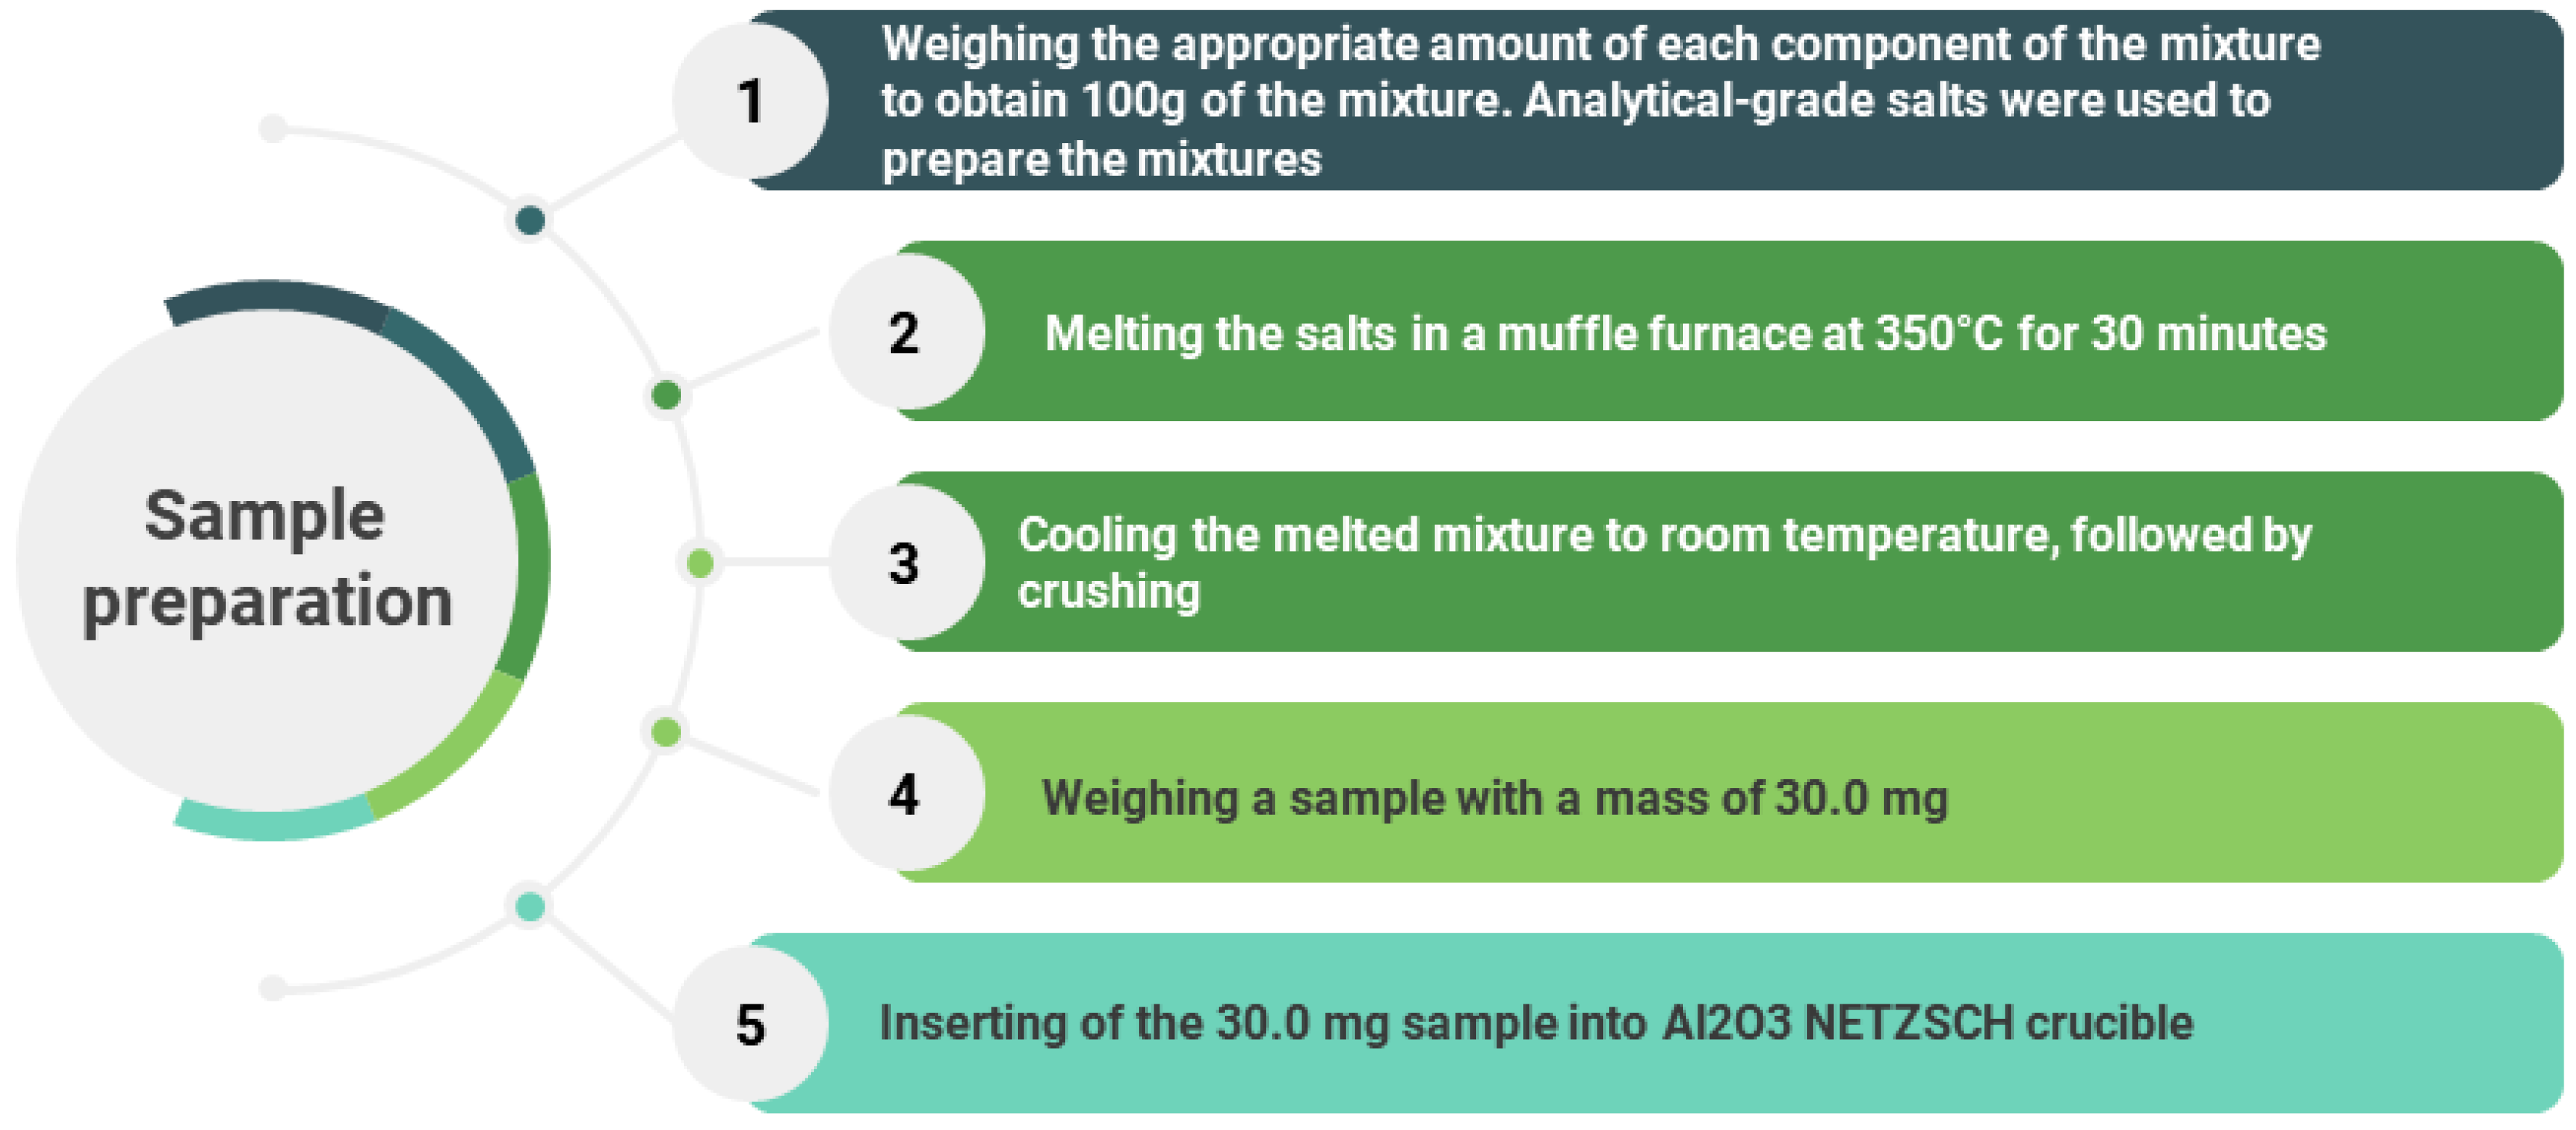
Samples of salt mixtures were prepared following the procedure presented in the infographic in Figure 2.

Figure 2.
Sample preparation methodology infographic.
The mixtures were prepared according to the composition shown in Table 3.
Table 3.
The composition of the phase change materials used in the study.
2.2. DSC–TGA Measurements
The study consisted of two stages. The first involved measuring the thermophysical properties of the PCMs, while the second stage involved measurements of the parameters of a thermal energy storage unit filled with the composed materials. For the study of the thermophysical properties, a NETZSCH thermal analyzer model STA 449 F3 Jupiter was used.
The analyzer is equipped with a platinum furnace, which can operate in a temperature range from room temperature to 1500 °C. The sample heating rate can be controlled in the range of 0.001 to 50 K/min. The built-in balance allows for sample mass measurements with an accuracy of 1 μg. Table 4 shows the measurement conditions which were used during the thermogravimetric analysis.
Table 4.
The measurement conditions which were used during the thermogravimetric analysis.
The thermogravimetric analyzer was used to conduct Differential Scanning Calorimetry—Thermo–Gravimetric Analysis (DSC–TGA) measurements in order to determine the following thermophysical properties of the developed salt mixtures: solid–liquid phase transition temperature, onset temperature of the solid–liquid phase transition, end temperature of the solid–liquid phase transition, liquid–solid phase transition temperature, onset temperature of the liquid–solid phase transition, end temperature of the liquid–solid phase transition, and latent heat.
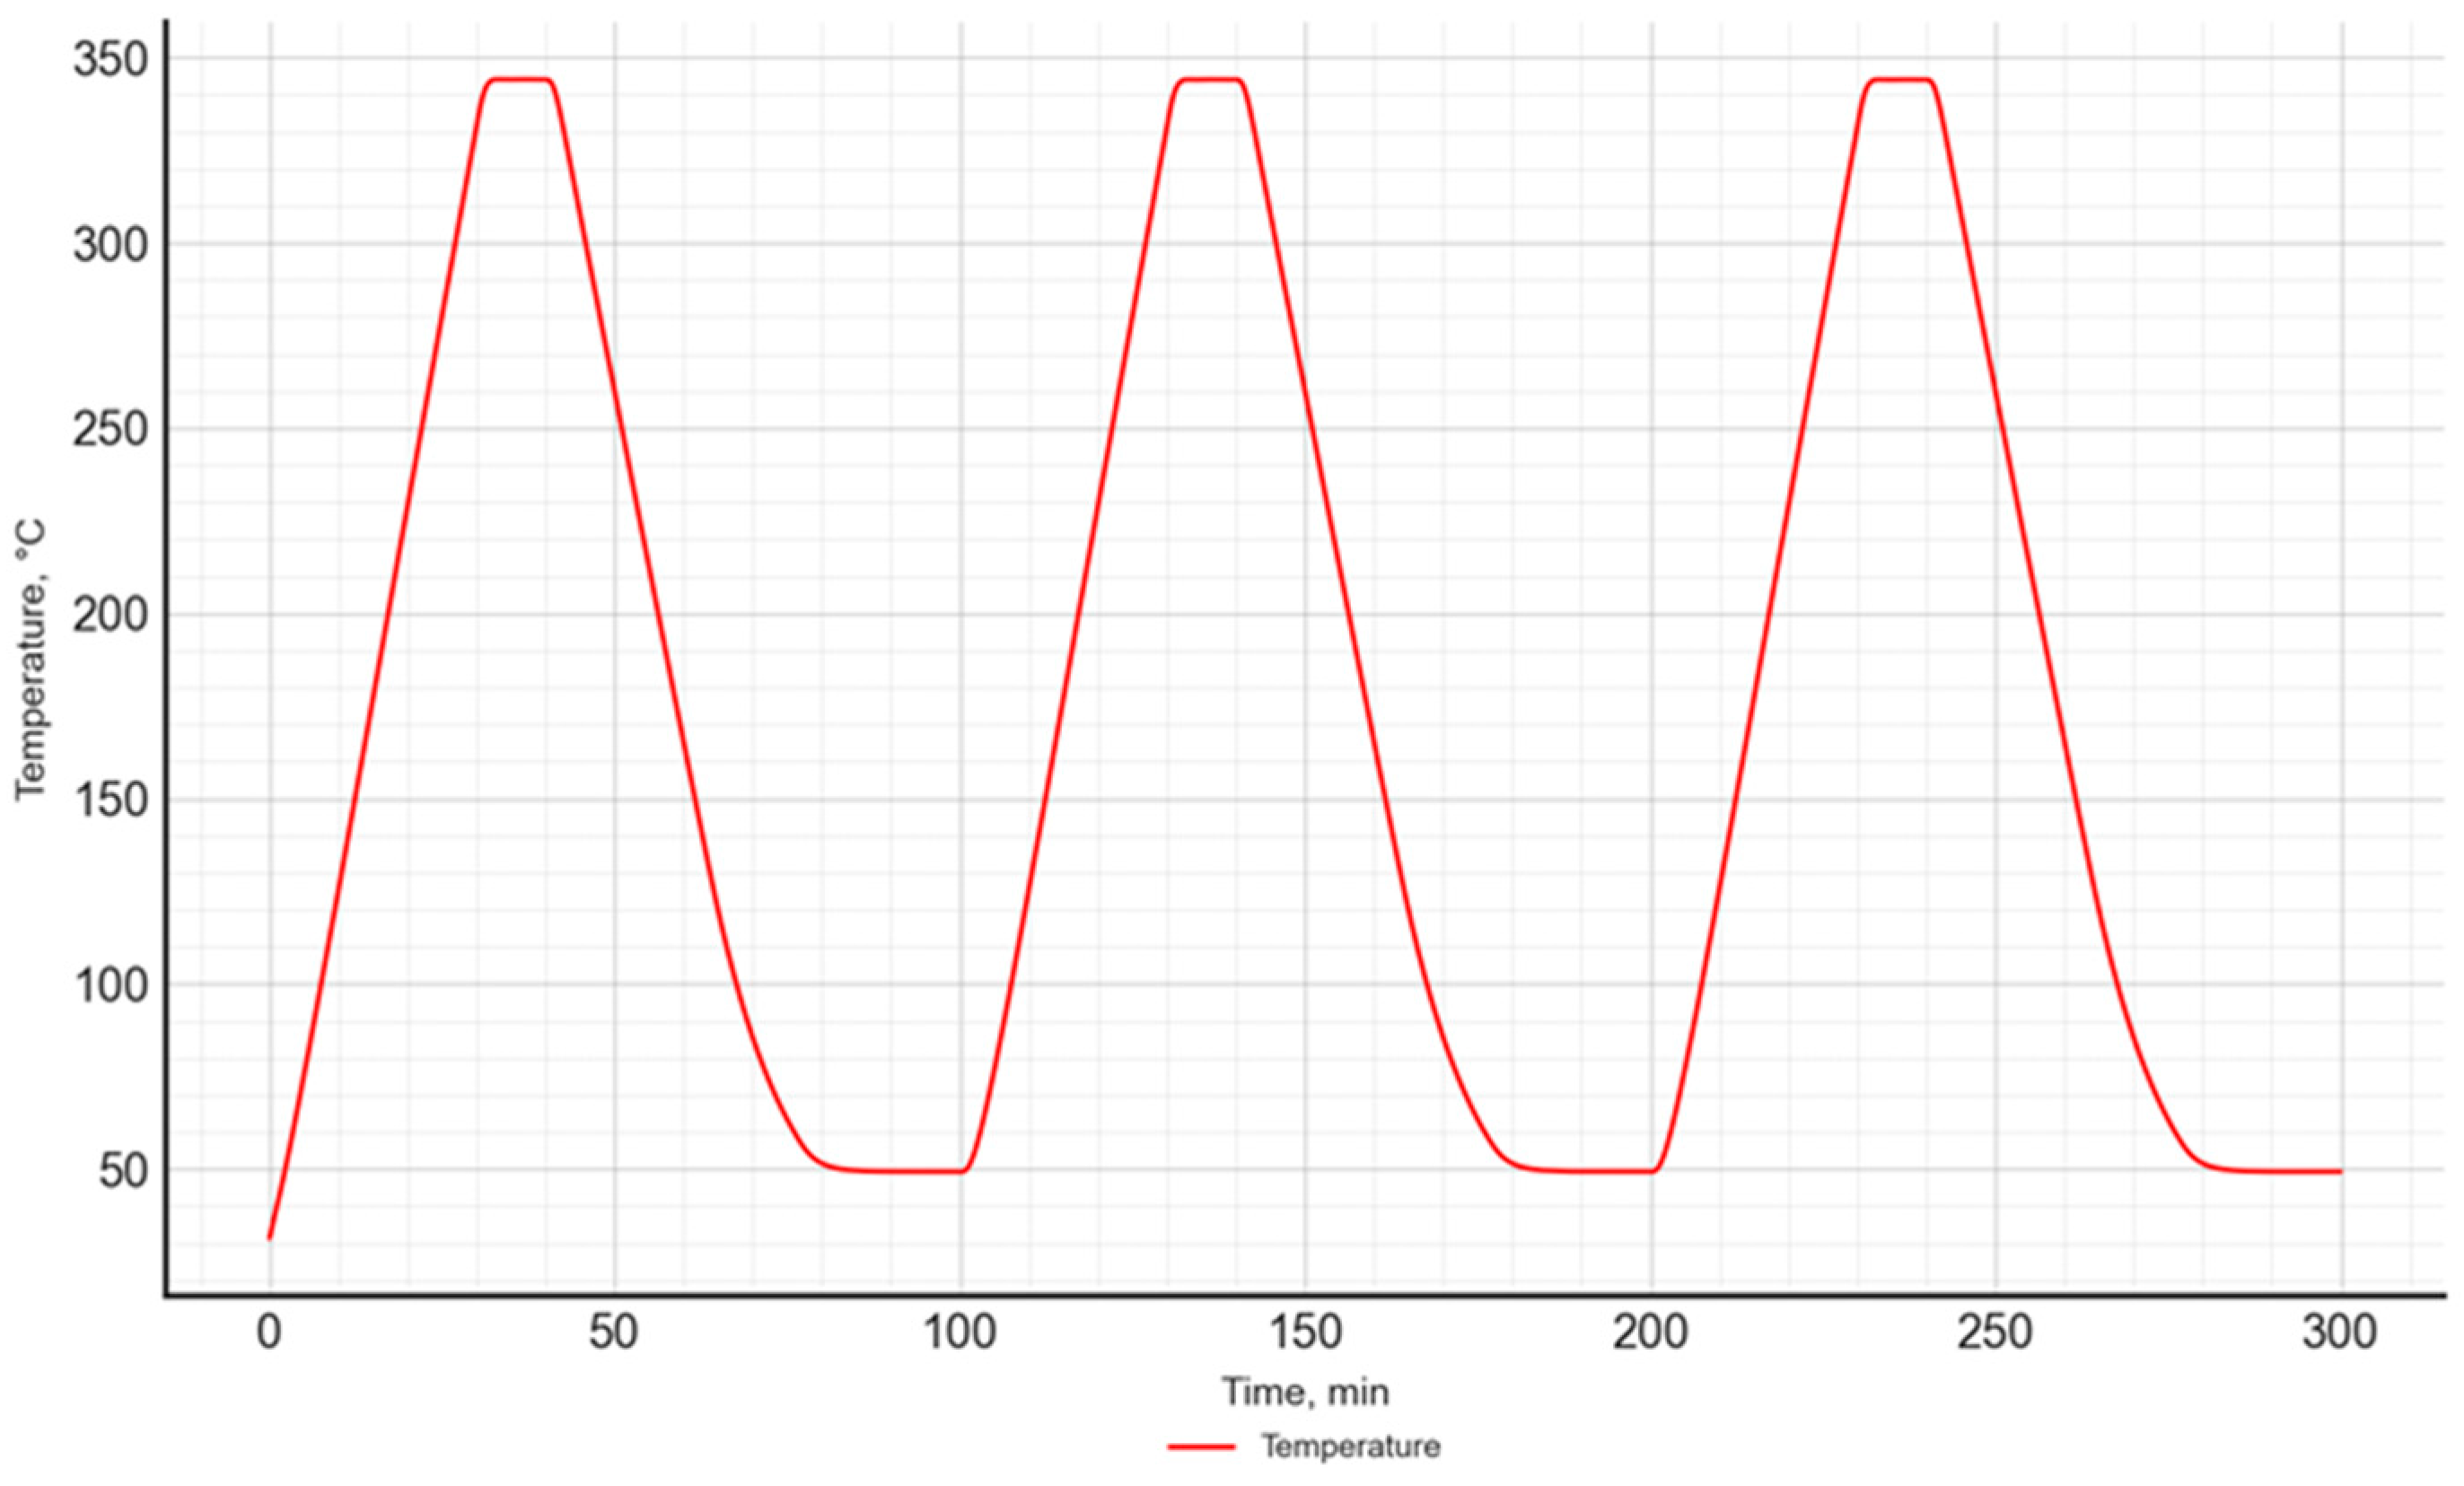
The study used a temperature program consisting of 3 heating and cooling cycles of the sample, which ensured result repeatability. A similar temperature program was used in previous studies conducted by the authors [49].
Each cycle consisted of a dynamic heating segment up to 350 °C at a heating rate of 10 K/min, an isothermal segment lasting 15 min, and a dynamic cooling segment (10 K/min) down to 50 °C. After each cycle, an isothermal segment lasting 20 min was included. The selection of individual parameters of the temperature program was based on experience gained from previous analogous studies. The temperature program is presented in Figure 3.
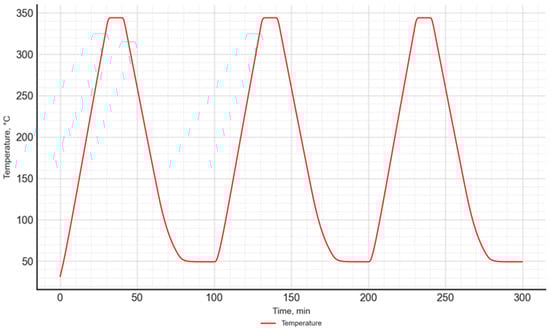
Figure 3.
The temperature program used in the DSC–TGA study.
2.3. Heat Storage Unit Measurements
The aim of this part of the work was to study the charging and discharging process of the laboratory thermal energy storage unit filled with the developed salt mixtures. The temperature distribution inside the PCM and the heat transfer fluid temperature was analyzed.
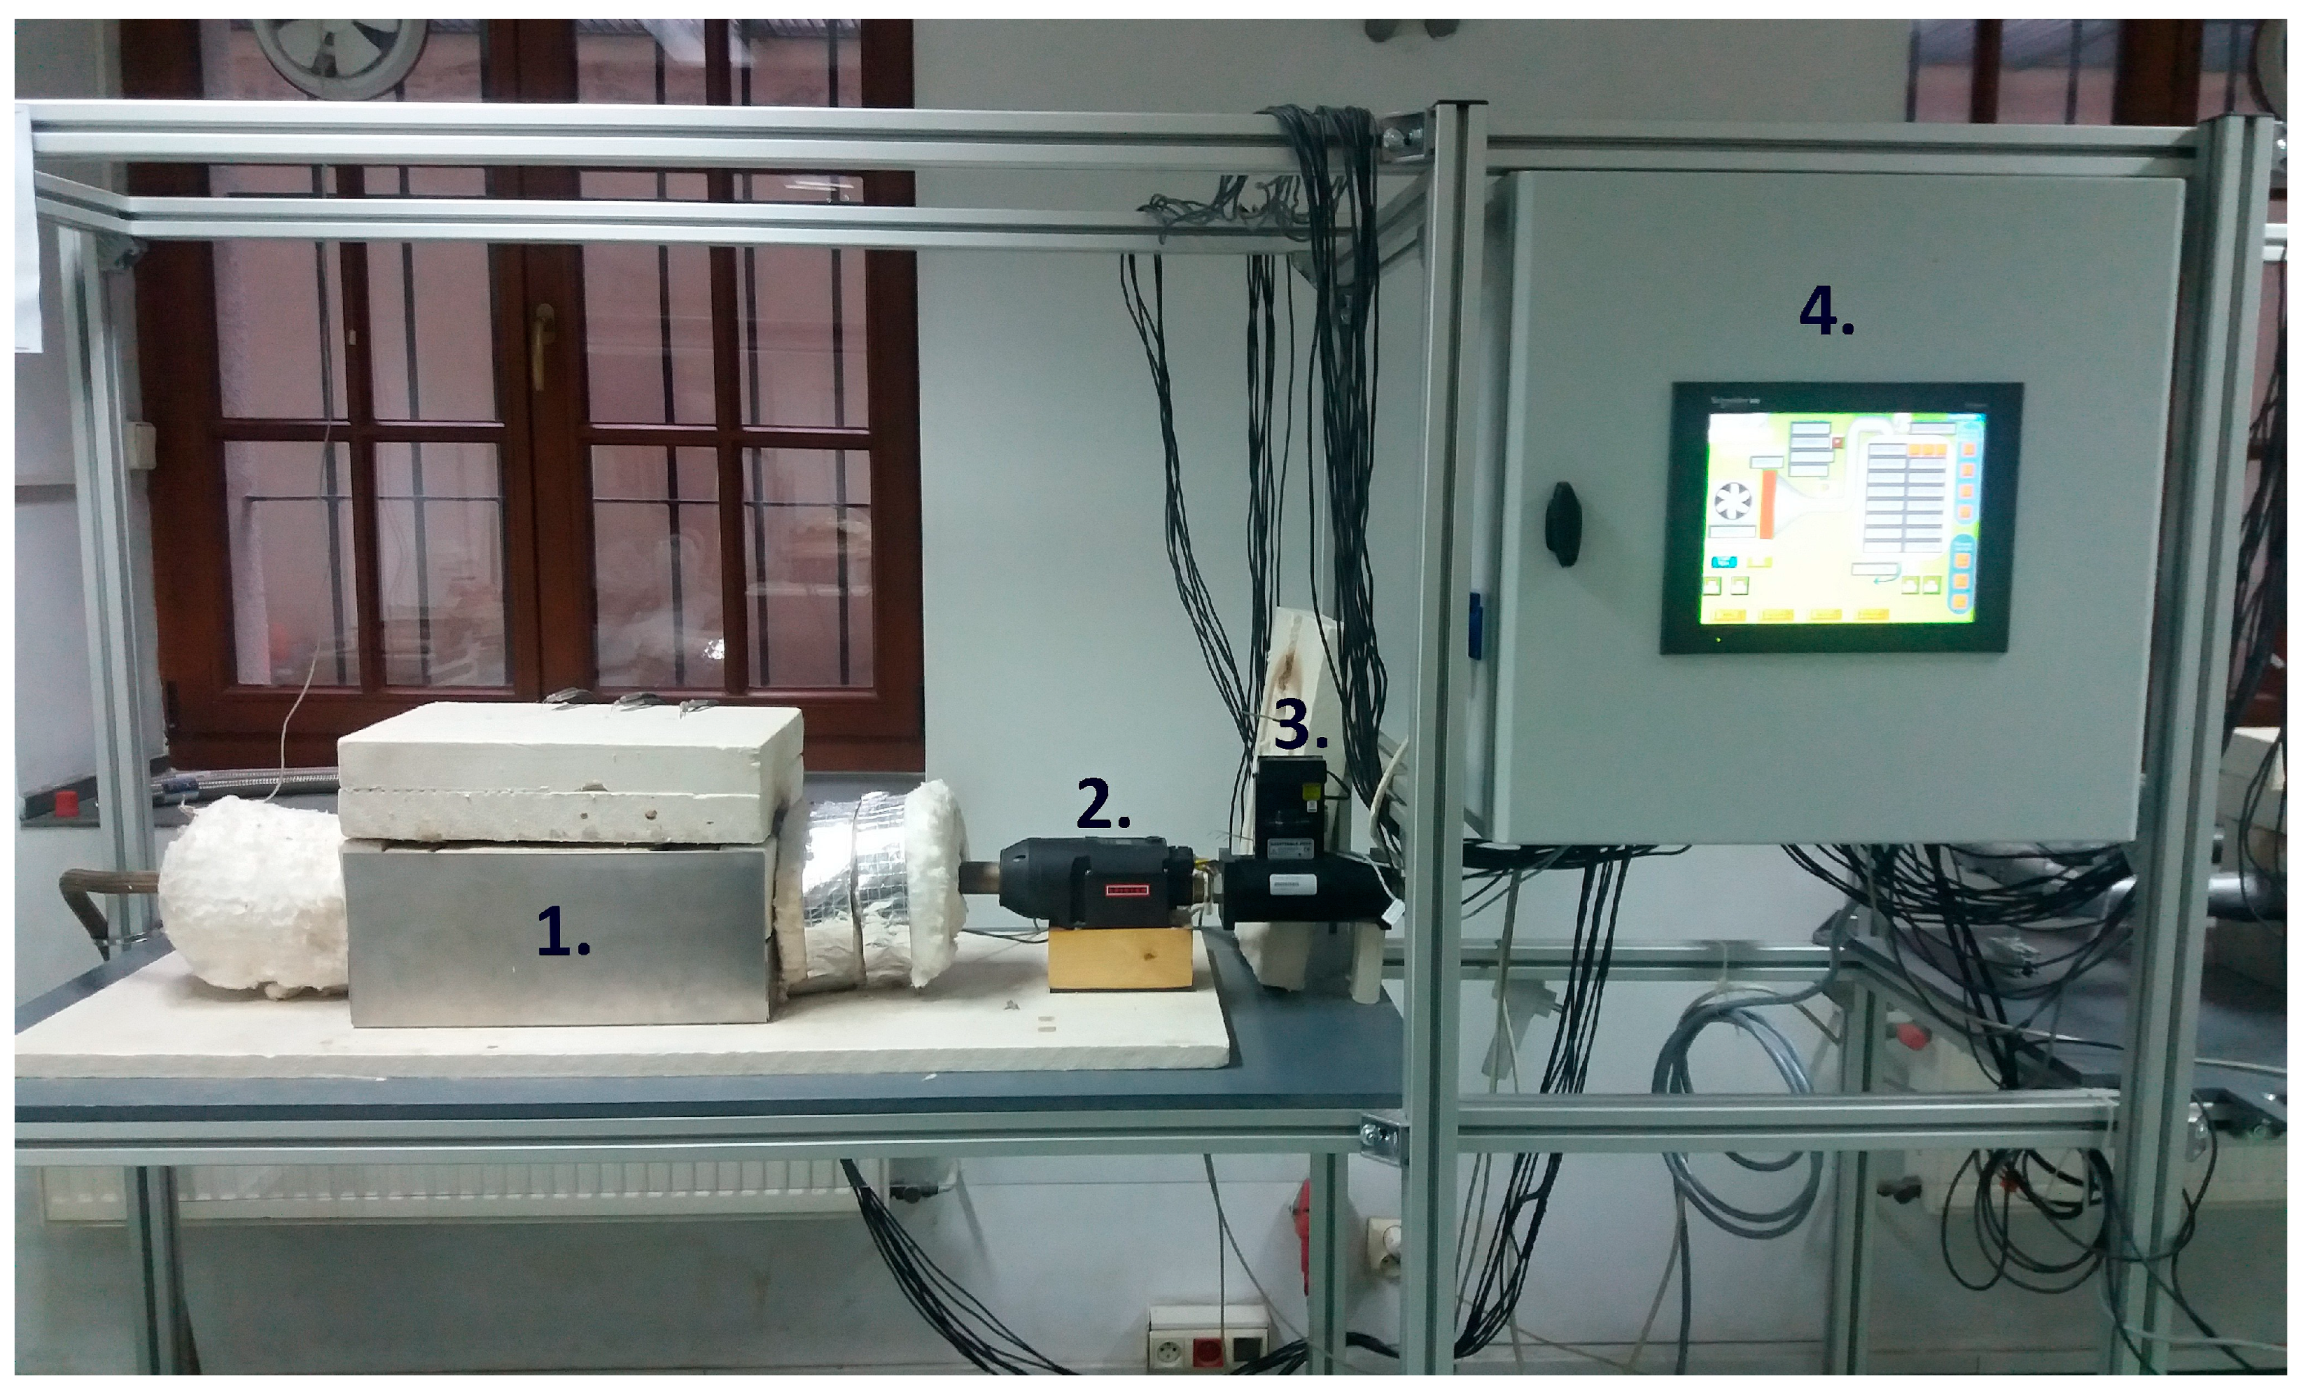
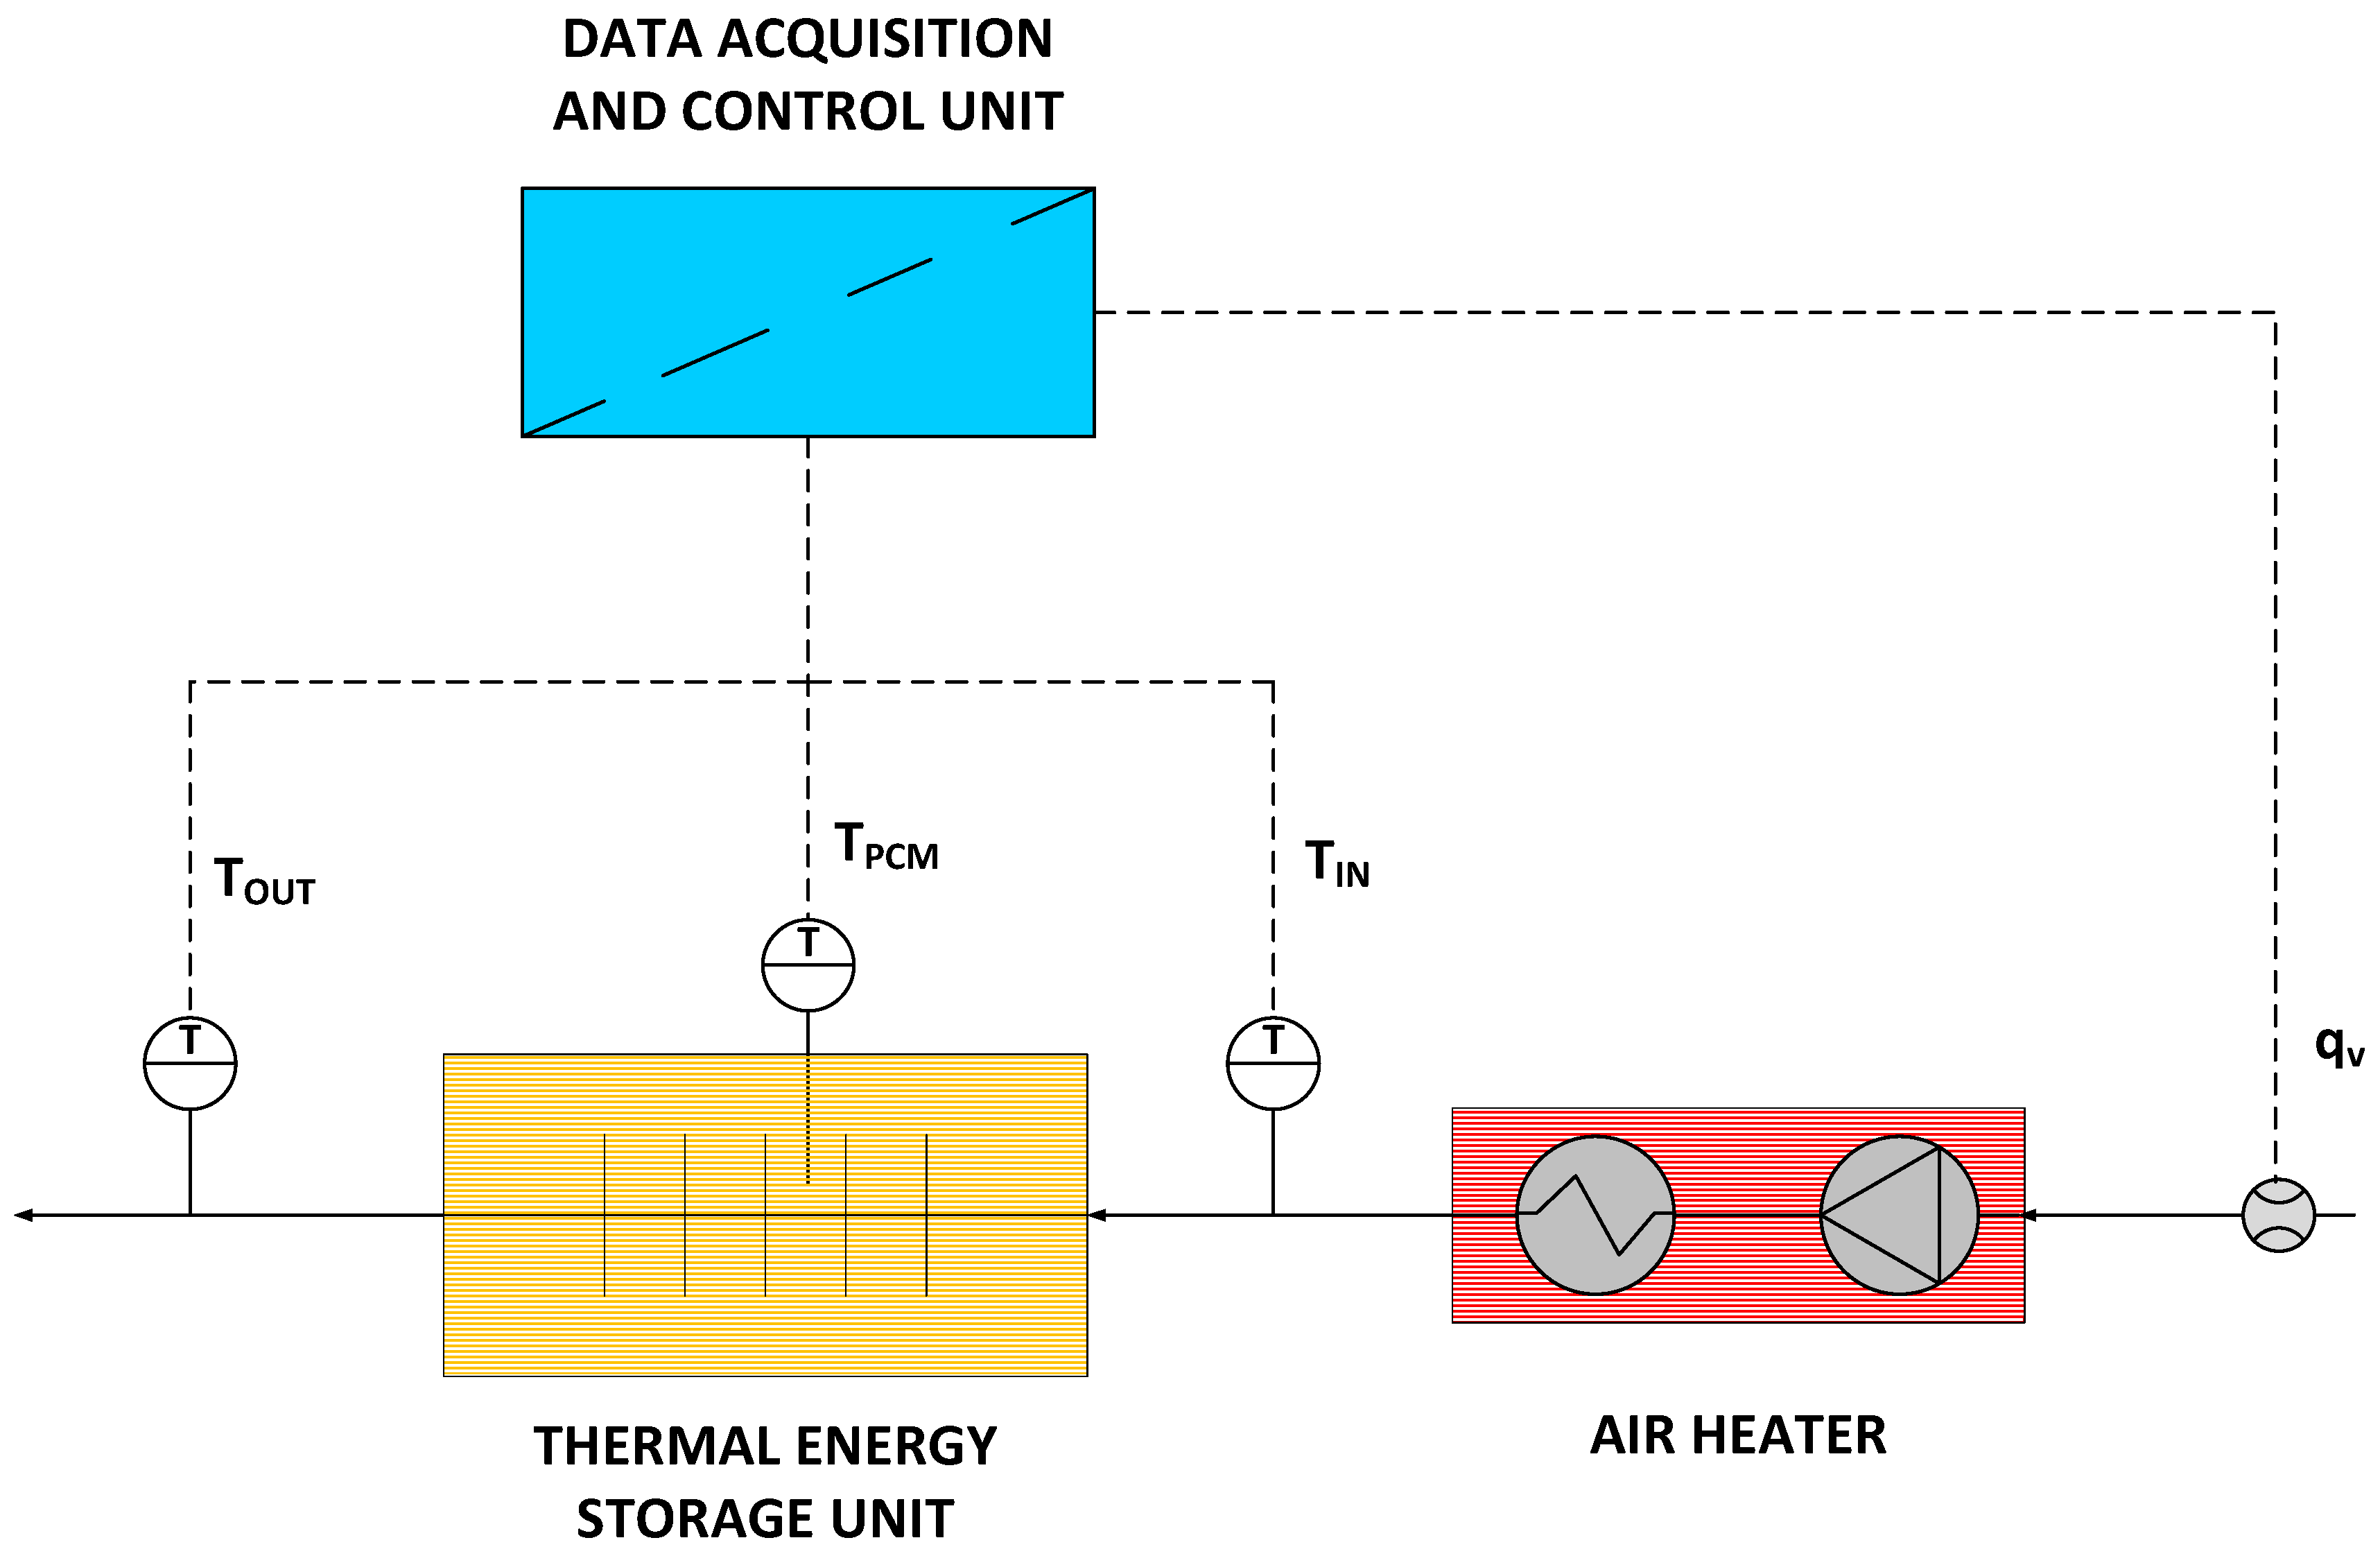
To investigate the parameters of the thermal energy storage unit, a custom laboratory setup was used. The setup is shown in Figure 4, while its scheme is presented in Figure 5. The setup consists of a thermal energy storage unit (1), an air heater (2), a flow meter (4), a control and data acquisition system (4), and thermocouples.
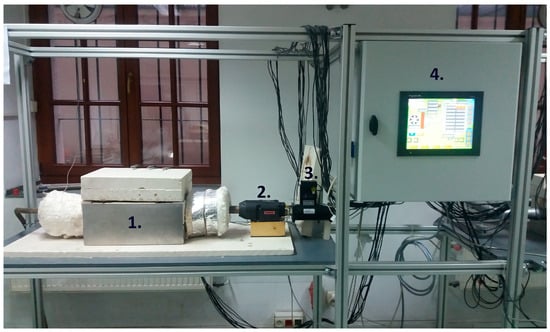
Figure 4.
Laboratory setup: 1—thermal energy storage unit, 2—air heater, 3—flowmeter, and 4—data acquisition and control unit.
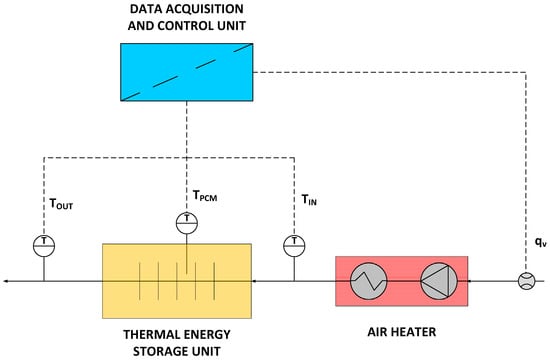
Figure 5.
Laboratory stand scheme.
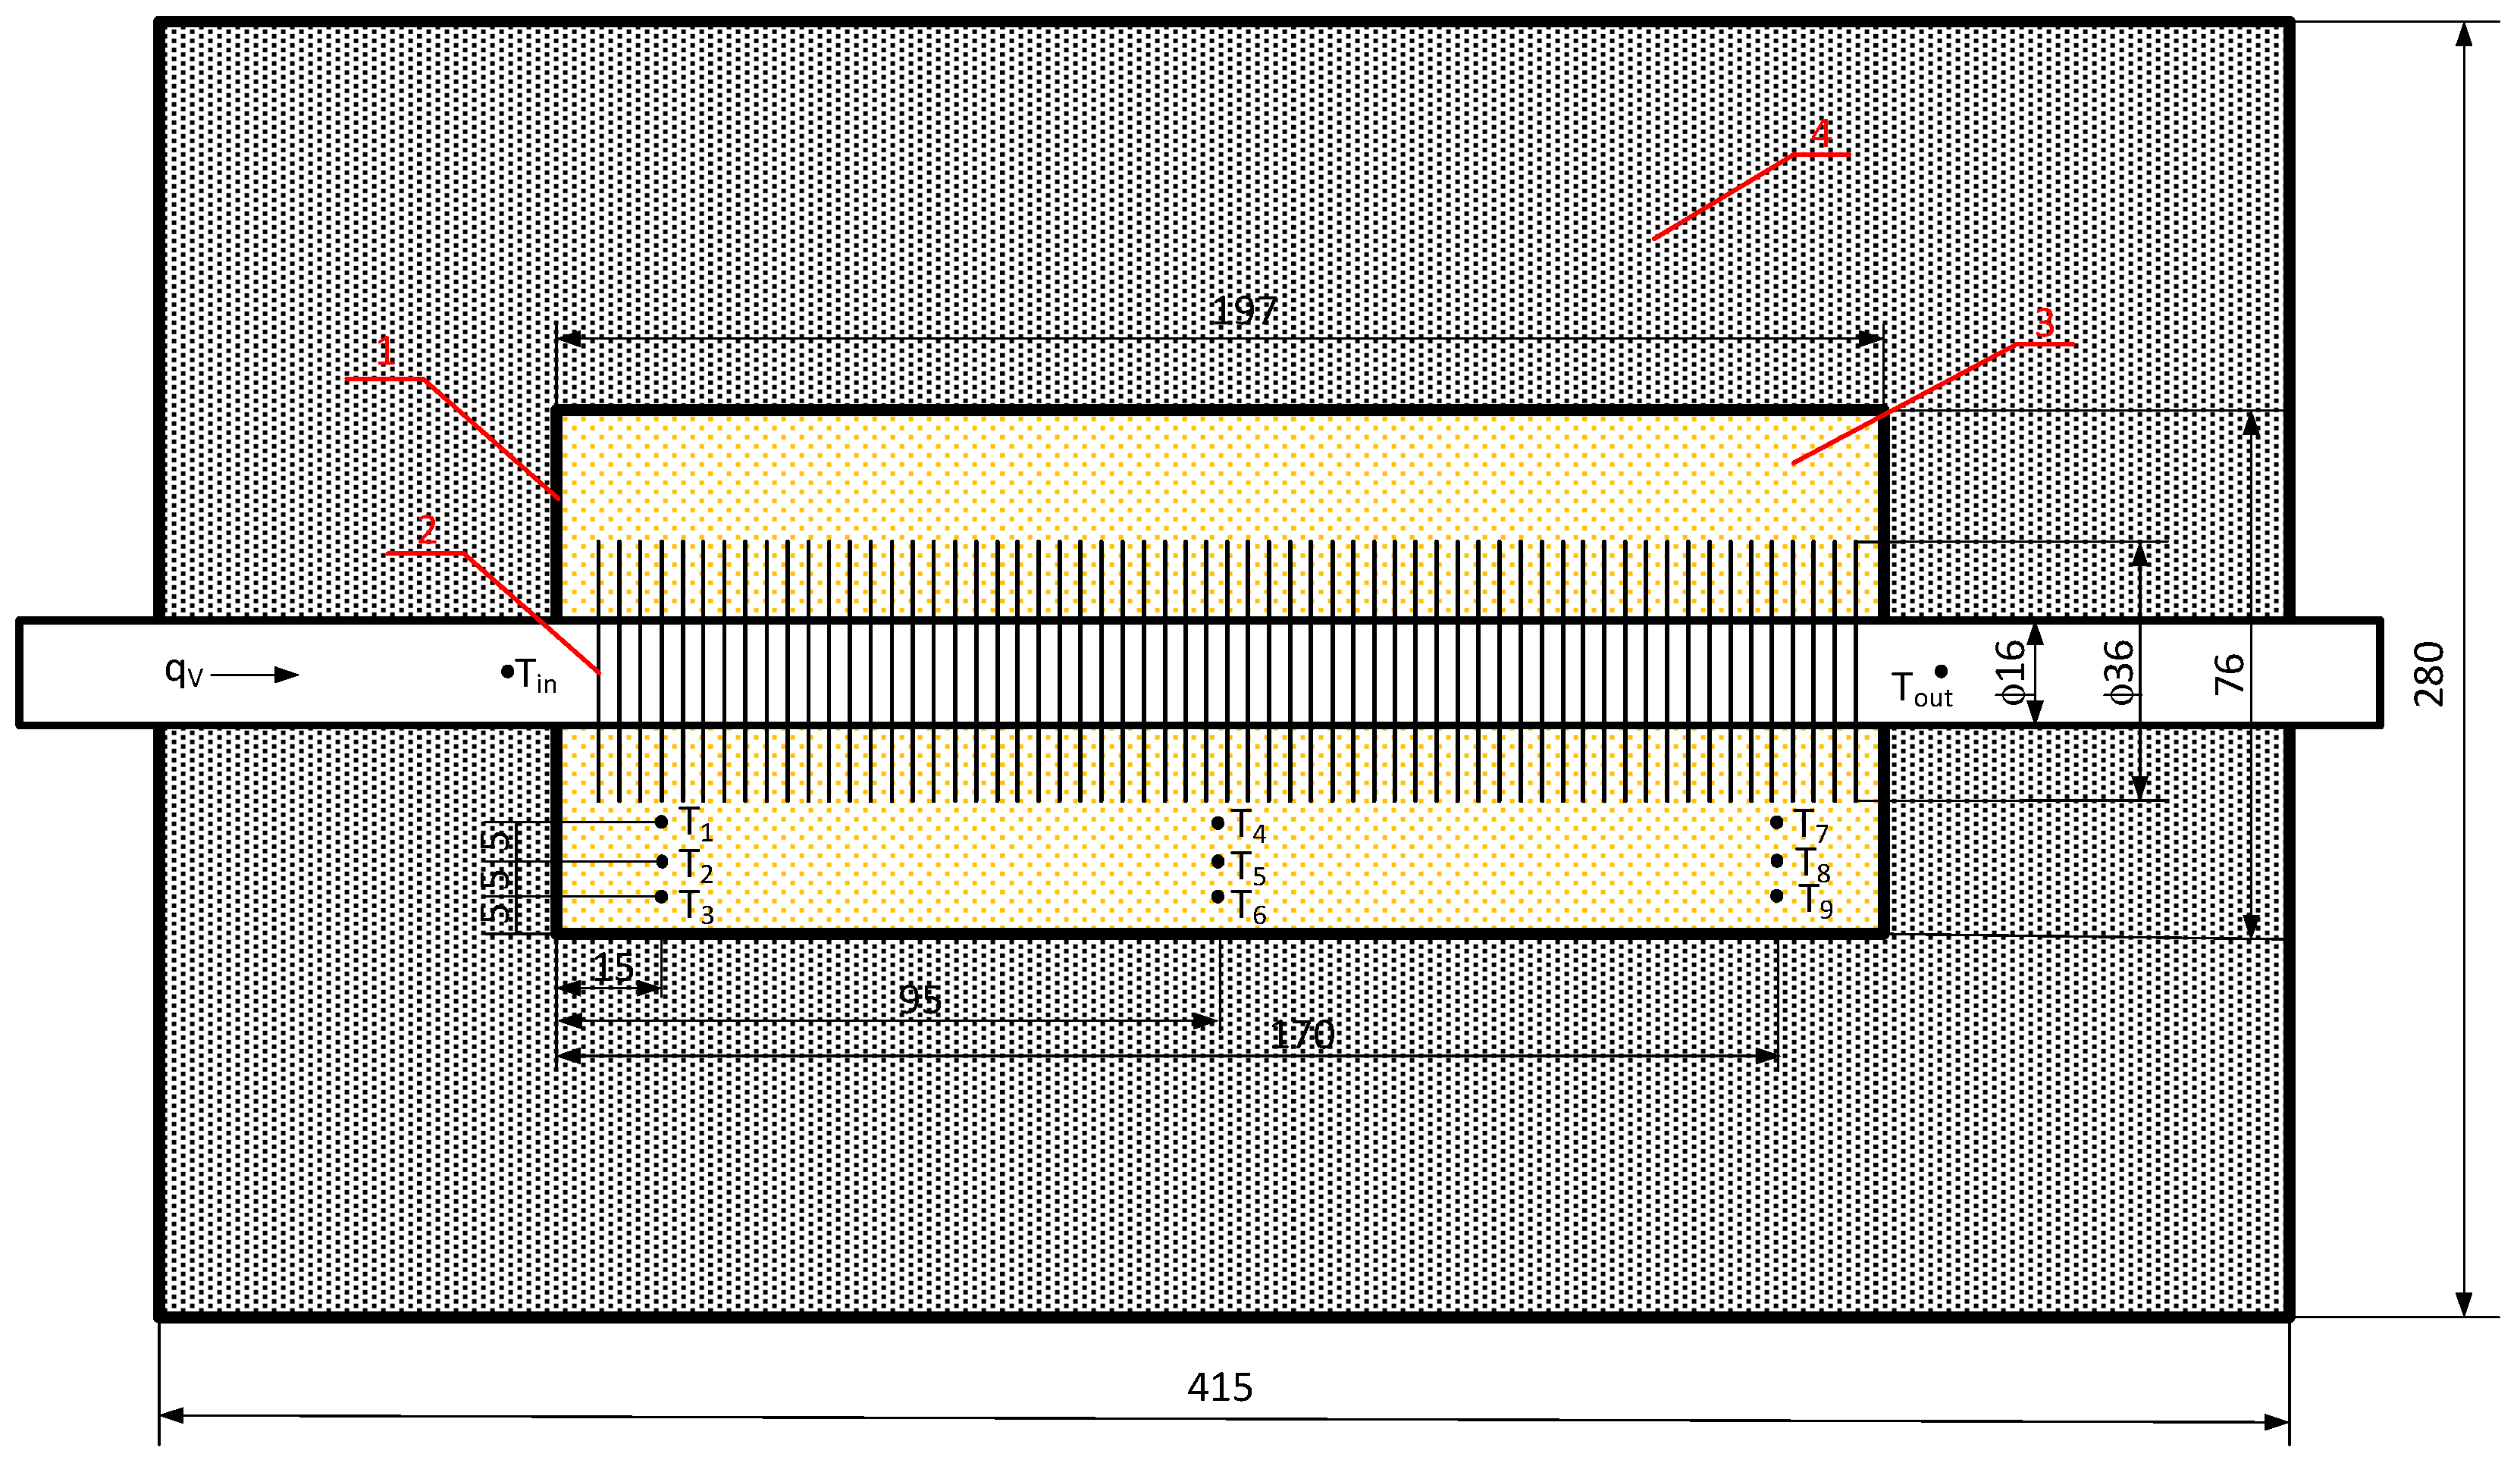
The main component of the setup (Figure 6) is the thermal energy storage unit, which includes a finned tube (2) made of stainless steel with an outer diameter of 19 mm and a wall thickness of 1.5 mm. The fins of the tube were made of aluminum, with a fin diameter of 36 mm and a total of 56 fins. The tube was placed in a stainless steel container (1) with internal dimensions of 197 × 76 × 85 mm. The entire assembly was placed in an outer shell that was also made of stainless steel with dimensions of 415 × 280 × 180 mm and closed with a cover. The space between the container and the outer shell was filled with insulation made of compressed mineral wool panels (4) resistant to high temperatures (up to 1200 °C). The temperature distribution of the phase change material (PCM) was measured using 9 type–J thermocouples arranged according to the diagram in Figure 6.
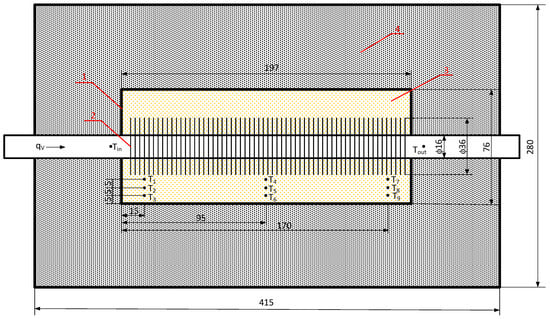
Figure 6.
Dimensions of the thermal energy storage unit and the arrangement of thermocouples: 1—inner stainless steel container, 2—finned tube, 3—PCM, and 4—compressed mineral wool panel insulation.
The heat storage unit was charged and discharged using air, the temperature and volume flow rate of which were adjusted by a 4.5 kW heater. The volume flow rate of the air was equal to 150 dm3/min during both the charging and discharging processes. During the charging of the heat storage unit, the air temperature was equal to 360 °C, while, during discharging, it was equal to the ambient temperature.
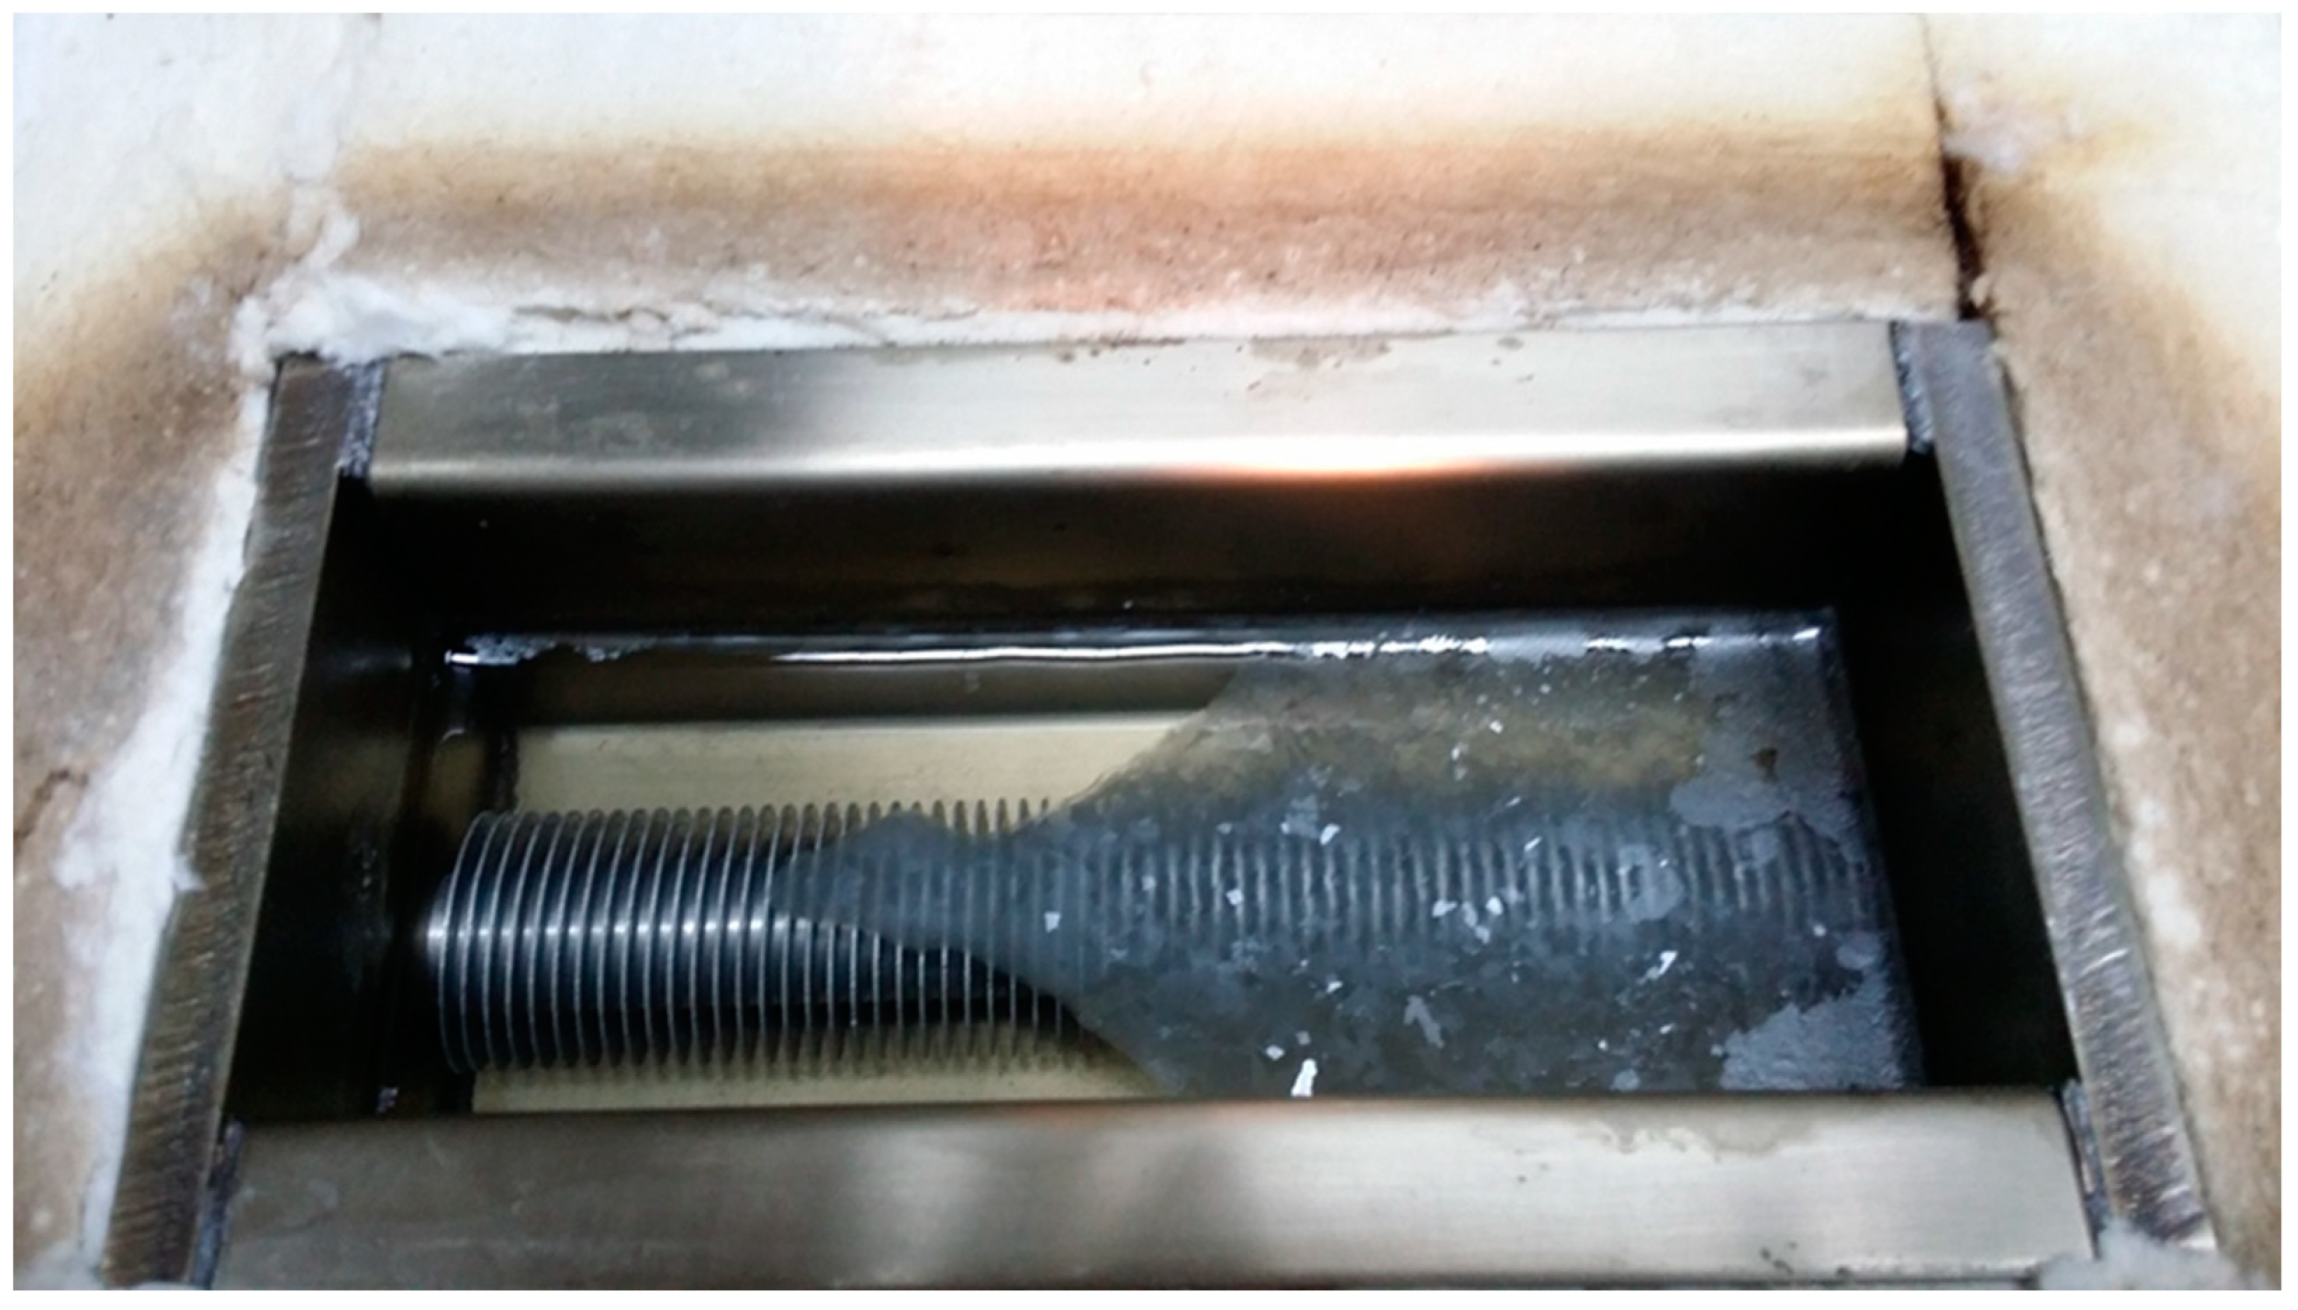
The study involved cyclic charging and discharging of the heat storage unit, during which the temperature distribution inside was measured. The analysis of the measured temperatures allowed for verification of the results obtained from the phase transition temperature measurements using the thermogravimetric analyzer. Detailed measurement conditions for the laboratory setup with the heat storage unit are presented in Table 5. Figure 7 shows the heat storage unit with partially melted PCM.
Table 5.
Measurement conditions.
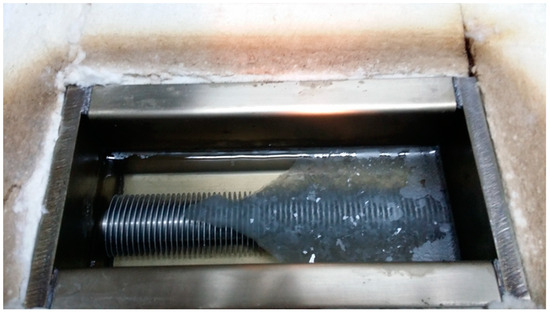
Figure 7.
Heat storage unit with partially melted PCM.
3. Results and Discussion
3.1. DSC–TGA Results
According to the research procedure described in Section 2.1, measurements of the thermophysical properties of the prepared salt mixtures were conducted. The measurement results are presented in Table 6 and Table 7. An example measurement result for a single heating and cooling cycle of the NaNO3–KNO3 50:50 sample is shown in Figure 8, which includes the DSC curve (blue color), the TGA curve (green color), and the temperature curve (red color).
Table 6.
Summary of the DSC–TGA measurement results for the NaNO3–KNO3 mixtures.
Table 7.
Summary of the DSC–TGA measurement results for the NaNO2–NaNO3 mixtures.
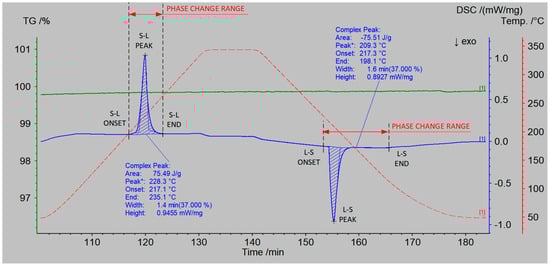
Figure 8.
DSC–TGA measurement results of the NaNO3–KNO3 50:50 sample. The blue curve represents DSC, the green curve TGA, and the red curve the temperature of the sample.
Based on the analysis of the TGA curve (Figure 8, green color), it was observed that there was no mass loss of the sample within the temperature range of up to 350 °C. The profile of the DSC curve (Figure 8, blue color) during the heating of the sample indicates a phase transition occurring at a temperature of 228.3 °C (peak). The process begins at a temperature of 217.1 °C (onset) and ends at a temperature of 235.1 °C (end). The onset and end temperature were determined according to ASTM E794–06(2018) [50] using the extrapolation method implemented in NETZSCH Proteus software (version 6.1.0).
The determined latent heat of the phase transition was 75.5 kJ/kg. It indicates that the salt mixture melted at a significantly lower temperature than the separate components.
- -
- TM1: solid–liquid phase transition temperature (S–L);
- -
- TONSET1: onset temperature of the solid–liquid phase transition;
- -
- TEND1: end temperature of the solid–liquid phase transition;
- -
- TM2: liquid–solid phase transition temperature (L–S);
- -
- TONSET2: onset temperature of the liquid–solid phase transition;
- -
- TEND2: end temperature of the liquid–solid phase transition;
- -
- ΔHM: latent heat of the phase transition.
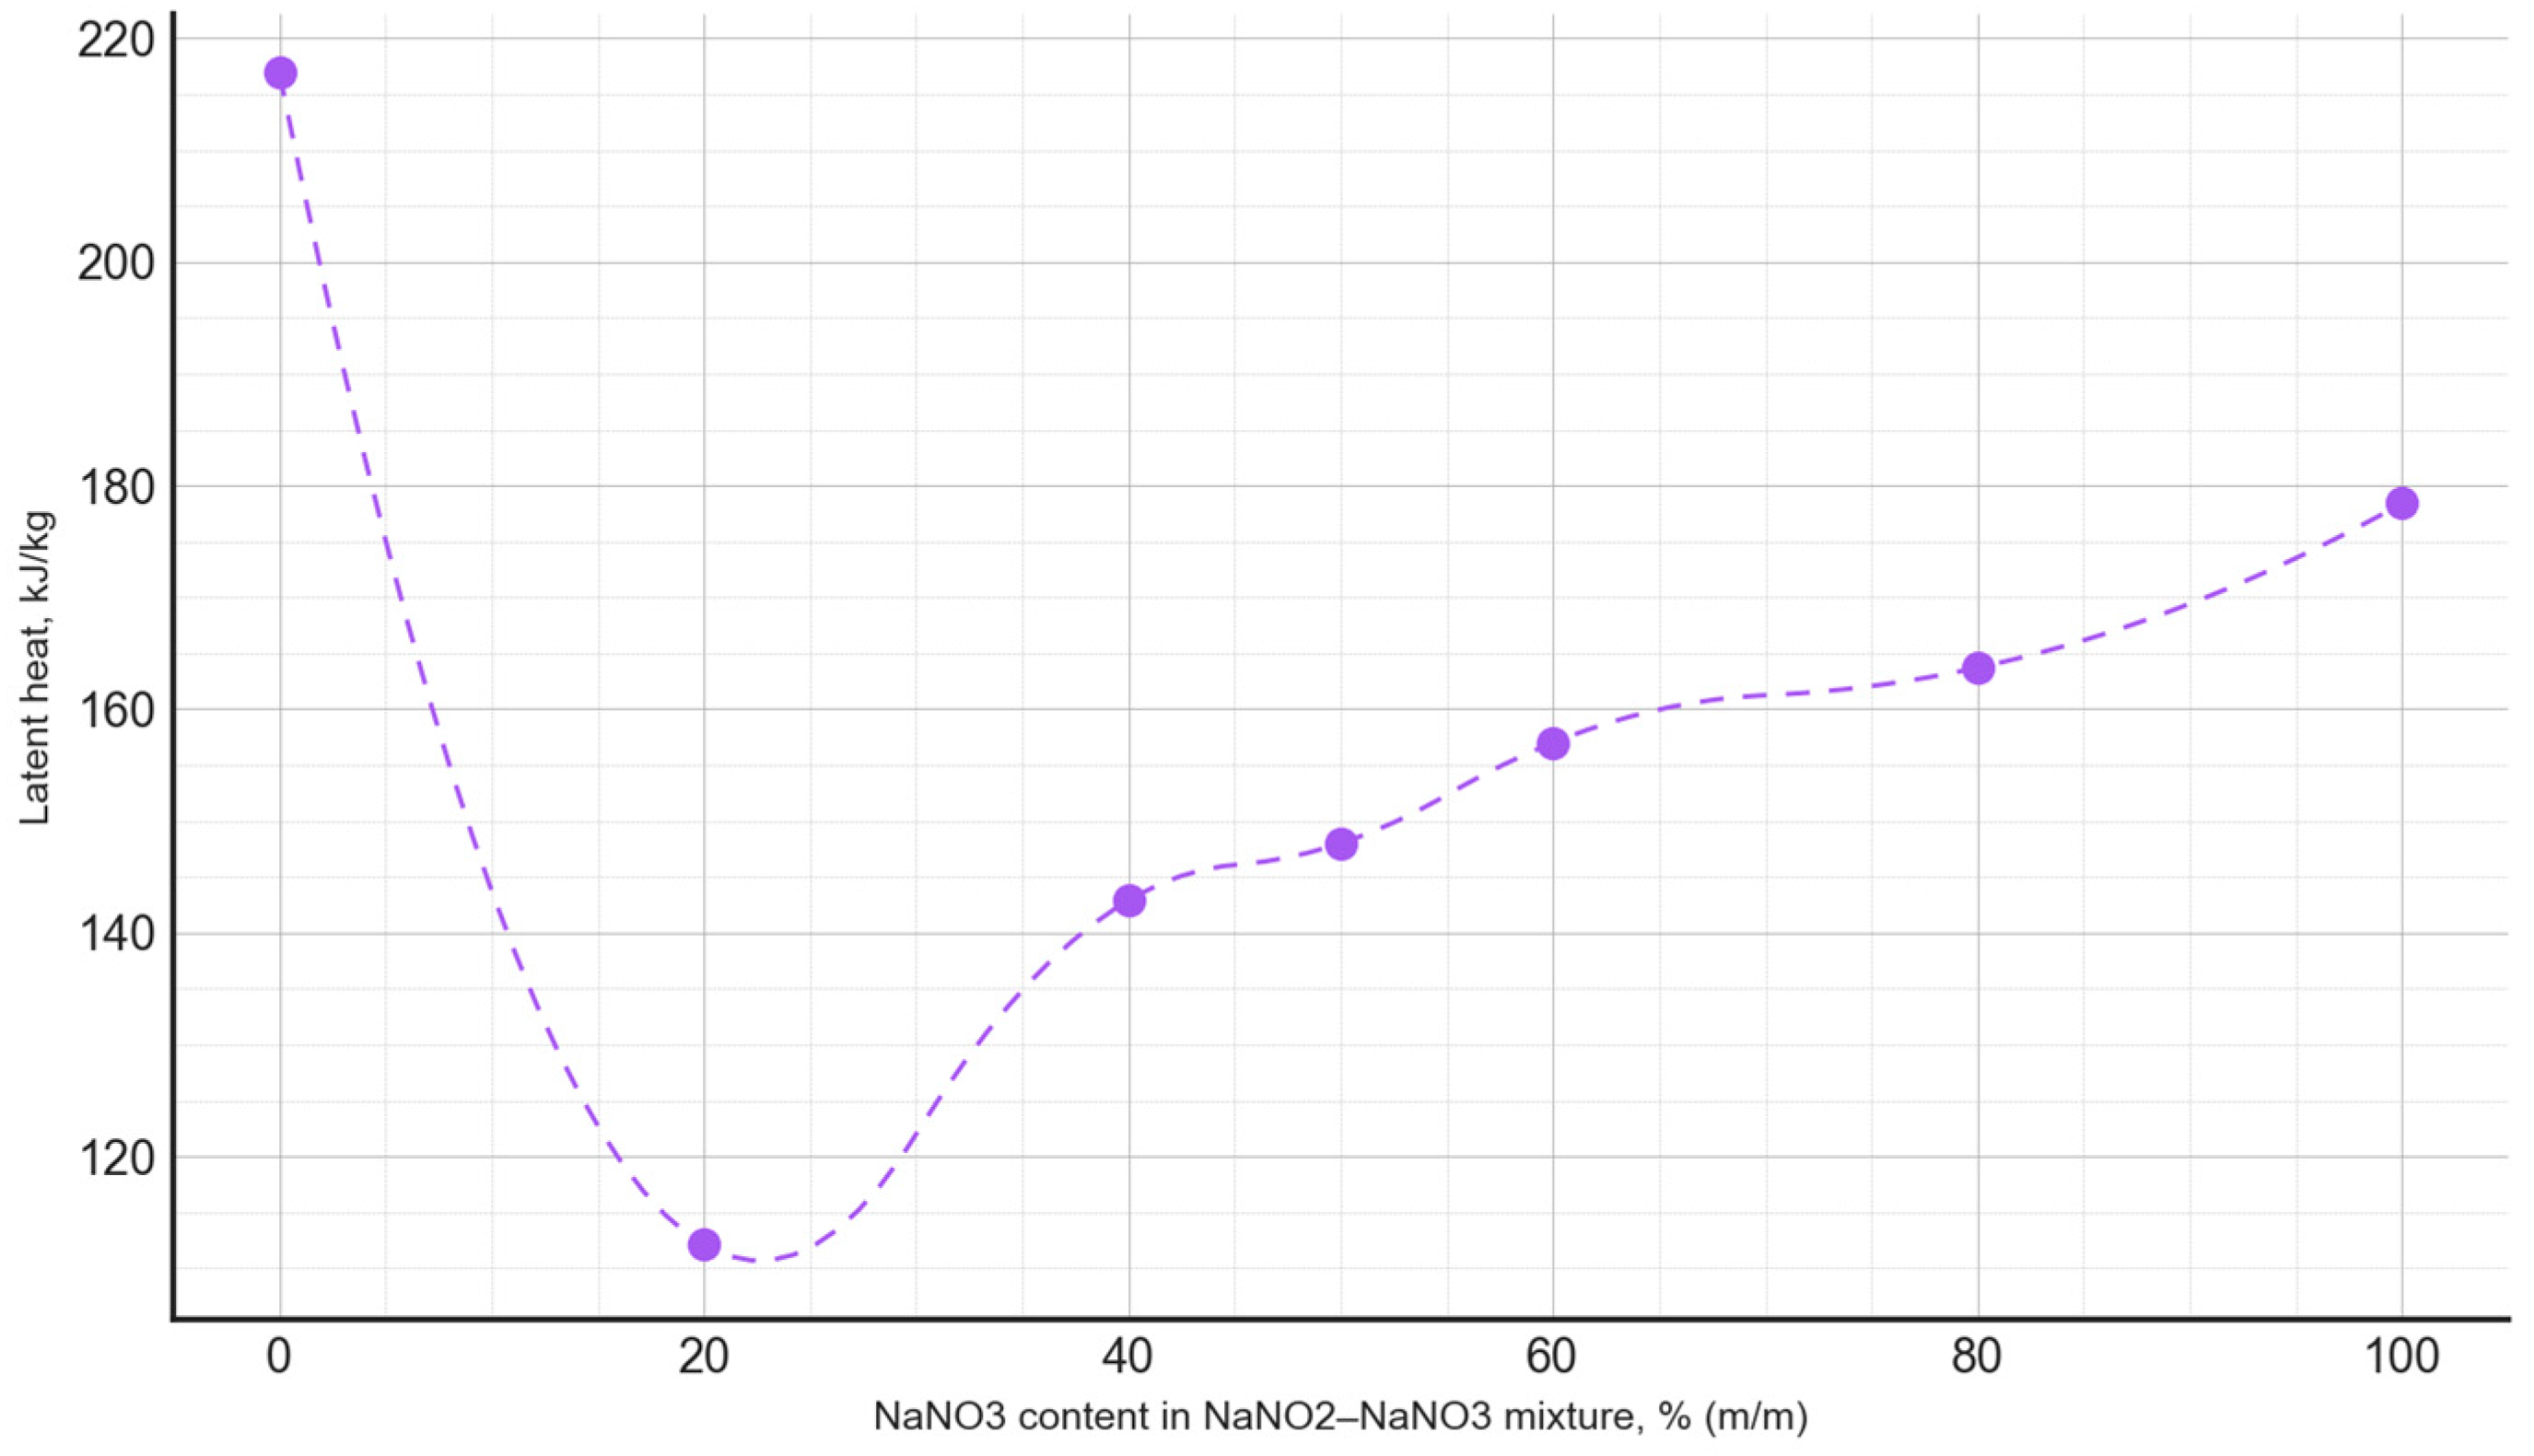
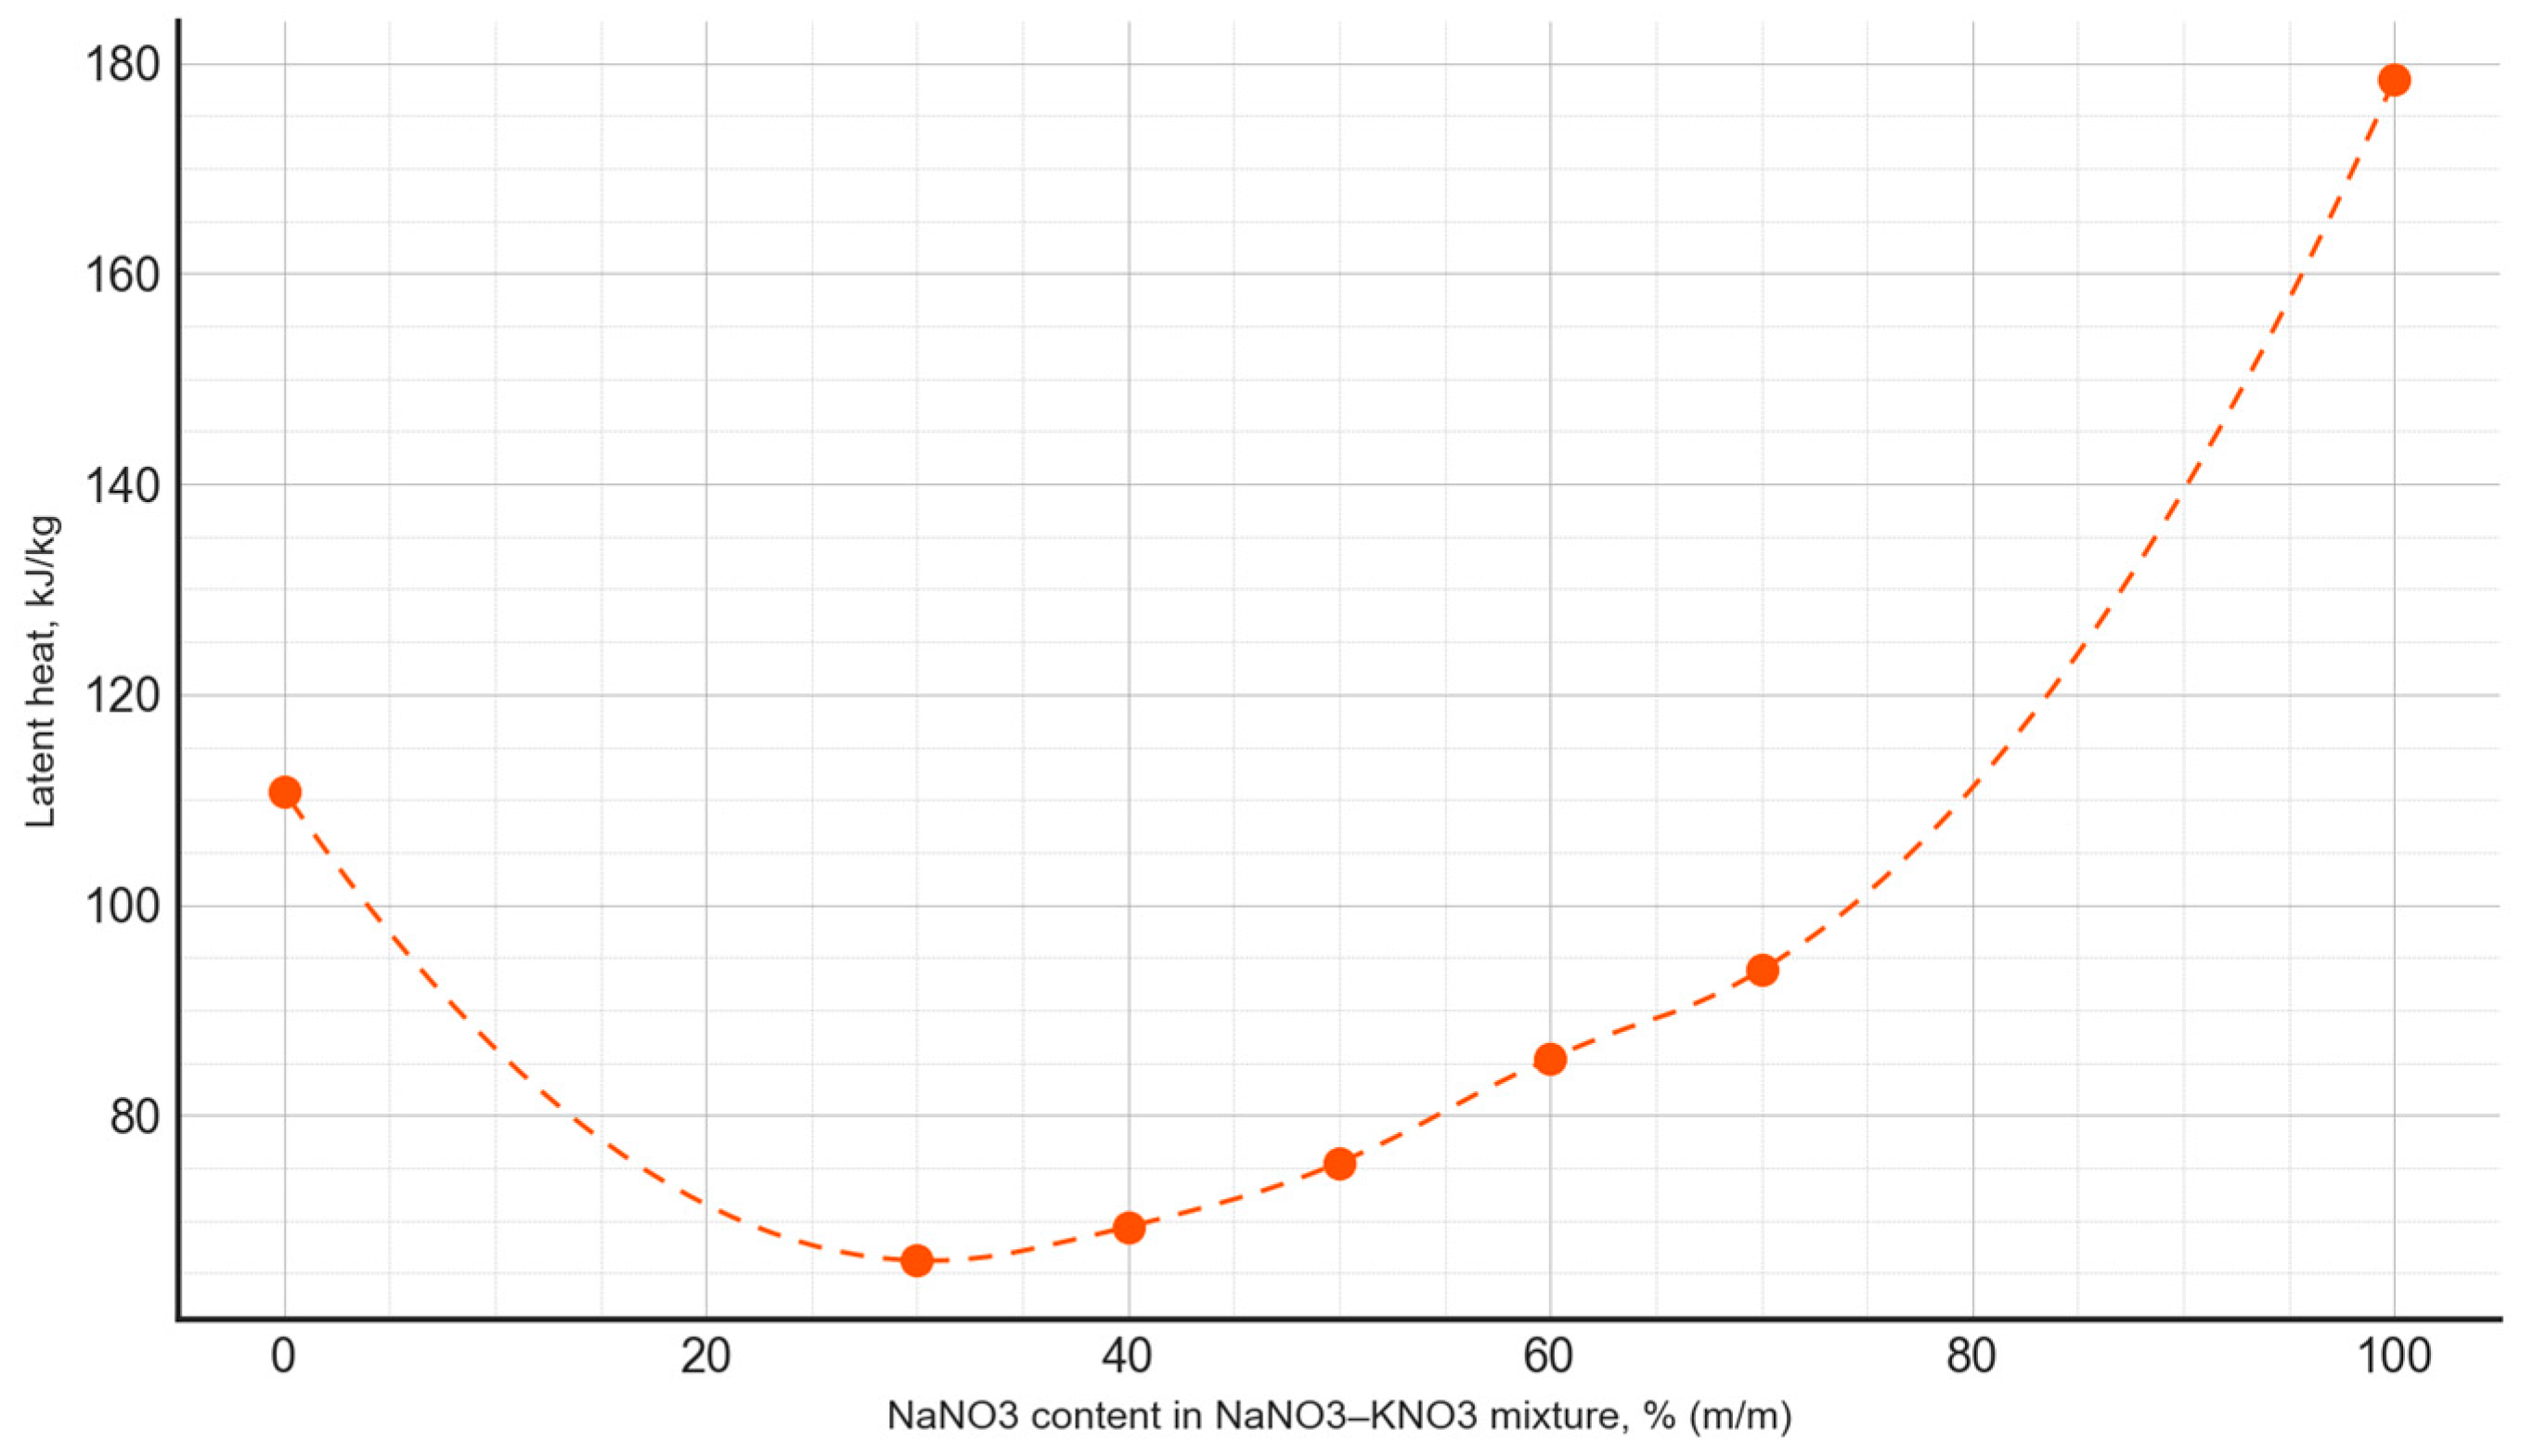
Based on the conducted measurements of thermophysical properties, the dependencies between the phase transition latent heat and the composition of the PCM were plotted (Figure 9), as well as the phase transition temperature as a function of the PCM composition (Figure 10). The latent heat of the phase transition varied irregularly, depending on the composition, with the minimum value for the NaNO3–NaNO2 mixtures observed at a composition of 20:80, amounting to 112.1 kJ/kg. Meanwhile, for the NaNO3–KNO3 mixtures, the lowest value of the latent heat of the phase transition occurred at a composition of 30:70, measuring 66.2 kJ/kg.
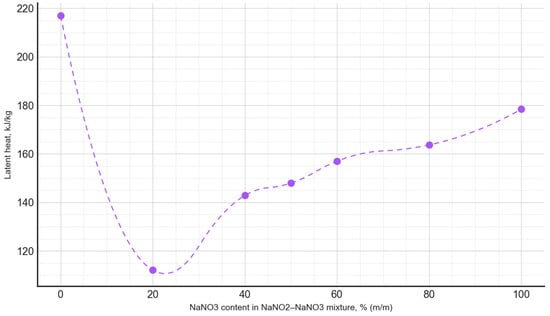
Figure 9.
The latent heat of the phase transition, depending on the composition of the NaNO3–NaNO2 mixture.
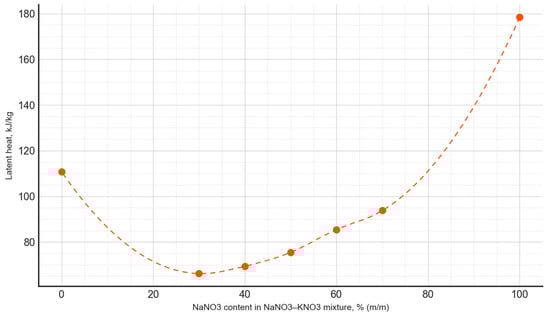
Figure 10.
The latent heat of the phase transition, depending on the composition of the NaNO3–KNO3 mixture.
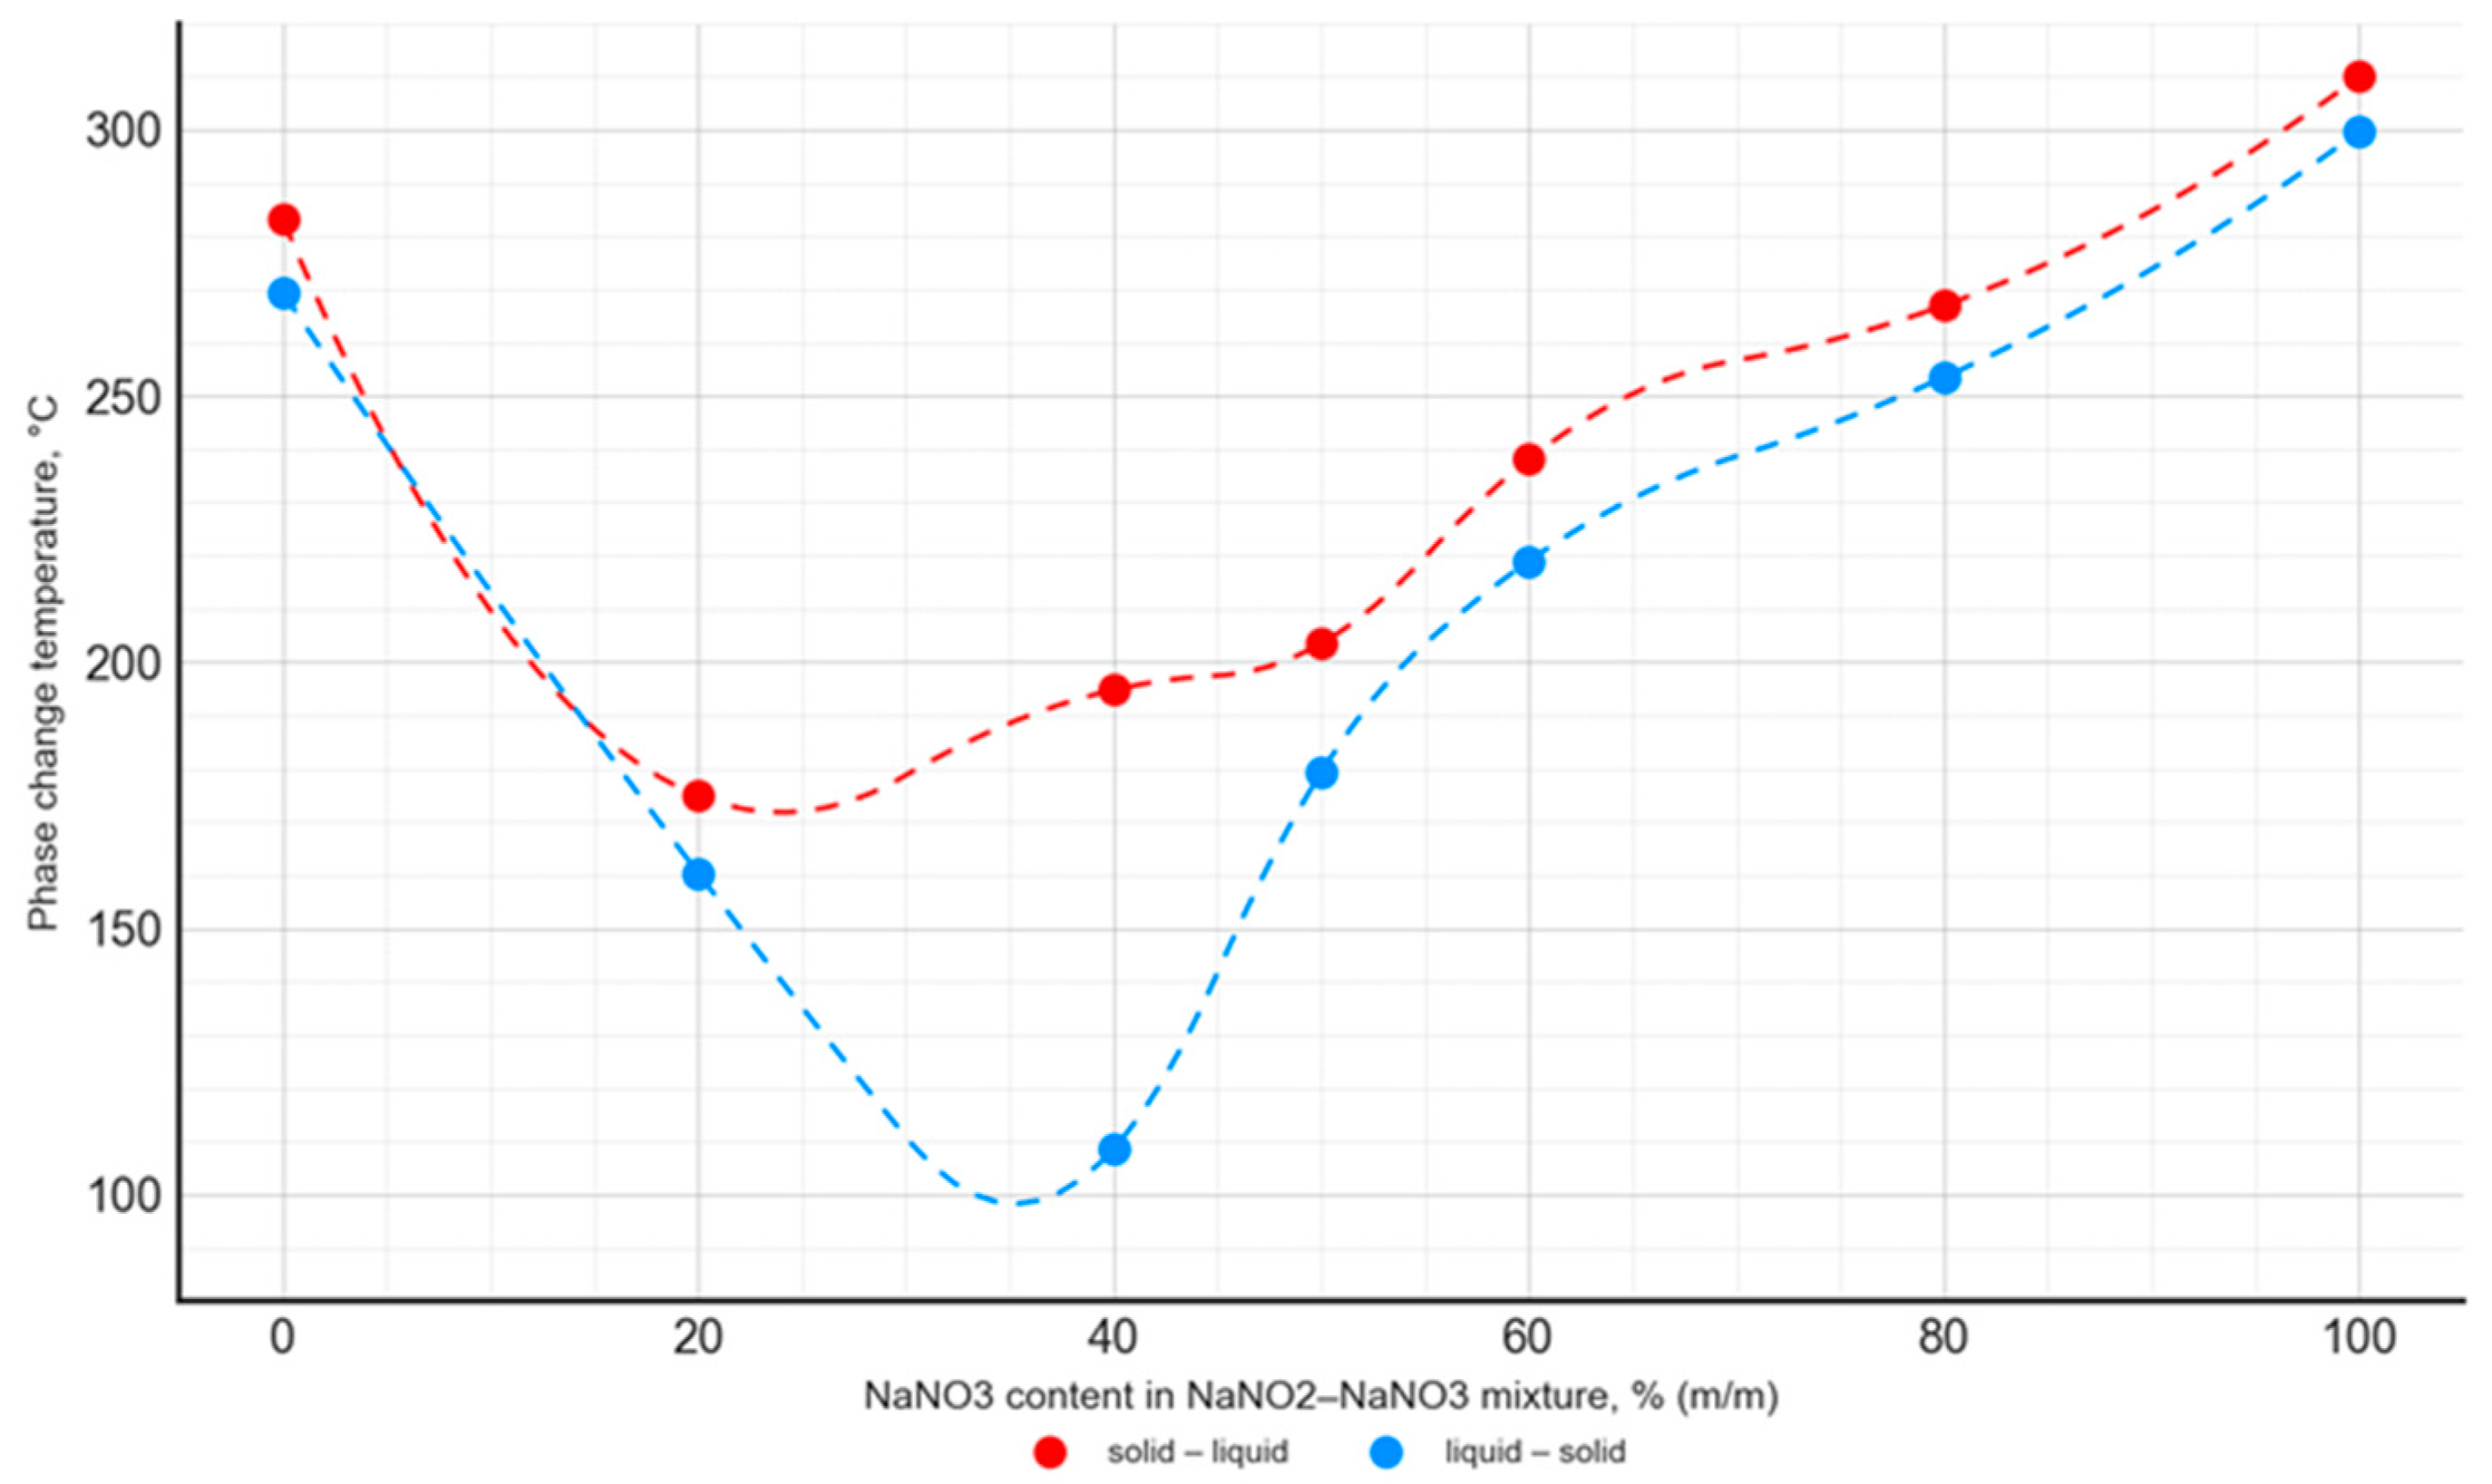
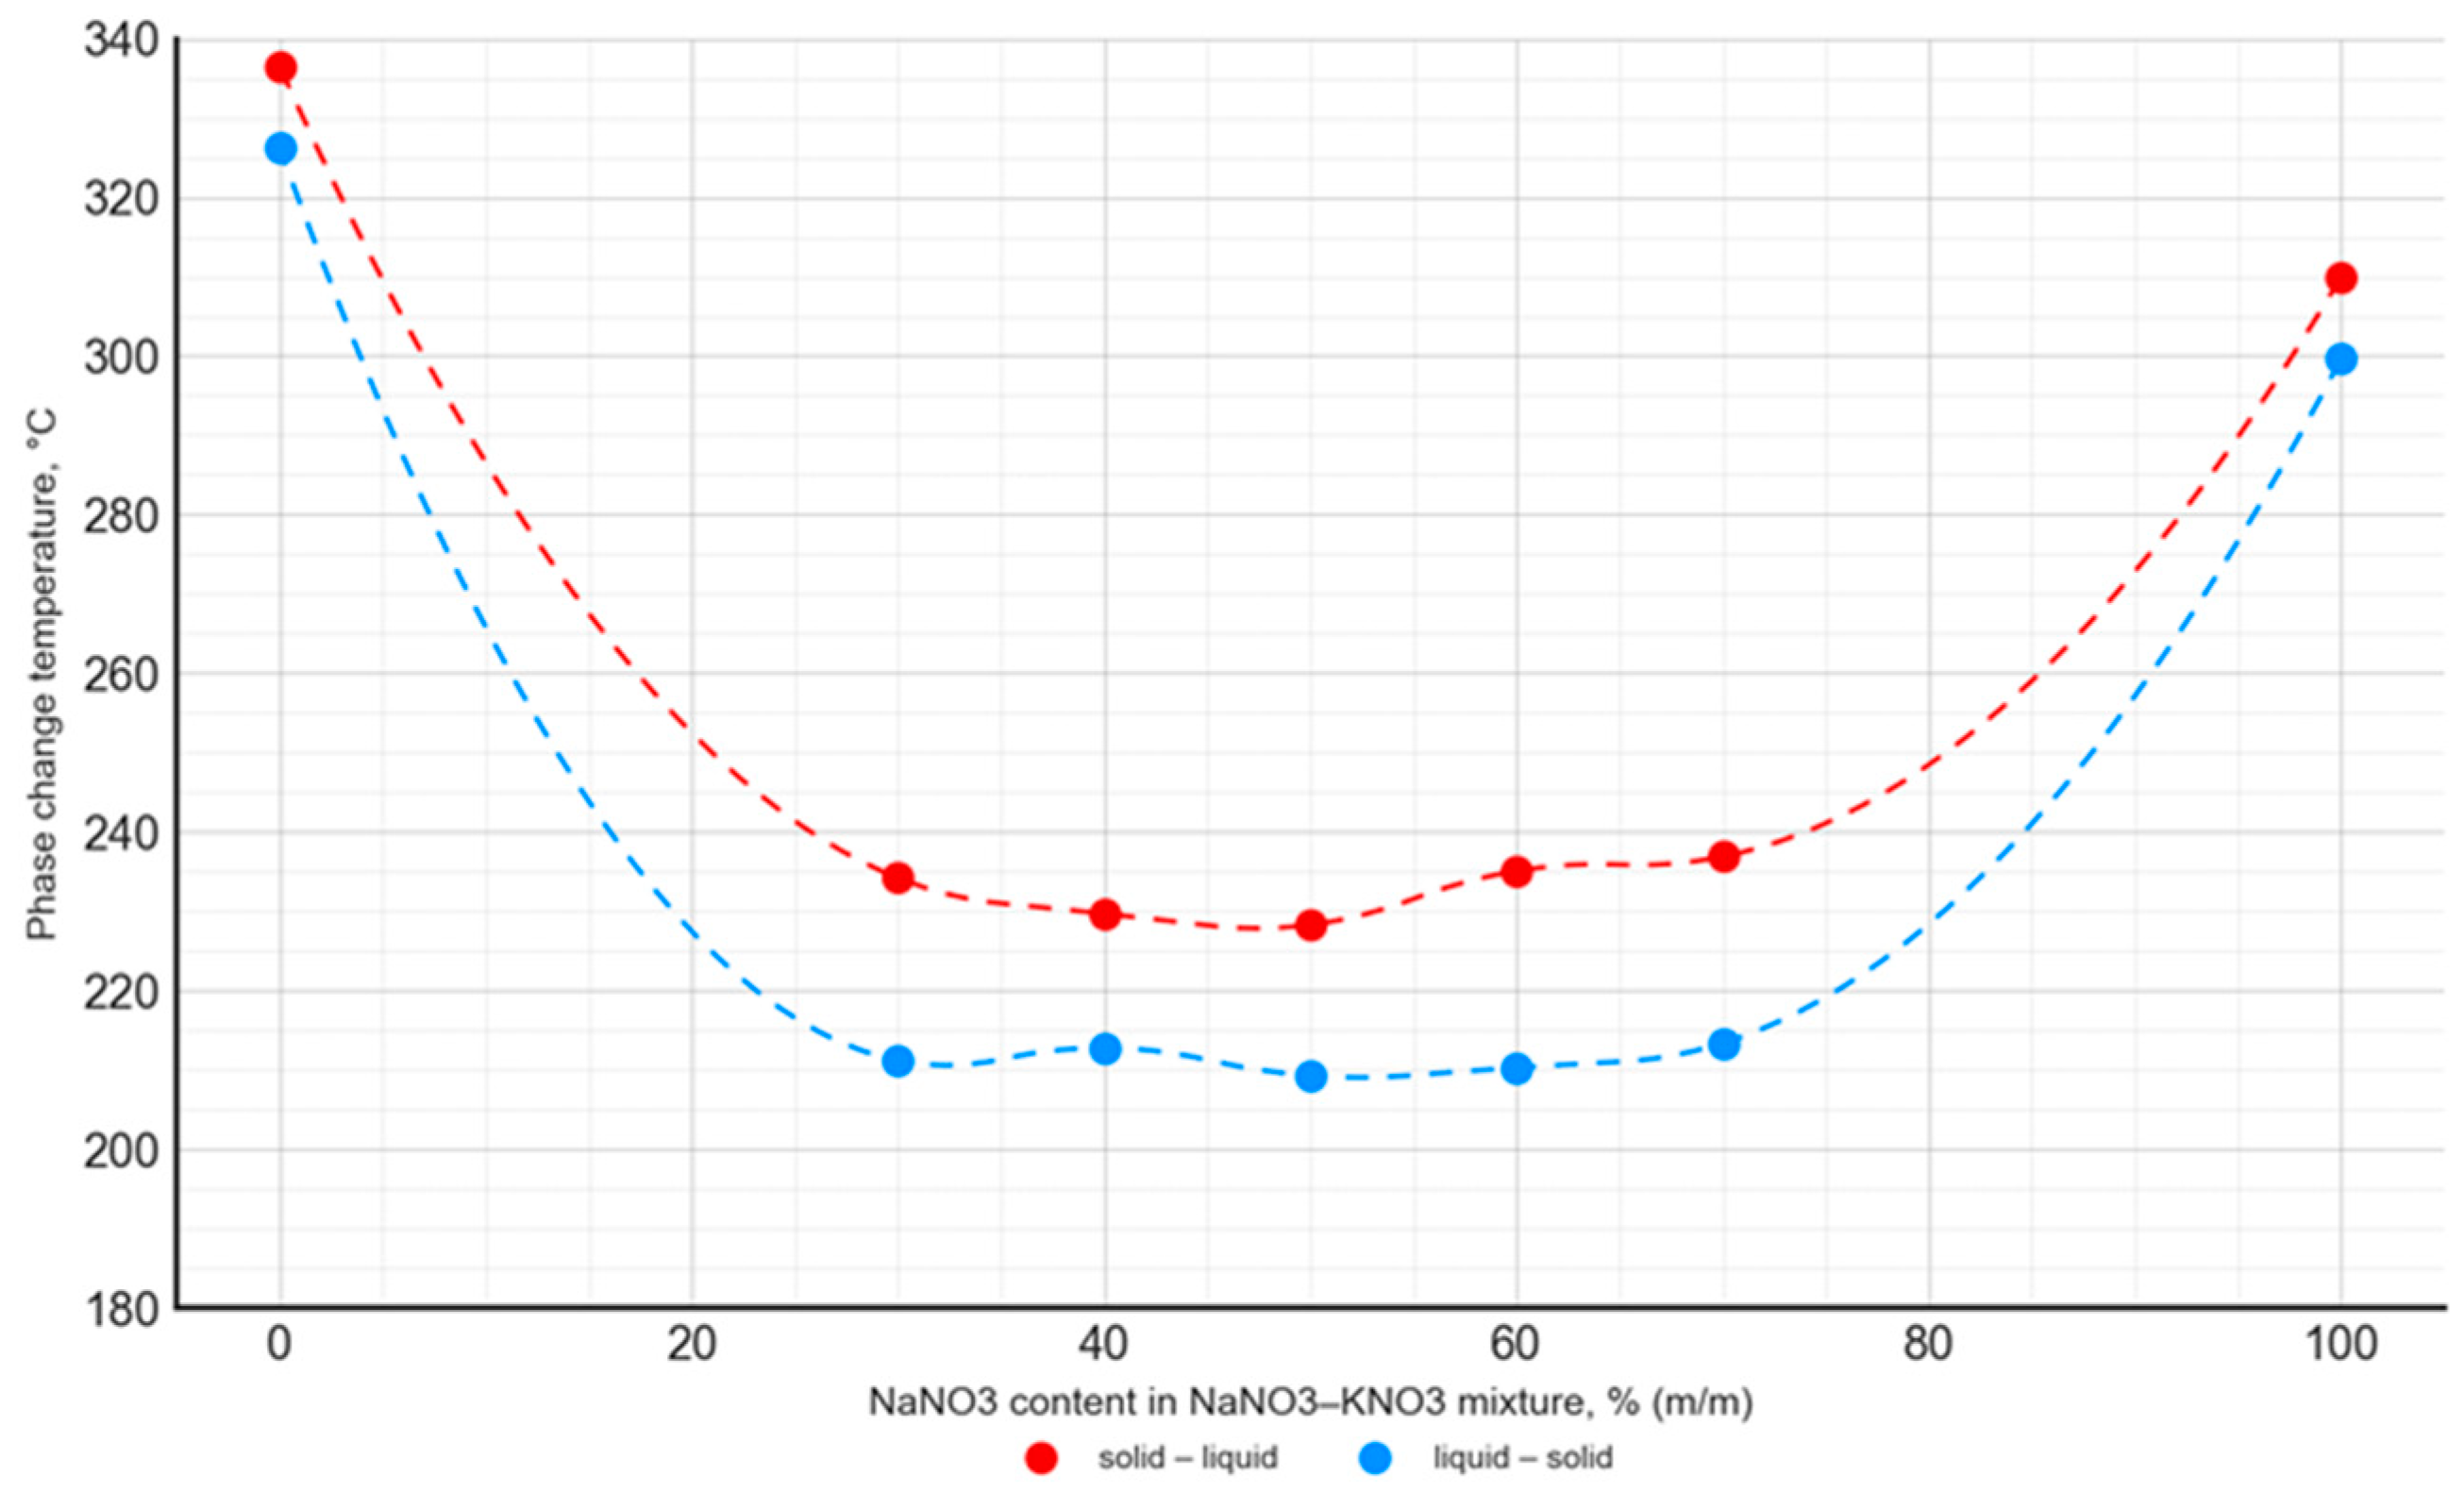
The phase transition temperature of the analyzed PCMs varied depending on the composition, with the relationship for the NaNO3–NaNO2 mixtures differing from the NaNO3–KNO3 mixtures. The phase transition temperature values for all the analyzed NaNO3–KNO3 mixtures in the range of 30–70% were at a comparable level of 215–220 °C. It was different for the NaNO3–NaNO2 mixtures, where the lowest phase transition temperature values occurred for the NaNO3 contents of 20–40%. Furthermore, the mixtures with this composition showed the greatest difference between the solid–liquid and liquid–solid phase transition temperatures. In the case of all the analyzed salt mixtures, the phase transition temperature values were significantly lower when compared to the phase transition temperatures of pure components (Figure 11 and Figure 12).
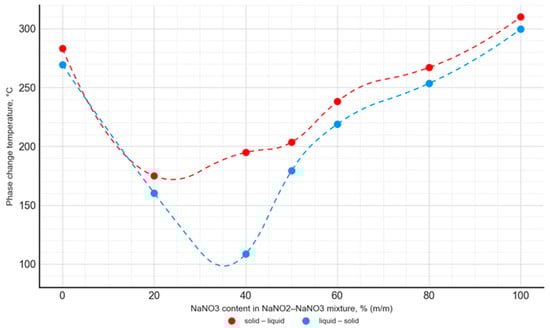
Figure 11.
Temperature of the solid–liquid phase transition and liquid–solid phase transition as a function of the NaNO2–NaNO3 mixture’s composition.
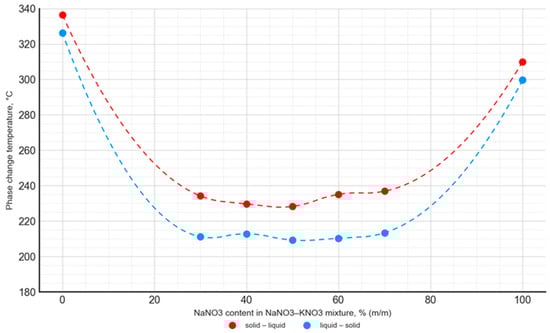
Figure 12.
Temperature of the solid–liquid phase transition and liquid–solid phase transition as a function of the NaNO3–KNO3 mixture’s composition.
For the NaNO3–KNO3 mixture, the lowest phase transition temperature was observed for a 50:50 ratio, with a value of 228.3 °C for the solid–liquid transition and 209.3 °C for the liquid–solid transition. The mentioned temperature difference was almost constant for the mixtures with an NaNO3 content ranging from 30% to 70%, and it was approximately 18–20 °C. In the case of the NaNO3–NaNO2 mixture, the lowest phase transition temperature value was 174.9 °C for the 80:20 ratio. The difference in phase transition temperatures, depending on the transition direction, was variable and ranged widely from 15 °C to 86 °C.
The obtained results are in good agreement with the data published in [42,51]. The phase change temperature was consistent in both studies for the entire range of the NaNO3–KNO3 and NaNO3–NaNO2 mixtures. However, it is worth noting that the literature presents data limited to the onset temperature and does not contain a detailed analysis of the phase change peak and end points. In the current study, a comprehensive analysis was performed. The curves presented in Figure 11 and Figure 12 were obtained from the solid–liquid and liquid–solid phase change peak temperature. Analogous curves are presented in the literature [42,51], but they present the onset temperature values of the phase transition. Taking into account these differences in methodology, the results obtained by the authors of the current study are consistent with the literature data.
Furthermore, the DSC results were compared to the temperature curves obtained during the charging and discharging of the laboratory heat storage unit.
3.2. Laboratory Heat Storage Unit Results
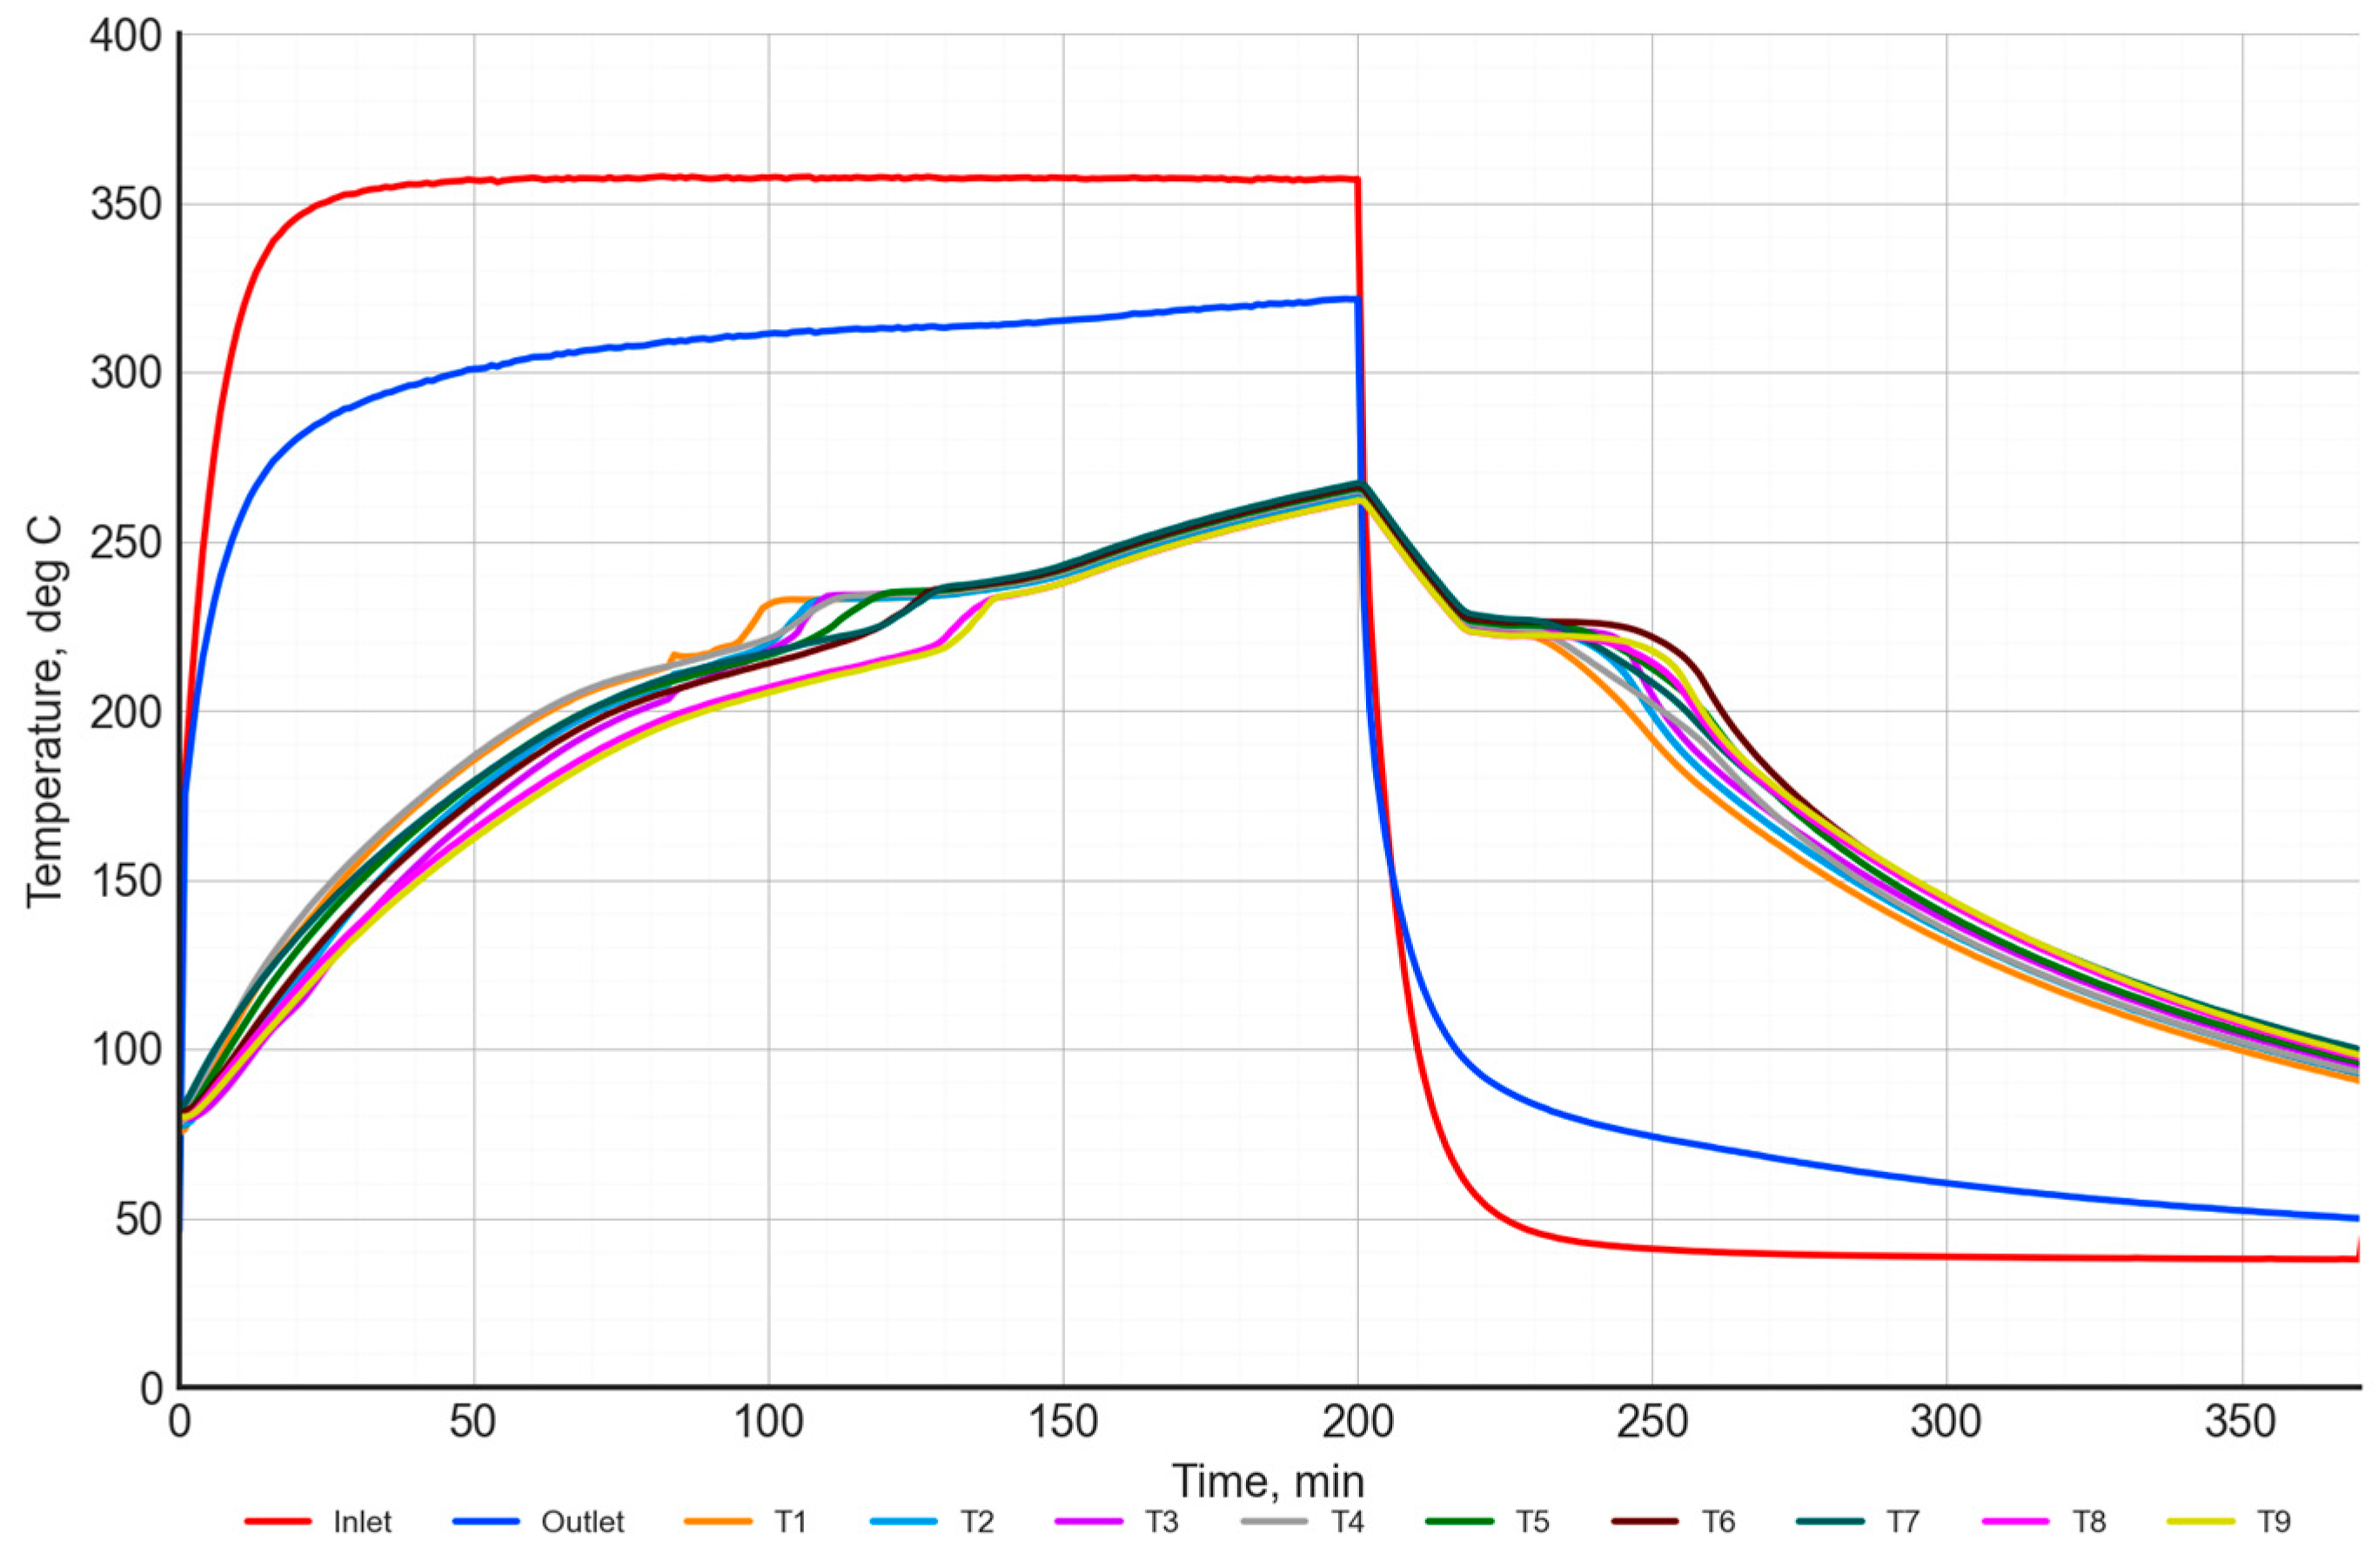
An example measurement result for a single cycle of charging and discharging of a heat storage unit filled with a NaNO3–KNO3 50:50 salt mixture is presented in Figure 13, Figure 14 and Figure 15. The temperature distribution during charging and discharging was illustrated in Figure 13. The red curve represents the air temperature at the inlet to the heat storage unit, while the blue curve represents the air temperature at the outlet. The temperature distribution of the PCM is represented by curves T1–T9.
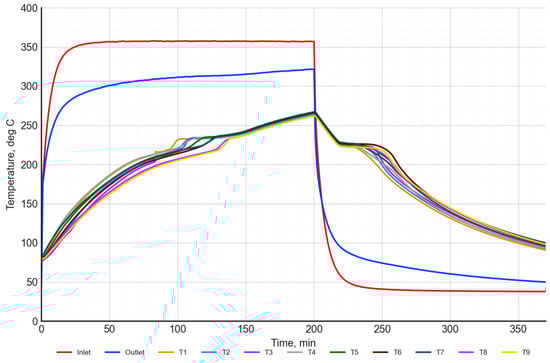
Figure 13.
Temperature of the inlet/outlet air and the temperature in the inside heat storage unit with the NaNO3–KNO3 50:50 mixture.

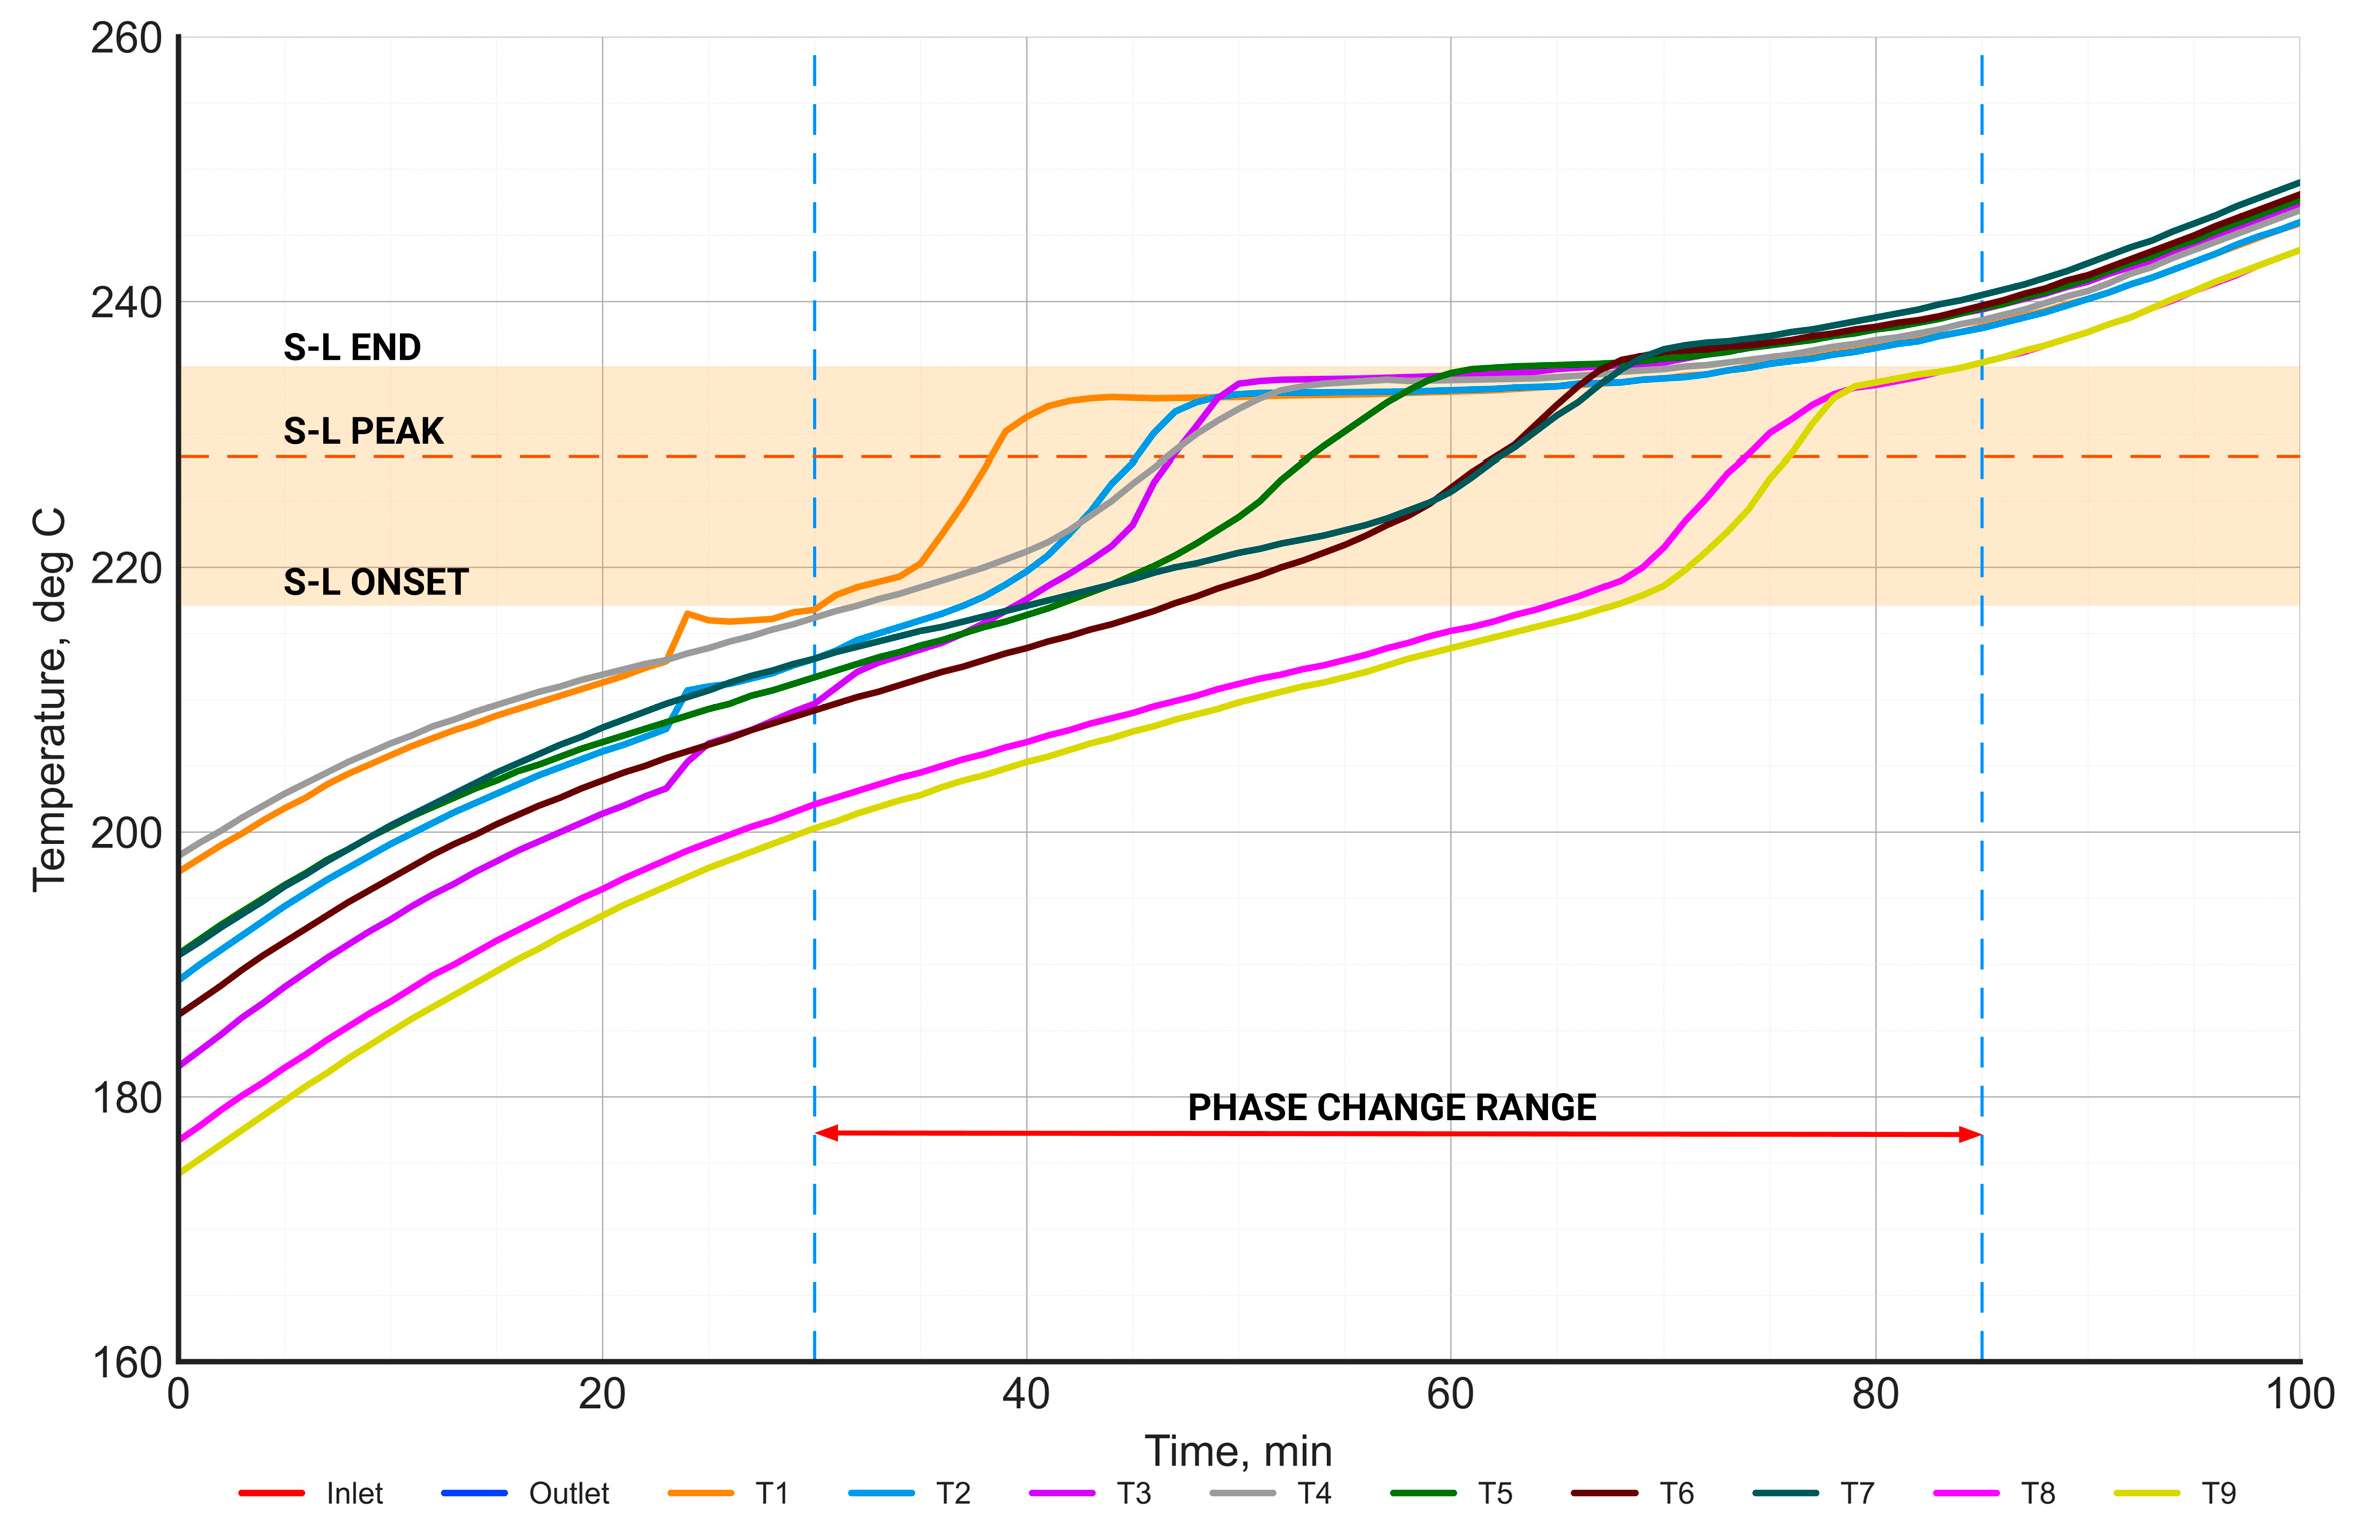
Figure 14.
The distribution of the PCM temperature in the phase change range during the charging process.
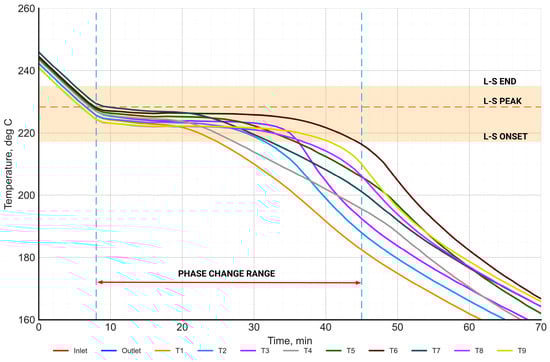
Figure 15.
Time-dependent characteristics of the temperature distribution of the PCM in the phase change range during the discharging process.
The charging process with air at a temperature of 360 °C was carried out for 200 min. The target air temperature was reached after approximately 35 min. During the charging process, the air temperature at the outlet was increased from 295 °C to 320 °C.
The temperature of the salt increased from approximately 80 °C at the start of the charging to 265 °C at the end of the charging. During the charging cycle, there is a characteristic inflection point in the PCM temperature characteristics, in the range between 200–250 °C. This is a result of the phase transition of the material. For a more detailed analysis of this process, the temperature distribution characteristics of the salt were evaluated, as presented in Figure 14.
Figure 14 presents the time-dependent characteristics of the temperature distribution of the PCM in the phase change range during the charging process. The range of the phase change temperature (between onset and end), determined from the DSC measurements, is highlighted in orange. The orange dashed horizontal line represents the phase change temperature (peak), while the vertical dashed blue lines represent the beginning and end of the phase change process. The start of the phase change was defined as the moment when the PCM temperature reached the onset phase change temperature—at least at one point. Similarly, the end of the phase change was defined as the moment when the salt temperature exceeded the end phase change temperature at all points. Based on this, the phase change time was equal to 55 min.
The range of the phase change temperature measured in the PCM on the laboratory stand shows a high agreement with the phase change temperature range determined from the DSC measurements.
The process of discharging using air at a temperature of 40 °C was conducted for 170 min (Figure 13). The target air temperature was reached after approximately 40 min. At the start of the charging process, the PCM temperature was around 320 °C, and then it decreased to a level of 90–100 °C. An interesting observation is that, in solid salt, there is a temperature gradient of about 20–30 °C, whereas, in molten salt, the temperature gradient does not exceed 5 °C.
Analogously, the process of discharging was analyzed (Figure 15). Similar to the charging process, the curves of the salt temperature distribution show an inflection point in the range of 210–230 °C.
4. Conclusions
The article presents the results of the investigation of the thermophysical properties of newly developed binary salt mixtures to be used in heat storage systems. The study of the thermophysical properties of the materials involved the measurement of the temperature and latent heat of phase transitions using the DSC–TGA method. Depending on the type of material, the phase transition temperature reaches a certain range and additionally depends on the direction of the phase transition, i.e., solid–liquid (S–L) or liquid–solid (L–S).
The scope for recommendations or implementations of the present work are as follows:
- For the NaNO3–KNO3 salt mixture, the difference in phase transition temperatures was almost independent of the NaNO3 content in the range from 30% to 70%.
- The highest latent heat of phase transition was observed for a NaNO3 content of 70%. Therefore, when this salt is used for heat storage, the most favorable choice is the 70:30 ratio, which provides the highest heat storage density and the lowest phase transition temperature.
- In the case of the NaNO3–NaNO2 mixture, the highest value of the latent heat of the phase transition occurred for a ratio of 80:20, resulting in phase transition temperatures of 267.0 °C for S–L and 253.5 °C for L–S.
- A similar phase transition temperature value was observed for pure NaNO2 salt (283.1 °C for S–L and 269.4 °C for L–S), but the latent heat value of the phase transition was higher and equal to 216.9 kJ/kg.
- For heat storage applications, it is recommended to use pure NaNO2 salt rather than the NaNO3–NaNO2 mixture. For the pure NaNO2 and NaNO2–NaNO3 80:20 mixtures, the phase change temperatures were at a similar level. However, there was a significant difference in latent heat of about 50 kJ/kg. Similarly, the pure NaNO2 performed better than the pure NaNO3, with latent heat being higher by ca. 40 kJ/kg.
Temperature distributions were measured in a heat storage system filled with the developed salt mixtures. Based on these measurements, it was shown that the operating range of the heat storage system corresponds to the range of phase transition temperatures determined from DSC. In the case of the heat storage charging process, the measured temperature values in the PCM were above the solid–liquid phase transition temperature. Conversely, for the discharging process, the PCM temperatures were below the liquid–solid phase transition temperature.
The novelty of the presented study is the detailed analysis of the phase change process on DSC curves, which not only included the phase change peak temperature, but also the onset and end points. In the literature, authors usually report the same phase change temperature for both the melting and solidification processes. In real conditions, the phase change is not an isothermal process and occurs over a certain temperature range. The phase change temperature reported in the literature usually corresponds only to the peak point on the calorimetric curve. Therefore, this article provides a detailed analysis of the phase change process in both directions: solid to liquid (S–L) and liquid to solid (L–S). The DSC results were confirmed by experiments in a laboratory scale using a heat storage unit, where temperature curves were analyzed.
Supplementary Materials
The following supporting information can be downloaded at: https://www.mdpi.com/article/10.3390/jmmp8050208/s1, Table S1: Literature review of phase change temperature and enthalpy of various salt mixtures for heat storage applications, based on [52,53,54].
Author Contributions
Conceptualization, D.S. and T.T.; methodology, D.S., T.T., B.A. and A.S.; formal analysis, A.S. and W.J.; investigation, D.S., A.S. and W.J.; data curation, D.S., B.A. and T.T.; writing—original draft preparation, D.S., B.A. and T.T.; writing—review and editing, P.S. and B.P.; visualization, R.R.; supervision, P.S. All authors have read and agreed to the published version of the manuscript.
Funding
This research received no external funding.
Institutional Review Board Statement
Not applicable.
Informed Consent Statement
Not applicable.
Data Availability Statement
The dataset is available upon request from the authors. The raw data supporting the conclusions of this article will be made available by the authors upon request and Supplementary Materials. Refs. [52,53,54] are cited in the Supplementary Materials.
Conflicts of Interest
The authors declare no conflicts of interest.
References
- Vo, D.H.; Vo, A.T. Renewable Energy and Population Growth for Sustainable Development in the Southeast Asian Countries. Energy Sustain. Soc. 2021, 11, 30. [Google Scholar] [CrossRef]
- Clean Energy Can Fuel the Future—And Make the World Healthier. Nature 2023, 620, 245. [CrossRef] [PubMed]
- Sarbu, I.; Sebarchievici, C. A Comprehensive Review of Thermal Energy Storage. Sustainability 2018, 10, 191. [Google Scholar] [CrossRef]
- Pompei, L.; Nardecchia, F.; Miliozzi, A. Current, Projected Performance and Costs of Thermal Energy Storage. Processes 2023, 11, 729. [Google Scholar] [CrossRef]
- Pagkalos, C.; Dogkas, G.; Koukou, M.K.; Konstantaras, J.; Lymperis, K.; Vrachopoulos, M.G. Evaluation of Water and Paraffin PCM as Storage Media for Use in Thermal Energy Storage Applications: A Numerical Approach. Int. J. Thermofluids 2020, 1–2, 100006. [Google Scholar] [CrossRef]
- Tietze, T.; Szulc, P.; Smykowski, D.; Sitka, A.; Redzicki, R. Application of Phase Change Material and Artificial Neural Networks for Smoothing of Heat Flux Fluctuations. Energies 2021, 14, 3531. [Google Scholar] [CrossRef]
- Pielichowska, K.; Pielichowski, K. Phase Change Materials for Thermal Energy Storage. Prog. Mater. Sci. 2014, 65, 67–123. [Google Scholar] [CrossRef]
- Wei, G.; Wang, G.; Xu, C.; Ju, X.; Xing, L.; Du, X.; Yang, Y. Selection Principles and Thermophysical Properties of High Temperature Phase Change Materials for Thermal Energy Storage: A Review. Renew. Sustain. Energy Rev. 2018, 81, 1771–1786. [Google Scholar] [CrossRef]
- Ayyagari, V.; Cajamarca, A.P.S.; Shooshtari, A.; Ohadi, M. Experimental Study of Cyclically Stable Glauber’s Salt-Based PCM for Cold Thermal Energy Storage. In Proceedings of the 2023 22nd IEEE Intersociety Conference on Thermal and Thermomechanical Phenomena in Electronic Systems (ITherm), Orlando, FL, USA, 30 May–2 June 2023; pp. 1–8. [Google Scholar]
- Purohit, B.K.; Sistla, V.S. Inorganic Salt Hydrate for Thermal Energy Storage Application: A Review. Energy Storage 2021, 3, e12. [Google Scholar] [CrossRef]
- Jiang, Y.; Sun, Y.; Liu, M.; Bruno, F.; Li, S. Eutectic Na2CO3–NaCl Salt: A New Phase Change Material for High Temperature Thermal Storage. Sol. Energy Mater. Sol. Cells 2016, 152, 155–160. [Google Scholar] [CrossRef]
- Drissi, S.; Ling, T.-C.; Mo, K.H. Thermal Efficiency and Durability Performances of Paraffinic Phase Change Materials with Enhanced Thermal Conductivity—A Review. Thermochim. Acta 2019, 673, 198–210. [Google Scholar] [CrossRef]
- Paroutoglou, E.; Fojan, P.; Gurevich, L.; Hultmark, G.; Afshari, A. Thermal Analysis of Organic and Nanoencapsulated Electrospun Phase Change Materials. Energies 2021, 14, 995. [Google Scholar] [CrossRef]
- Caraballo, A.; Galán-Casado, S.; Caballero, Á.; Serena, S. Molten Salts for Sensible Thermal Energy Storage: A Review and an Energy Performance Analysis. Energies 2021, 14, 1197. [Google Scholar] [CrossRef]
- Xie, N.; Huang, Z.; Luo, Z.; Gao, X.; Fang, Y.; Zhang, Z. Inorganic Salt Hydrate for Thermal Energy Storage. Appl. Sci. 2017, 7, 1317. [Google Scholar] [CrossRef]
- Delise, T.; Tizzoni, A.C.; Votyakov, E.V.; Turchetti, L.; Corsaro, N.; Sau, S.; Licoccia, S. Modeling the Total Ternary Phase Diagram of NaNO3–KNO3–NaNO2 Using the Binary Subsystems Data. Int. J. Thermophys. 2020, 41, 1. [Google Scholar] [CrossRef]
- Kalidasan, B.; Pandey, A.K.; Saidur, R.; Tyagi, S.K.; Mishra, Y.K. Experimental Evaluation of Binary and Ternary Eutectic Phase Change Material for Sustainable Thermal Energy Storage. J. Energy Storage 2023, 68, 107707. [Google Scholar] [CrossRef]
- Liu, M.; Zhang, X.; Ji, J.; Yan, H. Review of Research Progress on Corrosion and Anti-Corrosion of Phase Change Materials in Thermal Energy Storage Systems. J. Energy Storage 2023, 63, 107005. [Google Scholar] [CrossRef]
- Reza Vakhshouri, A. Paraffin as Phase Change Material. In Paraffin—An Overview; IntechOpen: London, UK, 2020. [Google Scholar]
- Bernagozzi, M.; Panesar, A.S.; Morgan, R. Molten Salt Selection Methodology for Medium Temperature Liquid Air Energy Storage Application. Appl. Energy 2019, 248, 500–511. [Google Scholar] [CrossRef]
- Liu, M.; Gomez, J.C.; Turchi, C.S.; Tay, N.H.S.; Saman, W.; Bruno, F. Determination of Thermo-Physical Properties and Stability Testing of High-Temperature Phase-Change Materials for CSP Applications. Sol. Energy Mater. Sol. Cells 2015, 139, 81–87. [Google Scholar] [CrossRef]
- Li, X.; Wu, S.; Wang, Y.; Xie, L. Experimental Investigation and Thermodynamic Modeling of an Innovative Molten Salt for Thermal Energy Storage (TES). Appl. Energy 2018, 212, 516–526. [Google Scholar] [CrossRef]
- Patange, S.R.; Sutar, P.R.; Yadav, G.D. New Frontiers in Thermal Energy Storage: An Experimental Analysis of Thermophysical Properties and Thermal Stability of a Novel Ternary Chloride Molten Salt. Sol. Energy Mater. Sol. Cells 2024, 271, 112866. [Google Scholar] [CrossRef]
- Hassan, N.; Minakshi, M.; Liew, W.Y.H.; Amri, A.; Jiang, Z.-T. Thermal Characterization of Binary Calcium-Lithium Chloride Salts for Thermal Energy Storage at High Temperature. Energies 2023, 16, 4715. [Google Scholar] [CrossRef]
- Hassan, N.; Minakshi, M.; Ruprecht, J.; Liew, W.Y.H.; Jiang, Z.-T. A Binary Salt Mixture LiCl–LiOH for Thermal Energy Storage. Materials 2023, 16, 1434. [Google Scholar] [CrossRef]
- Raud, R.; Bell, S.; Ong, T.; Will, G.; Steinberg, T.A. Optimized Salt Selection for Solar Thermal Latent Heat Energy Storage. Adv. Sustain. Syst. 2018, 2, 1800074. [Google Scholar] [CrossRef]
- Li, Y.; Kumar, N.; Hirschey, J.; Akamo, D.O.; Li, K.; Tugba, T.; Goswami, M.; Orlando, R.; LaClair, T.J.; Graham, S.; et al. Stable Salt Hydrate-Based Thermal Energy Storage Materials. Compos. B Eng. 2022, 233, 109621. [Google Scholar] [CrossRef]
- Li, Y.; Wang, C.G.; Liu, G.Y.; Zhu, Q.Z.; Qiu, Z.Z. Thermal Property Characterization of a Low Supercooling Degree Binary Mixed Molten Salt for Thermal Energy Storage System. Int. J. Thermophys. 2019, 40, 41. [Google Scholar] [CrossRef]
- Raja Jeyaseelan, T.; Azhagesan, N.; Pethurajan, V. Thermal Characterization of NaNO3/KNO3 with Different Concentrations of Al2O3 and TiO2 Nanoparticles. J. Therm. Anal. Calorim. 2019, 136, 235–242. [Google Scholar] [CrossRef]
- Zhu, C.; Gong, L.; Tie, S. Influence of Preparation Processes on Thermophysical Properties of Molten Salt. AIP Adv. 2020, 10, 025214. [Google Scholar] [CrossRef]
- Kearney, D.; Herrmann, U.; Nava, P.; Kelly, B.; Mahoney, R.; Pacheco, J.; Cable, R.; Potrovitza, N.; Blake, D.; Price, H. Assessment of a Molten Salt Heat Transfer Fluid in a Parabolic Trough Solar Field. J. Sol. Energy Eng. 2003, 125, 170–176. [Google Scholar] [CrossRef]
- Yin, H.B.; Ding, J.; Yang, X.X. Heat Accumulation Technologies and Systems for Use in Concentration Type Solar Energy Thermal Power Generation. J. Eng. Therm. Energy Power 2013, 1, 105. [Google Scholar]
- Herrmann, U.; Kearney, D.W. Survey of Thermal Energy Storage for Parabolic Trough Power Plants. J. Sol. Energy Eng. 2002, 124, 145–152. [Google Scholar] [CrossRef]
- Dunn, R.I.; Hearps, P.J.; Wright, M.N. Molten-Salt Power Towers: Newly Commercial Concentrating Solar Storage. Proc. IEEE 2012, 100, 504–515. [Google Scholar] [CrossRef]
- Relloso, S.; Delgado, E. Experience with Molten Salt Thermal Storage in a Commercial Parabolic Trough Plant. Andasol-1 Commissioning and Operation. In Proceedings of the 15th International Solarpaces Symposium, Berlin, Germany, 15–18 September 2009; International Energy Agency: Berlin, Germany, 2009; Volume 14. [Google Scholar]
- Falchetta, M.; Mazzei, D.; Russo, V.; Campanella, V.A.; Floridia, V.; Schiavo, B.; Venezia, L.; Brunatto, C.; Orlando, R. The Partanna Project: A First of a Kind Plant Based on Molten Salts in LFR Collectors. In Proceedings of the SolarPACES2019: International Conference on Concentrating Solar Power and Chemical Energy Systems, Daegu, Republic of Korea, 1–4 October 2019; Volume 2303, p. 040001. [Google Scholar] [CrossRef]
- Zarza Moya, E. Innovative Working Fluids for Parabolic Trough Collectors. In Advances in Concentrating Solar Thermal Research and Technology; Elsevier: Amsterdam, The Netherlands, 2017; pp. 75–106. [Google Scholar]
- Erregueragui, Z.; Tizliouine, A.; Omari, L.E.H.; Chafi, M. Cost Performance of Encapsulated Phase Change Material-Based Thermal Energy Storage Systems. Int. J. Low-Carbon Technol. 2022, 17, 1353–1365. [Google Scholar] [CrossRef]
- Chieruzzi, M.; Miliozzi, A.; Crescenzi, T.; Torre, L.; Kenny, J.M. A New Phase Change Material Based on Potassium Nitrate with Silica and Alumina Nanoparticles for Thermal Energy Storage. Nanoscale Res. Lett. 2015, 10, 273. [Google Scholar] [CrossRef] [PubMed]
- Gabisa, E.W.; Aman, A. Characterization and Experimental Investigation of NaNO3: KNO3 as Solar Thermal Energy Storage for Potential Cooking Application. J. Sol. Energy 2016, 2016, 1–6. [Google Scholar] [CrossRef]
- Huang, Z.; Xie, N.; Luo, Z.; Gao, X.; Fang, X.; Fang, Y.; Zhang, Z. Characterization of Medium-Temperature Phase Change Materials for Solar Thermal Energy Storage Using Temperature History Method. Sol. Energy Mater. Sol. Cells 2018, 179, 152–160. [Google Scholar] [CrossRef]
- Tizzoni, A.C.; Sau, S.; Corsaro, N.; Giaconia, A.; D’Ottavi, C.; Licoccia, S. Thermal Fluids for CSP Systems: Alkaline Nitrates/Nitrites Thermodynamics Modelling Method. In Proceedings of the SolarPACES Conference 2015, 21st SolarPACES Conference, Cape Town, South Africa, 13–16 October 2015; Volume 1734, p. 040007. [Google Scholar] [CrossRef]
- Wu, C.; Wang, Q.; Wang, X.; Sun, S.; Bai, J.; Cui, D.; Pan, S.; Sheng, H. Effect of Al2O3 Nanoparticle Dispersion on the Thermal Properties of a Eutectic Salt for Solar Power Applications: Experimental and Molecular Simulation Studies. Energy 2024, 288, 129785. [Google Scholar] [CrossRef]
- Kwasi-Effah, C.C.; Ighodaro, O.; Egware, H.O.; Obanor, A.I. Characterization and Comparison of the Thermophysical Property of Ternary and Quaternary Salt Mixtures for Solar Thermal Power Plant Applications. Results Eng. 2022, 16, 100721. [Google Scholar] [CrossRef]
- Chen, X.; Wu, Y.-T.; Wang, C.; Wang, X.; Ma, C.-F. Flow and Mixed Convection Heat Transfer of Hitec Salt in Multi-Sided Heating Pipes. Sustain. Energy Technol. Assess. 2021, 47, 101375. [Google Scholar] [CrossRef]
- Xiao, X.; Jia, H.; Wen, D.; Zhao, X. Thermal Performance Analysis of a Solar Energy Storage Unit Encapsulated with HITEC Salt/Copper Foam/Nanoparticles Composite. Energy 2020, 192, 116593. [Google Scholar] [CrossRef]
- Kwasi-Effah, C.C.; Egware, H.O.; Obanor, A.I.; Ighodaro, O.O. Development and Characterization of a Quaternary Nitrate Based Molten Salt Heat Transfer Fluid for Concentrated Solar Power Plant. Heliyon 2023, 9, e16096. [Google Scholar] [CrossRef] [PubMed]
- Mwesigye, A.; Yılmaz, İ.H. Thermal and Thermodynamic Benchmarking of Liquid Heat Transfer Fluids in a High Concentration Ratio Parabolic Trough Solar Collector System. J. Mol. Liq. 2020, 319, 114151. [Google Scholar] [CrossRef]
- Tietze, T.; Kryteria, A. Phase change material selection criteria for thermal energy storage. Przemysł Chem. 2018, 1, 113–116. [Google Scholar] [CrossRef]
- ASTM E794-06(2018); Standard Test Method for Melting and Crystallization Temperatures by Thermal Analysis. ASTM: West Conshohocken, PA, USA, 2018.
- Delise, T.; Tizzoni, A.C.; Ferrara, M.; Corsaro, N.; D’Ottavi, C.; Giaconia, A.; Turchetti, L.; Annesini, M.C.; Telling, M.; Sau, S.; et al. New Solid Phase of KNO3—NaNO3 Salt Mixtures Studied by Neutron Scattering and Differential Scanning Calorimetry Analysis. In Proceedings of the SolarPACES 2017, International Conference on Concentrating Solar Power and Chemical Energy Systems, Santiago, Chile, 26–29 September 2017; Volume 2033, p. 080001. [Google Scholar] [CrossRef]
- Gomez, J.C. High-Temperature Phase Change Materials (PCM) Candidates for Thermal Energy Storage (TES) Applications; Milestone Report NREL/TP-5500-51446, Contract No. DE-AC36-08GO28308; National Renewable Energy Lab. (NREL): Golden, CO, USA, 2011. [Google Scholar]
- Gomez, J.; Glatzmaier, G.C.; Starace, A.; Turchi, C.; Ortega, J. High Temperature Phase Change Materials for Thermal Energy Storage Applications; NREL/CP-5500-52390 August 2011, Contract No. DE-AC36-08GO28308; National Renewable Energy Lab. (NREL): Golden, CO, USA, 2011. [Google Scholar]
- Zalba, B.; Marın, J.; Cabeza, L.F.; Mehling, H. Review on thermal energy storage with phase change: Materials, heat transfer analysis and applications. Appl. Therm. Eng. 2003, 23, 251–283. [Google Scholar] [CrossRef]


Disclaimer/Publisher’s Note: The statements, opinions and data contained in all publications are solely those of the individual author(s) and contributor(s) and not of MDPI and/or the editor(s). MDPI and/or the editor(s) disclaim responsibility for any injury to people or property resulting from any ideas, methods, instructions or products referred to in the content. |
© 2024 by the authors. Licensee MDPI, Basel, Switzerland. This article is an open access article distributed under the terms and conditions of the Creative Commons Attribution (CC BY) license (https://creativecommons.org/licenses/by/4.0/).