Article

A Study of Fit and Friction Force as a Function of the Printing Process for FFF 3D-Printed Piston–Cylinder Assembly

by
Philippe A. Passeraub
1,*,
Quentin Allen
1,
Elizabeth Clark
1,
Michael Miles
1,
Siddartha Berns
2,
Maija Pearson
1,
Sterling Allred
1,
Jonah Brooks
1 and
Sylvain Hugon
2
1
Department of Manufacturing Engineering, Brigham Young University, Provo, UT 84602, USA
2
COMATEC-Addipole, Department of Industrial Technologies, HEIG-VD, 1401 Yverdon, Switzerland
*
Author to whom correspondence should be addressed.
J. Manuf. Mater. Process. 2024, 8(6), 249; https://doi.org/10.3390/jmmp8060249
Submission received: 31 August 2024 / Revised: 23 October 2024 / Accepted: 28 October 2024 / Published: 6 November 2024

Abstract

:
Current 3D printing processes for polymer material extrusion are limited in their accuracy in terms of dimension, form, and position. For precise results, post-processing is recommended, like with assembled parts such as pistons and cylinders wherein axial mobility is desired with low friction force and limited radial play. When no post-processing step of the printed parts is accomplished, the fit and the friction force behavior are strongly dependent on the process performances. This paper presents a study on parameters of significance and their effects on sliding and running fits as well as their friction forces for fused filament fabrication of such assemblies. A series of experiments were performed with multiple factors and levels, including the position or layout of printed objects, their layer thickness, the material used, the use of aligned or random seam, and the printer type. Piston–cylinder pairs were printed, measured, assembled, and tested using a tensile test frame. A mathematical model was developed to describe the oscillating friction force behavior observed. This study presents the feasibility and limitations of producing piston–cylinder assemblies with reduced play and friction when using appropriate conditions. It also provides recommendations to obtain and better control a desired running and sliding fit.

1. Introduction

Fused filament fabrication (FFF 3D printing), also known as fused deposition modeling or FDM, has become a popular additive manufacturing method for the rapid and low-cost fabrication of polymer mechanical parts and mechanisms [1,2]. It simplifies prototyping, as well as personalized and small series manufacturing. The process of 3D printing allows for open-access development or efficient distributed manufacturing approaches (also called decentralized manufacturing) [3,4,5]. It opened the way for a new method of product distribution for local manufacturing of parts based on validated digital models found in online repositories. As a result, increased sustainability of industrial activity is expected considering the reduced need for product transportation and the possibility to use recycled polymers for the needed printer consumables [4,6,7,8,9]. Many FFF 3D printers have been developed and are distributed commercially or via open-source methods [5,9,10,11,12,13]. Their performance in terms of dimensional precision for the printed parts is generally expected to be proportional with the cost of the printer, resulting from the use of positioning systems (motors, sensors, mechanical parts, hardware, and software) with higher resolution and precision. The challenge for such technology is to increase the ratio of quality of the printed parts over the printer and manufacturing costs.
FFF 3D printers typically use polymer-based filaments extruded at a controlled temperature and flow rate to form objects for various uses, from decorations and toy figurines to replacement parts or useful basic objects (e.g., smartphone holders and casings) [14,15,16], as well as medical devices [17,18]. The quality of the obtained printed parts regarding their geometrical and process parameters is critical. It has been therefore extensively studied in recent years [2,19,20,21,22,23]. Friction coefficients of such printed materials are also studied [24,25,26,27,28,29]. Motion functions of FFF 3D-printed mechanical parts with tight tolerance and fit requirements are key to allowing quality manufacturing of more sophisticated object designs [19,25,30]. Recent works have improved the quality of 3D-printed polymer mechanical components, through advanced design tools [31] or filament materials [32,33]. The 3D-printed piston–cylinder pairs are desirable for applications such as low-cost linear pneumatic actuators [34,35] and other applications where relative sliding motion is desired at lower cost than the traditional manufacturing process (i.e., for metal piston–cylinder pairs). This topic is being discussed in online blogs, showing the public’s interest in this mechanical function [36,37,38,39].
The goal of this paper is to address a lack of rigorous analysis of such devices. We present here a study on the influence of FFF 3D printing process parameters on the running and sliding fit of a piston–cylinder assembly and on their coaxial relative motion. The novelty in this study is the focus on the precision of a relative value (i.e., the allowance between two objects to be assembled) instead of the precision of absolute values to obtain the desired fits. Figure 1 lists in a non-exhaustive manner the main parameters possibly influencing the FFF 3D manufacturing process to control such fits. The following parameters are included in this study: FFF printer quality, material, position on the print bed or build plate, layer thickness, and seam position (the location where the printer head starts each new layer). Other parameters like printing speed, extrusion temperature, and infill density were set according to the manufacturer default settings for optimal results.
Typically, when speaking of piston–cylinder assemblies, or shaft–hole pairs, the fit and tolerance levels can be defined based on the desired application. For classical machining processes of such assemblies (with limited surface imperfections), international standards, such as the ANSI B4.1 or the ISO 286-1 standards, precisely define the required tolerances for each type of fit [Ref ANSI, Ref. ISO]. The ANSI terminology was used in this study. Running or sliding (RC) fits with a significant difference between shaft and hole diameters are required for applications where the piston needs to slide axially in the cylinder. Locational fits (LC) require similar shaft and hole diameters for precise radial positioning, and force or shrink (FN) fits are those where the shaft diameter is larger than the hole diameter and must be forced into a semipermanent connection. Due to the non-negligible surface imperfections of FFF 3D-printed parts (i.e., coarse tolerances and irregular surfaces caused by systematic and random errors), these standards are not straightforward to apply. A desired fit with corresponding allowance is still difficult to achieve. A precise understanding of the limits of this manufacturing process is needed to obtain the most possible reliable sliding and running function. The two main questions addressed in this article are as follows:
  • How well can an allowance for sliding and running fit be controlled despite the following factors: imprecision of FFF printers, position on build plate, layer thicknesses, and choice of materials?
  • Considering specific allowances for sliding and running fit, what kind of friction can be expected from FFF 3D-printed assemblies, and what are the effects of layer thickness and seam type?
Bearing in mind the number of factors, to answer these questions, this work focused on the process parameters of influence rather than on an exhaustive comparative study.

2. Materials and Methods

2.1. Equipment

This study used 3 common FFF 3D printers at different price points. The main FFF 3D printer used for this study is a mid-range X1-Carbon 3D Printer equipped with an automatic material system from Bambu Lab (Shenzhen Tuozhu Technology Co., Ltd., Shenzhen, China). Two additional printers were used for comparison: a high-end F170 3D printer from Stratasys (Stratasys Ltd., Eden Prairie, MN, USA), and a low-cost Original Prusa Mini from Prusa Research (Prusa Research a.s., Prague, Czech Republic). For the coherence of the performance comparison, these 3 printers used similar nozzle diameters (0.4 mm for both Bambu Lab and PRUSA, and 0.38 mm for Stratasys).
A digital micrometer from Mitutoyo (MI-293-721-30) and an electronic caliper from Fowler-Sylvac (SKU: 541001000) both with 0.001 mm resolution were used for dimensional measurements of the 3D-printed parts (wall thicknesses and piston diameters, respectively). A bore gage was used in connection with the digital micrometer for precise measurement of the cylinder holes.
Surface quality images of printed parts were acquired using a Keyence VHX 7000 digital stereomicroscope (Keyence Corp., Osaka, Japan). This system allows for automatic digital image processing using a focus-stacking 3D depth composition method for quantitative profile analysis from its embedded software.
Force measurements for the motion of the piston in the cylinder were performed using a 1kip Mini Tensile Tester from Instron. The test parts were attached to the instrument vise using a specifically designed fixture holding the bases of the tested parts.
Minitab 22.1.0 (Minitab, LLC, State College, PA, USA), a software for statistical analysis of variance (ANOVA) calculation, was used to analyze a part of the data to determine the significance of various factors, including printer type, material, print orientation, day of printing, and target part thickness.

2.2. Dimensional Control

To study the allowance, the resulting fits, and the friction of 3D-printed parts, the printers’ performance—first for small thickness variations, then for circularity of cylindrical parts—needed to be assessed. Such information is generally not found in the manufacturer specifications. For this purpose, two different test geometries were designed: first with a specifically longitudinal wall design, and secondly with cylindrical parts to be assembled. The relation between these two test geometries was also examined. Except when indicated, the layer thickness used to print all parts was 0.20 mm.

2.2.1. Wall Structures

The first tests comprised wall structures made of 11 linear adjacent walls with thicknesses increasing from 2.0 mm to 2.1 mm with 10 mm steps. To verify the potential dependance to the printing direction, this test part was printed along 3 different directions in the same run: along the X-axis or at 0 DEG, along its perpendicular Y-axis or at 90 DEG, and at 45 DEG (see Figure 2a). These dimensions were chosen to test the built-in motions system of the nozzle printhead considering the tolerances needed for a given type of fit. In general, the printhead motion in the X or Y directions requires the control of the corresponding X or Y motor, respectively. Moving the printhead in any other direction is more challenging in terms of position control, since it requires the simultaneous precise motion of both motors. The exact printhead motions used for the extruded filament deposition are shown in Table A1 and Table A2 (Appendix A). They reflect the slicer generated G-codes for the three printers used. The wall thicknesses are controlled by the number of parallel melted filaments extruded, as well as by the control of their deposited width that depends on the extrusion parameters (“flow rate”/”tool head movement speed” ratio) [40]. These test structures highlighted the printers’ performances for such controls. For statistical purposes, each group of test parts was printed three times, each on a different day. Each thickness was measured three times. Their averages and standard deviations were then calculated from the results.

2.2.2. Cylinders and Pistons to Be Assembled

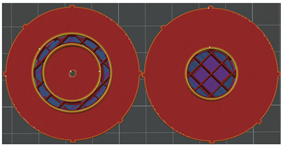
The second series of tests were based on a set of two cylindrical parts consisting of a cylinder and a piston (see Figure 2b). The cylinder piece was made of a cylindrical tube with a nominal inner diameter of 20 mm and outer diameter of 30 mm on top of a 50 mm diameter disc-shaped base that was 5 mm thick. The piston contained a shaft with a nominal diameter of 20 mm, on top of a base similar to the cylinder. These bases were used to facilitate testing, especially to avoid unwanted attachment stress transmission, thereby changing the studied clearance during the tensile tests. Marks were placed on top of the parts and on the edge of their base to identify the radial X and Y axes at 90 DEG, as well as the diagonal direction at 45 DEG. The measurements were taken three times in each of these three directions at about half-way up the part. The averages and standard deviations of the measurements were then calculated from the results. The design of the cylinder included a small hole through the base to allow the air to evacuate when a piston moved in a cylinder. This avoided a pressure increase that could have caused possible measurement errors. The paths and in-fill patterns used for these parts are shown in Table A3.

2.2.3. Choice of Filament Material

PLA and ABS filaments were used with the Bambu Lab printer. Only ABS was used with the Stratasys printer, and only PLA was used with the Prusa printer. With the Bambu Lab printer, two colors and types of PLA filaments were used: PLA Basic in Bambu green and PLA Matte in lilac purple from the same company. These materials were chosen because they are commonly used across many types of FFF 3D printers.

2.2.4. Position on the Build Plate

This study examined how the positioning of parts on the build plate affected the fit between the resulting cylinder and piston assembly. This was done by printing on the Bambu Lab build plate, as illustrated in Figure 2c, with the design of alternating 20.000 mm inner diameter cylinders and 19.960 mm diameter pistons in a 4 × 4 matrix layout, for a target fit allowance of 40 mm. Three series were printed on different days using Bambu green PLA Basic filament. Dimensional measurements were performed on all parts. The resulting friction of their assemblies was studied with the tensile tester.

2.3. Friction of Running and Sliding Fit Types

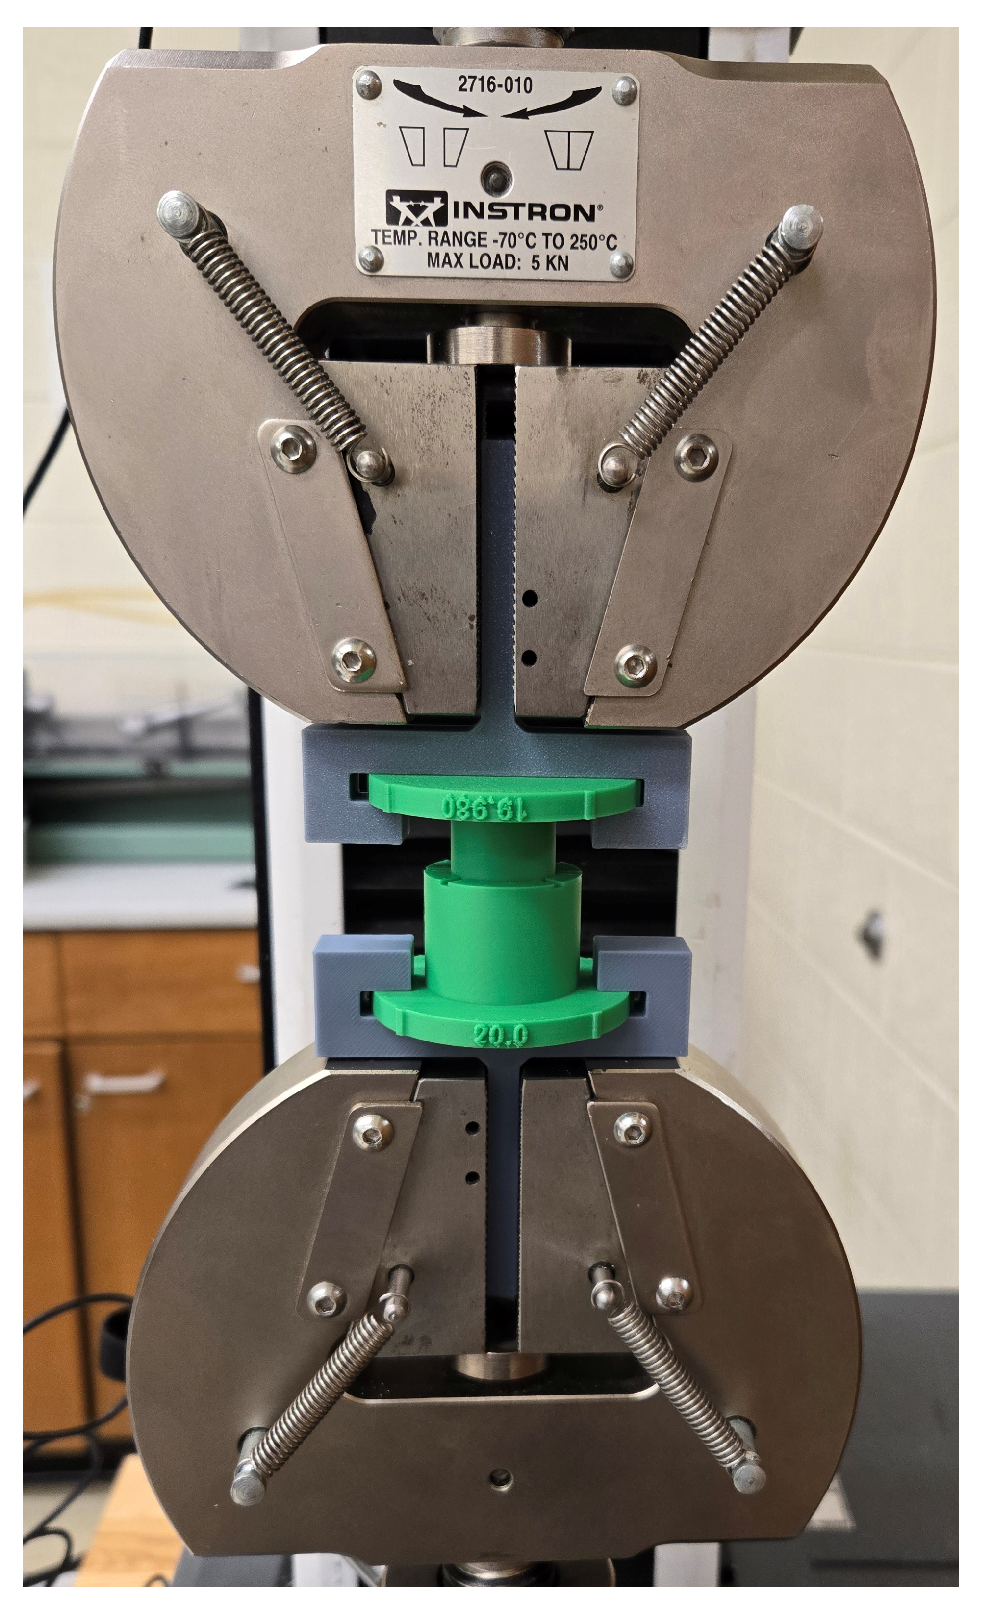
Piston–cylinder assemblies were tested in the tensile tester, and the friction force was measured with a 500 N load cell and a 6 ms sampling rate. The assemblies were held in the vise jaws with custom-built holders (see Figure 3), and the piston–cylinder relative angular position was kept alike. The tensile tester then completed an initial phase of pushing the piston down 5 mm and then completing four test iterations in a cyclic manner by further pushing the piston down 10 mm and pulling it back up 10 mm. Each iteration had a different speed: 1.0, 2.5, 5.0, and 10.0 mm/s. The data, saved in a .csv format, were analyzed with Microsoft Excel.

2.4. Other Influences

2.4.1. Layer Thickness

A significant parameter to be set for the FFF 3D printing process is the choice of layer thickness. This parameter will determine the print time needed for a given part in a practically proportional manner. It will also affect the appearance and the smoothness of the part surfaces. The influence of this parameter on the inner and outer diameters of the cylinder and the piston, respectively, as well as on the resulting clearance and friction behavior, was studied—with three pairs of parts to be assembled—of 0.28 mm, 0.20 mm, 0.15 mm, and 0.10 mm layer thicknesses. Each part’s position in each batch was kept identical to prevent influences caused by the printing position on the build plate.

2.4.2. Seam Type

Most parts were printed with an aligned seam type, as this is commonly chosen in FFF 3D printing. However, to observe the effect of a random seam type on fit and friction, a series of three pairs of cylinders and pistons was printed with both types of seams. They were printed at the same position on the build plate.

2.4.3. Piston–Cylinder Relative Angular Position

Because of circularity errors, the influence of the relative angular position of the piston in the cylinder on the friction forces was investigated. For this purpose, the geometrical parameters and the resulting friction behaviors of three assemblies with different fits were measured at three different relative angular positions: 0 DEG (the relative angle used by default in this paper), 45 DEG, and 90 DEG.

2.5. Mathematical Model of Friction Force

A simple mathematical model of the friction force as a function of displacement for FFF 3D-printed cylinder and piston assemblies was developed to better study, describe, and discuss the observed phenomena.
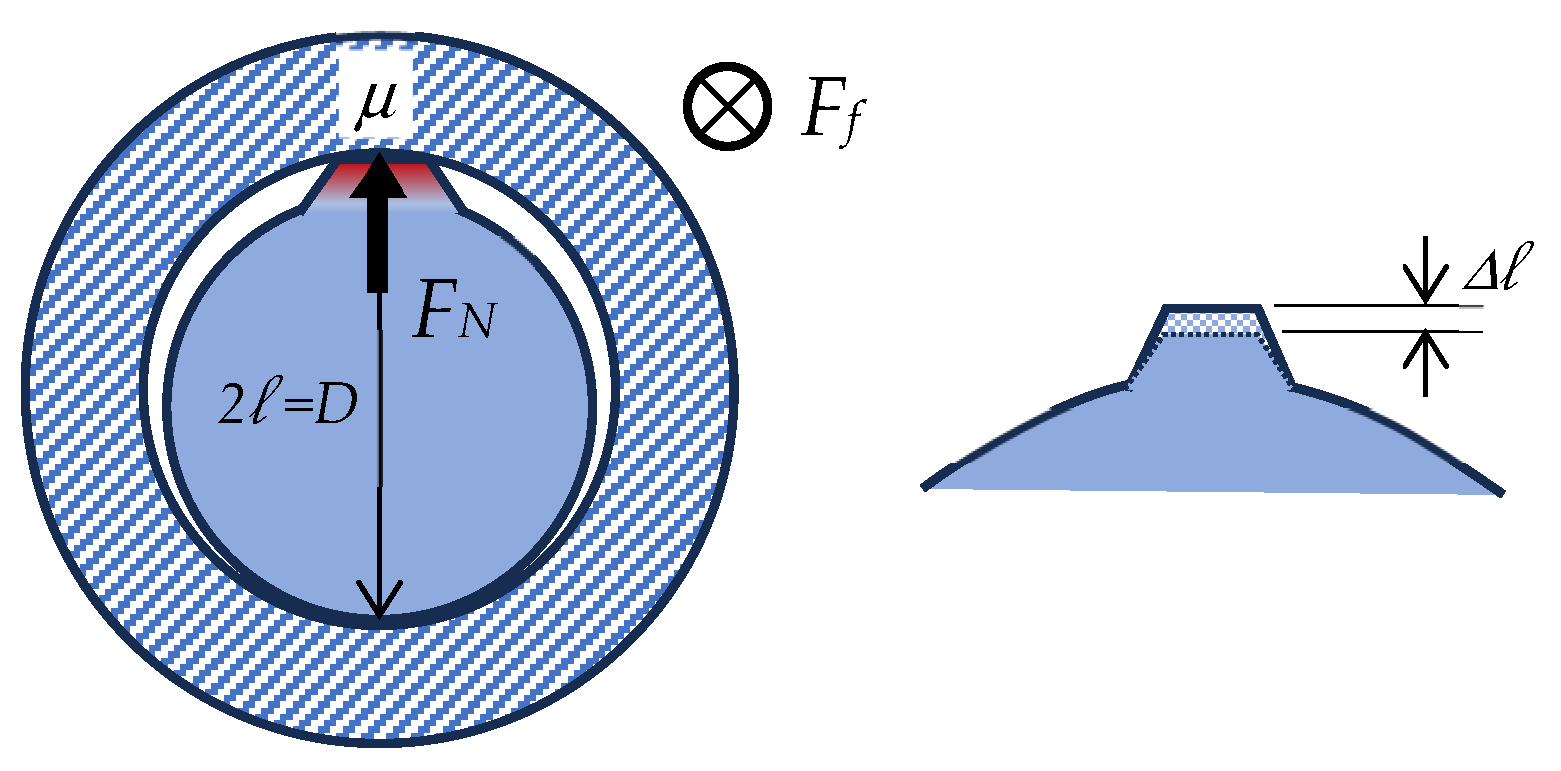
Figure 4 illustrates the elementary contribution of one contact point to the overall friction phenomena. It is approximated to a tiny local protuberance, at the surface of the piston (e.g., caused by the seam), that is strained in the inner diameter of the cylinder and is put under stress. The friction force Ff of this elementary contribution can be expressed with the following formulas in its general and local forms, respectively:
F f = μ · F N   τ = μ · p   μ = τ p
with μ being the coefficient of friction depending on the materials involved, FN the normal force applied, τ the tangential (shear) stress, and p the normal pressure resulting from FN spread over that surface.
Hooke’s law, describing the Young’s modulus E as the proportional coefficient between stress σ and strain ε (or the proportional length change Δl/l), was simplified, considering the unknows and the numerous elementary contributions to be expected all around the piston surface, as described in the following expression with half of its diameter D:
σ = ε · E = l l · E = l D 2 · E
Stress and pressure were considered as identical in this context, where the tangential stress is written as the ratio of the friction force divided by the area of the elementary point of contact Ac, as expressed below:
p = σ   ;   τ = F f A c
Considering these equations, the friction coefficient was calculated as follows:
μ = F f A c · ε · E = F f · l A c · l · E = F f · D 2 A c · l · E
The elementary friction force contribution was expressed as follows:
F f = μ · 2 D · A c · l · E
The total friction force or the sum of all elementary friction force contributions was expressed as follows:
F f , t o t a l = F f = μ · 2 D · l · E · A c , t o t a l = μ · 2 D · l · E · π · D · z · k c z , z ˙
where Ac,total is the total contact area, or the part of the area of the piston overlayed with the cylinder with active contact, and kc is the contact coefficient, herein a function of the position z and the piston speed z ˙ relative to the stationary cylinder. This dependance of kc to position and speed seeks to consider in a simple form (1) the effect of alternating peaks and valleys of the surfaces in contact and (2) the dynamic phenomenon related to the viscoelastic properties of polymer materials [41,42] possibly combined with local squeeze film effects [43,44]. z is the axial displacement of the piston inside the cylinder with the reference position at the initial insertion point. The equation can be simplified and rewritten in the following form, reflecting the friction force law:
F f , t o t a l = μ · 2 π · E · l · k c z , z ˙ · z = μ · F N , a p p a r e n t
with FN,apparent being the total apparent normal force on the overlapping area:
F N , a p p a r e n t = 2 π · E · l · k c z , z ˙ · z
To consider the periodic nature of the contact coefficient reflecting the expected higher and lower friction force when the layer undulations of the assembled cylinder and piston are aligned or not aligned, respectively, k c z , z ˙ is expressed as
k c z , z ˙ = k c ^ · 1 + B z ˙ · c o s ( 2 π · z h l a y e r + φ )
As suggested above, speed was considered in the model as a factor influencing the number of active points of contact. k c ^ , expresses the nominal contact coefficient, and B z ˙ is the amplitude of oscillations that depends on the displacement speed of the piston inside the cylinder. hlayer is the layer thickness of the printed part, and ϕ is the phase shift.
This model was adjusted manually to match the experimental measurements as best as possible with the corresponding calculated signals. Three useful parameters were extracted from the model for the comparison of friction forces: the slope of the apparent normal force per unit of overlay distance s = 2 π · E · l · k c ^ , the maximal baseline friction force F f ,   t o t a l ,   b a s e m a x = μ · s · z m a x , and F f ,   t o t a l ,   o s c i l m a x as the maximal oscillating amplitude of F f ,   t o t a l at the maximal depth in the compression cycle:
F f , t o t a l ,   o s c i l m a x = F f ,   t o t a l ,   b a s e m a x   · B z ˙
In the model, the Young’s modulus E and friction coefficient μ used for PLA were 3.5 GPa and 0.25, respectively [25]. The nominal diameter D used was 2·10−2 m. For each fit, the value of Δl was extrapolated from the apparent clearance obtained empirically with the different fits, from loose running (Δl = 0) to locational clearance (Δl > 0). B z ˙ was determined empirically from the measurement at four different speeds. k c ^ was unknown and was used as the main adjustment parameters in the model, once the values B z ˙ were established.

Assumptions and Limitations of the Model

This model was developed using Hooke’s law, which assumes that the stress is proportional to the deformation ( σ = E · ε ), which corresponds to a model with a purely elastic behavior (similar to common spring theorems F = k · x ). This approximation is valid for small deformations, such as those that occur at the contact points between the pistons and cylinders. Additionally, we assumed that the materials are anisotropic and homogeneous and that the cylinder is stationary and rigid, allowing us to calculate the deformation and motion of the piston. This analytical model considered the ideal cylindricity of the tested parts. These assumptions allow for the model to represent the friction force during sliding but do not provide exact deformation and stress calculations between the two rigid bodies. To improve the accuracy of the model in future iterations, one should refine the model by adding a dashpot in parallel to the elastic element to consider viscoelastic behavior of the polymers using, e.g., the Kelvin–Voigt model [45].

3. Results and Discussion

3.1. Assessment of Main Printer Performances for Geometrical Compliance

3.1.1. Resulting Thicknesses of Wall Test Structures

Minitab statistical software was used to create a general linear model and perform multi-factor analysis of variance (ANOVA) statistical tests on the results of the wall thickness measurements. Factors included in the ANOVA include the target value of each wall segment, the printing orientation, and the day of printing (3 consecutive days). ANOVA was performed for each individual printer/material combination and again for all measurements, adding the material and printer as additional factors. All main effects plots and interaction plots for the ANOVA tests are included in the Supplementary Information as Figures S1–S10. Additionally, Figure 5 shows interaction plots of the mean wall thickness for each target thickness level for different printers and materials. From Figure 5, we observe that the Prusa printer resulted in the largest spread in wall thickness measurements and different thickness values due to the print orientation (p = 0.001 between 0 and 45 DEG; p = 0.064 between 45 and 90 DEG). There was a significant effect of the printing day for the Bambu Lab printer with ABS material, as the mean thickness values of day 2 were always lower than the other days (p < 0.001 for all 3 days). Also, the 45 DEG orientation for the Bambu Lab printer with PLA material appeared to always result in a smaller mean thickness than the other orientations, indicating a significant interaction (p < 0.001 between 0 and 45 DEG and between 45 and 90 DEG). The Stratasys printer showed little difference in any target thickness values between 2000 and 2080 mm, as well as significantly smaller thickness values for 45 DEG, compared to the other orientations (p < 0.001 between 0 and 45 DEG and between 45 and 90 DEG).
Figure 6 shows interaction plots between target thickness and printer type (a) and between target value and print orientation (b) for all thickness measurements combined. The choice of printer type was found significant with 95% confidence intervals regarding the precision and the accuracy of the obtained thicknesses. We see that the Bambu Lab printer showed a much more repeatable increase in wall thickness with increasing target thickness compared to the other printer types. All wall thicknesses were printed with the same number of passes, so this indicates that the Bambu Lab printer had more precise control over additional parameters that affect the thickness (such as extrusion speed and nozzle speed) than the other printers. We also observed that the 45 DEG printing orientation was generally thinner and the 90 DEG orientation had a less predictable increase in wall thickness than the other orientations. This is likely due to the different path of the print nozzle at the 45 DEG orientation compared to the other orientations (see Appendix A).
We also observed that the first (2000 µm) and last (2100 µm) target wall thicknesses on each sample tended to have greater variation from the rest of the wall thickness measurements. This was likely due to the path of the print head switching directions and turning around as it reached the end of the part. In the following sections, the end wall thicknesses are excluded from the analysis.

3.1.2. Resulting Thickness Differences of Wall Test Structure

For FFF 3D-printed parts to be assembled with a sliding or running function, the relative dimensional geometric values are more pertinent than their absolute values. To study the printers’ ability to maintain a constant fit between two parts, we analyzed wall test structures with designed thickness differences. Along with the ANOVA results of measured wall thickness, the measured difference between walls (mimicking a relative distance or a clearance between two surfaces) that were nominally 50 µm different were calculated (i.e., the clearance between 2090 and 2040 mm and between 2060 and 2010 mm target wall thicknesses). Tukey pairwise comparisons were conducted to evaluate the statistical significance of the differences between mean clearance values measured with different factor levels.
Figure 7 shows the 95% confidence intervals of the difference of the means. In this test, if the confidence intervals include the 0 value, there is no significant difference (95% confidence) between the factor levels in question. From Figure 7, we see that there was a significant difference based on the printing day only for the Prusa printer with PLA material, where day 1 was different from the other two days. All other printers and materials were not significantly different from each other, indicating that in most instances, 3D printers are repeatable from day to day in similar environmental conditions. We also see that the 45 DEG orientation was significantly different from the other orientations for the Stratasys printer with ABS material. The 90 DEG orientation was different from the other orientations for the Bambu Lab printer with ABS material. For the Bambu Lab printer with PLA and the Prusa printer with PLA, all three print orientations were significantly different from each other. This indicates that the print orientation is a significant factor that cannot be ignored when considering the accuracy, precision, and relative clearance dimensions of FFF 3D-printed parts. The ranges of the confidence intervals for Bambu Lab were very small (~12 mm ABS, ~9 mm PLA), but were much larger for the PRUSA (~60 mm) and Stratasys (~73 mm). This showed a higher repeatability of results for the Bambu Lab printer.

3.1.3. Surface Topography of Cylindrical Shapes

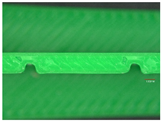
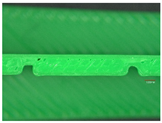
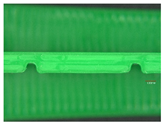
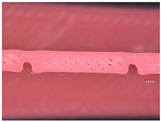
Figure 8 shows typical topographical views of FFF 3D-printed piston surfaces (20.000 mm diameter target values) with aligned seams for the two materials and the three printers used. The general views (with 20X magnification) were isometric views of the curved surfaces, showing the overall surface irregularities causing errors of circularity and cylindricity. The detailed inset views (with 200X magnification) were top views of the surface, with the height indicated with color (red is highest, blue is lowest) showing a local regular alignment of the layers. Not considering the edge effects on these isometric views, the surface showed more overall uniformity with the Stratasys printer than with the others, suggesting that the control of the printing parameters resulted in a better layer-on-layer printing repeatability.
Typical surface roughness with the arithmetic mean deviation Ra and the maximum depth of motifs Rz (measured with a 200X magnification) are presented in Table 1. The Ra values for ABS material printed with both printers had similar values. The Rz values with the Stratasys printer were smaller than with the Bambu Lab printer because of the smooth surface finish of the parts printed by the Stratasys printer. The surface roughness of PLA material with the Prusa printer had Ra and Rz values larger than with the Bambu Lab printer. Comparing ABS and PLA surface roughness results with the Bambu Lab printer, the PLA surface had a higher Ra value, but a smaller Rz.

3.1.4. Impact of Print Orientation Dependance on Circularity Error

Table 2 presents the results for piston and cylinder parts printed in ABS and PLA with the three printer types. We define circularity error as the ratio of the maximal absolute value of the measured deviations from the calculated average diameter, divided by the same average diameter, based on the measurement along the 0 DEG, 45 DEG, and 90 DEG axes.
For 20.000 mm diameter parts, a 0.1% diameter circularity error means ±20 mm. These results show that no significant difference is observed between ABS and PLA. The Bambu Lab printer showed in general a smaller error than the Prusa and Stratasys printers. The Stratasys printer showed a larger measured circularity error for cylinder holes when compared to the other printers. When considering the results on the variance analysis for pairs of walls in Section 3.1.2, the smaller variance from the Bambu Lab printer may be directly related with the smaller circularity error observed in cylindrical parts.

3.1.5. Influence of Position on the Print Bed

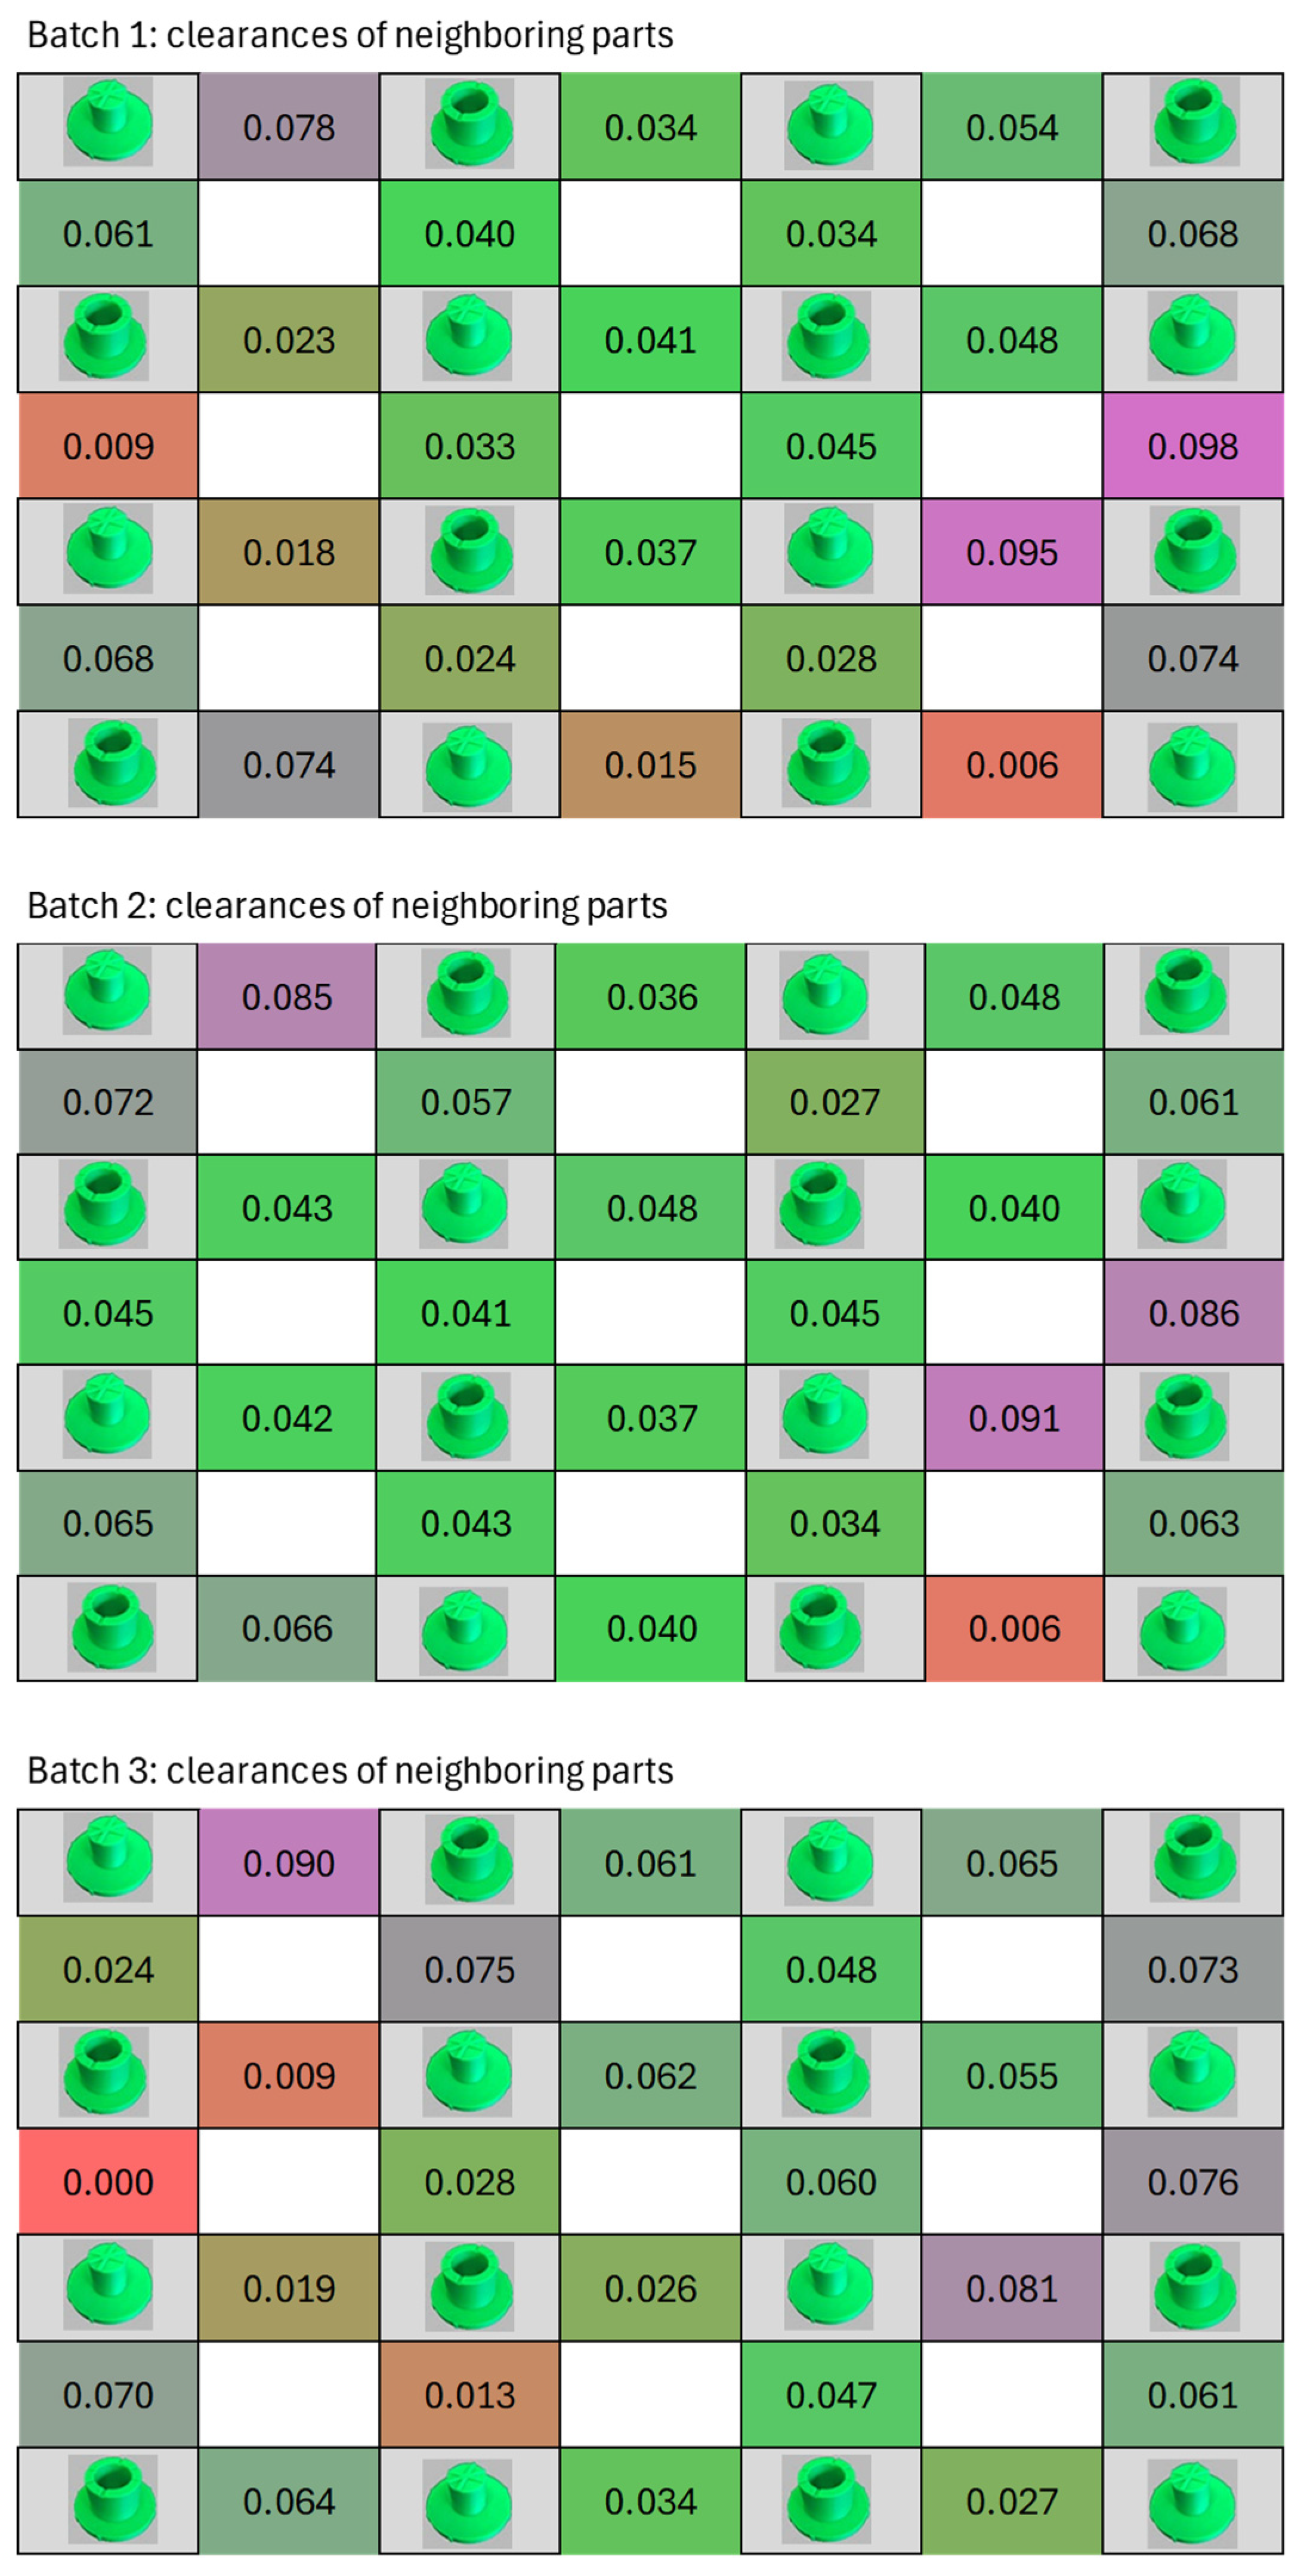
This study was performed with three batches of piston–cylinder pairs in PLA green Basic printed with the Bambu Lab printer with aligned seams. The results of the study are presented in Figure 9 and show the effects caused by the position on the plate. The deviations in mm from the targeted 20.000 mm cylinder inner diameter and from the targeted 19.960 mm piston diameter are presented schematically in Figure 9a in red and blue, respectively. The position in the table indicates the printing position in reference to Figure 2c. The cell color gradients indicate the deviation’s quantity: intense color for large deviations, and light color for the lowest deviations. Figure 9b shows the calculated average clearance mapping in mm when considering the assembly of neighboring piston–cylinder pairs (n = 3). Their locations are also represented in the table. The green color of the cell indicates the parts with measured allowances close to the target. The smaller allowances have colors tending towards orange, while the larger allowances have colors tending towards purple. The cells with thicker borders indicate the printing positions of the three pairs of parts (A, B, C) assembled and used for other analysis in this paper. The standard deviations for the diameter measurements along each axis for the three printed series were lower than 20 mm (n = 48). For piston–cylinder pair combinations at fixed printing position, the standard deviation of the average calculated clearances was up to 29 mm (n = 72). The clearance variations were mainly printing position dependent and much less day dependent, confirming the observations with the wall test structures illustrated in Figure 7c. Figure A1 (see Appendix B) presents the measured clearances for each of the three batches used for Figure 9b.
From Figure 9a,b, we note that both the pistons and cylinders were smaller than the target values, with similar maximal deviations. The combinations in the lower right-hand corner of the build plate showed the least deviation for both pistons and cylinders, but the values of these deviations were different, and the fit between the assembled parts was not the expected value. The expected fits occurred near the center of the build plate, where both pistons and cylinders had similar deviations from the target values. Therefore, with the Bambu Lab printer used in this study, printing piston–cylinder pairs in the center of the printing bed was recommended to obtain the desired clearance. To generalize this recommendation to other printers, further investigation would be necessary. For piston and cylinder parts assembled after printing, the position on the print bed is a key factor. For any printer, it should be controlled.

3.2. Associating Dimensions with Friction Force Measurements

3.2.1. Friction Force Measurements and Test of Concept Model

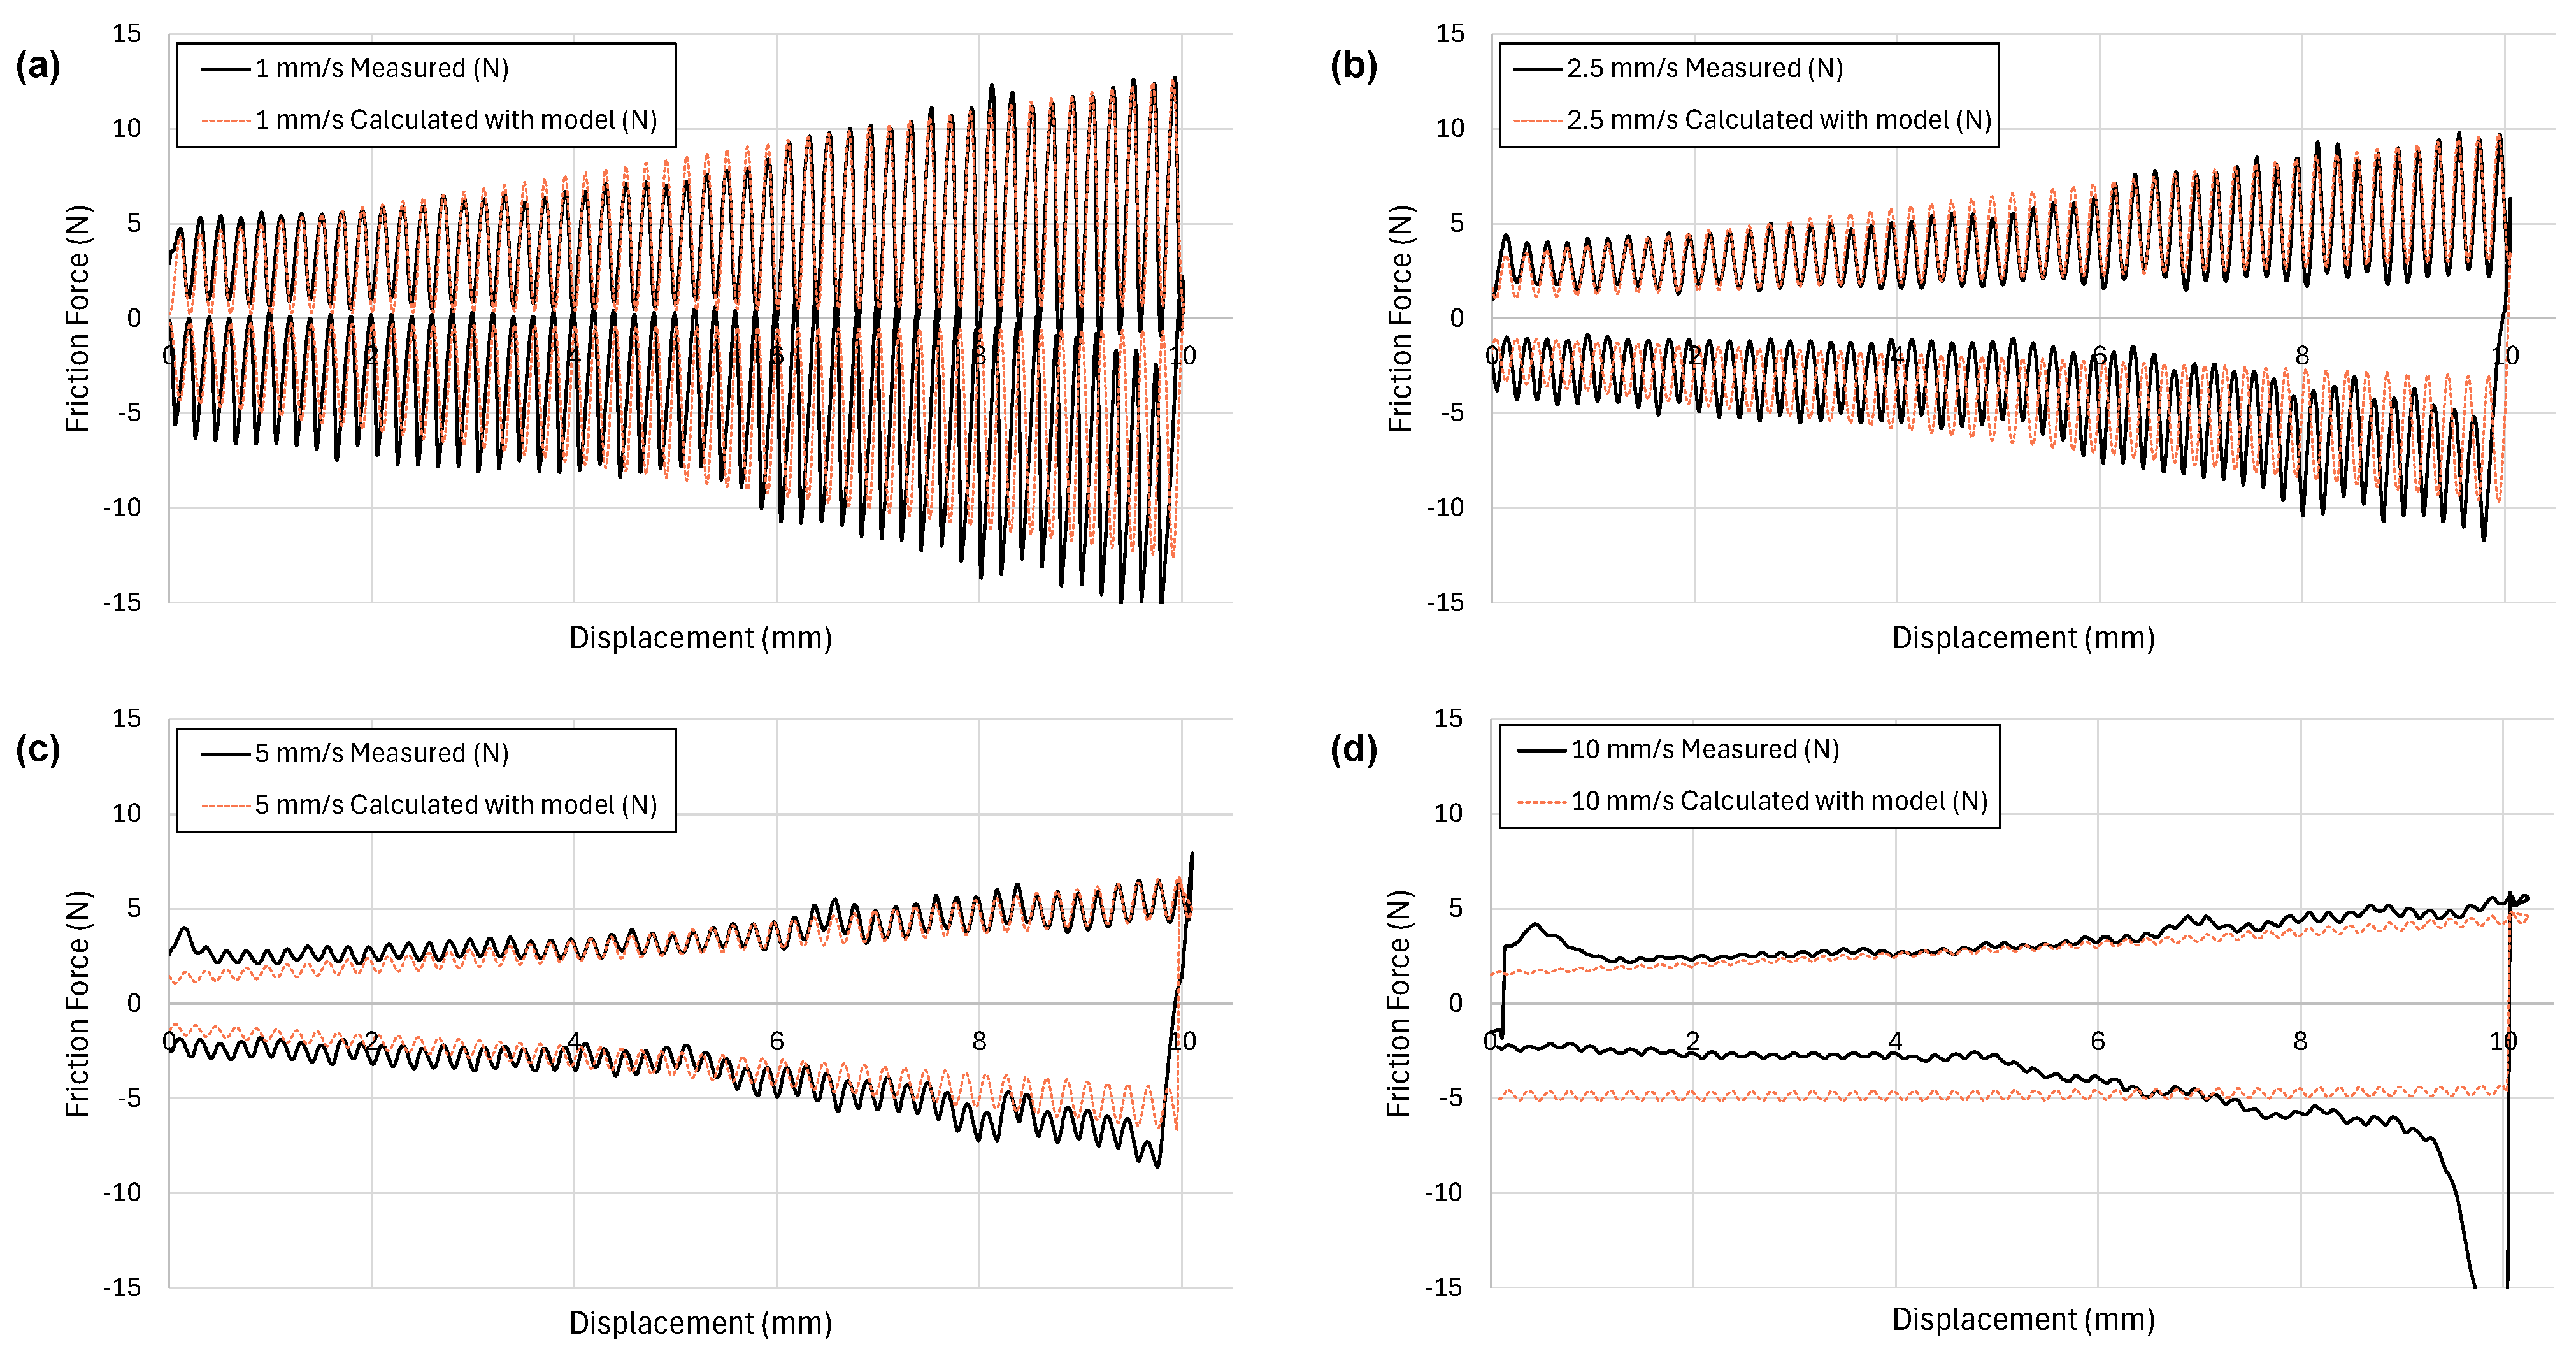
This study was performed with piston–cylinder pairs in lilac purple PLA Matte printed with the Bambu Lab printer with aligned seams. The experimental results of the measured diameters for an FFF 3D-printed piston–cylinder assembly are shown in Table 3. These results detail how the inner diameter of the cylinder and the diameter of the piston varied depending on their measurements along the X-axis (0 DEG), or Y-axis (90 DEG), or at 45 DEG. The measured values showed a smaller dependance to these axes for the cylinder than for the pistons. The observed variations were not only caused by axis distortions but also by the irregularities and the surface roughness of the measured diameters, by the presence of the seam, and by the measurement method. Interestingly, the value of the clearance obtained from the measurement and the value of their standard deviations were similar, suggesting an imprecisely defined clearance. The resulting measured friction forces when moving the piston inside the cylinder are shown in Figure 10. The black lines of the graphs show the experimental results, while the orange dashed lines show calculation results from the developed concept model for analysis purposes. The top part of the signals (positive force) corresponds to the friction force during the compression phase of the cycle, when the piston moved down in the cylinder. The lower part of the signal (negative force) corresponds to the friction force during the tension phase of the cycle, going back to the start position (at 5 mm deep). These signals show an increase in the friction force and in its oscillations as the piston is inserted deeper inside the cylinder. This corresponds to an increased surface of contact and more material deformation contributing to the friction forces. The discrepancies between the experimental results and the corresponding calculated model were presumably due to dimensional uniformities. In this case, these discrepancies could be an interesting indicator of the print quality.
The measurements at different speeds (1.0, 2.5, 5.0, and 10.0 mm/s) showed a strong decrease in the oscillation signal amplitude as the displacement speed increased. The lower speeds were expected to highlight static friction phenomena, where each surface undulation was interlaced with each other, leading to strong oscillations. Conversely, the higher speeds seemed to show dynamic overflight friction phenomena with reduced oscillations. Similar behavior was observed and reported for friction characteristics of FFF 3D-printed planar test parts [27]. The baseline (i.e., midpoint of the oscillations) of the friction force signal increased almost proportionally with the inserted depth as the piston moved down and increased the contact surface area. The effect of the displacement speed on the baseline friction force remained limited.
The behavior calculated with the model closely matched the signals in the compression phase, especially for 1.0, 2.5, and 5.0 mm/s speeds z ˙ . There was a close correspondence between the experiment and the model regarding the undulations period of 0.20 mm matching the value of the layer thickness. In the tensile phase, it showed larger discrepancies, especially at the beginning of cycles and high displacement values. A phase shift could be observed at large friction forces in this tensile phase. This was presumably caused, at high tensile forces, by a strain in the fixture holding the bases of the tested parts. Table 4 provides the forces extracted using the mathematical model, as well as the other parameters used in the model.

3.2.2. Friction of Running and Sliding Clearance Types

This study was performed with piston–cylinder pairs in lilac purple PLA Matte printed with the Bambu Lab printer with aligned seams and different clearance values, corresponding to different running and sliding fits. Figure 11 graphs the measured friction force in black as a function of the displacement at 1 mm/s speed for five different clearance fits. This was an attempt to categorize them in different types of running and sliding clearance fits inspired by the ANSI B4.1 standard. Figure 11a–e is associated with measured clearance ranges of [-0.052–0.168 mm], [0.005–0.201 mm], [0.003–0.224], [0.024–0.235], and [0.157–0.280], respectively, to approximate equivalents RC5, RC6, RC7, RC8, and RC9 fit types. The signals in orange showed the corresponding result from the model. Figure 11f graphically presents the measured clearances—showing the variability range (i.e., the standard deviations)—with their corresponding calculated clearance. This suggests similarities with the graphical representation of clearance fits in ANSI B4.1 [46]. Finding a clear equivalence between the studied fits with those defined in the standards was not the goal of this study. Similarly, clearances for sliding and running fits with FFF 3D-printed parts had different adjustable levels of mobility similar to classical machining processes. However, the presence of oscillating forces, whose magnitude depended on the motion speed, was a fundamental difference. A reduction or precise control of these oscillating forces could open the way to future standardization with the goal to promote the interchangeability of FFF 3D-printed sliding or running parts, distributed in a decentralized manner.
As described above, in the compression phase with positive friction forces, the model was comparable with the measurements. It showed some discrepancies highlighting presumed non-uniformity in the printed cylindric geometries. In the tensile phase, these discrepancies were larger over the whole range for looser clearance fits, and at high forces for tighter clearance fits. Table 5 shows the parameters used in the model to fit the signals in the compression phase. As clearance decreased, the following parameters showed significant increase: extracted values of slope s, the maximal baseline friction force, and the maximal oscillating amplitude. The slope s represents the apparent normal force per unit of overlay distance. From the dimensional measurements and the friction force measurements, a neutral gap or an apparent zero friction force clearance value of 207 mm was assessed. The apparent strain values l were then calculated as the difference between this neutral gap value and the average measured clearance for assembly. For RC5eq, the following calculation for l was made: 207 mm − 45 mm = 162 mm.

3.2.3. Fits Variability

To study the variability of a fit when printed with the same printer, the same material (PLA—5 in green Basic and 2 in lilac purple Matte), and at the same position, seven batches of three piston–cylinder pairs with identical designs (cylinder with 20.000 mm diameter and piston with 19.960 mm diameter) were printed with the Bambu Lab printer at the same positions (A, B, and C as defined in Figure 9) and measured. When not considering the printing position as fixed, the relative standard deviations of friction forces, extracted as described in the previous section, were as follows:
  • Average measured variability of s and of Ff_total_base-max: ±86%;
  • Average measured variability of Ff_total_oscil-max: ±93%.
This significant variation of friction forces for a targeted fit could be strongly reduced when considering printing at a fixed position on the printer bed. In this case, the relative standard deviations of friction forces, extracted as described in the previous section, were as follows:
  • Average measured variability of s and of Ff_total_base-max: ±48%;
  • Average measured variability of Ff_total_oscil-max: ±49%.
These results showed the difficulty of maintaining a definite running and sliding fit if no attention was paid to the printing position on the build plate. However, by printing the piston–cylinder pair always at the same position on the built plate, an approximate friction force for a sliding and running fit could be maintained between printing batches.
The model suggests that the discrepancies with the friction behavior of the piston–cylinder assembly can be associated with the performance of a printer (regarding the cylindricity). This tensile test method could become a simple means to assess the quality of a printer for this type of application.
A future numerical model based on experimental results using a coordinate measuring machine is likely to increase its reliability. It could provide precise deformation over stress responses, sensitivity analysis on parameters, and anticipation of fits and friction forces considering the existing cylindricity errors.

3.3. Other Influences

Among the high number of other possible FFF 3D printing parameters of influence, three practical considerations are detailed hereafter.

3.3.1. Influence of Layer Thickness

Four batches of three pairs of piston–cylinders with increasing clearances were printed in lilac purple PLA Matte at positions “A”, “B”, and “C” indicated in Figure 9. Each batch was printed with a different layer thickness: 0.28 mm, 0.20 mm, 0.15 mm, and 0.10 mm. Using these parts, the influence of layer thickness on the dimensions and the resulting fit of piston–cylinder pairs were studied. Their clearances, obtained from the dimensional measurements of their diameters (including average with standard deviation, and full range of dispersed values), are presented in Table 6. This dispersion of measured values was caused mainly by the circularity errors of cylinders and pistons, and to a lesser degree by the measurement errors. For each layer thickness, the clearance in position A was smaller than the clearance in position B, which was smaller than position C. A change of the layer thickness caused a gradual change in the clearance values. This occurred mainly because the extruded material had a circular cross-section as it exited the nozzle. A thicker layer generated a wider deposited thread. Compared to the assembly with 0.20 mm layer thickness taken as reference, a 0.28 mm layer caused a strong reduction of the clearances, resulting in much tighter fits. Conversely, 0.15 mm and 0.10 mm layer thicknesses caused an increase in the clearances in positions A and B, and no significant changes in position C. The printer was unable to compensate for this phenomenon, resulting in decreasing clearances for increasing layer thickness.
The effect of layer thickness on the surface roughness of these piston–cylinder pairs was also studied. The results of this analysis are presented in Table 7. The Ra and Rz values decreased with the reduction of the layer thicknesses, indicating smoother surfaces. The friction force of these three pairs was measured with the tensile tester. At a speed of 1 mm/s, the extracted values of the slope s (the apparent normal force per unit of overlay distance), the maximal baseline friction force, and the maximum oscillating amplitude showed a strong trend towards a decrease in their values with the reduction of the layer thickness. This was due to the smoother surfaces and larger clearance values that resulted in lower friction forces as the layer thickness decreased. However, the measured friction values at 0.20 mm were slightly smaller than 0.15 mm.
These results showed that reducing the layer thickness when printing cylinders and pistons to be assembled provided a smoother surface; their measurable clearance increased; and in general their clearance fit’s type increased too, except if other non-uniformities appeared that may have been accidental or systematic.

3.3.2. Influence of the Seam Type

This study was performed with piston–cylinder pairs in Bambu green PLA Basic printed with the Bambu Lab printer. It included piston–cylinder pairs printed with aligned seams and random seams, both in position A, as defined in Figure 9. The measurement results of their diameters—measured along the three axes (see Table 8)—showed a close match of the values for both cylinders and pistons. The choice between these two seam types did not appear to influence their measured geometry parameters.
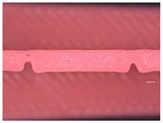
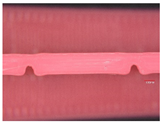
Figure 12 shows the typical friction force behavior difference between similar geometrically matching piston–cylinder assemblies with both the aligned seam type (Figure 12a) and the random seam type (Figure 12b). With aligned seams, the oscillating force signal grew continuously with the displacement. With random seams, the oscillating force signal was smaller but with strong interferences. These interferences were likely caused by contact between the unpredictable random seam locations on the pistons and cylinders. Interestingly, symmetry was observed in the compressive and tensile friction forces, as the same random seam locations came into contact at the same depths, but in opposite directions. The insets of the graphs in Figure 12 show microscopic views of the two different seam types on the pistons’ surfaces. As evident from these microscope images, the extruded polymer material resulted in extra thickness at the seam location due to over-extrusion as the print head changed motion to begin a new layer. The interactions between these seam locations caused the observed oscillations in friction forces.
Aligned seams, despite causing a small local linear protuberance along the diameters that increased the total friction forces, presented a more uniform and predictable behavior, as shown with the examples above.

3.3.3. Influence of Piston–Cylinder Relative Angular Position on Friction

In all previous friction tests, the relative angular positions between cylinders and pistons were controlled and adjusted to be identical using their added reference marks. Though, in consequence of the non-ideal circularity, the axial friction forces varied depending on their relative angular position. The experimental results of friction forces measured at three different relative angles between pistons and cylinders are presented in Table 9. They include the clearances calculated from the diameter measurements, the standard deviations, and the full range of measured values. The force values were extracted using the mathematical model presented above. These results showed a non-negligible change in the maximal baseline forces (between the smallest and the largest values) from 67% (pair 1) to 670% (pair 2) and from 100% (pair 3) to 2150% (pair 2) for the maximal oscillation forces. This change was due to the aforementioned cylindricity errors of the 3D-printed parts. Alignment with different angles will result in a different interference pattern between the peaks and valleys, as well as a different amount of material deformation as the piston slides in the cylinder.
These results indicated a stronger dependance of axial friction forces on the relative angular position. A direct correlation between the intensity of the force variations and the standard deviation of the clearance was observed. Therefore, to maintain the desired sliding and running fit behavior with a piston–cylinder assembly, the relative angular rotation between them needs to be impeded. On the other hand, this change of friction force due to this rotation—if well controlled—could be exploited for a specifically designed constrained motion path.

4. Summary and Conclusions

In this article, key aspects relating to the properties and the limitations of piston–cylinder assemblies with sliding and running fits when using FFF 3D printing have been studied. From all the obtained results, the key findings are as follows:
  • There is rarely a significant difference between consecutive printing days, indicating that most 3D printers are generally repeatable.
  • There is often a significant difference between different print orientations, indicating that the print orientation needs to be considered when designing the fit of interacting FFF parts.
  • The Bambu Lab printer showed the most repeatable change in wall thickness with the greatest resolution. The Stratasys printer resulted in the smoothest surfaces, and the Prusa printer showed the most variability.
  • Printing performances regarding precision and accuracy strongly depend on the printer type and are not necessarily related to the printer cost.
  • The location on the print bed can affect the dimensional accuracy of pistons and cylinders, making it impossible to target a definite clearance. With the Bambu Lab printer, the best tolerances for allowance in the assembled parts occurred near the center of the build plate, where both the piston and cylinder experienced similar deviations from target values; the resulting friction forces of the obtained fits could be defined with a ±50% relative variability.
  • The friction force of the piston sliding in the cylinder increased with the depth of the piston in the cylinder and showed oscillations as the different print layers interacted. The faster the sliding speed, the smaller the oscillations.
  • A simple analytical model based on Hooke’s law matched the friction force data well and can be used for different sliding speeds and clearance values.
  • Reducing the layer thickness when printing cylinders and pistons to be assembled will provide a smoother surface, increase their measurable clearance, and in general also increase their clearance fit type.
  • Random seams showed lower friction forces than aligned seams, but the aligned seams exhibited more uniform and predictable friction behavior.
  • The friction forces in the axial direction can vary depending on the angular position between piston and cylinder. Therefore, to maintain a desired sliding and running fit with a piston–cylinder assembly, the relative angular rotation between them needs to be impeded.
The international standards for shaft–hole fits do not yet include an adaptation for FFF 3D-printed parts with undulating surfaces caused by the piling up of layers with a given thickness. However, equivalent fit types can be suggested, including the oscillating nature of the result friction forces.
Based on this study, we believe that future generations of printers and printer software can include additional compensations to account for the presence of manufactured pistons and cylinders. These additional compensations should consider the various observed effects from this study, including the general non-significant variation of printing results at a defined position on the printer bed and the dependence on the layer thickness. With the use of artificial intelligence, we believe valuable enhancements can be made to future FFF 3D-printed parts.

Supplementary Materials

The following supporting information can be downloaded at https://www.mdpi.com/article/10.3390/jmmp8060249/s1, Figure S1: Main effects plots (left) and interaction plots (right) for ANOVA of wall thicknesses printed in ABS on the Bambu printer. Figure S2: Main effects plot (left) and interaction plot (right) for ANOVA of the measurements with nominal 50 μm differences between wall thicknesses printed in ABS on the Bambu printer. Figure S3: Main effects plot (left) and interaction plot (right) for ANOVA of the wall thicknesses printed in PLA on the Bambu printer. Figure S4: Main effects plot (left) and interaction plot (right) for ANOVA of the measurements with nominal 50 μm differences between wall thicknesses printed in PLA on the Bambu printer. Figure S5: Main effects plot (left) and interaction plot (right) for ANOVA of the thicknesses printed in PLA on the Prusa printer. Figure S6: Main effects plot (left) and interaction plot (right) for ANOVA of the measurements with nominal 50 μm differences between wall thicknesses printed in PLA on the Prusa printer. Figure S7: Main effects plot (left) and interaction plot (right) for ANOVA of the wall thicknesses printed in ABS on the Stratasys printer. Figure S8: Main effects plot (left) and interaction plot (right) for ANOVA of the measurements with nominal 50 μm differences between wall thicknesses printed in ABS on the Stratasys printer. Figure S9: Main effects plot (top) and interaction plot (bottom) for ANOVA of the wall thicknesses across all materials and printers. Figure S10: Main effects plots (top) and interaction plots (bottom) for ANOVA of the measurements with nominal 50 μm differences between wall thicknesses across all materials and printers.

Author Contributions

Conceptualization, P.A.P., Q.A., E.C., J.B. and S.H.; methodology, P.A.P., E.C., Q.A. and S.B.; software, Q.A.; validation, P.A.P., Q.A. and M.M.; mathematical model, P.A.P. and M.M.; investigation, P.A.P., E.C., M.P. and S.A.; resources, P.A.P. and S.H.; data curation, P.A.P. and Q.A.; writing—original draft preparation, P.A.P. and Q.A.; writing—review and editing, M.M., E.C., S.B., M.P., S.A., J.B. and S.H.; visualization, P.A.P. and Q.A.; supervision, P.A.P.; project administration, P.A.P.; funding acquisition, P.A.P., Q.A. and S.H. All authors have read and agreed to the published version of the manuscript.

Funding

This research received no external funding.

Data Availability Statement

Data are available via https://doi.org/10.26067/hjm6-3d45.

Acknowledgments

We would like to express our gratitude to Clint Bybee, the Lab Supervisor of the Manufacturing Engineering Department at BYU for the discussions regarding the ANSI B4.1 standard and its terminology, and to Kristi Chase, from the BYU Ira A. Fulton College of Engineering for proofreading the text and for suggesting how to improve it.

Conflicts of Interest

The authors declare no conflicts of interest.

Appendix A

Appendix A shows fabrication details of the wall structures, cylinders, and pistons.
Table A1. Schematic top views of FFF 3D-printed walls with the used in-fill pattern along the three studied printing axes (0 DEG, 90 DEG, and 45 DEG) for the three printers—view at mid-height.
In-fill pattern at mid-height (Bambu Lab and Prusa)
X-axis
(0 DEG):
0 DEG wall threads
Jmmp 08 00249 i001
Y-axis
(90 DEG):
0 DEG wall threads
Jmmp 08 00249 i002
45 DEG:
0 DEG wall threads
Jmmp 08 00249 i003
In-fill pattern at mid-height (Stratasys)
X-axis
(0 DEG):
-45 DEG wall threads
Jmmp 08 00249 i004
Y-axis
(90 DEG):
+45 DEG wall threads
Jmmp 08 00249 i005
45 DEG:
+90 DEG wall threads
Jmmp 08 00249 i006
Table A2. Photographic top views of FFF 3D-printed walls at the middle thickness value (2.050 mm) along the three studied axes (0 DEG, 90 DEG, and 45 DEG) using a selected combination of filament materials (ABS or PLA) and of printer type (Bambu Lab, Prusa, and Stratasys) as indicated below.
X-Axis (0 DEG)Y-Axis (90 DEG)45 DEG
Bambu Lab ABSJmmp 08 00249 i007Jmmp 08 00249 i008Jmmp 08 00249 i009
Stratasys ABSJmmp 08 00249 i010Jmmp 08 00249 i011Jmmp 08 00249 i012
Bambu Lab PLAJmmp 08 00249 i013Jmmp 08 00249 i014Jmmp 08 00249 i015
Prusa PLAJmmp 08 00249 i016Jmmp 08 00249 i017Jmmp 08 00249 i018
Table A3. Schematic top views of FFF 3D-printed cylinder and piston with the used in-fill pattern—view at mid-height for the three printers.
Cylinder Piston (Bambu Lab and Prusa)
In-fill pattern at mid-heightJmmp 08 00249 i019
Cylinder Piston (Stratasys)
In-fill pattern at mid-heightJmmp 08 00249 i020

Appendix B

Appendix B shows fabrication details of the map of the clearances of neighboring parts used in Figure 9b for the three printed batches of cylinders and pistons.
Figure A1. Measured clearances for each of the three batches used for Figure 9b. The green color of the cell indicates the parts with measured allowances close to the target. The smaller allowances have colors tending towards orange, while the larger allowances have colors tending towards purple.
Jmmp 08 00249 g0a1

References

  1. Lalegani Dezaki, M.; Mohd Ariffin, M.K.A.; Hatami, S. An Overview of Fused Deposition Modelling (FDM): Research, Development and Process Optimisation. Rapid Prototyp. J. 2021, 27, 562–582. [Google Scholar] [CrossRef]
  2. Khan, I.; Abas, M.; Ahmad, S.; Al Rashid, A.; Koç, M. Fabrication of a Low-Cost Fused Filament Fabrication-Based 3D Printer and Investigation of the Effects of Process Parameters on Mechanical Properties of 3D-Printed Samples. J. Eng. Res. 2024, in press. [CrossRef]
  3. Bonnín Roca, J.; Vaishnav, P.; Laureijs, R.E.; Mendonça, J.; Fuchs, E.R.H. Technology Cost Drivers for a Potential Transition to Decentralized Manufacturing. Addit. Manuf. 2019, 28, 136–151. [Google Scholar] [CrossRef]
  4. Zander, N.E.; Gillan, M.; Burckhard, Z.; Gardea, F. Recycled Polypropylene Blends as Novel 3D Printing Materials. Addit. Manuf. 2019, 25, 122–130. [Google Scholar] [CrossRef]
  5. Tymrak, B.M.; Kreiger, M.; Pearce, J.M. Mechanical Properties of Components Fabricated with Open-Source 3-D Printers under Realistic Environmental Conditions. Mater. Des. 2014, 58, 242–246. [Google Scholar] [CrossRef]
  6. Maraveas, C.; Kyrtopoulos, I.V.; Arvanitis, K.G. Evaluation of the Viability of 3D Printing in Recycling Polymers. Polymers 2024, 16, 1104. [Google Scholar] [CrossRef]
  7. Mikula, K.; Skrzypczak, D.; Izydorczyk, G.; Warchoł, J.; Moustakas, K.; Chojnacka, K.; Witek-Krowiak, A. 3D Printing Filament as a Second Life of Waste Plastics—A Review. Environ. Sci. Pollut. Res. 2021, 28, 12321–12333. [Google Scholar] [CrossRef]
  8. Gebler, M.; Schoot Uiterkamp, A.J.M.; Visser, C. A Global Sustainability Perspective on 3D Printing Technologies. Energy Policy 2014, 74, 158–167. [Google Scholar] [CrossRef]
  9. Pearce, J.M.; Blair, C.M.; Laciak, K.J.; Andrews, R.; Nosrat, A.; Zelenika-Zovko, I. 3-D Printing of Open Source Appropriate Technologies for Self-Directed Sustainable Development. Eur. J. Sustain. Dev. 2010, 3, 17. [Google Scholar] [CrossRef]
  10. Kruth, J.-P.; Leu, M.C.; Nakagawa, T. Progress in Additive Manufacturing and Rapid Prototyping. CIRP Ann. 1998, 47, 525–540. [Google Scholar] [CrossRef]
  11. Popescu, D.; Zapciu, A.; Amza, C.; Baciu, F.; Marinescu, R. FDM Process Parameters Influence over the Mechanical Properties of Polymer Specimens: A Review. Polym. Test. 2018, 69, 157–166. [Google Scholar] [CrossRef]
  12. Rajpurohit, S.R.; Dave, H.K. Analysis of Tensile Strength of a Fused Filament Fabricated PLA Part Using an Open-Source 3D Printer. Int. J. Adv. Manuf. Technol. 2019, 101, 1525–1536. [Google Scholar] [CrossRef]
  13. Kumar Pal, A.; Mohanty, A.K.; Misra, M. Additive Manufacturing Technology of Polymeric Materials for Customized Products: Recent Developments and Future Prospective. RSC Adv. 2021, 11, 36398–36438. [Google Scholar] [CrossRef]
  14. MakerWorld: Download Free 3D Printing Models. Available online: https://makerworld.com/en (accessed on 26 August 2024).
  15. Thingiverse.com; Thingiverse—Digital Designs for Physical Objects. Available online: https://www.thingiverse.com/ (accessed on 26 August 2024).
  16. Team, F. 67 Cool Things to 3D Print. Available online: https://www.format.com/magazine/resources/design/3d-printer-designs/ (accessed on 26 August 2024).
  17. Mamo, H.B.; Adamiak, M.; Kunwar, A. 3D Printed Biomedical Devices and Their Applications: A Review on State-of-the-Art Technologies, Existing Challenges, and Future Perspectives. J. Mech. Behav. Biomed. Mater. 2023, 143, 105930. [Google Scholar] [CrossRef] [PubMed]
  18. Kermavnar, T.; Shannon, A.; O’Sullivan, K.J.; McCarthy, C.; Dunne, C.P.; O’Sullivan, L.W. Three-Dimensional Printing of Medical Devices Used Directly to Treat Patients: A Systematic Review. 3d Print. Addit. Manuf. 2021, 8, 366. [Google Scholar] [CrossRef] [PubMed]
  19. Grgić, I.; Karakašić, M.; Glavaš, H.; Konjatić, P. Accuracy of FDM PLA Polymer 3D Printing Technology Based on Tolerance Fields. Processes 2023, 11, 2810. [Google Scholar] [CrossRef]
  20. Popović, M.; Pjević, M.; Milovanović, A.; Mladenović, G.; Milošević, M. Printing Parameter Optimization of PLA Material Concerning Geometrical Accuracy and Tensile Properties Relative to FDM Process Productivity. J. Mech. Sci. Technol. 2023, 37, 697–706. [Google Scholar] [CrossRef]
  21. Frunzaverde, D.; Cojocaru, V.; Ciubotariu, C.-R.; Miclosina, C.-O.; Ardeljan, D.D.; Ignat, E.F.; Marginean, G. The Influence of the Printing Temperature and the Filament Color on the Dimensional Accuracy, Tensile Strength, and Friction Performance of FFF-Printed PLA Specimens. Polymers 2022, 14, 1978. [Google Scholar] [CrossRef]
  22. Sharma, P.; Vaid, H.; Vajpeyi, R.; Shubham, P.; Agarwal, K.M.; Bhatia, D. Predicting the Dimensional Variation of Geometries Produced through FDM 3D Printing Employing Supervised Machine Learning. Sens. Int. 2022, 3, 100194. [Google Scholar] [CrossRef]
  23. Lieneke, T.; Adam, G.A.O.; Leuders, S.; Knoop, F.; Josupeit, S.; Delfs, P.; Funke, N.; Zimmer, D. Systematical Determination of Tolerances for Additive Manufacturing by Measuring Linear Dimensions. In Proceedings of the 26th Annual International Solid Freeform Fabrication Symposium—An Additive Manufacturing Conference, Austin, TX, USA, 10–12 August 2015; Bourell, D.L., Ed.; University of Texas at Austin: Austin, TX, USA, 2015. [Google Scholar]
  24. Zainal, M.A.; Ismail, K.I.; Yap, T.C. Tribological Properties of PLA 3D Printed at Different Extrusion Temperature. J. Phys. Conf. Ser. 2023, 2542, 012001. [Google Scholar] [CrossRef]
  25. Georgiana, C.; Stoica, N.A.; Stoica, A. Friction Behavior of 3D-Printed Polymeric Materials Used in Sliding Systems. Mater. Plast. 2021, 58, 176–185. [Google Scholar] [CrossRef]
  26. Aziz, R.; Ul Haq, M.I.; Raina, A. Effect of Surface Texturing on Friction Behaviour of 3D Printed Polylactic Acid (PLA). Polym. Test. 2020, 85, 106434. [Google Scholar] [CrossRef]
  27. Sojoodi Farimani, F.; De Rooij, M.; Hekman, E.; Misra, S. Frictional Characteristics of Fusion Deposition Modeling (FDM) Manufactured Surfaces. Rapid Prototyp. J. 2020, 26, 1095–1102. [Google Scholar] [CrossRef]
  28. Hanon, S.M.; Kovács, M.; Zsidai, L. Tribological Behaviour Comparison of ABS Polymer Manufactured Using Turning and 3D Printing. Int. J. Eng. Manag. Sci. 2019, 4, 46–57. [Google Scholar] [CrossRef]
  29. Xu, J.; Liu, N.; Zhang, F.; Du, J.; Zheng, C.; Gao, X.; Liu, K. Frictional Behaviors of 3D-Printed Polylactic Acid Components With Spiral-Groove Surface Textures Under Oil Lubrication. J. Tribol. 2022, 145, 011803. [Google Scholar] [CrossRef]
  30. Schaechtl, P.; Schleich, B.; Wartzack, S. Statistical Tolerance Analysis of 3D-Printed Non-Assembly Mechanisms in Motion Using Empirical Predictive Models. Appl. Sci. 2021, 11, 1860. [Google Scholar] [CrossRef]
  31. Gonabadi, H.; Hosseini, S.F.; Chen, Y.; Bull, S. Structural Analysis of Small-Scale 3D Printed Composite Tidal Turbine Blades. Ocean Eng. 2024, 306, 118057. [Google Scholar] [CrossRef]
  32. Przekop, R.E.; Kujawa, M.; Pawlak, W.; Dobrosielska, M.; Sztorch, B.; Wieleba, W. Graphite Modified Polylactide (PLA) for 3D Printed (FDM/FFF) Sliding Elements. Polymers 2020, 12, 1250. [Google Scholar] [CrossRef]
  33. Chhabra, D.; Deswal, S.; Kaushik, A.; Garg, R.K.; Kovács, A.; Khargotra, R.; Singh, T. Analysis of Fused Filament Fabrication Parameters for Sliding Wear Performance of Carbon Reinforced Polyamide Composite Material Fabricated Parts Using a Hybrid Heuristic Tool. Polym. Test. 2023, 118, 107910. [Google Scholar] [CrossRef]
  34. Krause, J.; Bhounsule, P. A 3D Printed Linear Pneumatic Actuator for Position, Force and Impedance Control. Actuators 2018, 7, 24. [Google Scholar] [CrossRef]
  35. Nall, C.L.; Bhounsule, P.A. A Miniature 3D Printed On-Off Linear Pneumatic Actuator and Its Demonstration into a Cartoon Character of a Hopping Lamp. Actuators 2019, 8, 72. [Google Scholar] [CrossRef]
  36. Coehoorn, J. What Kinds of Gaps/Tolerances Should I Use When Designing Pieces that Fit Together? Available online: https://3dprinting.stackexchange.com/q/6576 (accessed on 26 August 2024).
  37. Rabyking, S. Answer to “What Kinds of Gaps/Tolerances Should I Use When Designing Pieces that Fit Together?”. Available online: https://3dprinting.stackexchange.com/a/6854 (accessed on 26 August 2024).
  38. Henri_Dupont Recommended Clearance for Print in Place Moving Parts. Available online: www.reddit.com/r/3Dprinting/comments/sljq6z/recommended_clearance_for_print_in_place_moving/ (accessed on 26 August 2024).
  39. Tvan3l Clearance 3D Printing Assembly. Available online: www.reddit.com/r/3Dprinting/comments/7ri23c/clearance_3d_printing_assembly/ (accessed on 26 August 2024).
  40. Line Width. Available online: https://wiki.bambulab.com/en/software/bambu-studio/parameter/line-width (accessed on 6 October 2024).
  41. Arrospide, E.; Bikandi, I.; García, I.; Durana, G.; Aldabaldetreku, G.; Zubia, J. 7—Mechanical Properties of Polymer-Optical Fibres. In Polymer Optical Fibres; Bunge, C.-A., Gries, T., Beckers, M., Eds.; Woodhead Publishing: Duxford, UK, 2017; pp. 201–216. ISBN 978-0-08-100039-7. [Google Scholar]
  42. Hajikarimi, P.; Moghadas Nejad, F. Chapter 3—Mechanical Models of Viscoelasticity. In Applications of Viscoelasticity; Hajikarimi, P., Moghadas Nejad, F., Eds.; Elsevier: Amsterdam, The Netherlands, 2021; pp. 27–61. ISBN 978-0-12-821210-3. [Google Scholar]
  43. Bao, M.; Yang, H. Squeeze Film Air Damping in MEMS. Sens. Actuators A Phys. 2007, 136, 3–27. [Google Scholar] [CrossRef]
  44. Pan, C.H. Squeeze Film Gas Lubrication. In Encyclopedia of Tribology; Wang, Q.J., Chung, Y.-W., Eds.; Springer US: Boston, MA, USA, 2013; pp. 3263–3269. ISBN 978-0-387-92897-5. [Google Scholar]
  45. Rajagopal, K.R. A Note on a Reappraisal and Generalization of the Kelvin–Voigt Model. Mech. Res. Commun. 2009, 36, 232–235. [Google Scholar] [CrossRef]
  46. Machinery’s Handbook: Toolbox. Industrial Press: South Norwalk, CT, USA, 2016.
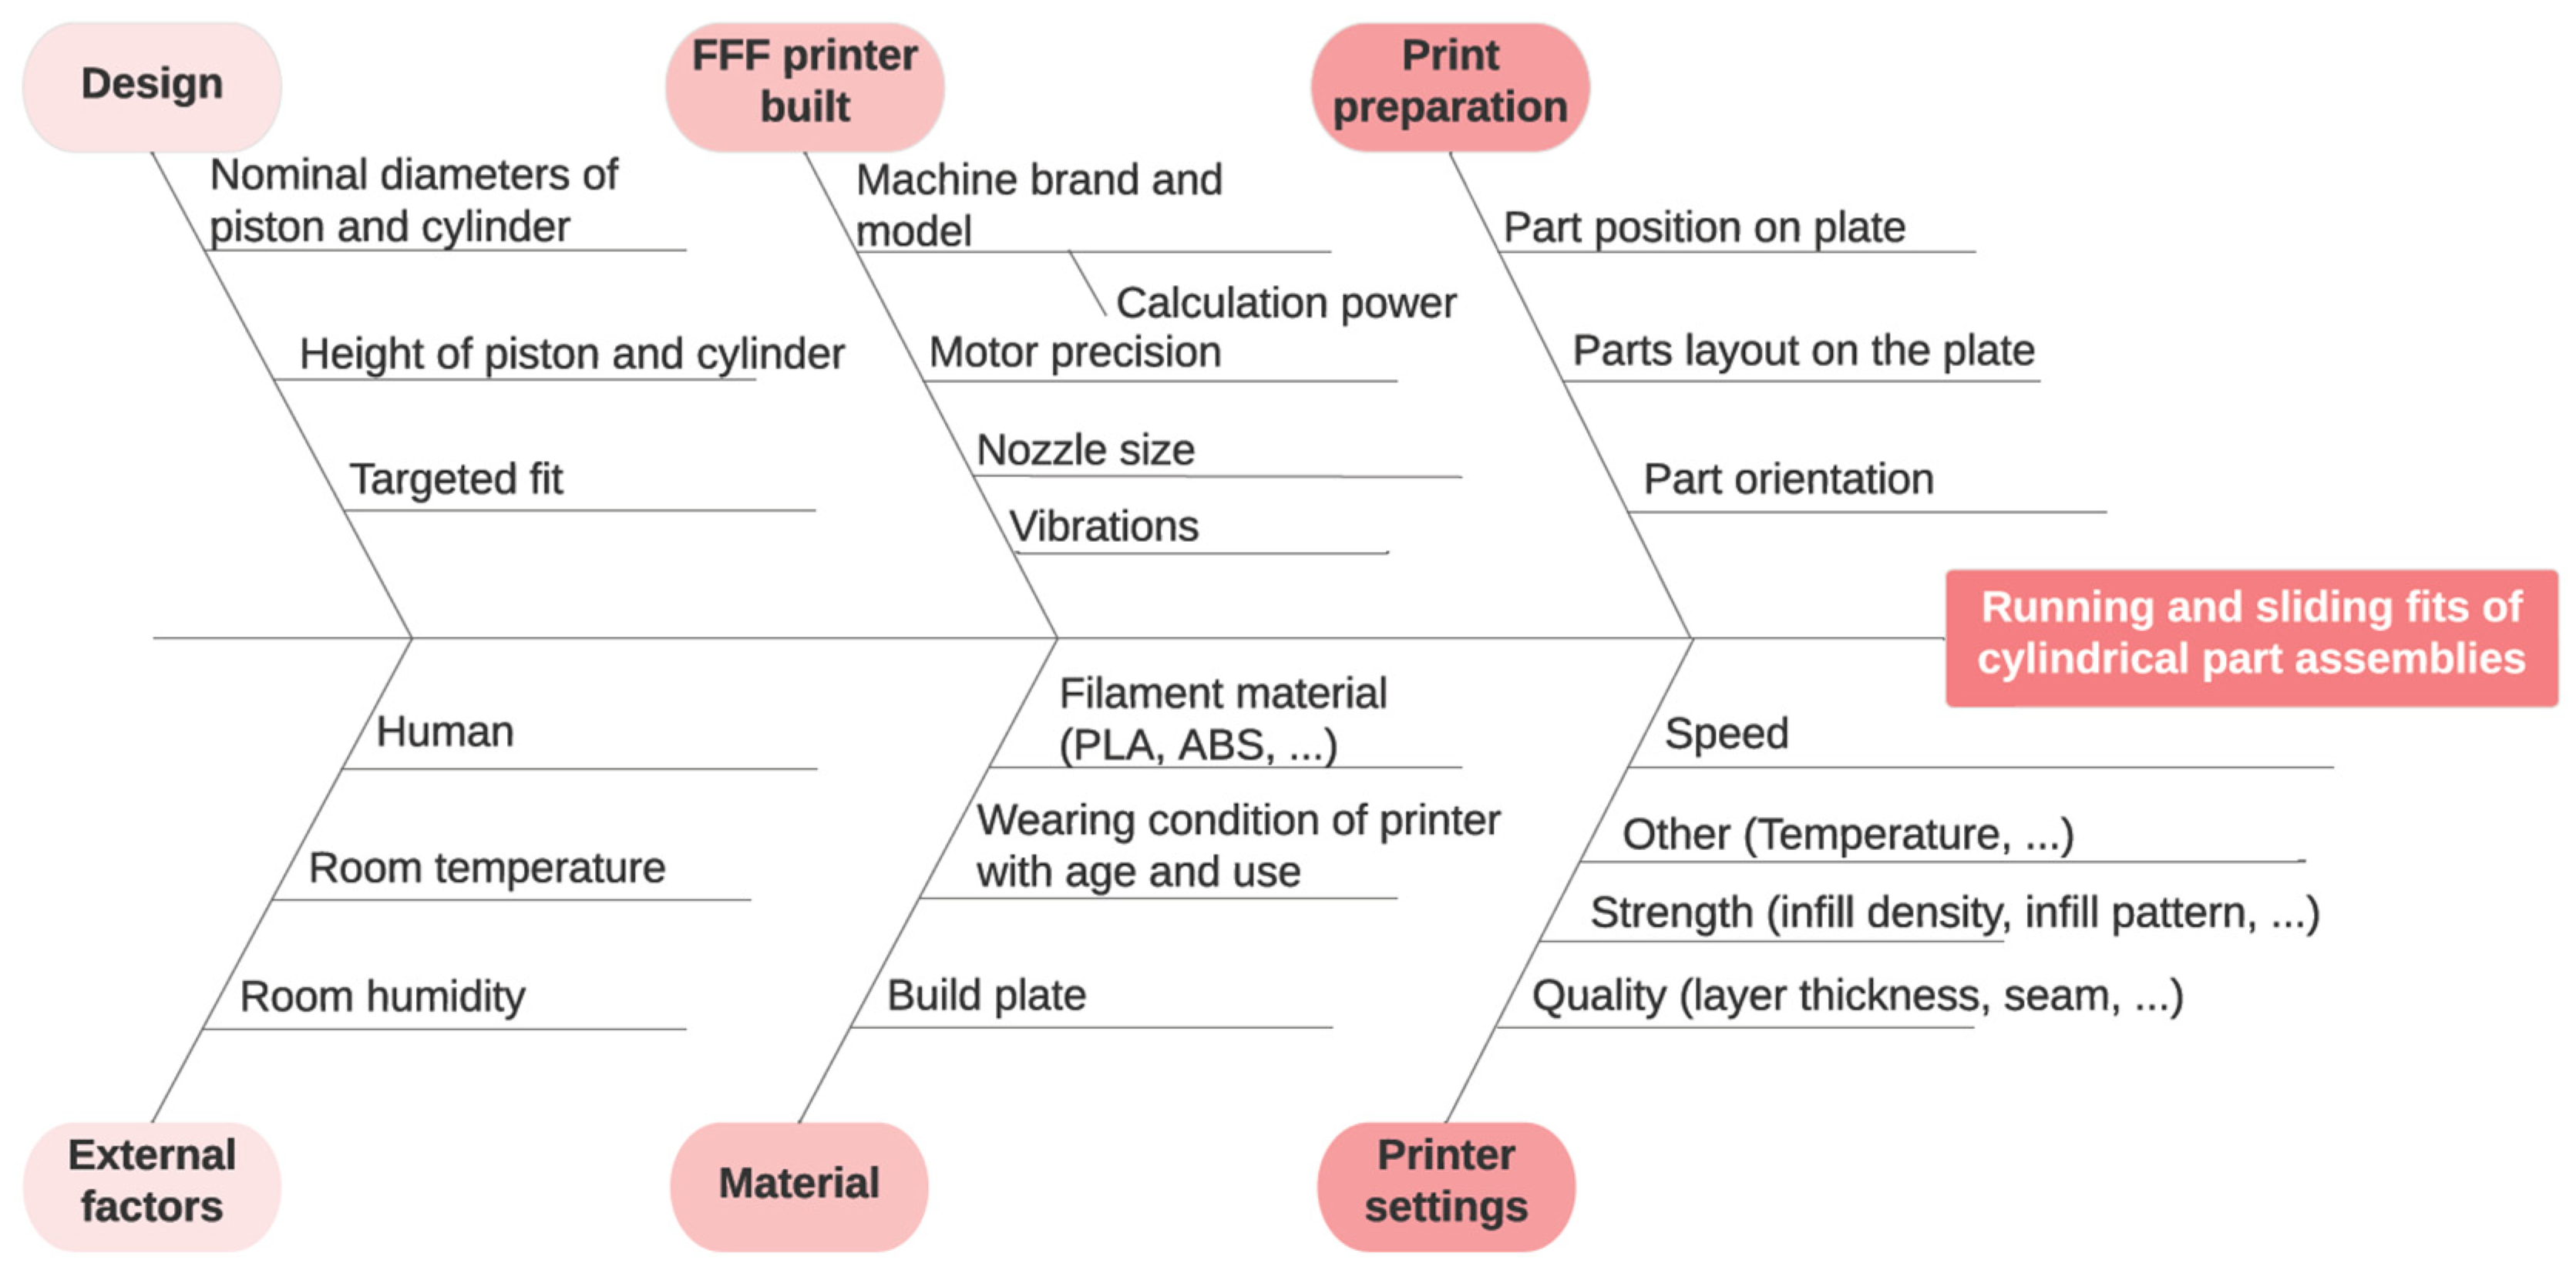
Figure 1. Schematic fishbone diagram showing the main cause–effects parameters of an FFF-based 3D printing process to achieve the desired running and sliding fits.
Jmmp 08 00249 g001
Figure 2. Schematic views (a) of the wall structures to study 3D printers’ resolution with small changes of wall thickness; (b) of piston–cylinder parts, for which circularity, dimensions, and assembly were studied; and (c) of the parts layout on the printer bed used to study the influence of the position on fits performances.
Jmmp 08 00249 g002
Figure 3. Photographic view of the piston–cylinder assembly with the fixture adapters during tensile testing to measure the friction force as a function of displacement.
Jmmp 08 00249 g003
Figure 4. Schematic illustration of the basic considerations used for the concept model development of friction force as a function of the displacement.
Jmmp 08 00249 g004
Figure 5. Graphs of experimental results showing the interactions between target thickness—expected to vary incrementally from 2.0 mm to 2.1 mm in regular steps—and printing day (top), and between target thickness and print orientation (bottom), for Bambu Lab ABS (a), Stratasys ABS (b), Bambu Lab PLA (c), and Prusa PLA (d).
Jmmp 08 00249 g005
Figure 6. Results of data analysis from experimental measurements: Interaction plots for all printers and materials combined, showing the interaction between target thickness—expected to vary incrementally from 2.0 mm to 2.1 mm in regular steps—and printer type (a), and between target thickness and print orientation (b).
Jmmp 08 00249 g006
Figure 7. Graphs of Tukey simultaneous 95% confidence intervals for pairwise comparisons of difference of means in mm for pairs of walls with 50 mm thickness difference depending on their printing orientation for the FFF 3D printers Bambu ABS (a), Stratasys ABS (b), Bambu PLA (c), and Prusa PLA (d).
Jmmp 08 00249 g007
Figure 8. Stereomicroscope views (20X magnification) with digital analysis of cylindrical piston surfaces in the insert (200X magnification) of ABS printed with Bambu Lab and 0.20 mm layer thickness (a), ABS printed with Stratasys and 0.18 mm layer thickness (b), PLA printed with Bambu Lab and 0.20 mm layer thickness (c), and PLA printed with PRUSA and 0.20 mm layer (d).
Jmmp 08 00249 g008
Figure 9. (a) Schematic representation of the position of the cylinders (cells with red gradients) and the pistons (cells with blue gradients) on the printer bed. The numbers are experimental deviations in mm from the 20.000 mm target value (cylinders), and from the 19.960 mm target value (pistons). The intensity of the cell colors indicates the deviation’s quantity: red for the cylinders, and blue for the pistons, with white showing the lowest deviations. (b) Schematic representation combining results from (a) to visualize the map of average clearances in mm for the potential assembly of neighbor piston–cylinder pairs (e.g., for the top left value: (20.000 − 0.121 (the average of −0.130, −0123, and −0.111)) − (19.960 − 0.166 (the average of −0.168, −0168, and −0.161) = 0.085 mm), instead of 0.040 mm expected). The green color of the cell indicates the parts with measured allowances close to the target. The smaller allowances have colors tending towards orange, while the larger allowances have colors tending towards purple. The cells with thicker borders indicate the printing positions of the three pairs of parts (A, B, C) assembled and used for various analysis in this paper.
Jmmp 08 00249 g009
Figure 10. (ad) Experimental results of the resulting friction force when displacing the FFF 3D-printed PLA piston through the cylinder at 1 mm/s, 2.5 mm/s, 5 mm/s, and 10 mm/s speeds, respectively.
Jmmp 08 00249 g010
Figure 11. (ae) Views of experimental results of friction forces as a function of the displacement at 1 mm/s speed with corresponding calculations using the developed model for FFF 3D-printed PLA piston–cylinder assemblies with different dimensional clearances; (f) graphical representation (with variability) of the measured diameters of the corresponding piston–cylinder assemblies (in black, the cylinders or holes normalized at 20 mm inner diameter; in gray, the pistons or shafts with different diameters) from (ae), and in orange vertical lines, the corresponding allowance using the mathematical model with the following calculated values: 0.014 mm for RC5eq, 0.065 mm for RC6eq, 0.105 mm for RC7eq, 0.128 mm for RC8eq, and 0.160 mm for RC9eq. Indications of RC5eq up to RC9eq suggest some correspondence with the running and sliding clearance fits from ANSI standard B4.1.
Jmmp 08 00249 g011aJmmp 08 00249 g011b
Figure 12. Graphs with the friction force as a function of the axial position between cylinder and piston assembly with aligned seam (a) and random seam (b). In the inset are the corresponding microscopic views of the piston surface showing the corresponding seam type.
Jmmp 08 00249 g012
Table 1. Experimental results of typical surface roughness analysis for different kinds of FFF 3D-printed parts in this study.
Piston TypeBambu Lab ABS,
0.20 mm Layers
Stratasys ABS, 0.18 mm LayersBambu Lab PLA, 0.20 mm LayersPrusa PLA,
0.20 mm Layers
Ra (mm)12.6012.2314.9519.73
Rz (mm)57495068
Table 2. Experimental results showing an example of circularity errors for the corresponding piston studied in the previous section assembled and for cylinders of the same materials with similar diameter target values.
Circularity
Error (% Diameter)
Bambu Lab ABS,
0.20 mm Layers
Stratasys ABS, 0.18 mm LayersBambu Lab PLA, 0.20 mm LayersPrusa PLA,
0.20 mm Layers
Piston shaft0.220.24 0.140.32
Cylinder hole 0.190.50 0.210.27
Table 3. Example of diameter measurement results of an FFF 3D-printed cylinder and piston. This specific pair was printed in green PLA using the Bambu Lab printer in position “B” (see Figure 9b), and with 0.20 mm layer thickness (each measurement taken 3 times).
Diameters\Angle0 DEG45 DEG90 DEGTotal
Cylinder (mm)19.869 ± 0.01119.878 ± 0.02319.863 ± 0.02219.870 ± 0.020
Piston (mm)19.860 ± 0.00519.805 ± 0.00119.809 ± 0.00519.825 ± 0.025
Average measured clearance for assembly (mm)0.045 ± 0.045
Table 4. Parameters obtained and used with the developed mathematical model in Figure 10 for piston–cylinder assemblies printed with the Bambu printer in Bambu green PLA Basic.
z ˙   (mm/s)1.02.55.010
s (N/m)1781.3
Ff_total_base-max (N):6.76.45.66.7
Ff_total_oscil-max (N):6.03.31.10.4
l (m)
k c ^ (-)
162·10−6
0.5·10−3
B (-)0.900.520.200.06
mPLA used (-)0.250.240.210.25
z ˙ was provided by the choice of tensile tester speeds. k c ^ was adjusted to match the general baseline slope increase. mPLA values were adjusted slightly to calibrate the small baseline slope discrepancies. B values were adjusted to calibrate the oscillation amplitude.
Table 5. Parameters obtained and used with the developed mathematical model in Figure 11 for piston–cylinder assemblies printed with the Bambu printer in lilac purple PLA Matte.
Equivalent
Clearance Fit
RC5eqRC6eqRC7eqRC8eqRC9eq
s (N/m)831334111768385211
Ff_total_base-max (N):31.212.86.61.40.8
Ff_total_oscil-max (N):12.55.12.70.60.3
B (-)
mPLA used (-)
0.40
0.25
l (m)162·10−694·10−667·10−653·10−632·10−6
k c ^ (-)2·10−31.65·10−31.2·10−30.33·10−30.3·10−3
Table 6. Calculated clearances from measured diameters of piston–cylinder pairs printed in lilac purple PLA Matte using the Bambu Lab printer (each part measured 3 times along the 3 axes as above, n = 9). Averages with standard deviations (±1 s), as well as the full range of measured values, are indicated. The clearance increased when printing with thinner layer thickness.
Assembly\Piston TypeBambu Lab PLA, 0.28 mm LayersBambu Lab PLA, 0.20 mm LayersBambu Lab PLA, 0.15 mm LayersBambu Lab PLA, 0.10 mm Layers
Clearance (mm) position A-0.001 ± 0.068
[-0.080–0.090]
0.049 ± 0.027
[0.013–0.098]
0.58 ± 0.029
[0.019–0.097]
0.074 ± 0.015
[0.048–0.094]
Clearance (mm) position B0.018 ± 0.055
[-0.054–0.085]
0.075 ± 0.058
[-0.023–0.142]
0.117 ± 0.053
[0.048–0.195]
0.108 ± 0.035
[0.073–0.162]
Clearance (mm) position C0.064 ± 0.047
[-0.008–0.120]
0.126 ± 0.067
[0.040–0.229]
0.125 ± 0.063
[0.051–0.218]
0.122 ± 0.066
[0.031–0.202]
Table 7. Example of typical measured surface roughness analysis for the piston–cylinder pair presented in Table 6, and friction force values extracted from the experimental results using the mathematical model (at 1 mm/s).
Piston TypeBambu Lab PLA, 0.28 mm LayersBambu Lab PLA, 0.20 mm LayersBambu Lab PLA, 0.15 mm layersBambu Lab PLA, 0.10 mm Layers
Ra (mm)19.0014.959.366.00
Rz (mm)80503931
s (N/m)893612191544823
Ff_total_base-max (N):33.54.65.83.1
Ff_total_oscil-max (N):24.13.73.90.2
Table 8. Example of diameter measurement results of an FFF 3D-printed cylinder and piston. This specific pair was printed in green PLA using the Bambu Lab printer in position “A” (see Figure 9b), and with 0.20 mm layer thickness (each part measured 3 times along the 3 axes as above, n = 9). Averages with standard deviations (±1 s), as well as the full range of measured values, are indicated.
Diameters\AngleAligned SeamRandom Seam
Cylinder (mm)19.845 ± 0.024
[19.818–19.887]
19.857 ± 0.031
[19.825–19.909]
Piston (mm)19.818 ± 0.031
[19.789–19.840]
19.816 ± 0.018
[19.791–19.842]
Table 9. Experimental results of the circularity error effect on the axial friction at three different relative angular piston–cylinder positions on axial friction force values. These values were extracted from using the mathematical model from three pairs with different clearances printed with a Bambu Lab printer in lilac purple PLA. The corresponding measured diameters are indicated with their averages and standard deviations (±1 s), as well as the full range of measured values (each part measured 3 times along the 3 axes as above, n = 9).
Piston–Cylinder Pair 1Piston–Cylinder Pair 2Piston–Cylinder Pair 3
Relative Angular Position0 DEG45 DEG90 DEG0 DEG45 DEG90 DEG0 DEG45 DEG90 DEG
s (N/m)372434620143643110115225699
Ff_total_base-max (N):1.41.62.30.52.44.10.61.00.4
Ff_total_oscil-max (N):0.71.01.60.21.74.50.10.40.2
Measured clearance (mm)113 mm ± 70 mm
[0.005–0.201]
142 mm ± 96 mm
[-0.012–0.260]
154 mm ± 74 mm
[0.024–0.235]
Disclaimer/Publisher’s Note: The statements, opinions and data contained in all publications are solely those of the individual author(s) and contributor(s) and not of MDPI and/or the editor(s). MDPI and/or the editor(s) disclaim responsibility for any injury to people or property resulting from any ideas, methods, instructions or products referred to in the content.