Article

Interfacial Stability of Additively Manufactured Alloy 625–GRCop-42 Bimetallic Structures

Department of Materials Science and Engineering, College of Engineering, University of Arizona, 1235 E James E. Rogers Way, Tucson, AZ 85719, USA
*
Author to whom correspondence should be addressed.
J. Manuf. Mater. Process. 2025, 9(2), 34; https://doi.org/10.3390/jmmp9020034
Submission received: 22 November 2024 / Revised: 13 January 2025 / Accepted: 15 January 2025 / Published: 24 January 2025
(This article belongs to the Special Issue Smart Manufacturing in the Era of Industry 4.0)

Abstract

:
This study examines the diffusion behavior, thermal stability, and mechanical properties of the bimetallic interface between additively manufactured copper alloy GRCop-42 and nickel alloy 625 (UNS N06625) following elevated temperature exposure at service-relevant conditions for high-temperature superalloys. The copper alloy was additively manufactured using laser powder bed fusion. The nickel alloy was subsequently deposited directly onto the copper alloy using powder-based directed energy deposition. The samples were held at a temperature of 816 °C (1500° F) for varying exposure times between 50 and 500 h. Significant material loss (averaging ~430   μ m at 50 h and ~1830 μ m at 500 h) due to oxidation was noted in the copper alloy. The bondline interface was examined using optical microscopy as well as electron microprobe analysis. Composition maps from the electron microprobe showed the formation of oxides in the copper alloy and Laves phase in the nickel alloy at thermal exposure times of 200 h or more. By analyzing diffusion across the bondline, this study demonstrates the ability of machine learning-based diffusion models to predict diffusion coefficients of copper into alloy 625 ( 2.38 × 10 12   c m 2 / s ) and of nickel into GRCop-42 ( 1.90 × 10 12   c m 2 / s ) and the ability of commercially available diffusion code (Pandat) to provide reasonably accurate diffusion profiles for this system. Tensile and fatigue tests were performed in the as-built and 200 h thermal exposure conditions. The thermally exposed samples exhibited an average 18.6% reduction in yield strength compared to the as-built samples.

1. Introduction

The combination of different materials into a single component is often a desired engineering solution to problems involving specialized environments or conditions. Additive manufacturing provides the opportunity to explore innovative solutions to complex problems. When successful, this can lead to shorter lead times and reduced waste. For example, one study showed that an Invar 36 gradient cladding that was radially deposited onto a stainless steel 304 L rod in order to produce carbon fiber composite inserts for spacecraft applications outperformed monolithic metal inserts [1]. In another example, 1–3 wt% of calcium phosphate (in the form of hydroxyapatite powder) was added to cobalt–chromium–molybdenum alloy powder to enhance the wear resistance for biomedical implants [2].
This study focuses on the additively manufactured, bimetallic structure of the nickel-based alloy 625 (UNS N06625) and the copper-based alloy GRCop-42. The copper alloy was manufactured using powder bed fusion with a laser as the energy source (PBF-LB) with the nickel alloy deposited on top using directed energy deposition (DED). PBF-LB is an additive manufacturing method, in which components are built layer by layer by selectively melting powder using a high-energy laser [3]. While some copper-based alloys can be difficult to print using PBF-LB due to the high laser reflectivity of copper, these issues can be overcome by adjusting process parameters or alloying the copper with laser-absorbing elements [4]. In DED, thermal energy is directed to fuse the material while it is simultaneously being deposited [3]. In this case, the alloy 625 material was deposited in powder form and fused by a laser. Other DED methods may use other deposition and/or fusion processes, such as wire deposition and plasma arc [3].
The copper-based alloy used in this research, GRCop-42, was originally developed for use in applications such as liquid rocket engine combustion devices [5]. GRCop-42 was developed as a higher-conductivity version of GRCop-84 [5,6]. In GRCop-42, the amounts of chromium (4 at.%) and niobium (2 at.%) are halved compared to GRCop-84 (8 at.% Cr-4 at.% Nb) to achieve the desired improvement in thermal conductivity [5]. Both alloys consist of a high-purity copper matrix dispersion strengthened by Cr2Nb precipitates [7,8], which provide relatively good oxidation resistance for the application (compared to other copper-alloys) [6] and control the copper grain size [9]. At temperatures up to 800 °C (1472° F), the precipitates tend to be very stable (do not significantly coarsen or dissolve), which allows the GRCop alloys to retain their strength at elevated temperatures [9]. GRCop-84 forms a chromium–niobium oxide layer beneath a thick copper oxide surface layer at temperatures up to 700 °C (1292° F), which inhibits oxidation by limiting diffusion [9,10]. However, above 700 °C (1292° F), oxidation rate in GRCop-84 is shown to increase by almost a full order of magnitude (to rates similar to pure copper) [9,10]. Due to the differences in alloying concentrations, the volume fraction of Cr2Nb precipitates in GRCop-42 (~7 vol% [6]) is approximately half of that in GRCop-84 (~14 vol% [9]) [11], which results in slightly lower mechanical strength and constrains the formation of a chromium–niobium oxide layer, thereby reducing the oxidation resistance [12]. A specific PBF-LB technique was established for GRCop-42 which requires inert gas (argon) for powder atomization and handling. This is vital since the alloy is very sensitive to oxygen contamination as well as forming nitrides, especially when formed into a powder [6]. However, compared to other similar copper alloys, the GRCop alloys generally require less post processing to achieve the desired properties [13,14].
Alloy 625 (UNS N06625) is a nickel-based superalloy alloyed with chromium, molybdenum, niobium, and iron [15,16]. Alloy 625 was originally developed for high-strength main steam-line piping in the 1950s and 1960s [17]. Alloy 625 is often used in extreme environments due to its high-temperature corrosion resistance and ability to maintain good mechanical properties, even with prolonged exposure to harsh environments and conditions [18]. Alloy 625 is known to have good weldability, due in part to its low aluminum and titanium content, which also makes it a suitable alloy for additive manufacturing [19]. Alloy 625 is strengthened by solid-solution-hardening enhanced by chromium, molybdenum, niobium, and iron as well as some precipitation-hardening effects of intermetallic phases [20]. There are many different types of precipitates that can form in the alloy 625 matrix, such as γ’’, δ, MC, M6C, and M23C6 carbides, Laves phase, and Si-rich particles [21]. During the solidification process, niobium tends to segregate to interdendritic liquid, which upon complete solidification, can result in the niobium-rich Laves phase, niobium carbides, or both [22]. Compositional differences, within the alloy specification ranges, can change the precipitation behavior; for example, silicon has been shown to increase sensitivity to fusion-zone cracking in welding since increased silicon concentration increases the stability and the kinetics for the formation of the Laves phase in nickel-based alloys [23]. A study by Floreen, Fuchs, and Yang showed that decreasing iron and silicon content in weld wire significantly decreased the amount of NbC particles and Laves phase that were observed in the weld, which consequently showed an increase in toughness compared to traditional weld wire [19]. However, even when the Laves phase is initially avoided in welding, enrichment in the interdendritic regions has been shown to lead to accelerated precipitation reactions upon additional heating [23]. Due to similarities in cooling rates and non-equilibrium solidification profiles, welding and additive manufacturing often produce similar microstructures [24]. In a study involving additive manufacturing with DED, A625 was seen to form epitaxial columnar grains with fine dendritic substructure [25]. Similarly to welding, Laves phase and carbides were formed in the interdendritic regions due to micro-segregation in the DED process [25]. A study on the effects of high temperature on the microstructure of AM PBF-LB alloy 625 showed that at temperatures around 700–800 °C, δ phase, M23C6 carbides, and Laves phase particles precipitate and grow [26]. Similarly to phenomena seen in welds, when the high temperature was held for longer periods, Laves phase was shown to nucleate in regions close to δ phase and M23C6 carbides, which would inhibit carbide growth and result in niobium enrichment in the surrounding matrix causing growth of the δ phase [26].
In their study of AM GRCop-42, Gradl et al. tested thrust chamber assemblies with PBF-LB GRCop-42, one of which accumulated 168 starts and 7,400 s in conditions including chamber pressures of up to 8.6 MPa and peak wall temperatures up to 727 °C [6]. AM GRCop-42 has also shown excellent heat flux capabilities in subcooling with condensation heat transfer for applications such as distillation, water harvesting, and thermal management of power plants [27]. In a study on conditions of hypersonic vehicles, the integration of a planar heat pipe into the leading edge structure was found to significantly reduce the temperatures and analytically predicted thermostructural performance found alloy 625 to be a viable material for a metallic leading edge for Mach 6 at approximately 870 °C [28]. Joining GRCop-42 and alloy 625 allows a combination of the very high thermal conductivity and low thermal expansion of GRCop-42 with the high-temperature strength and corrosion resistance seen in alloy 625. Creating bimetallic structures involving an interface between a nickel-based superalloy and a copper alloy have been explored to investigate improvements in thermophysical properties and corrosion resistance for aerospace applications [29]. In the study by Onuike et al., the bimetallic joint of alloy 718 and GRCop-84 showed a 250% increase in thermal diffusivity and 300% increase in conductivity compared to alloy 718 alone in temperatures between 50 and 300 °C [29]. In a study by Pérez-Álvarez et al., bimetallic composite tubes made of GRCop-84 and 316 stainless steel were tested with supercritical CO2 flowing at temperatures between 500 and 700 °C, representative of receiver tubes in solar power tower plants, which showed that the bimetallic configuration enhanced thermal efficiency while reducing stresses on the absorber tubes [30]. Heat exchangers, in general, can benefit from similar improvements to cooling. Examining desirable material combinations for longer times at high temperature is needed to understand the effect on the material itself for its viability in applications requiring continual or repeated use.
There exists a diverse set of applications for which the bimetallic copper alloy to nickel superalloy could provide potential benefits. The scope of this work is to investigate the effects of long-term thermal exposure on the specific material combination of additively manufactured GRCop-42 and alloy 625. This includes examining diffusion across the boundary, compositional analysis, oxidation effects, and mechanical properties for the as-built joint as well as various thermal exposure durations at 816 °C.

2. Materials and Methods

In this study, bimetallic blocks of 1.8 cm thickness and 16.5 cm width with 5 cm of GRCop-42 and 1.5 cm of alloy 625 were examined at room temperature in the as-built condition as well as after various times at an elevated temperature of 816 °C (1500° F). GRCop-42 is nominally 4 at.% chromium and 2 at.% niobium, with the remainder being copper. Alloy 625 (UNS N06625) is defined by the composition listed in Table 1 [15]. A block of the as-received sample is shown in Figure 1. The samples were produced using PBF-LB of GRCop-42 and subsequently depositing the alloy 625 using powder DED directly onto the PBF-LB-printed copper alloy. The parameters used to print the material in both the PBF-LB and DED processes are proprietary to the manufacturer and were not provided for this research. The goal of this investigation is to examine the metallurgical features and mechanical properties at and near the bondline between the nickel and copper alloys. The bimetallic joint and surrounding material are studied visually via optical microscopy, compositionally characterized via electron microprobe, and mechanically tested via tensile and fatigue testing. The test bars for mechanical testing were machined from a similar block to that shown in Figure 1, with the exception that the heights of the alloy 625 and GRCop-42 were both 5 cm.

2.1. As-Built Samples

2.1.1. Sample Preparation

In order to examine the bondline of the sample in the as-built condition, five sections were cut. These five sections were cut perpendicular to the deposition direction and numbered one through five (referred to as samples 1–5). Each sample was mounted and polished to 0.05 micron (final) using alumina solution. After completing optical microscopy of the five perpendicular cut samples, two samples were prepared using a transverse cut (with respect to the deposition direction) for comparison. These samples were prepared from the original block between cuts 1 and 2 and 3 and 4.

2.1.2. Optical Microscopy

After mounting and polishing, each sample was examined via optical microscopy using a Keyence VHX-7000 series digital microscope.

2.1.3. Electron Microprobe

Electron probe microanalysis (EPMA) can be used to quantitatively analyze the composition of a given solid specimen. Source electrons interact with the subject material and excite characteristic x-rays from the sample [31]. The microprobe combines two related analytical techniques; wavelength-dispersive (WDS) and energy-dispersive spectroscopy (EDS). Both EDS and WDS analyze the characteristic x-rays that are excited from the sample either by separating the emissions via energy or wavelength, respectively [32]. Although WDS has better spatial resolution, EDS can be used to conduct quick initial compositional analysis of the sample. Two of the five original samples (samples 1 and 3) were examined with EPMA using a Cameca SX-100 electron microprobe. EDS was used for an initial compositional analysis on sample 1 at three locations: in the bulk of the nickel-based alloy, along the bondline, and within the copper-based alloy. A 500-micron scan was then completed across the bimetallic interface of the sample using WDS. For sample 3, a 500-micron scan was taken in the same way, followed by mapping of back-scattered electrons (BSEs) as well as for the compositions of the major constituents and the alloying elements.

2.2. Thermally Exposed Samples

2.2.1. Sample Preparation

Five additional samples were thermally exposed at 816 °C (1500° F) for 50, 100, 200, and 500 h, respectively. Each thermally exposed sample was prepared and examined in the same manner as the original, non-exposed samples. The 50 h and 100 h samples were both left in air for approximately two weeks after initial optical microscopy. Additional examination revealed noticeable surface oxidation, especially of the copper alloy as seen in Figure 2. For these samples, polishing was re-performed before further analysis was conducted. For the subsequent 200 and 500 h samples, the final polishing, optical microscopy, and electron microprobe analysis were performed in a timely manner in order to avoid additional oxidation.

2.2.2. Optical Microscopy

Optical microscopy was performed using a Keyence VHX-7000 series digital microscope for each of the thermally exposed samples. Surface corrosion was noted above, and the 50 h sample is shown in Figure 2 before and after re-polishing. Optical microscopy was re-performed after the second polishing for both the 50 h and 100 h thermally exposed samples.

2.2.3. Electron Probe Microanalysis

A 500-micron composition scan across the interface using WDS was performed for the 50, 100, and 200 h samples using Cameca SX-100 electron microprobe. For the 200 h sample, a secondary composition line scan was run over about 50 microns. For the 500 h sample, a higher resolution composition scan was performed over 100 microns across the bondline. Maps for BSEs and compositions of interest were also taken for each sample. High-resolution BSE and composition mapping was completed for the 200 and 500 h samples. EDS was also performed in two locations of interest in the 500 h sample.

2.3. Mechanical Testing

For mechanical testing, two sets of samples were also considered: the as-built bimetallic material and the same material after exposure to 816 °C (1500° F) for 200 h. Six round, tapered, and threaded bars were produced from each set, as shown in Figure 3. Each mechanical test bar had a gauge diameter of approximately 5 mm and a 20 mm gauge length. For each set of samples (as-built and thermally exposed), two tensile tests and four fatigue tests were performed using a Shimadzu Servopulser EHF-EV101K1. Tensile testing was executed at a test speed of 0.3 mm/min. Fatigue testing was load-controlled, fully reversed, with a range of 300 MPa (+/− 150 MPa) at 20 hertz. All mechanical tests were performed at approximately 100F. Following mechanical testing, the fracture surface was examined using a MIRA3 TESCAN scanning electron microscope (SEM) with an Oxford EDS.

3. Results

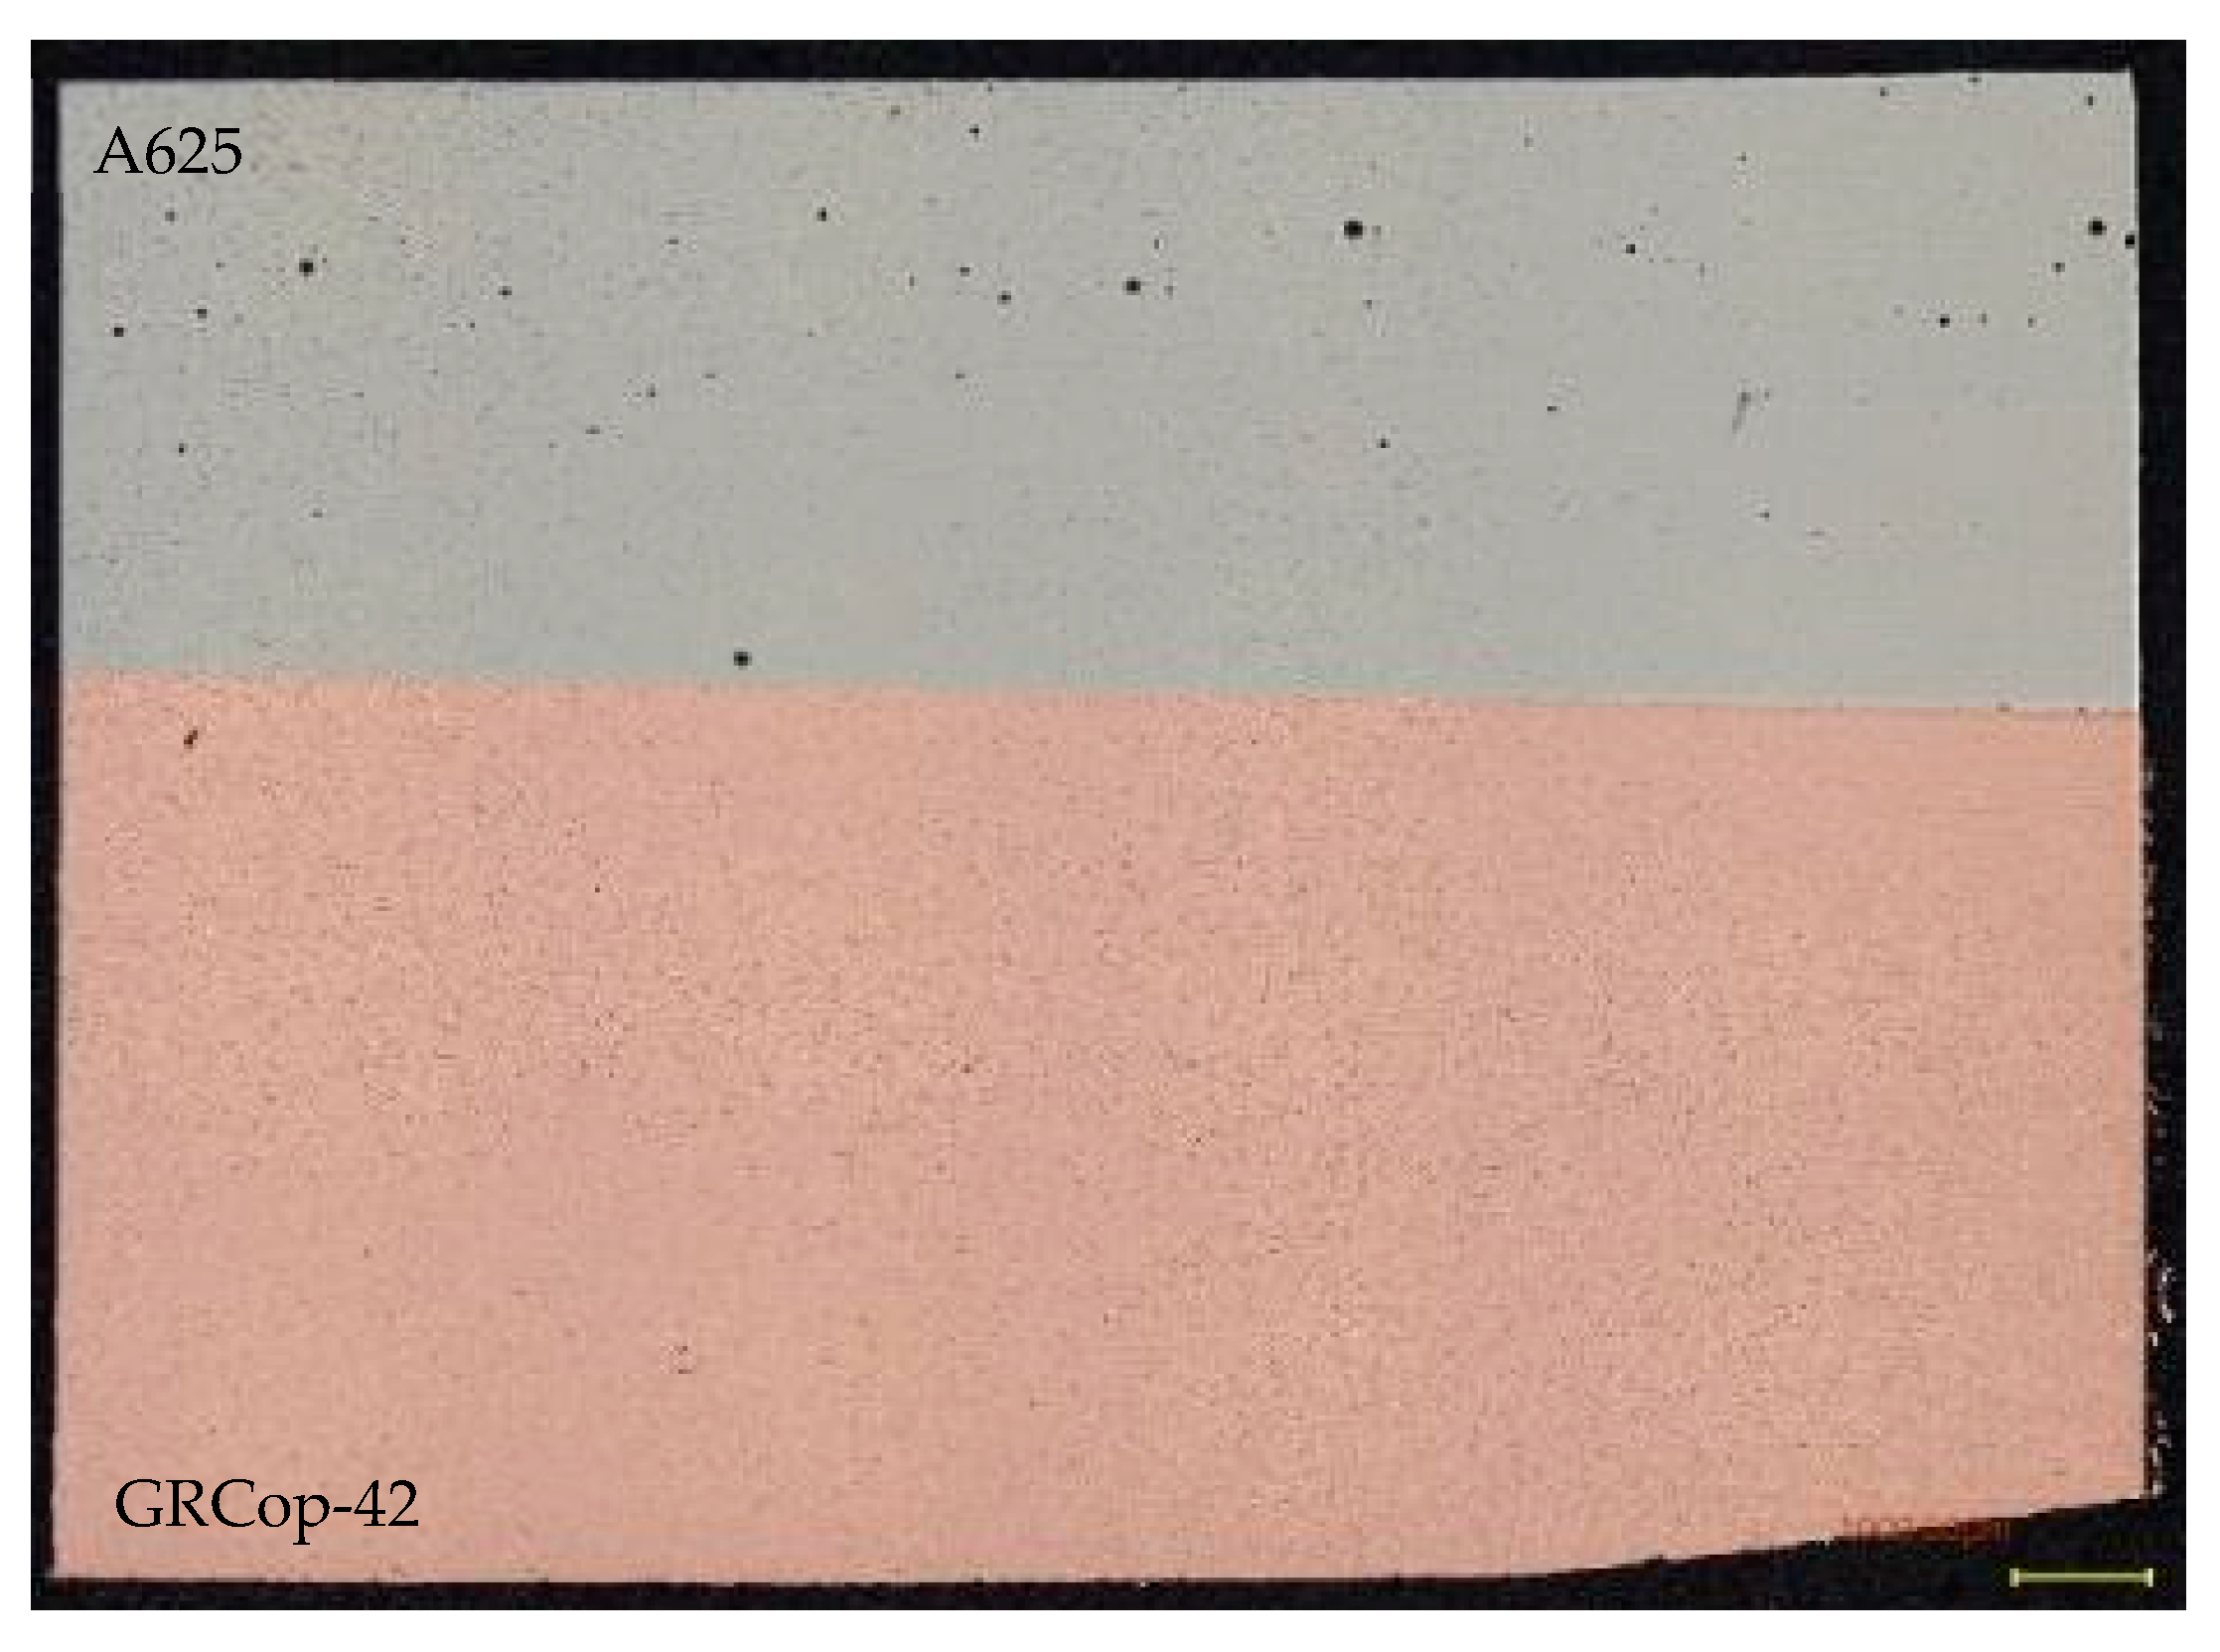
3.1. As-Built Samples

3.1.1. Optical Microscopy/Porosity

Images were taken of each as-built sample using optical microscopy. These images were used to investigate any potential porosity or indications within the build volume. Figure 4 shows an overview of sample 3 at 50× magnification. The 50×-magnification overview image of the transverse cut from between sample 1 and 2 is shown in Figure 5.

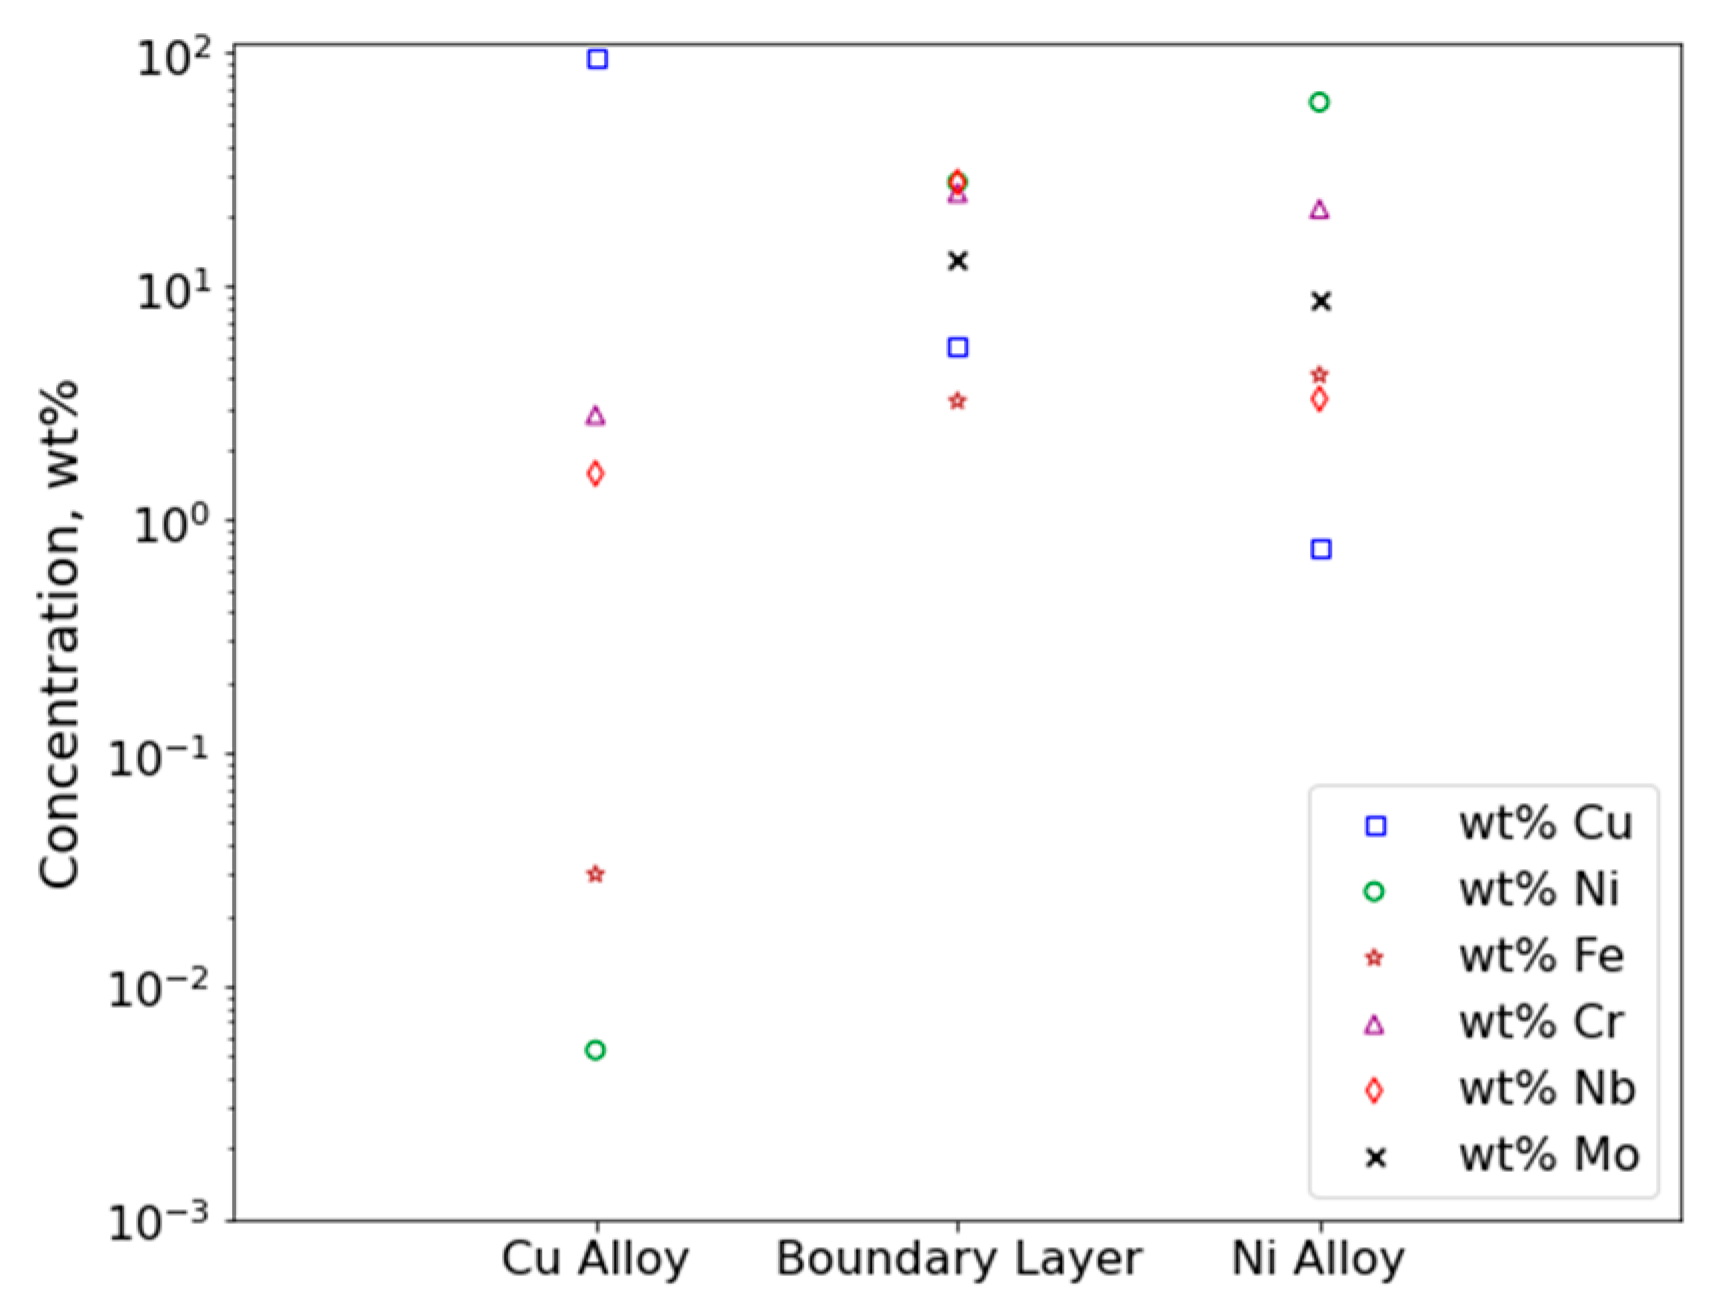
3.1.2. Electron Probe Microanalysis

Figure 6 shows the initial compositional analysis of the as-built sample in the nickel alloy, copper alloy, and at the boundary layer for sample 1. The 500-micron composition scan line for the samples from sample 1 and sample 3 began in the copper alloy and traveled across the boundary and ended on the nickel alloy side. The results of the line scan for sample 3 are shown in Figure 7.

3.2. Thermally Exposed Samples

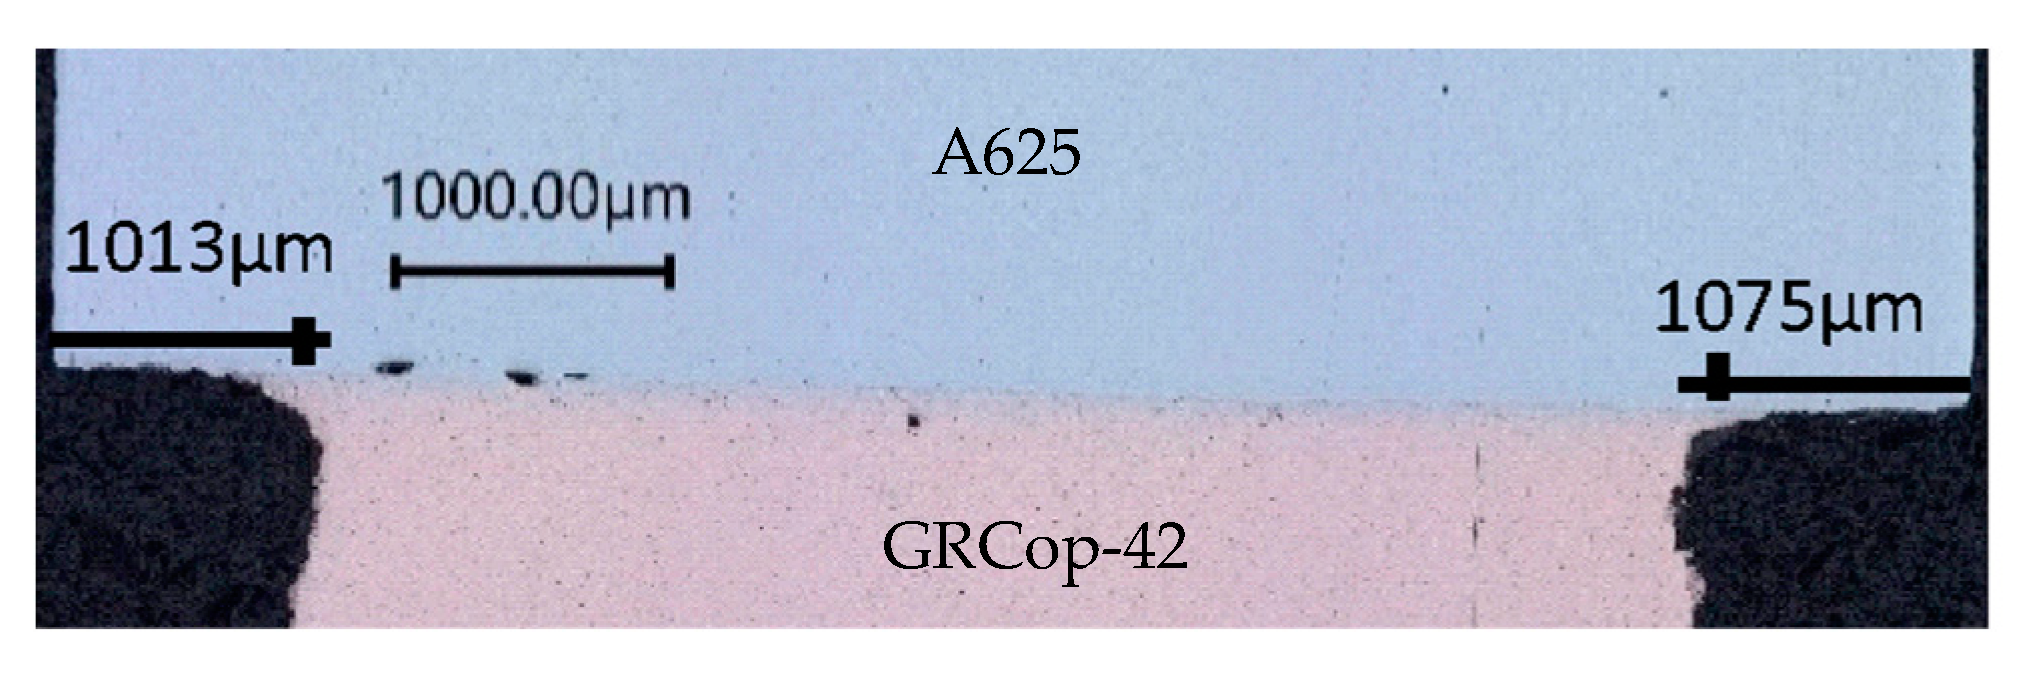
3.2.1. Optical Microscopy/Copper Alloy Oxidation

Figure 8 and Figure 9 highlight the material degredation of GRCop-42 (copper alloy) due to oxidation during exposure at 816 °C. Figure 8 shows an overview of the increasing material loss with longer thermal exposures. Measurements of the linear loss of material were taken from each side, as shown for the 200 h thermally exposed sample in Figure 9. One-sided linear material loss measurements and averages are recorded in Table 2 for each thermal exposure.

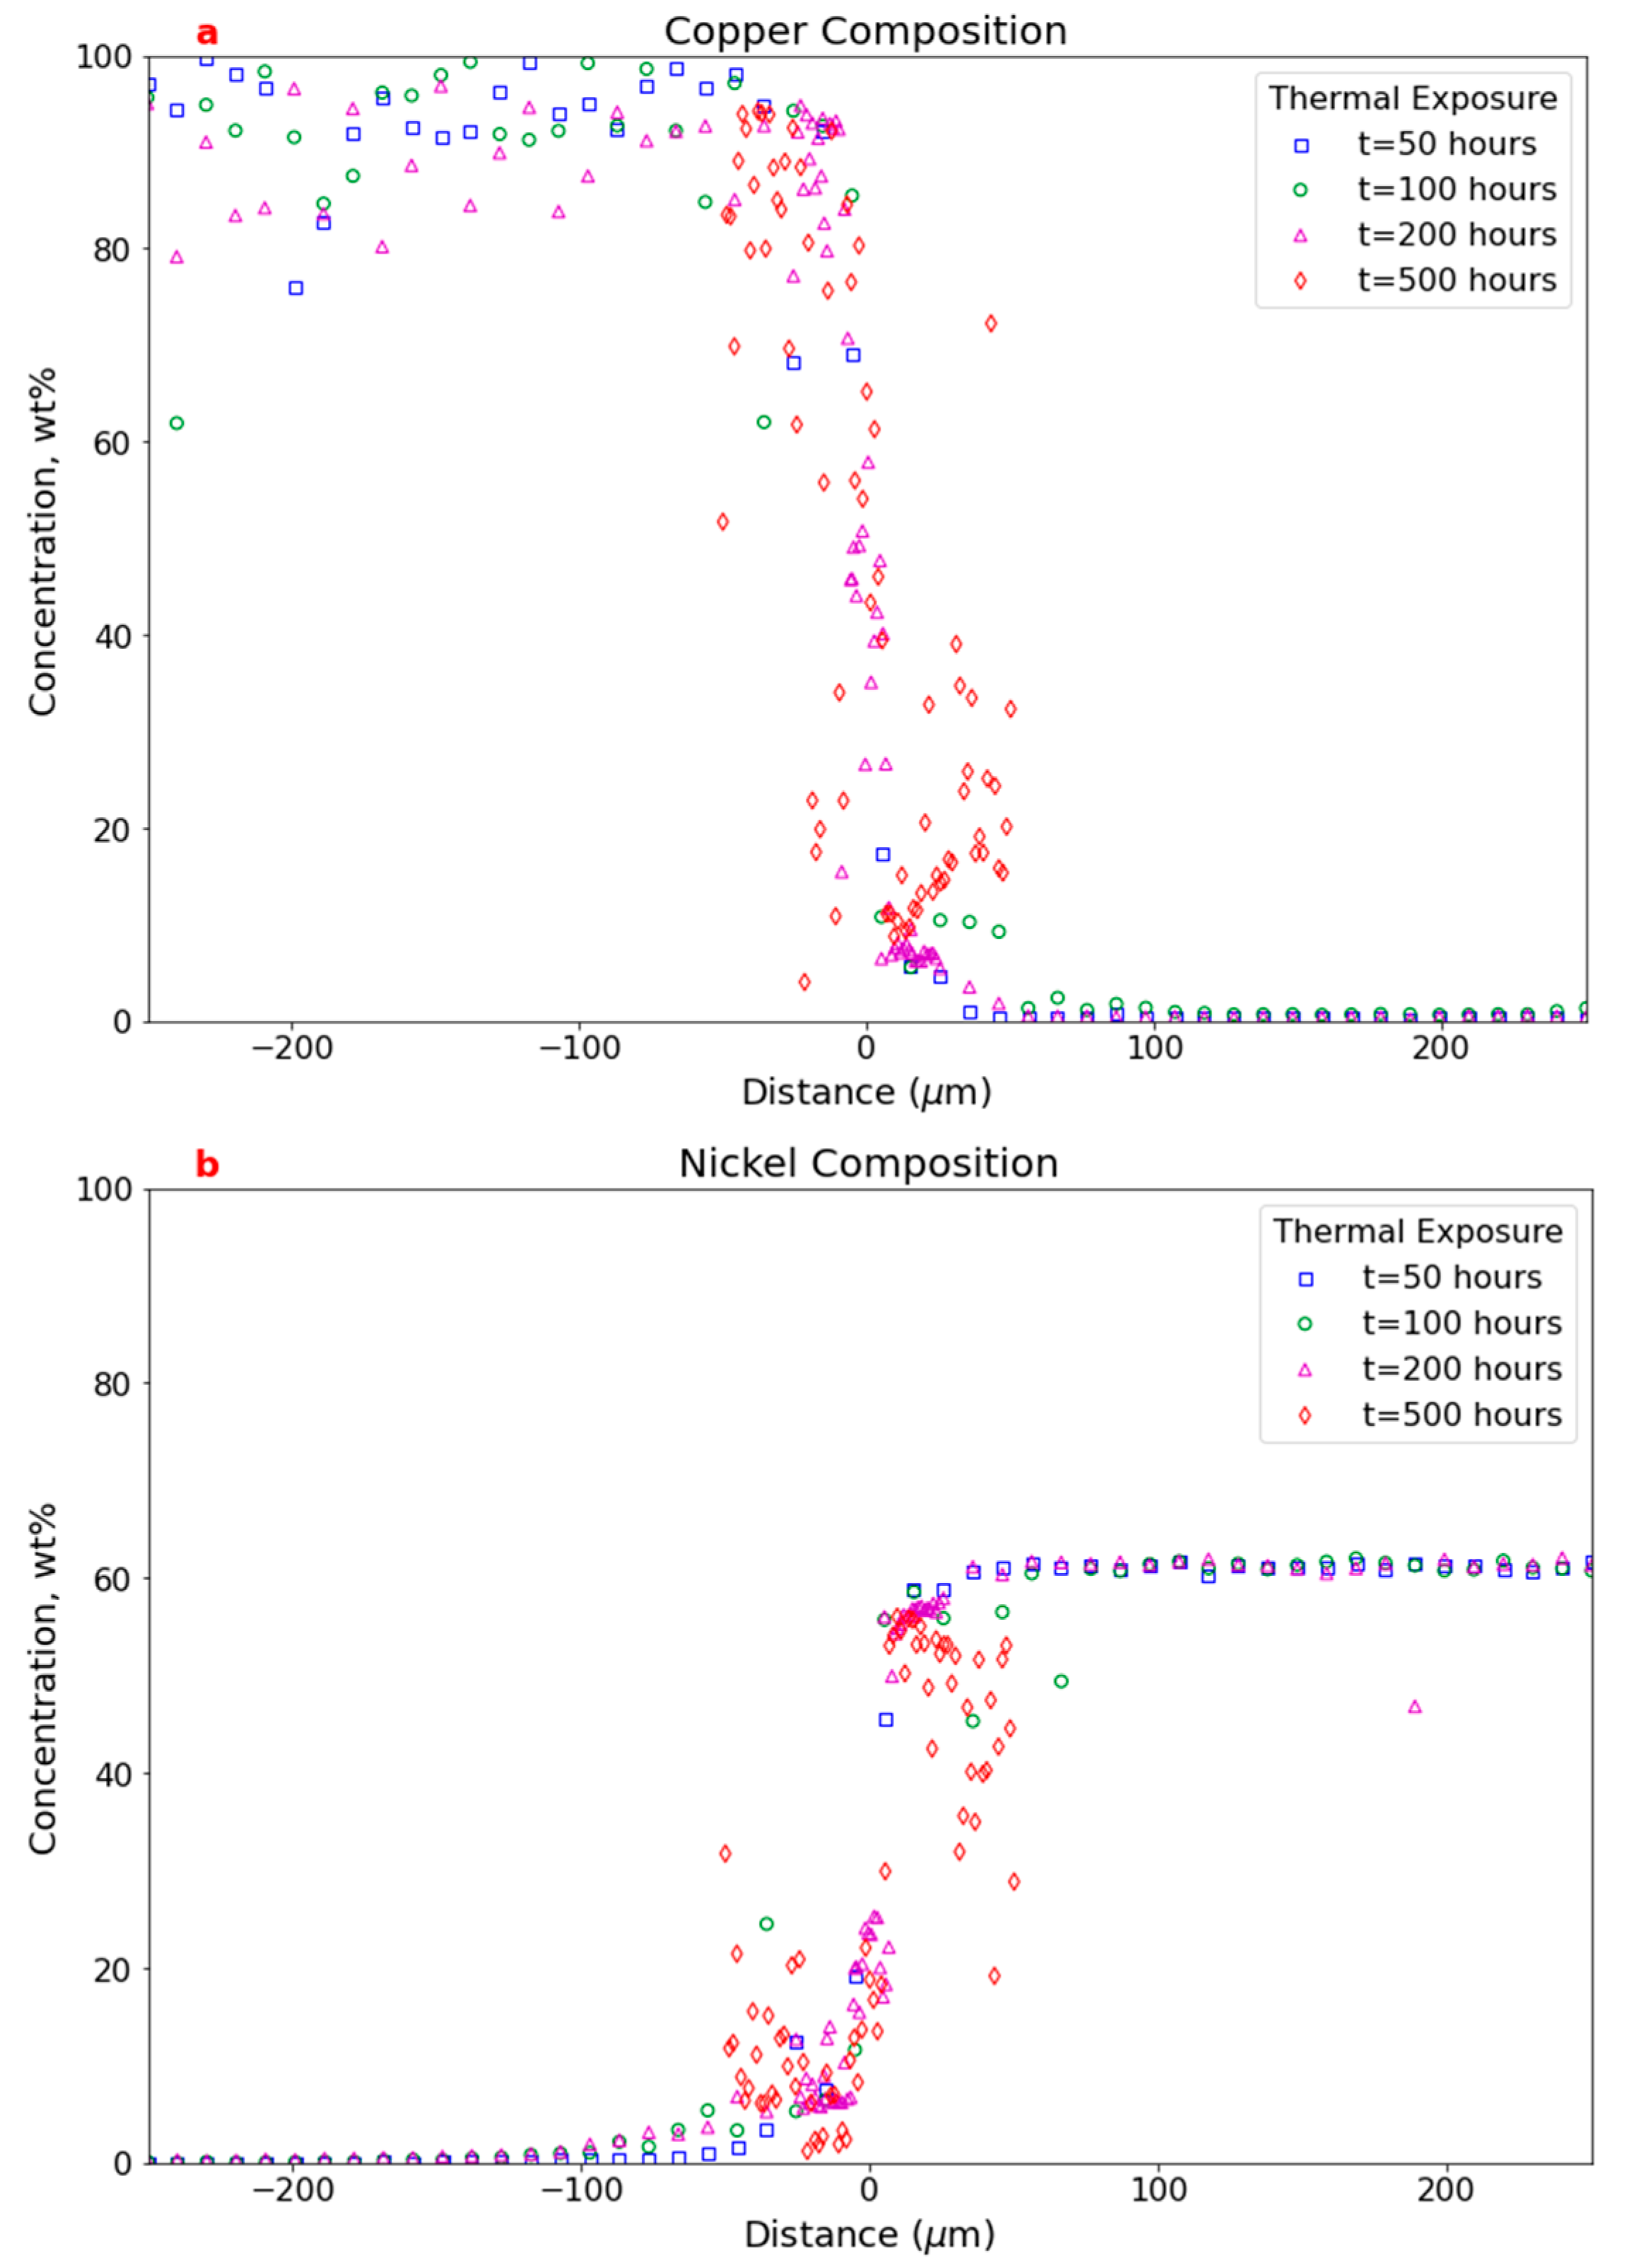
3.2.2. Electron Probe Microanalysis

Each of the thermally exposed samples (held at 816 °C for a range of 50 to 500 h) was analyzed for composition profile using the EPMA line scan across the nickel–copper boundary. Figure 10 shows the copper and nickel compositions over the scans of all the different thermally exposed samples. For distances farther than about 50 microns from the boundary, the composition becomes essentially constant. Figure 10, therefore, shows the locations of interest near the boundary. Additionally, for the 500 h sample, composition data were not collected for distances further than 50 microns from the boundary line.

3.3. Comparison Between As-Built and Thermally Exposed Samples

EPMA mapping results are shown in Figure 11 for both the as-built and 500 h exposed materials. Particles enriched in chromium and niobum are more evident through either formation or coarsening of precipitates within the GRCop-42 material. EMPA mapping of the bondline region also provides a visual representation of the changing diffusion profile across the interface measured by the line scans shown in Figure 10.

3.4. Mechanical Testing

Ambient-temperature mechanical testing was performed on two sets of samples: the “as-built” sample set was machined from the as-built, additively manufactured, bimetallic material, and the “thermal exposure” sample set was produced from the same bimetallic material with the same manufacturing conditions, after thermal exposure at 816 °C for 200 h. The manufacturing method for both sets was the same as that for the microscopy samples (PBF-LB on the copper alloy side and DED for the nickel alloy side). For all mechanical testing—tensile and fatigue—every sample broke either on the GRCop-42 side or at the interface. There were no instances where the sample failed on the alloy 625 side. Therefore, results are shown as compared with additively manufactured GRCop-42’s properties [12,33].

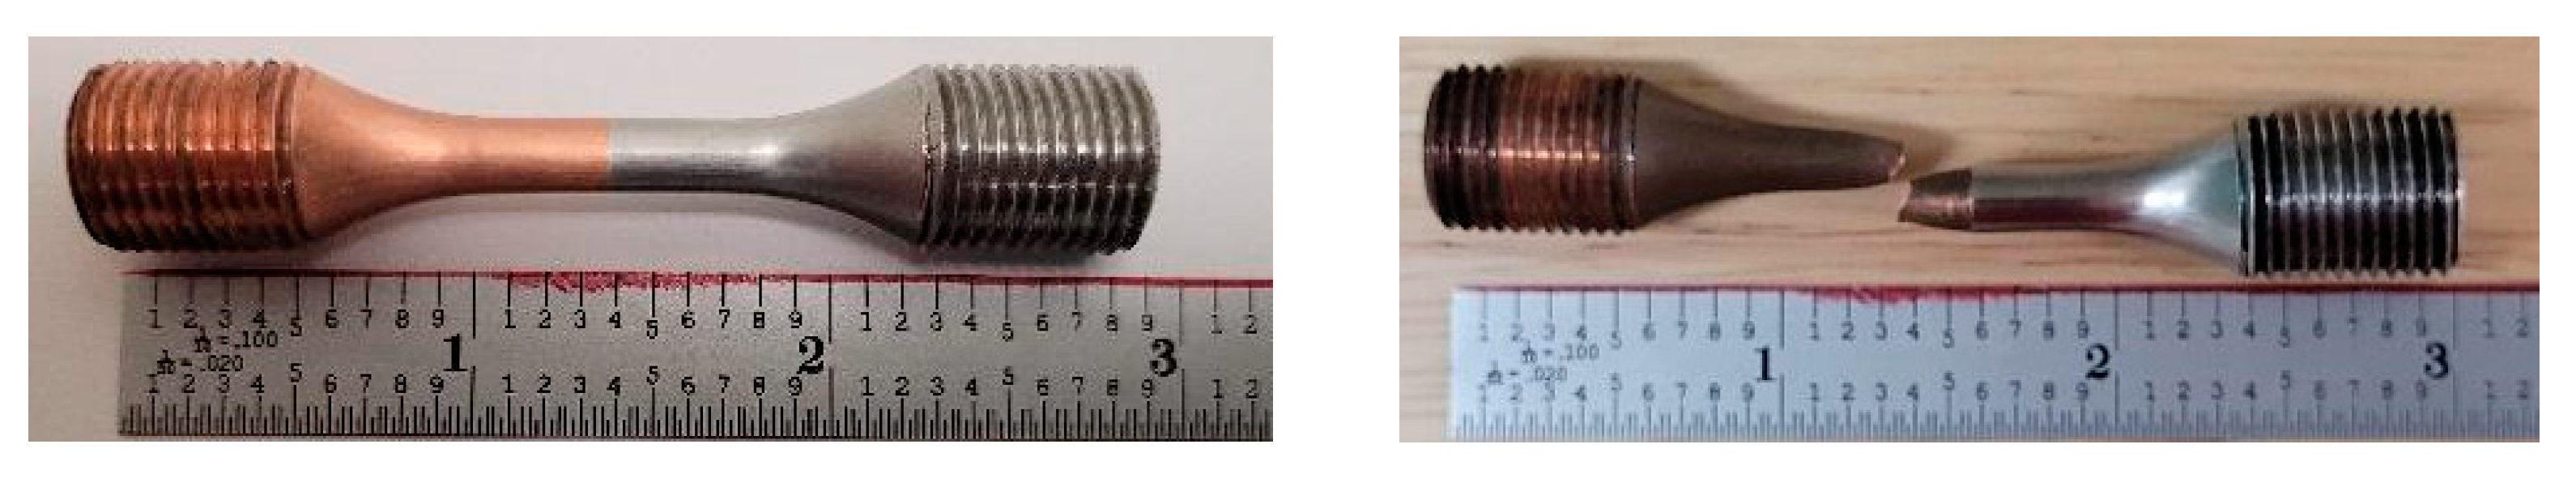
3.4.1. Tensile Testing

Figure 12 shows the direct output from the tensile testing of an as-built sample (SN5), and Figure 13 shows the test bar before and after testing for the same sample. Table 3 contains the results from the bimetallic tensile tests compared to cited data for GRCop-42.

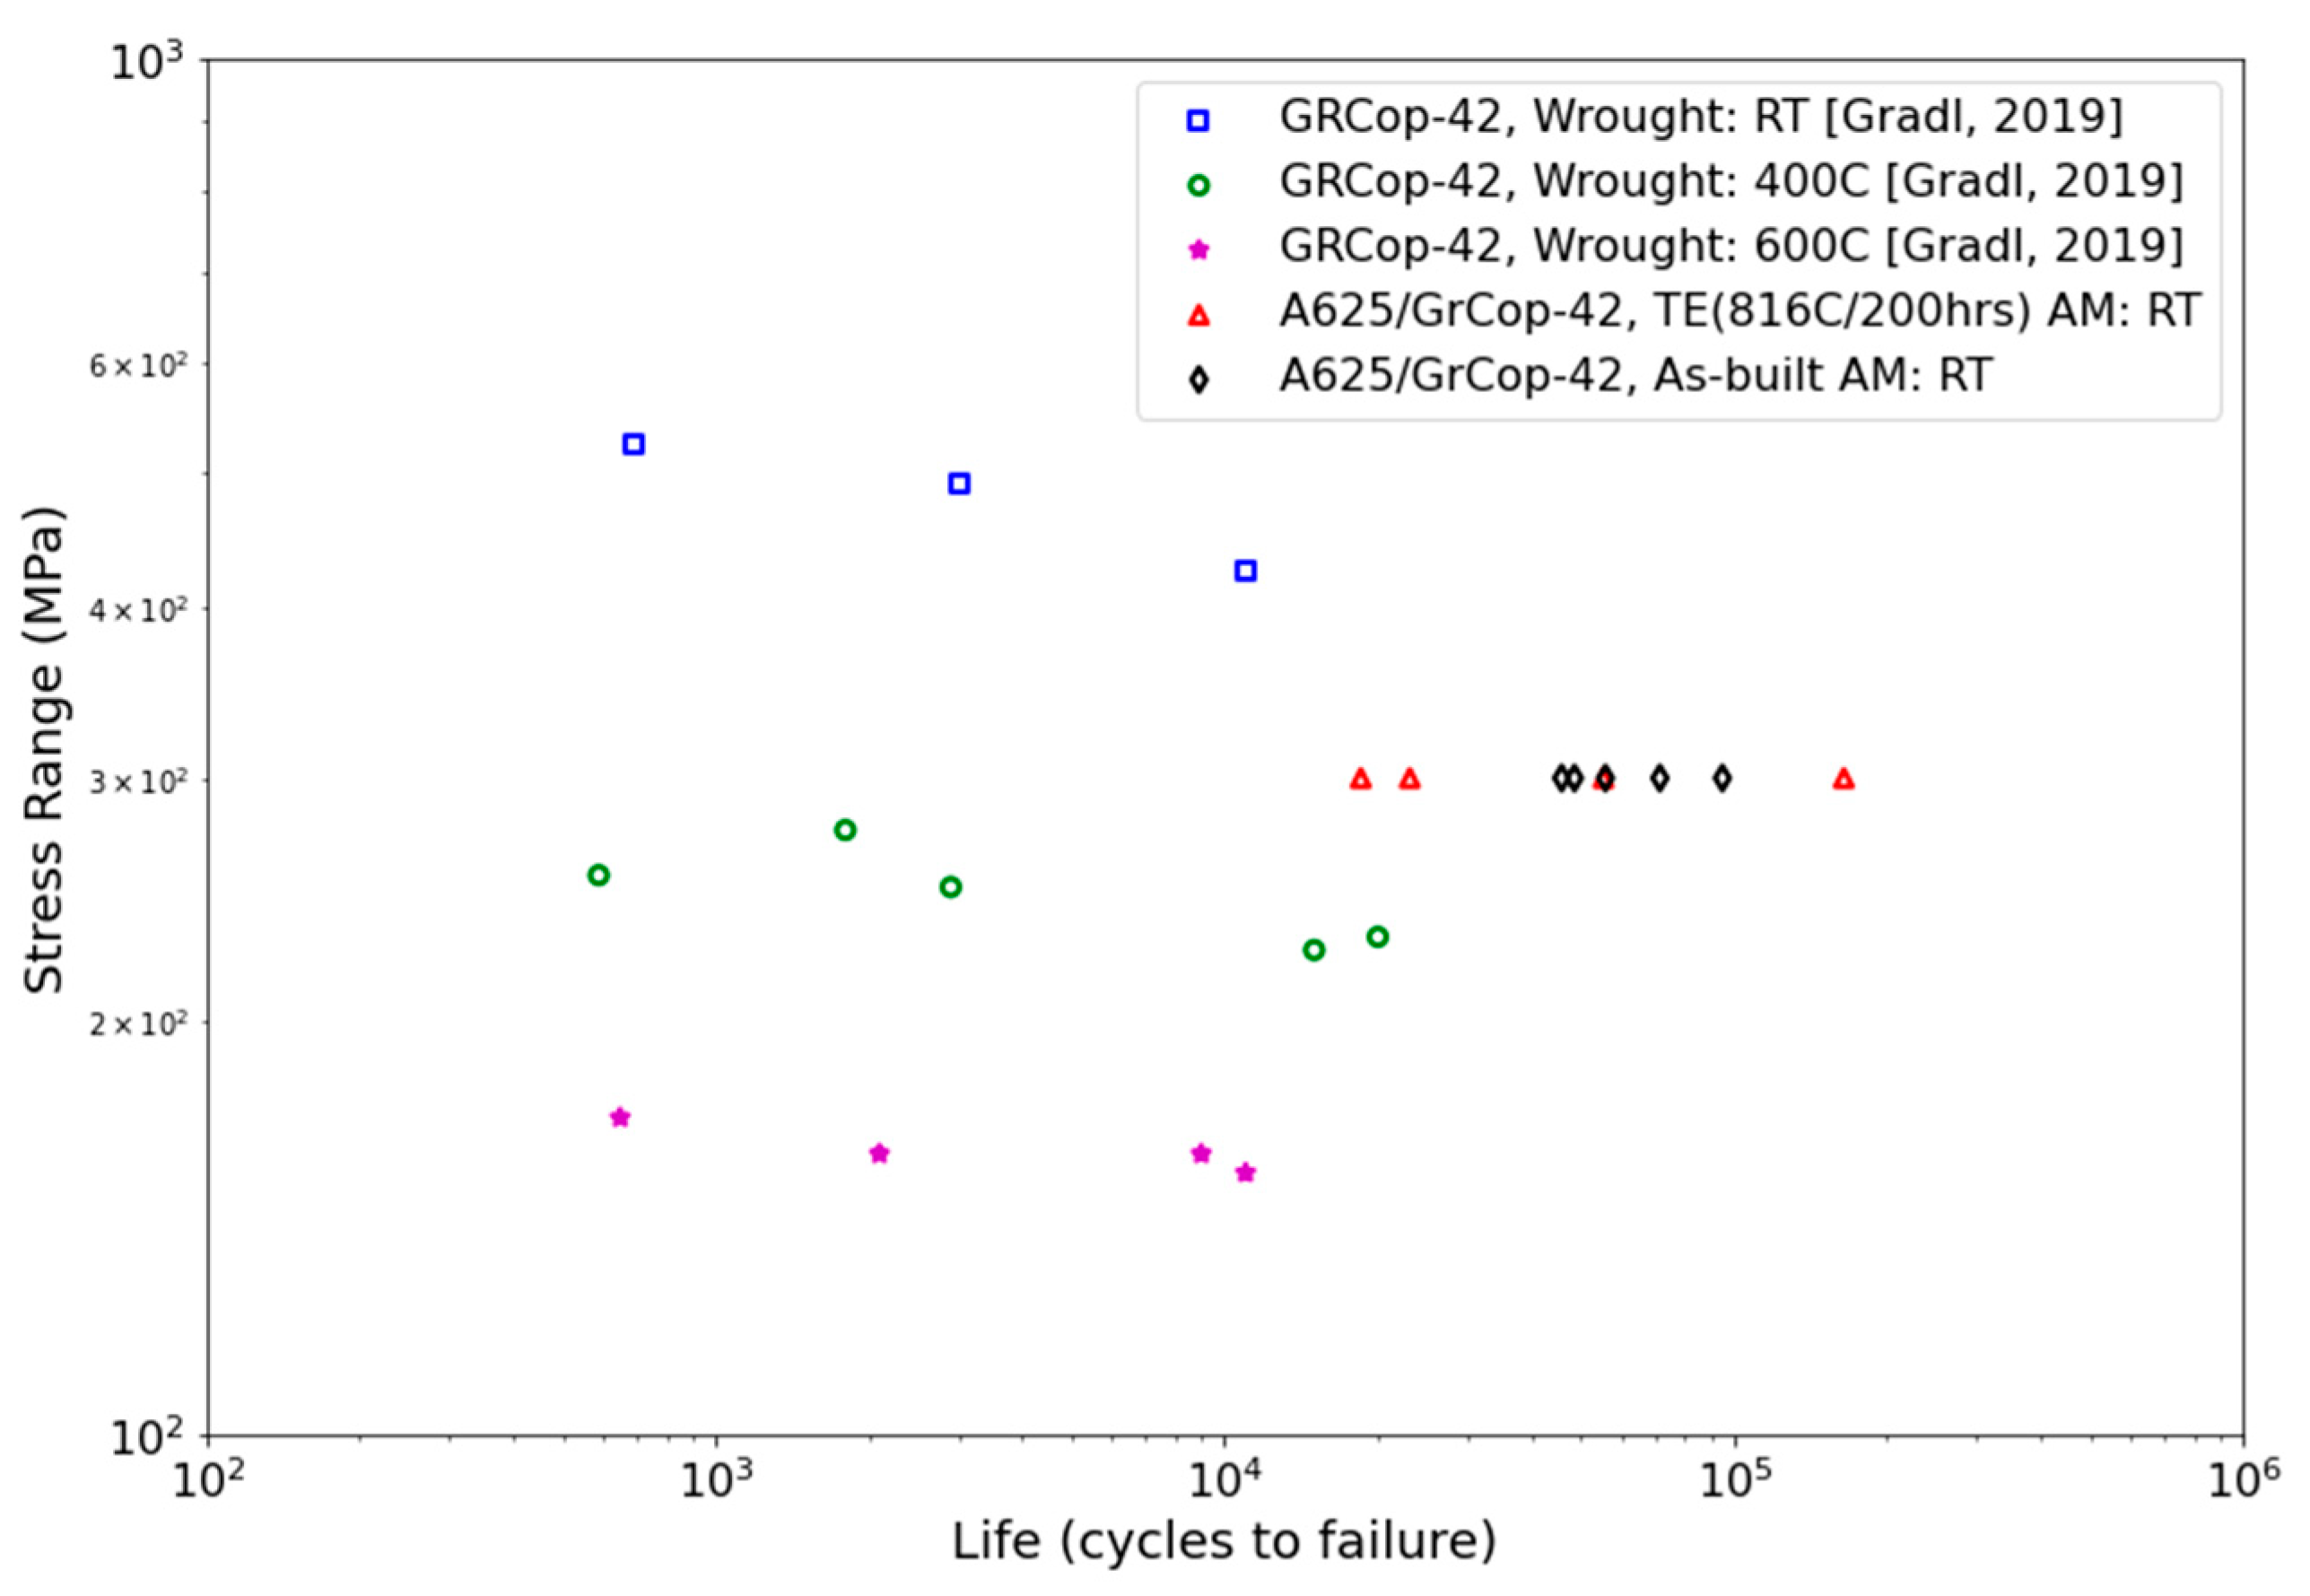
3.4.2. Fatigue Testing

Table 4 shows the results of fatigue testing for the as-built sample set, and Table 5 shows the results for the thermal exposure sample set. Figure 14 shows the results of the fatigue testing graphically compared with that of wrought GRCop-42 tested at various temperatures, as presented by Gradl [6].

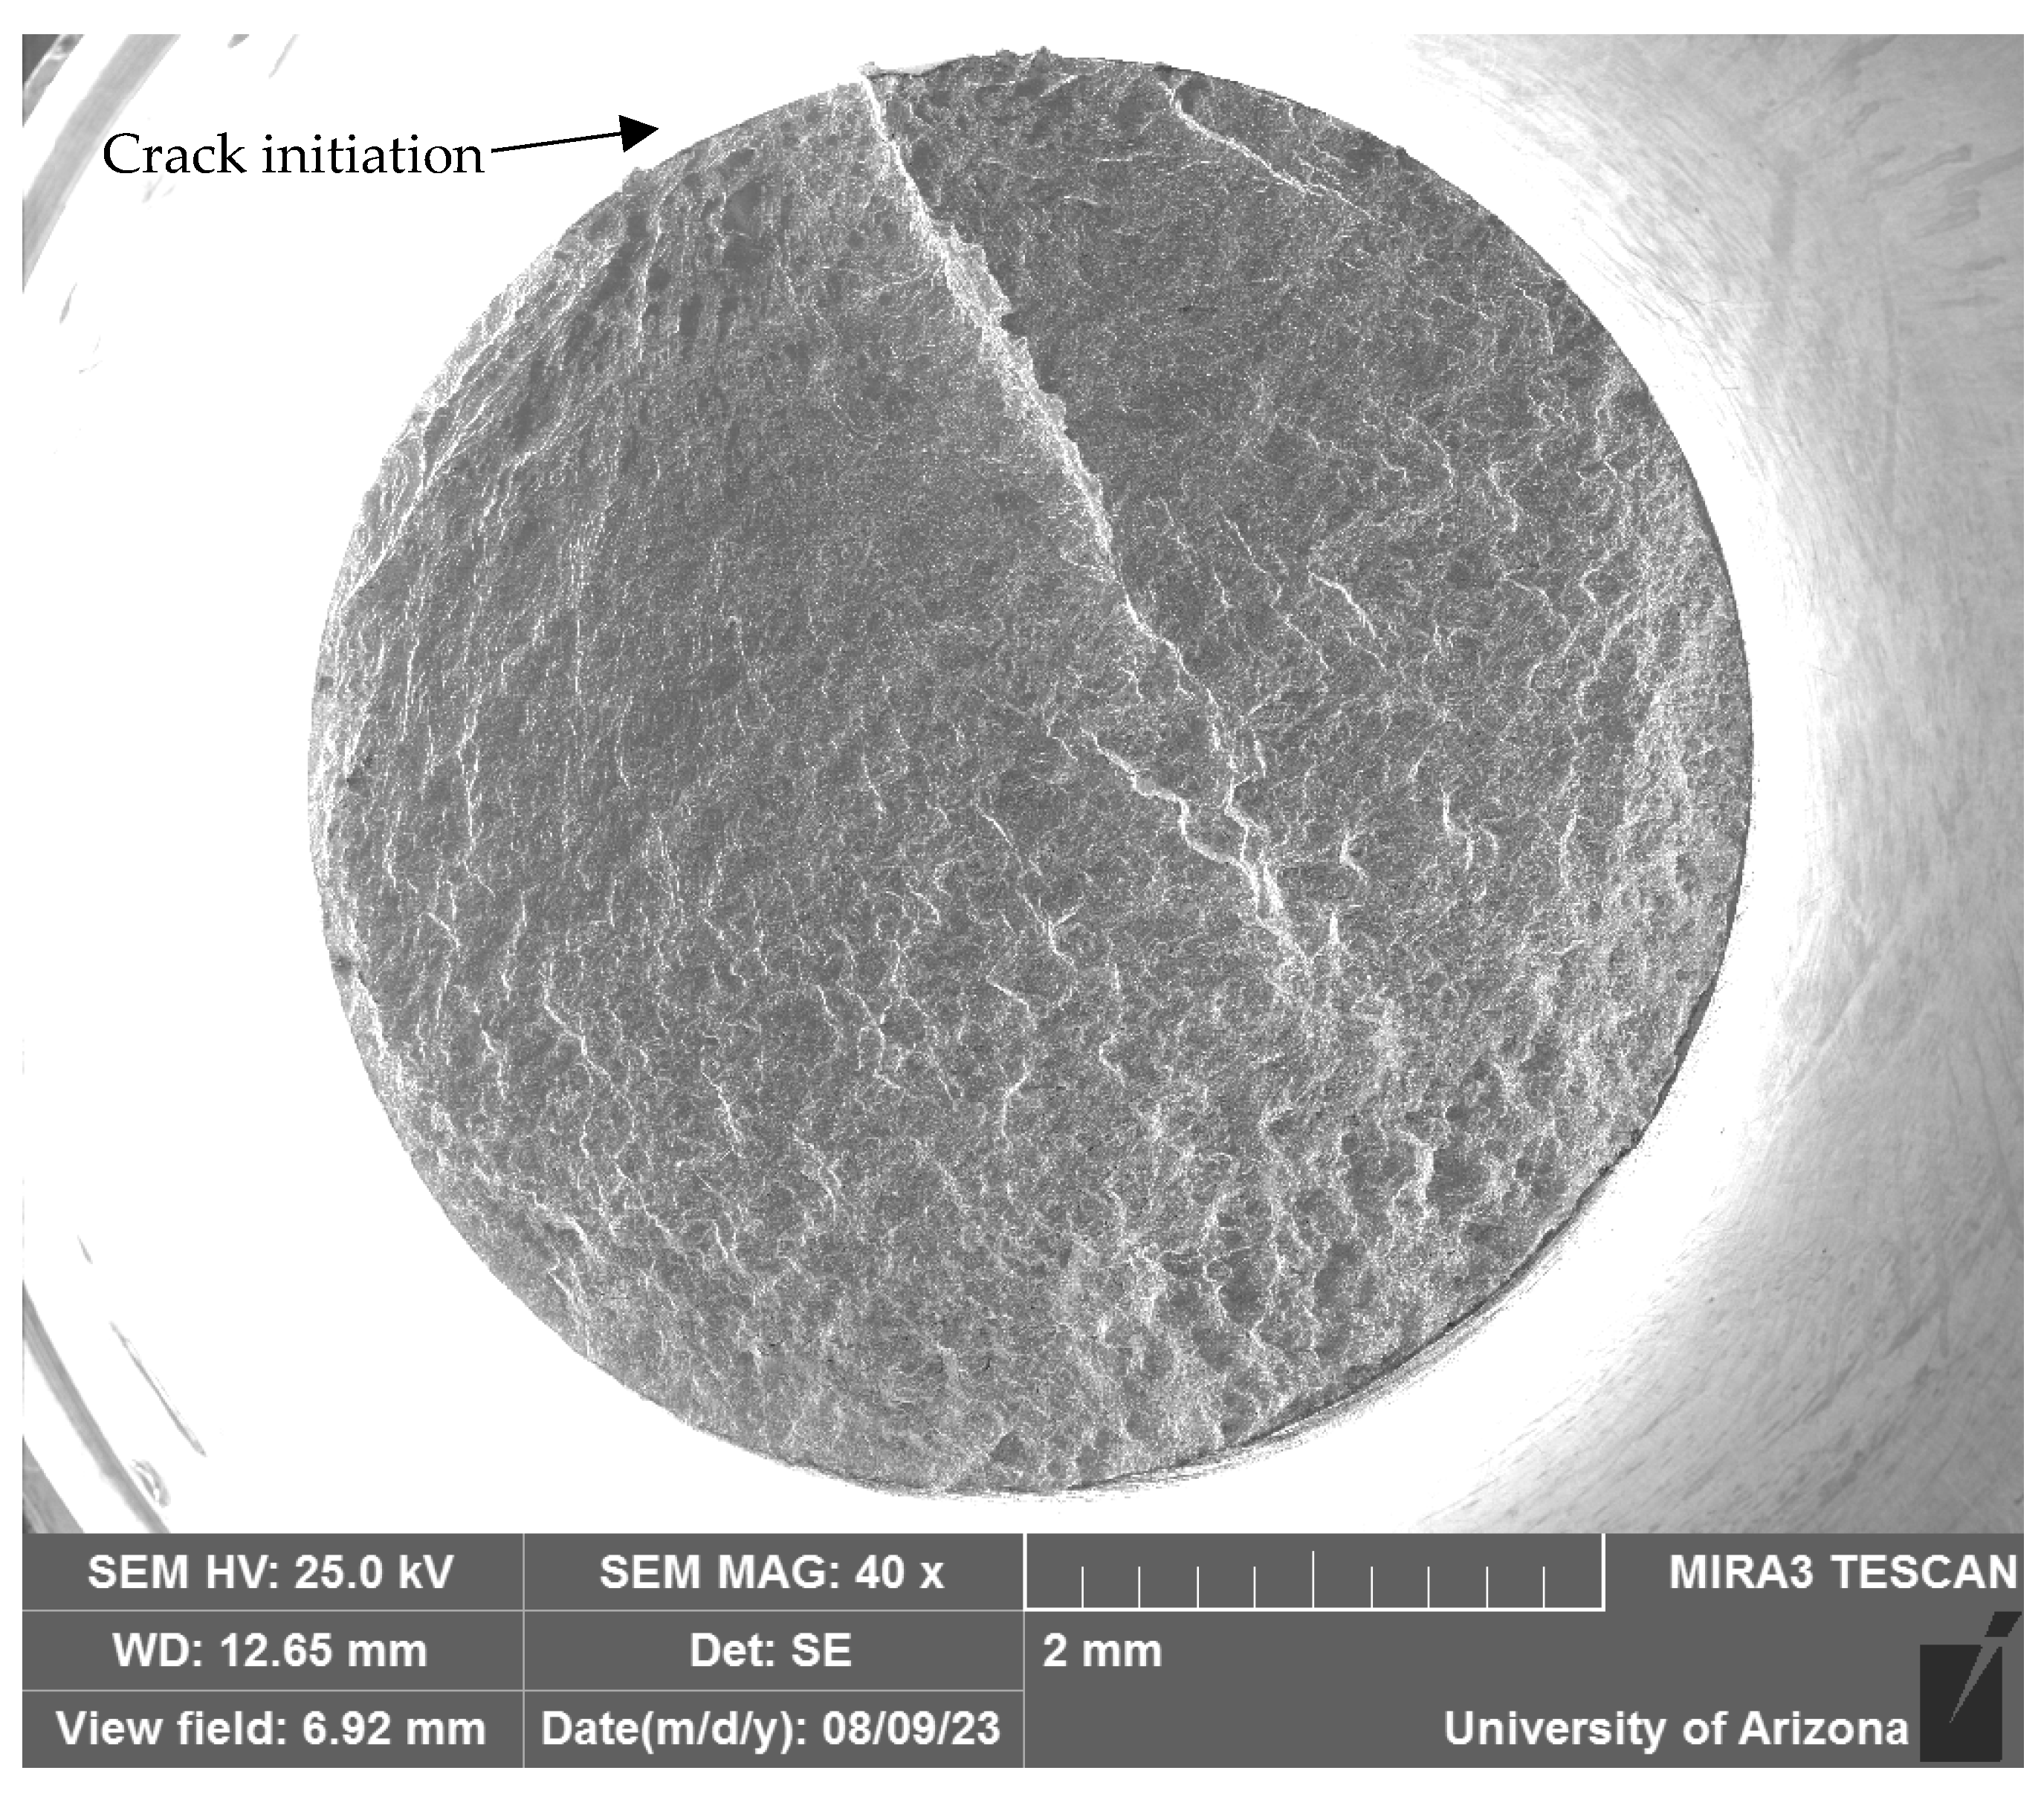
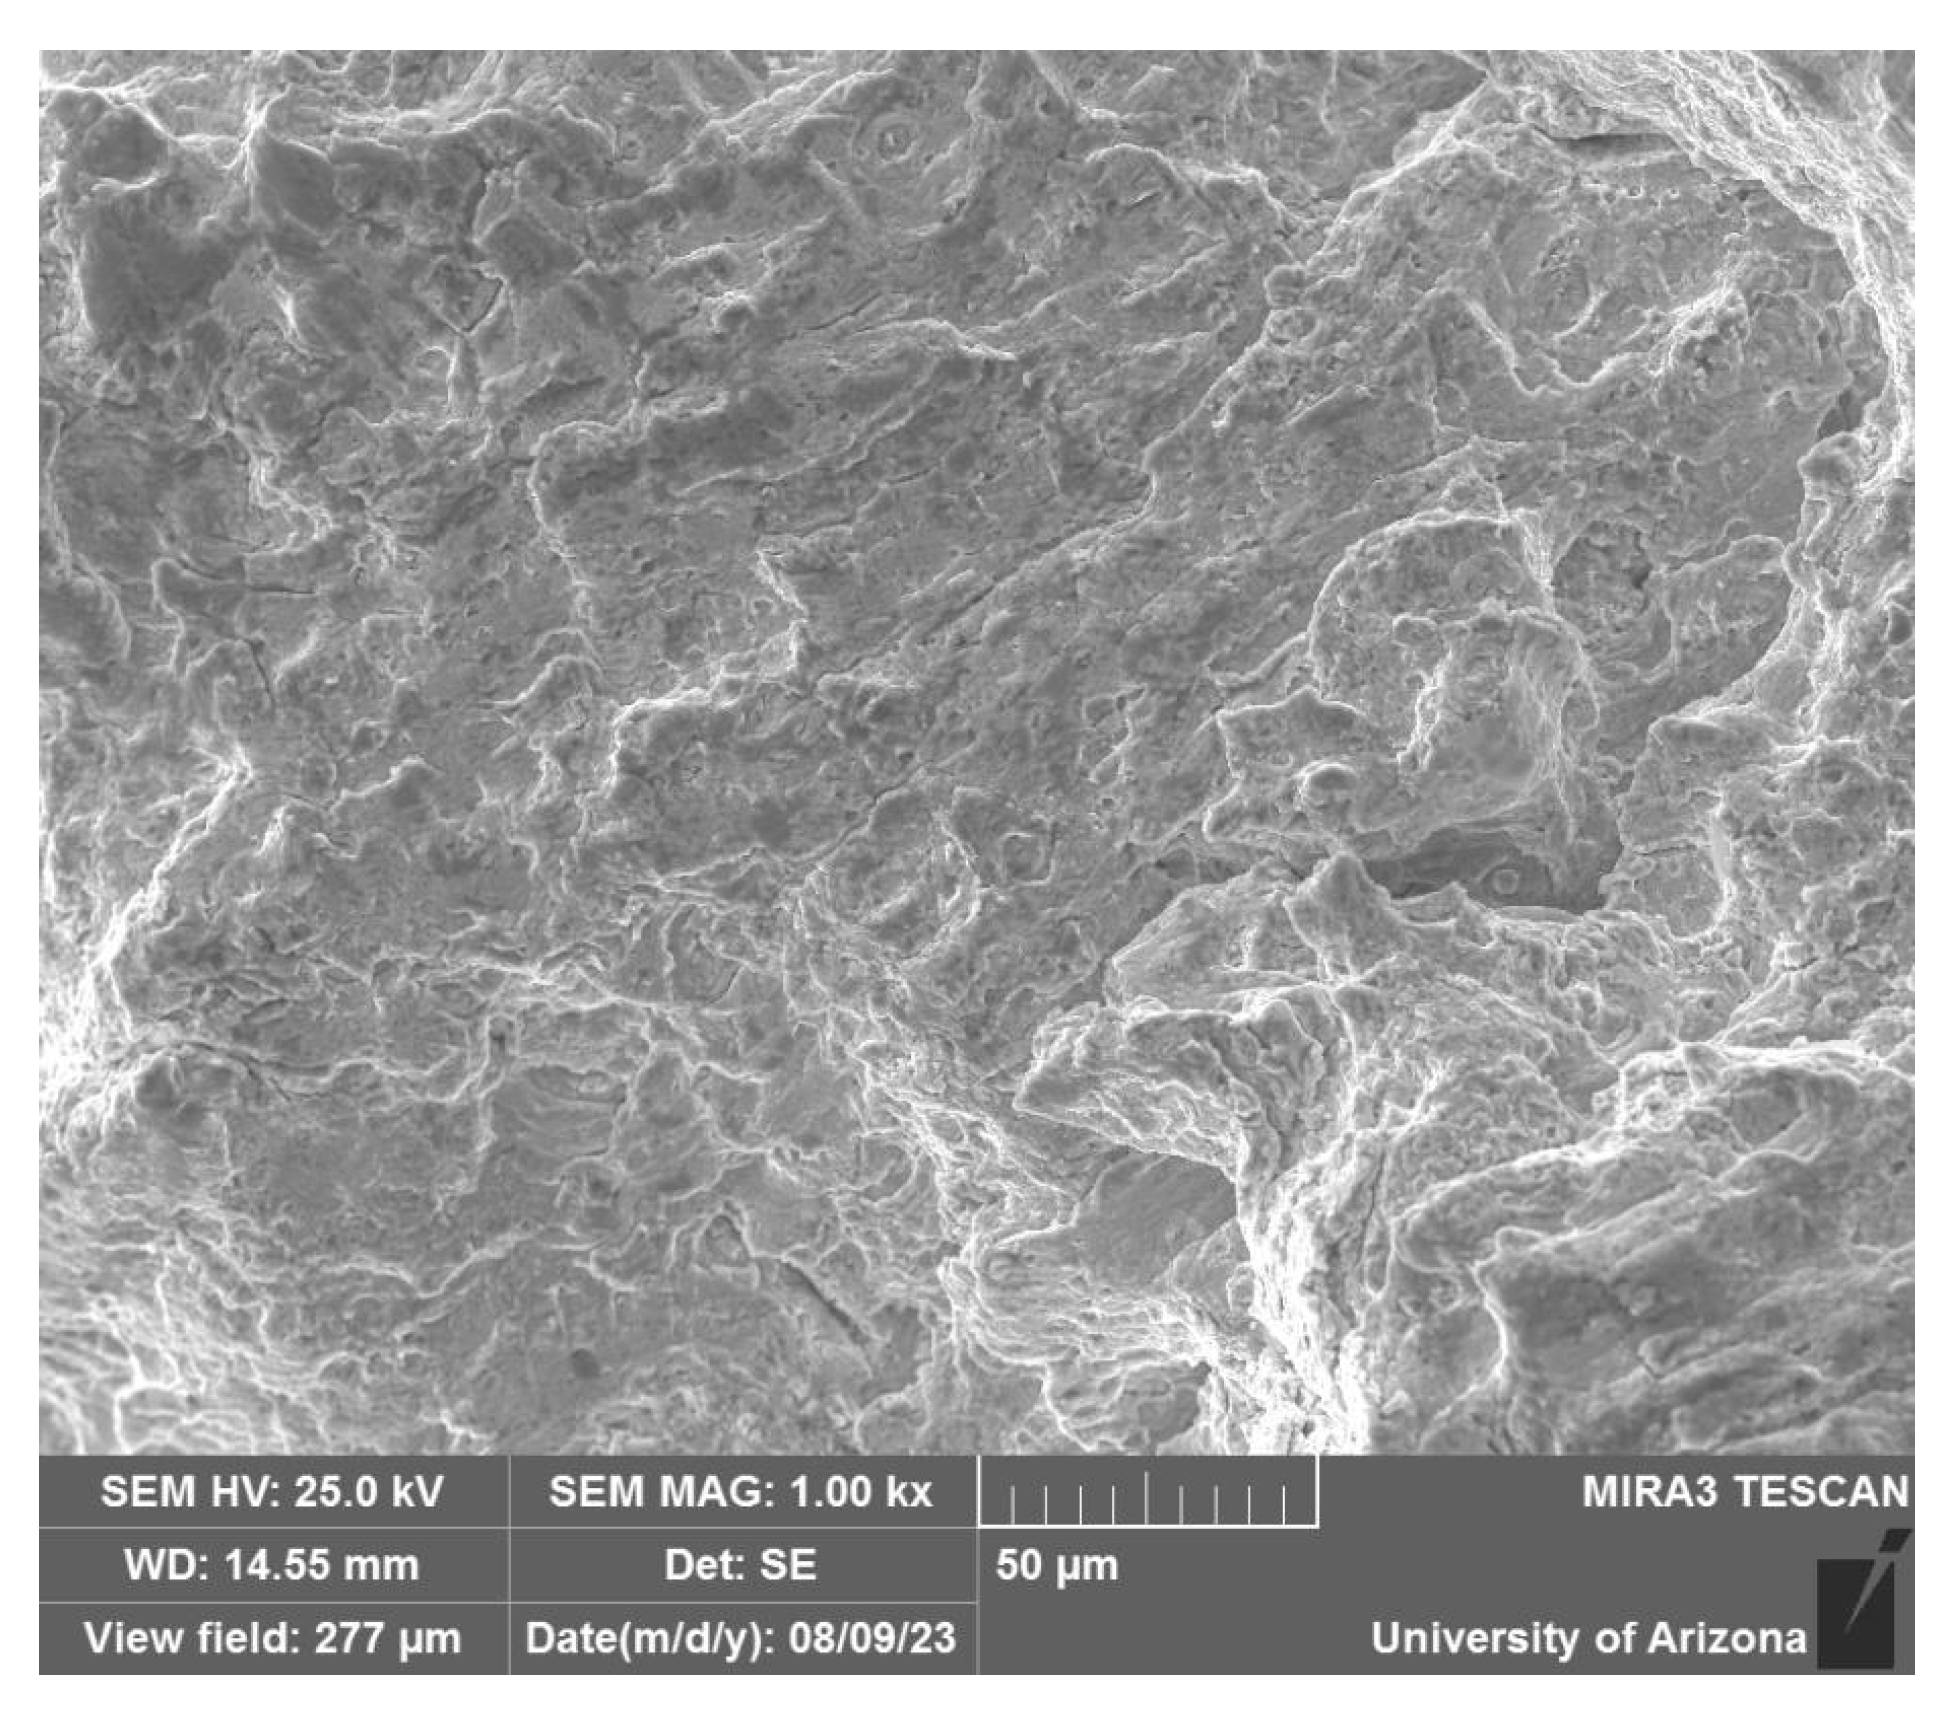
3.4.3. Fatigue Fracture Analysis

After completion of the fatigue testing, the fracture surface of each sample was examined using SEM. This allowed for the identification of the crack initiation features as well as further characterization using EDS. Figure 15, Figure 16, Figure 17, Figure 18, Figure 19 and Figure 20 show images for as-built samples, SN4 and SN6, and Figure 21, Figure 22, Figure 23, Figure 24, Figure 25, Figure 26, Figure 27 and Figure 28 are for thermally exposed samples TE1 and TE6. For each sample, there is an image of the sample after fracture, an overview SEM image of the fracture surface of the copper side of the sample, and a higher-magnification SEM image from the fracture surface.

4. Discussion

4.1. As-Built Samples

4.1.1. Optical Microscopy/Porosity

As seen in Figure 4 and Figure 5, the nickel alloy exhibits some pores visible in the optical microscope. Some porosity is expected in the as-built condition due to the entrapment of carrier gas during the blown powder directed energy deposition process [34]. The porosity observed is reasonable compared to porosity studies of additively manufactured nickel-based alloys [34,35] with an average pore diameter less than 50 microns. Some minor indications are visible on the bondline as well, but not larger than 100 microns. Additionally, no significant differences in porosity or other indications were observed between the five samples. The transverse cut samples were also examined using optical microscopy. Porosity in the nickel-based alloy and near the bondline is comparable to that observed in the perpendicular cuts.

4.1.2. Electron Probe Microanalysis

There were no major differences noted in the compositions found in sample 1, which was cut from the edge, compared to sample 3, which was cut from the center of the as-built block. The interface between the two materials in the as-built condition consists of two compositionally distinct regions with no evidence of mixing or interdiffusion between the nickel and copper alloys beyond the bondline itself.

4.2. Thermally Exposed Samples

Optical Microscopy/Copper Alloy Oxidation

As seen in Figure 8 and Figure 9, the GRCop-42 (copper alloy) experienced substantial loss of material due to oxidation during exposure at 816 °C. One-sided linear material loss measurements show the average material loss trend is proportional to the square root of time. For parabolic oxidation kinetics, common in metals such as copper, the thickness of the oxide layer increases proportionally to k t , where k is a scaling constant, and t is time at temperature [36]. Since the material loss is due to oxidation, this provides a rough approximation of the material loss in the copper alloy due to the heating process at 816 °C in air, suggesting that any oxide formation that occurs is ineffective at passivating the surface against continuing degradation. This is important to note for application purposes, as the GRCop-42 is not suitable for sustained use at high temperature in air.

4.3. Diffusion Modeling and Computational Methods

The composition data obtained for the thermally exposed samples were used to inform an approximation of the diffusion model of the main constituents of each alloy (copper and nickel) into the other alloy using a simplified semi-infinite boundary condition to solve Fick’s second law [36]:
C t = D 2 C x 2
The approximate solution used, solved for composition, is of the form [36]:
C x , t = C s C s C 0 e r f x 2 D t
where x is position relative to the boundary, t is time, D is diffusion coefficient, C is concentration (composition), Cs is the composition at the boundary (or half of the max concentration), and C0 is the initial concentration of the element of interest. A Monte Carlo random sampling method was used in Python (pymc3) to calculate the diffusion coefficient of copper into the nickel alloy to be 2.381 × 10 12   c m 2 / s and of nickel into the copper alloy to be 1.897 × 10 12   c m 2 / s . A comparison of the diffusion curves calculated by this model with the raw data for the 50 h thermal exposure sample is shown in Figure 29.
For comparison, the diffusion coefficients for the pure elements can be calculated using [37,38] the following:
D = D 0 exp Q R T
According to diffusion data for pure copper into pure nickel [37], D 0 = 0.61   c m 2 s 1 and Q = 255   k J m o l 1 . Using these values and the test temperature of 816 °C (1089 K) in Equation (3) gives 3.584 × 10 13   c m 2 / s . Diffusion database data for pure nickel in pure copper [38] give D 0 = 0.38   c m 2 s 1 and Q = 2.36   e V , which results in a diffusion coefficient of 4.549 × 10 12   c m 2 / s .
The diffusion coefficient can be used to approximate the diffusion length of the material for a given time at the specified temperature. Since all samples were thermally exposed to the same temperature, the diffusion coefficient is the same, and diffusion length Ld can be approximated using a semi-infinite model by the following [36]:
L d = D t
This leads to a diffusion length in the 500 h sample of about 21 µm for copper into the nickel alloy and about 18 µm for nickel into the copper alloy. While this analytical method allows for rough estimate calculation of the diffusion coefficient, it is limited by its simplified assumptions. The method analyzes the collected data to calculate a best-fitting diffusion coefficient.
The experimental results were also compared to simulations using a commercially available CALPHAD software code. The diffusion module of Pandat software by Computherm LLC Version 2023 was also used to simulate the elemental diffusion of GRCop-42 and alloy 625 based on the actual compositional values recorded from the EPMA (Figure 6). This simulation includes the main constituents as well as the various alloying elements in each material, which were not specifically calculated for in the first analytical method. A comparison of the diffusion curve for nickel estimated by the Pandat software with the measured EPMA data for the 50 h thermal exposure (816 °C) is shown in Figure 30. The Pandat model was able to predict the general diffusion behavior for this diffusion couple, including more nuanced behavior caused by interactions of both major and alloying elements.

4.4. Comparison Between As-Built and Thermally Exposed Samples

EPMA Mapping

The composition maps were compared between as-built and thermal exposure samples. The back-scattered electron (BSE) images and composition maps are shown in Figure 11 as a comparison between the boundary with no thermal exposure (as-built) and the longest thermal exposure performed, which is 500 h at 816 °C (1500° F). Microstructural changes due to thermal exposure are noted.
In Figure 11a,b, the formation of oxides in the copper alloy during thermal exposure can be seen by dark spots (low density) in the BSE map that were not present in the as-built sample. This can be seen further in Figure 11c,d by a depletion of copper in the same locations after thermal exposure. These oxides are rich in chromium and niobium as shown in Figure 11g–j. Analysis of the composition in one of these oxides near the bondline showed oxygen, chromium, and niobium peaks. The Cr2Nb precipitated in GRCop-42 [8], which is generally resistant to coarsening at high temperatures, pins the copper matrix grain boundaries, and slows grain boundary growth. Chromium and niobium also tend to form protective oxides beneath the copper oxide [9,10], which were formed on the outside and resulted in the noted material loss. The slight excess of chromium tends to consume excess oxygen introduced during the high temperature exposure to form more chromium oxides [10]. In addition, the EPMA indicates diffusion from the nickel alloy, evident by small amounts of nickel, iron and molybdenum.
In the nickel alloy, additional microstructural changes are noted as well. The BSE maps in Figure 11a,b shows dendritic structures form of higher density (bright) after thermal exposure. This secondary phase also exhibits nickel depletion (dark) in Figure 11e,f as well as increased chromium, niobium, and molybdenum concentrations noted in Figure 11g–l. This is indicative of the formation of Laves phase on the alloy 625 side of the boundary. Additional EDS analysis from within the secondary phase indicates that niobium, molybdenum, and chromium segregated to the interdendritic regions, and thermal exposure changed the microstructure similarly to what is seen in weld metal or castings of nickel-based superalloys as well as in past studies on DED alloy 625 [22,23,25].
Similarly to welding [23] and thermal exposures of other AM alloy 625 studies [26], the Laves phase was initially avoided during the manufacturing process, but the enrichment in the interdendritic regions led to accelerated precipitation reactions after prolonged exposure to elevated temperatures [23,26]. Additionally, silicon is controlled within alloy 625 to no more than 0.5% [39], but a silicon peak was noted in the EDS spectrum, which indicates some silicon segregation also occurred. Silicon is known to increase the stability and the kinetics for the formation of the Laves phase in nickel-based alloys [23].

4.5. Mechanical Testing

4.5.1. Tensile Testing

The results from the tensile testing in Table 3 show that the bimetallic sample performs similarly to additively manufactured GRCop-42 [12,33]. The yield and ultimate strength values were both lower for the thermally exposed samples compared to the as-built samples and both failed at the nickel alloy to copper alloy interface. On average, the yield strength of the thermally exposed samples was about 210.4 MPa, which represents an 18.6% reduction in yield strength compared to the average yield strength of 258.4 MPa for the as-built samples.
As seen in the image of the post-fracture tensile specimen (Figure 13), most or all of the strain occurred on the GRCop-42 side of the sample. Because of this, a more accurate calculation of strain would only account for the original gauge length of the copper alloy (10 mm instead of 20 mm) to isolate the strain in the copper alloy. Post-fracture measurements indicate approximately 32% elongation on the copper alloy side and only about 1% from the nickel alloy side in the as-built sample SN5, while the thermally exposed sample TE5 showed about 16% elongation in the copper alloy and less than 1% in the nickel alloy.

4.5.2. Fatigue Testing

The fatigue data are similar for the as-built and thermally exposed samples, but the thermally exposed samples show more variance in the number of cycles to failure. Of the six thermally exposed mechanical test samples, three of them failed at the interface; however, of the six as-built mechanical test samples, only one failed completely at the interface. Excluding the as-built sample SN4 due to uncertainty on the exact fatigue life and thermally exposed sample TE3 as an outlier, the average fatigue life of the thermally exposed samples was 32,379 cycles to failure, which is 41.6% shorter than the average 55,404 cycles to failure for the as-built samples. The tensile testing showed lower strength in the thermally exposed samples compared to the as-built samples, which may contribute to a reduction in the fatigue capability of the material.

4.5.3. Fatigue Fracture Analysis

Figure 15, Figure 16 and Figure 17 show the characteristics of the as-built sample SN4 (~95,000 cycles) fracture. As seen in Figure 15, the fracture occurred very far into the copper alloy, away from the interface. Figure 16 shows a 40x magnified SEM image of the fracture surface. Crack initiation can be identified at the top left of the surface, as identified in Figure 16. Figure 17 shows a 1000x magnified SEM image from the center of the fracture surface.
The as-built sample SN6 (~46,000 cycles) was the only fatigue specimen to fracture at the interface for the as-built samples. However, as seen in Figure 18, the fracture still occurred partially on the copper alloy side of the specimen. The overview (40x) SEM image in Figure 19 shows that the crack initiation occurred at the interface, but then continued to propagate increasingly into the copper alloy side. Crack initiation can be identified at the top right of the surface, as identified in Figure 19. The center from top right to bottom left slopes downwards (deeper into copper alloy), while two ridges (connection to interface) can be seen on the top and bottom of the image. Figure 20a shows a 150x magnified SEM image from the crack initiation site. Figure 20b shows EDS composition mapping for nickel, which confirms that the crack initiated at the interface.
The thermally exposed sample TE1 (~56,000 cycles) fractured on the copper alloy side of the specimen, as seen in Figure 21. The overview (40x) SEM image in Figure 22 shows that the crack initiation occurred on the left side of the specimen as identified. Figure 23 shows a 1000x-magnification SEM image from just right of center with respect to the overview in Figure 22. The image in Figure 23 demonstrates a clear dimpling on the fracture surface away from the crack tip, indicating a transition from incremental crack growth to overload failure. Figure 24 shows an increased-magnification (3000x) SEM image of the TE1 fracture surface with EDS mapping of oxygen, niobium, and chromium, which demonstrates where oxides have formed and are found on the fracture surface. In Figure 24b,c, in the two circles on the top right, some niobium oxides are identified. In Figure 24b,d in the circle on the left, there is some chromium oxide. These are similar to the oxides identified in the EPMA of the 200 and 500 h thermal exposure samples such as those seen in Figure 11 near the interface.
The thermally exposed sample TE6 (~19,000 cycles) fractured completely across the interface between the copper and nickel alloys, as seen in Figure 25. Figure 26 shows the fracture surface at 40x magnification in the SEM, where there is no clear crack initiation or crack growth pattern. Macroscopically, the fracture appears flat, but at 500x magnification in Figure 27a, various voids and plateaus can be identified on the fracture surface. Figure 27b,c show EDS mapping oxygen and chromium, respectively, which display evidence of chromium oxides on the fracture surface for the thermally exposed fatigue test sample TE6. These oxides are similar to those seen in the thermally exposed block samples observed with EPMA, identified in Figure 11h.
The oxides observed in Figure 24 and Figure 27 indicate the formation of niobium and chromium oxides, which are commonly known to form in GRCop alloys [9,10]. These oxides were not identified on the fracture surfaces of the as-built samples. The presence of oxides across the fracture surface is important to note as the specimens were tested at ambient temperature, which suggests oxygen diffusion during the thermal exposure is sufficient to penetrate through the sample thickness and likely contributes to the decreased mechanical properties.

5. Conclusions

In this paper, the additively manufactured bimetallic joint between PBF-LB copper alloy GRCop-42 and DED nickel alloy 625 was studied to investigate the effects of long-term thermal exposure at 816 °C. The as-built joint as well as various thermal exposure durations at 816 °C were examined for porosity, diffusion across the boundary, compositional analysis, oxidation effects, and mechanical properties. The as-built junction showed good fusion and reasonable porosity for the manufacturing method. Commercially available diffusion modeling software was able to provide a good approximation of behavior at the thermal exposure temperature. A machine learning-based diffusion model calculated the diffusion coefficient of copper into alloy 625 to be 2.38 × 10 12   c m 2 / s and that of nickel into GRCop-42 as 1.90 × 10 12   c m 2 / s . These models can be used to predict diffusion behavior at longer times for continual use applications.
While GRCop-42 has good oxidation resistance compared to pure copper, high-temperature thermal exposure in air results in detrimental oxidation. Keeping the material out of oxidizing environments will increase durability of the copper alloy, which is why pairing with the high-corrosion-resistance alloy 625 is desirable. At elevated temperatures, the copper alloy side of the joint exhibited significant material loss due to oxidation, resulting in a linear loss measurement of 1830 microns from the surface after a 500 h thermal exposure. After thermal exposure times of 200 h or more, chromium and niobium oxides were observed within the copper alloy as well as the Laves phase in the nickel alloy.
In mechanical testing, two of eight fatigue samples and three of four tensile samples fractured at the bimetallic joint with the remainder fracturing on the GRCop-42 side. The thermally exposed (816 °C for 200 h) samples all had lower strength than the as-built samples. On average, the thermally exposed samples exhibited an 18.6% reduction in yield strength compared to the as-built samples. Additionally, the fatigue lives for the thermally exposed samples were more scattered than the as-built samples, and the samples with the two lowest fatigue lives were both thermally exposed samples. Excluding the as-built sample SN4 due to the uncertainty in the exact fatigue life and thermally exposed sample TE3 as an outlier, the fatigue life of the thermally exposed samples is an average of 41.6% shorter than that of the as-built samples. SEM and EDS of the thermally exposed fatigue samples showed evidence of some oxides in the copper alloy present on the fracture surface and throughout the volume of the copper alloy, which contribute to the reduction in mechanical properties. Although potentially detrimental secondary phases were identified in alloy 625, there was no effect seen in mechanical testing due to the GRCop-42 and the joint itself being comparatively weaker.

Author Contributions

Conceptualization, A.R. and A.W.; methodology, A.R. and A.W.; software, A.R. and A.W.; validation, A.R. and A.W.; formal analysis, A.R.; investigation, A.R.; resources, A.W.; data curation, A.R.; writing—original draft preparation, A.R.; writing—review and editing, A.R. and A.W.; visualization, A.R.; supervision, A.W.; project administration, A.W. All authors have read and agreed to the published version of the manuscript.

Funding

This research received no external funding.

Data Availability Statement

The original data presented in the study are openly available in Mendeley Data at doi: 10.17632/h2dsmmbpyx.1, 10.17632/f5z637tp8y.1, and 10.17632/cs2szwmbcp.1.

Acknowledgments

The Kuiper Arizona Laboratory for Astromaterials Analysis was used for the electron microprobe analysis.

Conflicts of Interest

The authors declare no conflicts of interest.

References

  1. Hofmann, D.C.; Roberts, S.; Otis, R.; Kolodziejska, J.; Dillon, R.P.; Suh, J.-O.; Shapiro, A.A.; Liu, Z.-K.; Borgonia, J.-P. Developing Gradient Metal Alloys through Radial Deposition Additive Manufacturing. Sci. Rep. 2014, 4, 5357. [Google Scholar] [CrossRef] [PubMed]
  2. Sahasrabudhe, H.; Bose, S.; Bandyopadhyay, A. Laser processed calcium phosphate reinforced CoCrMo for load-bearing applications: Processing and wear induced damage evaluation. Acta Biomater. 2018, 66, 118–128. [Google Scholar] [CrossRef] [PubMed]
  3. Sing, S.; Tey, C.; Tan, J.; Huang, S.; Yeong, W.Y. 3D printing of metals in rapid prototyping of biomaterials: Techniques in additive manufacturing. In Rapid Prototyping of Biomaterials; Elsevier Ltd.: Amsterdam, The Netherlands, 2020; Chapter 2; pp. 17–40. [Google Scholar]
  4. Zheng, R.; Cui, J.; Yang, Y.; Li, S.; Misra, R.; Kondoh, K.; Zhu, Q.; Lu, Y.; Li, X. Enhanced densification of copper during laser powder bed fusion through powder surface alloying. J. Mech. Work. Technol. 2022, 305, 117575. [Google Scholar] [CrossRef]
  5. Ellis, D.L. Conductivity of GRCop-42 Alloy Enhanced; NASA Research & Technology: Washington, DC, USA, 2005. [Google Scholar]
  6. Gradl, P.R.; Protz, C.S.; Cooper, K.; Ellis, D.; Evans, L.J.; Garcia, C. GRCop-42 Development and Hot-fire Testing Using Additive Manufacturing Powder Bed Fusion for Channel Cooled Combustion Chambers. In Proceedings of the 55th American Institute of Aeronautics and Astronautics Joint Propulsion Conference, Indianapolis, IN, USA, 19–22 August 2019. AIAA-2019-4228. [Google Scholar]
  7. Onuike, B.; Bandyopadhyay, A. Bond Strength Measurement for Additively Manufactured Inconel 718-GRCop84 Copper Alloy Bimetallic Joints. Addit. Manuf. 2019, 27, 576–585. [Google Scholar] [CrossRef]
  8. Scannapieco, D.S.; Lewandowski, J.J.; Rogers, R.B.; Ellis, D.L. In-Situ Alloying of GRCop-42 via Additive Manufacturing: Precipitate Analysis. In Scientific and Technical Information Program; NASA: Washington, DC, USA, 2020. [Google Scholar]
  9. Ellis, D.L. GRCop-84: A High-Temperature Copper Alloy for High-Heat-Flux Applications. In Scientific and Technical Information Program; NASA: Washington, DC, USA, 2005. [Google Scholar]
  10. Thomas-Ogbuji, L.U. Oxidation Behavior of GRCop-84 Copper Alloy Assessed; NASA: Washington, DC, USA, 2005. [Google Scholar]
  11. Souther, M. Microstructural Transformation of Cold-Sprayed GRCop-42 for Rocket Engine Combustion Chamber Liners. Bachelor’s Thesis, California Polytechnic University, San Luis Obispo, CA, USA, 2019. [Google Scholar]
  12. Minneci, R.P.; Lass, E.A.; Bunn, J.R.; Choo, H.; Rawn, C.J. Copper-based alloys for structural high-heat-flux applications: A review of development, properties, and performance of Cu-rich Cu-Cr-Nb alloys. Int. Mater. Rev. 2020, 66, 394–425. [Google Scholar] [CrossRef]
  13. Gradl, P.R.; Protz, C.S.; Zagorski, K.; Doshi, V.; McCallum, H. Additive Manufacturing and Hot-fire Testing of Bimetallic GRCop-84 and C-18150 Channel-Cooled Combustion Chambers using Powder Bed Fusion and Inconel 625 Hybrid Directed Energy Deposition. In Proceedings of the 55th American Institue of Aeronautics and Astronautics Joint Propulsion Conference, Indianapolis, IN, USA, 19–22 August 2019. AIAA-2019-4390. [Google Scholar]
  14. Zhang, C.; Shirzadi, A.A. Diffusion bonding of copper alloy to nickel-based superalloy: Effect of heat treatment on the microstructure and mechanical properties of the joints. Sci. Technol. Weld. Join. 2021, 26, 213–219. [Google Scholar] [CrossRef]
  15. ASTM B446-19; Standard Specification for Nickel-Chromium-Molybdenum-Columbium Alloy (UNS N06625), Nickel-Chromium-Molybdenum-Silicon Alloy (UNS N06219), and Nickel-Chromium-Molybdenum-Tungsten Alloy (UNS N06650) Rod and Bar. ASTM International: West Conshohocken, PA, USA, 2019.
  16. AMS5599E; Nickel Alloy, Corrosion and Heat-Resistant, Sheet, Strip, and Plate 62Ni-21.5Cr-9.0Mo-3.7Cb(Nb) Annealed. SAE International: Warrendale, PA, USA, 2016.
  17. Eiselstein, H.; Tillack, D. The Invention and Definition of Alloy 625; The Minerals, Metals & Materials Society: Pittsburgh, PA, USA, 1991. [Google Scholar]
  18. Gupta, R.; Kumar, V.A.; Gururaja, U.; Shivaram, B.; Prasad, Y.M.; Ramkumar, P.; Chakravarthi, K.; Sarkar, P. Processing and Characterization of Inconel 625 Nickel base Superalloy. In Materials Science Forum; Trans Tech Publications Ltd.: Stafa-Zurich, Switzerland, 2015; Volume 830–831, pp. 38–40. [Google Scholar] [CrossRef]
  19. Floreen, S.; Fuchs, G.E.; Yang, W.J. The Metallurgy of Alloy 625; The Minerals, Metals & Materials Society: Pittsburgh, PA, USA, 1994. [Google Scholar]
  20. Shankar, V.; Valsan, M.; Rao, K.B.S.; Mannan, S.L. Effects of Temperature and Strain Rate on Tensile Properties and Activation Energy for Dynamic Strain Aging in Alloy 625. Met. Mater. Trans. A 2004, 35, 3129–3139. [Google Scholar] [CrossRef]
  21. Suave, L.M.; Cormier, J.; Villechaise, P.; Soula, A.; Hervier, Z.; Bertheau, D.; Laigo, J. Microstructural evolutions during thermal aging of Alloy 625: Impact of temperature and forming process. Met. Mater. Trans. A 2014, 45, 2963–2982. [Google Scholar] [CrossRef]
  22. Silva, C.C.; de Miranda, H.C.; Motta, M.F.; Farias, J.P.; Afonso, C.R.M.; Ramirez, A.J. New insight on the solidification path of an alloy 625 weld overlay. J. Mater. Res. Technol. 2013, 2, 228–237. [Google Scholar] [CrossRef]
  23. Lingenfelter, A. Welding of Inconel Alloy 718: A Historical Overview; The Minerals, Metals & Materials Society: Pittsburgh, PA, USA, 1989. [Google Scholar]
  24. Singhal, T.S.; Jain, J.K.; Kumar, M.; Bhojak, V.; Saxena, K.K.; Buddhi, D.; Prakash, C. A comprehensive comparative review: Welding and additive manufacturing. Int. J. Interact. Des. Manuf. 2023, 18, 1829–1843. [Google Scholar] [CrossRef]
  25. Hu, Y.; Lin, X.; Li, Y.; Zhang, S.; Zhang, Q.; Chen, W.; Li, W.; Huang, W. IInfluence of heat treatments on the microstructure and mechanical properties of Inconel 625 fabricated by directed energy deposition. Mater. Sci. Eng. A 2021, 817, 141309. [Google Scholar] [CrossRef]
  26. Dubiel, B.; Gola, K.; Staroń, S.; Pasiowiec, H.; Indyka, P.; Gajewska, M.; Zubko, M.; Kalemba-Rec, I.; Moskalewicz, T.; Kąc, S. Effect of high temperature annealing on the microstructure evolution and hardness behavior of the Inconel 625 superalloy additively manufactured by laser powder bed fusion. Arch. Civ. Mech. Eng. 2023, 23, 249. [Google Scholar] [CrossRef]
  27. Saple, J.; Ahmadi, B.; Shaeri, M.R.; Bigham, S. Experimental study of a 3D-printed wick condenser for enhanced condensation heat transfer. In Proceedings of the 2024 23rd IEEE Intersociety Conference on Thermal and Thermomechanical Phenomena in Electronic Systems (ITherm), Aurora, CO, USA, 28–31 May 2024; Volume 23. [Google Scholar] [CrossRef]
  28. Steeves, C.A.; He, M.Y.; Kasen, S.D.; Valdevit, L.; Wadley, H.N.G.; Evans, A.G. Feasibility of Metallic Structural Heat Pipes as Sharp Leading Edges for Hypersonic Vehicles. J. Appl. Mech. 2009, 76, 031014. [Google Scholar] [CrossRef]
  29. Onuike, B.; Heer, B.; Bandyopadhyay, A. Additive manufacturing of Inconel 718—Copper alloy bimetallic structure using laser engineered net shaping (LENS). Addit. Manuf. 2018, 21, 133–140. [Google Scholar] [CrossRef]
  30. Pérez-Álvarez, R.; Montoya, A.; López-Puente, J.; Santana, D. Solar pwer tower plants with Bimetallic receiver tubes: A thermomechanical study of two- and three- layer composite tubes configurations. Energy 2023, 283, 129170. [Google Scholar] [CrossRef]
  31. Llovet, X. Electron Probe Microanalysis. In Encyclopedia of Analytical Science, 3rd ed.; Universitat de Barcelona: Barcelona, Spain; Elsevier Ltd.: Amsterdam, The Netherlands, 2019; Sec. Microscopy; Volume 7, pp. 30–38. [Google Scholar]
  32. Taylor, N.; Heath, J. Electron Probe Microanalysis, 1st ed.; (Microscopy, Spectroscopy and Separations EKB); John Wiley & Sons: Chichester, UK, 2015. [Google Scholar]
  33. Demeneghi, G.; Barnes, B.; Gradl, P.; Mayeur, J.R.; Hazeli, K. Size effects on microstructure and mechanical properties of additively manufactured copper-chromium-niobium alloy. Mater. Sci. Eng. A 2021, 820, 141511. [Google Scholar] [CrossRef]
  34. Kim, M.J.; Saldana, C. Thin wall deposition of IN625 using directed energy deposition. In Proceedings of the 48th SME North American Manufacturing Research Conference, Cincinnati, OH, USA, 22–26 June 2020; Available online: www.sciencedirect.com (accessed on 17 January 2024).
  35. Wang, F.; Del Bosque, H.; Hyder, J.; Corliss, M.; Hung, W.N. Experimental investigation of porosity distribution in selective laser melted Inconel 718. Procedia Manuf. 2020, 48, 807–813. [Google Scholar] [CrossRef]
  36. Poirier, D.R.; Geiger, G.H. Transport Phenomena in Materials Processing; The Minerals, Metals & Materials Series; Springer Nature: Berlin/Heidelberg, Germany, 1994. [Google Scholar]
  37. Taguchi, O.; Iijima, Y.; Hirano, K.-I. Application of Atomic Absorption Analysis to Impurity Diffusion of Copper in Nickel in a Wide Range of Temperature. J. Jpn. Inst. Met. Mater. 1984, 48, 20–24. [Google Scholar] [CrossRef]
  38. Wu, H.; Mayeshiba, T.; Morgan, D. High-throughput ab-initio dilute solute diffusion database. Sci. Data 2016, 3, 160054. [Google Scholar] [CrossRef]
  39. INCONEL ® Alloy 625. 2013. Available online: www.specialmetals.com (accessed on 3 October 2022).
Figure 1. As-received sample—A625 on GRCop-42—with perpendicular cut locations marked.
Jmmp 09 00034 g001
Figure 2. The 50 h thermal exposure sample (a) ~2 weeks after initial sample prep and (b) re-polished.
Jmmp 09 00034 g002
Figure 3. Bimetallic mechanical test bar for tensile and fatigue testing.
Jmmp 09 00034 g003
Figure 4. Location 3 overview in optical microscopy at 50× magnification; scale bar is 1000 μ m .
Jmmp 09 00034 g004
Figure 5. Optical micrograph (50×) of transverse cut (1–2) overview. The scale bar is 1000 μ m .
Jmmp 09 00034 g005
Figure 6. Initial composition of as-built sample 1 in three locations relative to the boundary (log scale).
Jmmp 09 00034 g006
Figure 7. A 500-micron EPMA line scan of the as-built sample 3 across the boundary.
Jmmp 09 00034 g007
Figure 8. Optical microscope images of (a) 50, (b) 100, (c) 200, and (d) 500 h thermally exposed samples.
Jmmp 09 00034 g008
Figure 9. Linear material loss measurements in Cu for 200 h thermally exposed sample.
Jmmp 09 00034 g009
Figure 10. Comparison data for the thermally exposed samples in (a) copper and (b) nickel.
Jmmp 09 00034 g010
Figure 11. Mapping for the as-built sample and the 816 °C/500 h thermal exposure sample at the bondline. All images are oriented with copper alloy on top and nickel alloy on bottom: (a) BSE map as-built, (b) BSE map thermal exposure, (c) copper map as-built, (d) copper map thermal exposure, (e) nickel map as-built, (f) nickel map thermal exposure, (g) chromium map as-built, (h) chromium map thermal exposure, (i) niobium map as-built, (j) niobium map thermal exposure, (k) molybdenum map as-built, (l) molybdenum map thermal exposure.
Jmmp 09 00034 g011aJmmp 09 00034 g011bJmmp 09 00034 g011cJmmp 09 00034 g011dJmmp 09 00034 g011eJmmp 09 00034 g011f
Figure 12. Tensile test data from as-built sample SN5.
Jmmp 09 00034 g012
Figure 13. As-built sample SN5 before and after tensile test.
Jmmp 09 00034 g013
Figure 14. Fatigue data comparison with wrought GRCop-42 data from Gradl [6].
Jmmp 09 00034 g014
Figure 15. As-built fatigue specimen SN4.
Jmmp 09 00034 g015
Figure 16. As-built SN4 fatigue fracture surface SEM overview (40×).
Jmmp 09 00034 g016
Figure 17. As-built SN4 fatigue fracture surface SEM 1000× magnification.
Jmmp 09 00034 g017
Figure 18. As-built fatigue specimen SN6.
Jmmp 09 00034 g018
Figure 19. As-built SN6 fatigue fracture surface SEM overview (40×).
Jmmp 09 00034 g019
Figure 20. As-built SN6 fatigue fracture crack initiation site (150×) (a) SEM image, (b) EDS nickel map, indicating crack initiation on the boundary.
Jmmp 09 00034 g020
Figure 21. Thermally exposed fatigue specimen TE1.
Jmmp 09 00034 g021
Figure 22. Thermally exposed TE1 fatigue fracture surface SEM overview (40×).
Jmmp 09 00034 g022
Figure 23. Thermally exposed TE1 fatigue fracture surface SEM 1000×.
Jmmp 09 00034 g023
Figure 24. Thermally exposed sample TE1 fatigue fracture surface 3000× (a) SEM image, and EDS maps of (b) oxygen and (c) niobium and (d) chromium. The red circles in (b,d) indicate oxides on the fracture surface. Niobium oxide is identified in the top right of (b,c) and chromium oxide on the left in (b,d).
Jmmp 09 00034 g024
Figure 25. Thermally exposed fatigue specimen TE6.
Jmmp 09 00034 g025
Figure 26. Thermally exposed TE6 fatigue fracture surface SEM overview (40×).
Jmmp 09 00034 g026
Figure 27. Thermally exposed sample TE6 fatigue fracture surface 500× (a) SEM image and EDS maps of (b) oxygen and (c) chromium.
Jmmp 09 00034 g027
Figure 28. The averages from the one-sided material loss measurements in the copper alloy are plotted. The curve of best fit is proportional to the square root of thermal exposure time as shown.
Jmmp 09 00034 g028
Figure 29. Pymc3-calculated diffusion curves with recorded data after 50 h at 816 °C.
Jmmp 09 00034 g029
Figure 30. Pandat predicted and actual diffusion curves for nickel after 50 h at 816 °C.
Jmmp 09 00034 g030
Table 1. Composition definitions in percentages by weight of alloy 625 (UNS N06625) [16].
ElementMinimumMaximum
Carbon-0.10
Manganese-0.50
Silicon-0.50
Phosphorus-0.015
Sulfur-0.015
Chromium20.0023.00
Molybdenum8.0010.00
Niobium3.154.15
Iron-5.00
Cobalt-1.00
Titanium-0.40
Aluminum-0.40
NickelRemainder
Table 2. Linear material loss measurements in copper alloy for each exposure time.
Exposure Time (816 °C) Copper   Loss Side   1   ( μ m ) Copper   Loss Side   2   ( μ m ) Copper   Loss Average   ( μ m )
50 h383470426.5
100 h764690727
200 h107510131044
500 h171019421826
Table 3. Results from the tensile testing of bimetallic test bars with and without thermal exposure.
Tensile Test ResultsThermal Exposure 816 °C/200 hAs-Built SamplesLiterature [12,33]
Sample NumberTE2TE5SN1SN5Range As-Built
Elastic Modulus (MPa)39,68244,14450,88744,93252,000–84,500
Yield Strength (MPa)212.87208.00242.81273.92173–305
Max/Ultimate Strength (MPa)339.16342.22363.93357.58355–495
Break LocationInterfaceInterfaceInterfaceCopperCopper only
Table 4. Results of fatigue testing for the as-built sample set.
As-Built Samples
Sample SN2SN3SN4SN6
Cycles to Failure45,93571,61555,984–95,000 *48,663
Fracture LocationCopperCopperCopperInterface/Copper
* Due to a controller error during the testing of SN4, the count ended at 55,984, although the sample was not broken yet. Based on the testing speed (20 Hz) and the time of fracture, the actual number of cycles to failure could be up to 95,000.
Table 5. Results of fatigue testing for the thermally exposed sample set.
Thermally Exposed (816 °C/200 h) Samples
Sample TE1TE3TE4TE6
Cycles to Failure55,507164,58023,11118,519
Fracture LocationCopperCopperCopperInterface
Disclaimer/Publisher’s Note: The statements, opinions and data contained in all publications are solely those of the individual author(s) and contributor(s) and not of MDPI and/or the editor(s). MDPI and/or the editor(s) disclaim responsibility for any injury to people or property resulting from any ideas, methods, instructions or products referred to in the content.

