Article

Neural Network Optimization of Mechanical Properties of ABS-like Photopolymer Utilizing Stereolithography (SLA) 3D Printing

by
Abdulkader Ali Abdulkader Kadauw
Mechanical and Mechatronic Engineering Department, College of Engineering, Salahadin University-Erbil, Erbil 44001, Iraq
J. Manuf. Mater. Process. 2025, 9(4), 116; https://doi.org/10.3390/jmmp9040116
Submission received: 4 February 2025 / Revised: 13 March 2025 / Accepted: 28 March 2025 / Published: 3 April 2025
(This article belongs to the Special Issue Recent Advances in Optimization of Additive Manufacturing Processes)

Abstract

:
The optimization of mechanical properties in acrylonitrile butadiene styrene-like (ABS-like) photopolymer utilizing neural network techniques presents a promising methodology for enhancing the performance and strength of components fabricated through stereolithography (SLA) 3D printing. This approach uses machine learning algorithms to analyze and predict the relationships between various printing parameters and the resulting mechanical properties, thereby allowing the engineering of better materials specifically designed for targeted applications. Artificial neural networks (ANNs) can model complex, nonlinear relationships between process parameters and material properties better than traditional methods. This research constructed four ANN models to predict critical mechanical properties, such as tensile strength, yield strength, shore D hardness, and surface roughness, based on SLA 3D printer parameters. The parameters used were orientation, lifting speed, lifting distance, and exposure time. The constructed models showed good predictive capabilities, with correlation coefficients of 0.98798 for tensile strength, 0.9879 for yield strength, 0.9823 for Shore D hardness, and 0.98689 for surface roughness. These high correlation values revealed the effectiveness of ANNs in capturing the intricate dependencies within the SLA process. Also, multi-objective optimization was conducted using these models to find the SLA printer’s optimum parameter combination to achieve optimal mechanical properties. The optimization results showed that the best combination is Edge orientation, lifting speed of 90.6962 mm/min, lifting distance of 4.8483 mm, and exposure time of 4.8152 s, resulting in a tensile strength of 40.4479 MPa, yield strength of 32.2998 MPa, Shore D hardness of 66.4146, and Ra roughness of 0.8994. This study highlights the scientific novelty of applying ANN to SLA 3D printing, offering a robust framework for enhancing mechanical strength and dimensional accuracy, thus marking a significant benefit of using ANN tools rather than traditional methods.

1. Introduction

Stereolithography (SLA) is an additive manufacturing method that solidifies layers of photosensitive resin using UV light. Commercial SLA printers link the UV curing with the build platform’s movement, affecting resin flow and increasing mechanical force [1,2]. While SLA can process various materials, acrylonitrile butadiene styrene (ABS) needs chemical modification for use. Despite efforts to improve quality, SLA printers often show variability in repeatability, even among devices from the same manufacturer [3]. SLA is noted for precision and intricate geometry production with excellent surface finishes, making it ideal for detailed applications. It minimizes material waste, operates efficiently, and supports diverse resins, creating parts with strong mechanical properties. SLA excels in rapid prototyping, reducing warping and shrinkage, and is favored for cost-effective small batch and custom manufacturing.
Neural networks can be used to refine the mechanical properties of acrylonitrile butadiene styrene (ABS) printed by SLA 3D printers to signify a vibrant and promising domain of inquiry. Technological progress, computer-aided design, and computer-aided manufacturing (CAD/CAM) have remarkably advanced manufacturing methodologies across different sectors, improving efficiency and productivity [4]. Three-dimensional printing, or additive manufacturing, has attracted considerable attention due to its innovative capabilities and transformative impacts on industrial practices [5,6,7]. This revolutionary technique gives the capacity to fabricate physical components directly from digital 3D models, utilizing an array of materials throughout the procedure [8]. The industrial applications of 3D printing, particularly within engineering frameworks, are extensive, including component development, simulation, and production [9].
A promising way to overcome those problems and avoid costly extensive production is to implement artificial neural networks (ANNs). Although a few researchers in material development have utilized them, there is a need for more detailed studies. ANNs are trained on a network of nodes interconnected by weighted links. Each node is a nonlinear function that learns to recognize certain input features by adjusting the weights of the inputs through either supervised or unsupervised training [10]. The coefficients of all weights during the learning process are stored in the network, making it possible to infer and predict features of neighboring and complex elements [11].
Many types of neural network architecture exist, such as feedforward neural networks (FNNs), convolutional neural networks (CNNs), and Bayesian neural networks. They are tailored to specific applications. The FNNs are called general-purpose networks, suitable for various applications such as regression, classification, and function approximation. They are more straightforward in their structure and implementation than the other methods. They can be trained using a small amount of data. The CNNs work with grid data, which makes them suitable for feature extraction from images and computer vision. These networks have convolutional layers and pooling operations, requiring a large amount of data to be trained. The BNNs work with the uncertainty of prediction, which is crucial in medical diagnostics. They are more complex due to the incorporation of probabilistic reasoning. Their training is computationally expensive. To model the relationship between the SLA 3D printer parameters and mechanical properties, the best ANN architecture is a feedforward neural network (FNN).
Among these methods, stereolithography (SLA) is a leading additive manufacturing technology known for producing high-quality 3D components with exceptionally smooth finishes, paving the way for other patented 3D printing methodologies that emerged in the late 1980s [12]. These innovations give the ability to develop complex geometries, including medical components and implantable parts, highlighting the versatility of SLA technology [13]. A recently introduced experimental design methodology focuses on the materials and structural optimization of SLA 3D prints subjected to tensile loads. This methodology integrates artificial neural networks (ANN) for predicting mechanical properties, as documented in studies [14,15]. They designed a three-layer ANN to accurately forecast the maximum tensile strength of 3D-printed specimens created from biocompatible resin. A Taguchi orthogonal array-based system was utilized to design the experiments [16,17,18,19,20].
Neural network optimization algorithms effectively predict and enhance ABS parts’ tensile strength, flexural, and impact strength by optimizing process parameters in the fused filament fabrication (FFF) additive manufacturing method [15]. This leads to applying neural networks to optimize ABS mechanical properties for parts printed using SLA. The tensile strength can be improved by adjusting SLA printer parameters like laser power, layer thickness, and post-curing time. Some research reported that increasing laser power and reducing layer thickness enhance tensile strength and Young’s modulus, although they may reduce material toughness [16,17]. The printing orientation can affect both tensile strengths, and a higher response can be achieved with vertical orientations than horizontal orientations. Employing genetic algorithms and regression analysis of these parameters achieves significant improvements in mechanical properties [18,19]. Also, some research considered the application of artificial neural networks in predicting the wear properties of recycled ABS parts, further demonstrating these algorithms’ potential in optimizing 3D-printing processes [20,21]. Integrating neural network algorithms and other optimization methods provides a robust framework for enhancing the mechanical properties of ABS in SLA 3D printing, offering valuable insights for future research and industrial applications [22].
Some strategies were conducted to use deep learning to enhance SLA 3D printing process products, which leads to an improvement in the mechanical properties of the printed parts subjected to flexural loads while also deepening insights into the properties and behaviors of SLA resins [21,22,23]. The AM techniques (SLA, selective laser sintering (SLS), and fused filament fabrication (FFF)) gained focus due to their capability to produce complex geometries that cannot be made by conventional methods [24,25]. SLA technology is the earliest established method in this domain, celebrated for its ability to produce fine details and widely used in various industries [26,27].
The SLA is limited in its use in scientific research and educational institutions because of its high costs. Artificial neural networks (ANNs) are used to analyze the impact of various SLA parameters on ABS materials, focusing on size, layer thickness, XY resolution, and exposure time [28]. Their results significantly improved the SLA products. Using ANNs, researchers can make data-driven decisions about essential printing parameters to achieve specific mechanical properties. Integrating ANNs into research introduces a methodical approach to understanding the complex relationships between different printing parameters and the mechanical properties of ABS-like materials in SLA 3D printing. The noticeable trend toward adopting 3D-printing technology has accelerated, influenced by material costs, effective cost-control strategies, and increasing environmental concerns. The implications of this advanced technology will extend across industries where 3D-printed components are progressively replacing conventional manufacturing methods [29,30].
According to Agron [30], artificial neural networks (ANN) were employed to optimize the mechanical properties of stereolithography (SLA) products, consequently enhancing the accuracy of components produced through this method. A multi-layer perceptron network was constructed to approximate the dimensional errors in SLA-printed parts. The Taguchi experimental design was applied for systematic data collection [31]. This methodology provides a comprehensive assessment of how various parameters influence the accuracy of these parts. The relationship between dimensional accuracy and printing parameters involves shrinkage and deformation during and post-printing. This relationship is nonlinear; this makes the neural networks a powerful tool to model this complex relationship [29].
Enhancing the dimensional and mechanical properties of acrylonitrile butadiene styrene (ABS) using advanced 3D-printing technologies reveals several critical gaps that must be addressed, particularly in achieving the best settings for ABS in stereolithography (SLA) 3D printing. While efforts have been made to optimize quality and precision, the high variability in repeatability among SLA printers, even those from the same manufacturer, remains challenging. In addition, the need to chemically modify ABS for SLA and the influence of various printing orientations are areas that require further exploration. Furthermore, the impact of post-curing processes on the tensile strength and dimensional accuracy of ABS parts needs comprehensive investigation. This paper aims to bridge these gaps by utilizing neural network models to optimize process parameters and improve mechanical properties. Also, this research will provide a detailed methodology that enhances the performance and applicability of ABS in various industrial sectors.

2. Materials and Methods
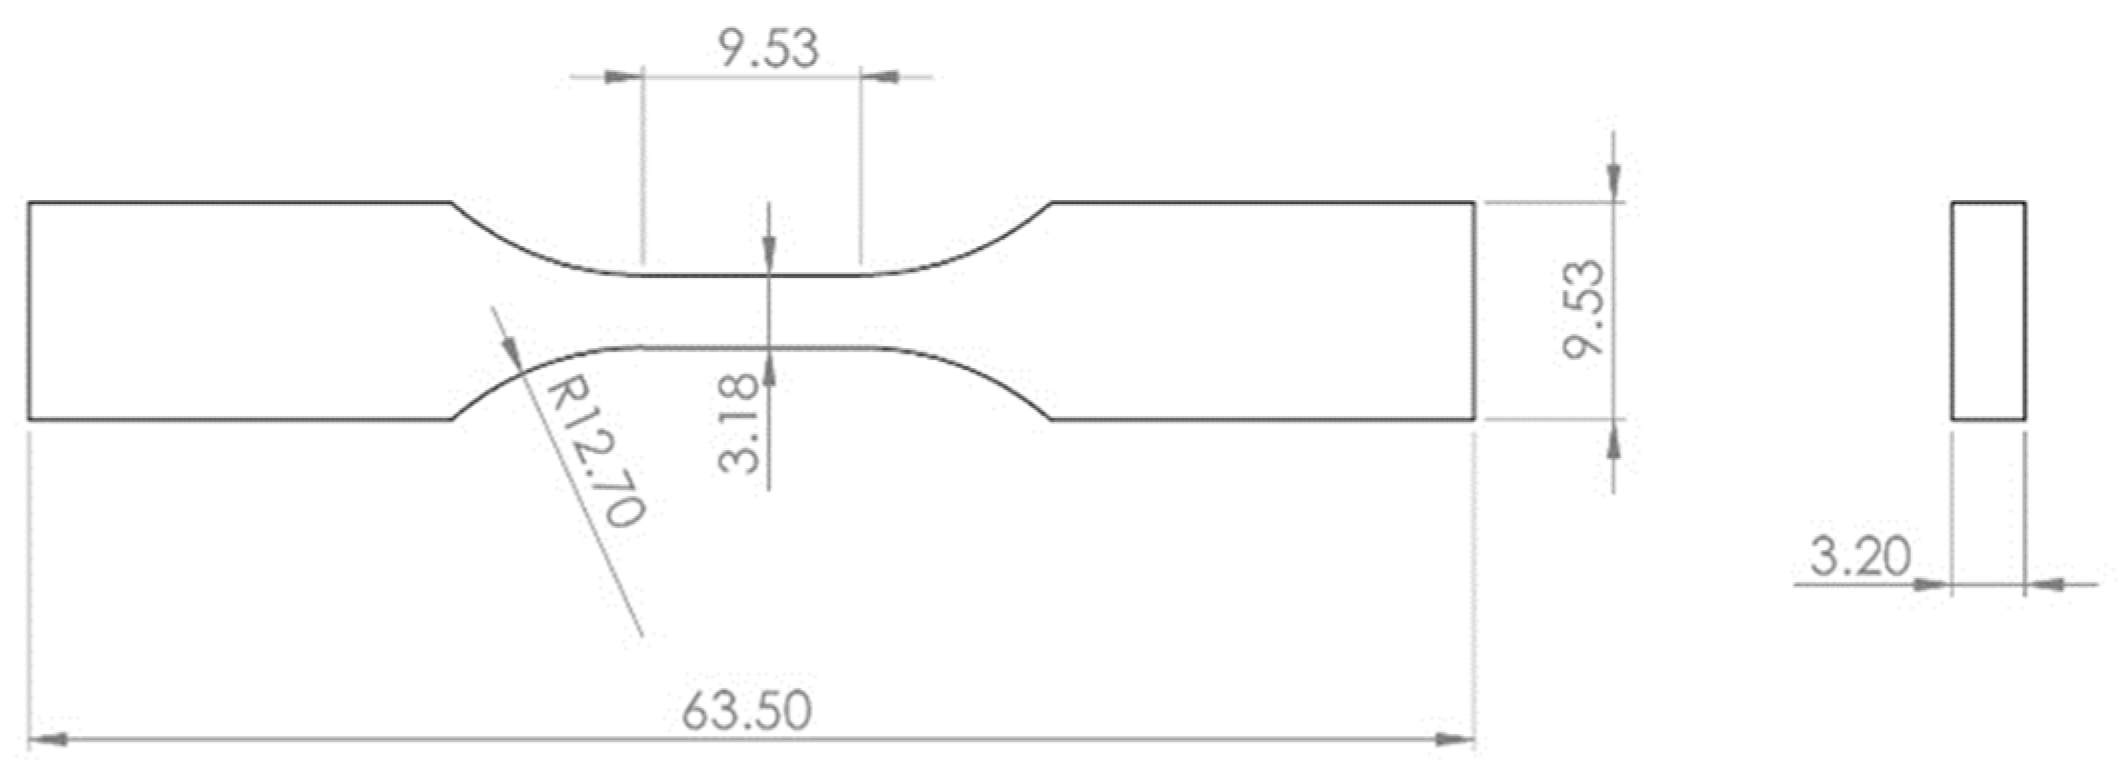
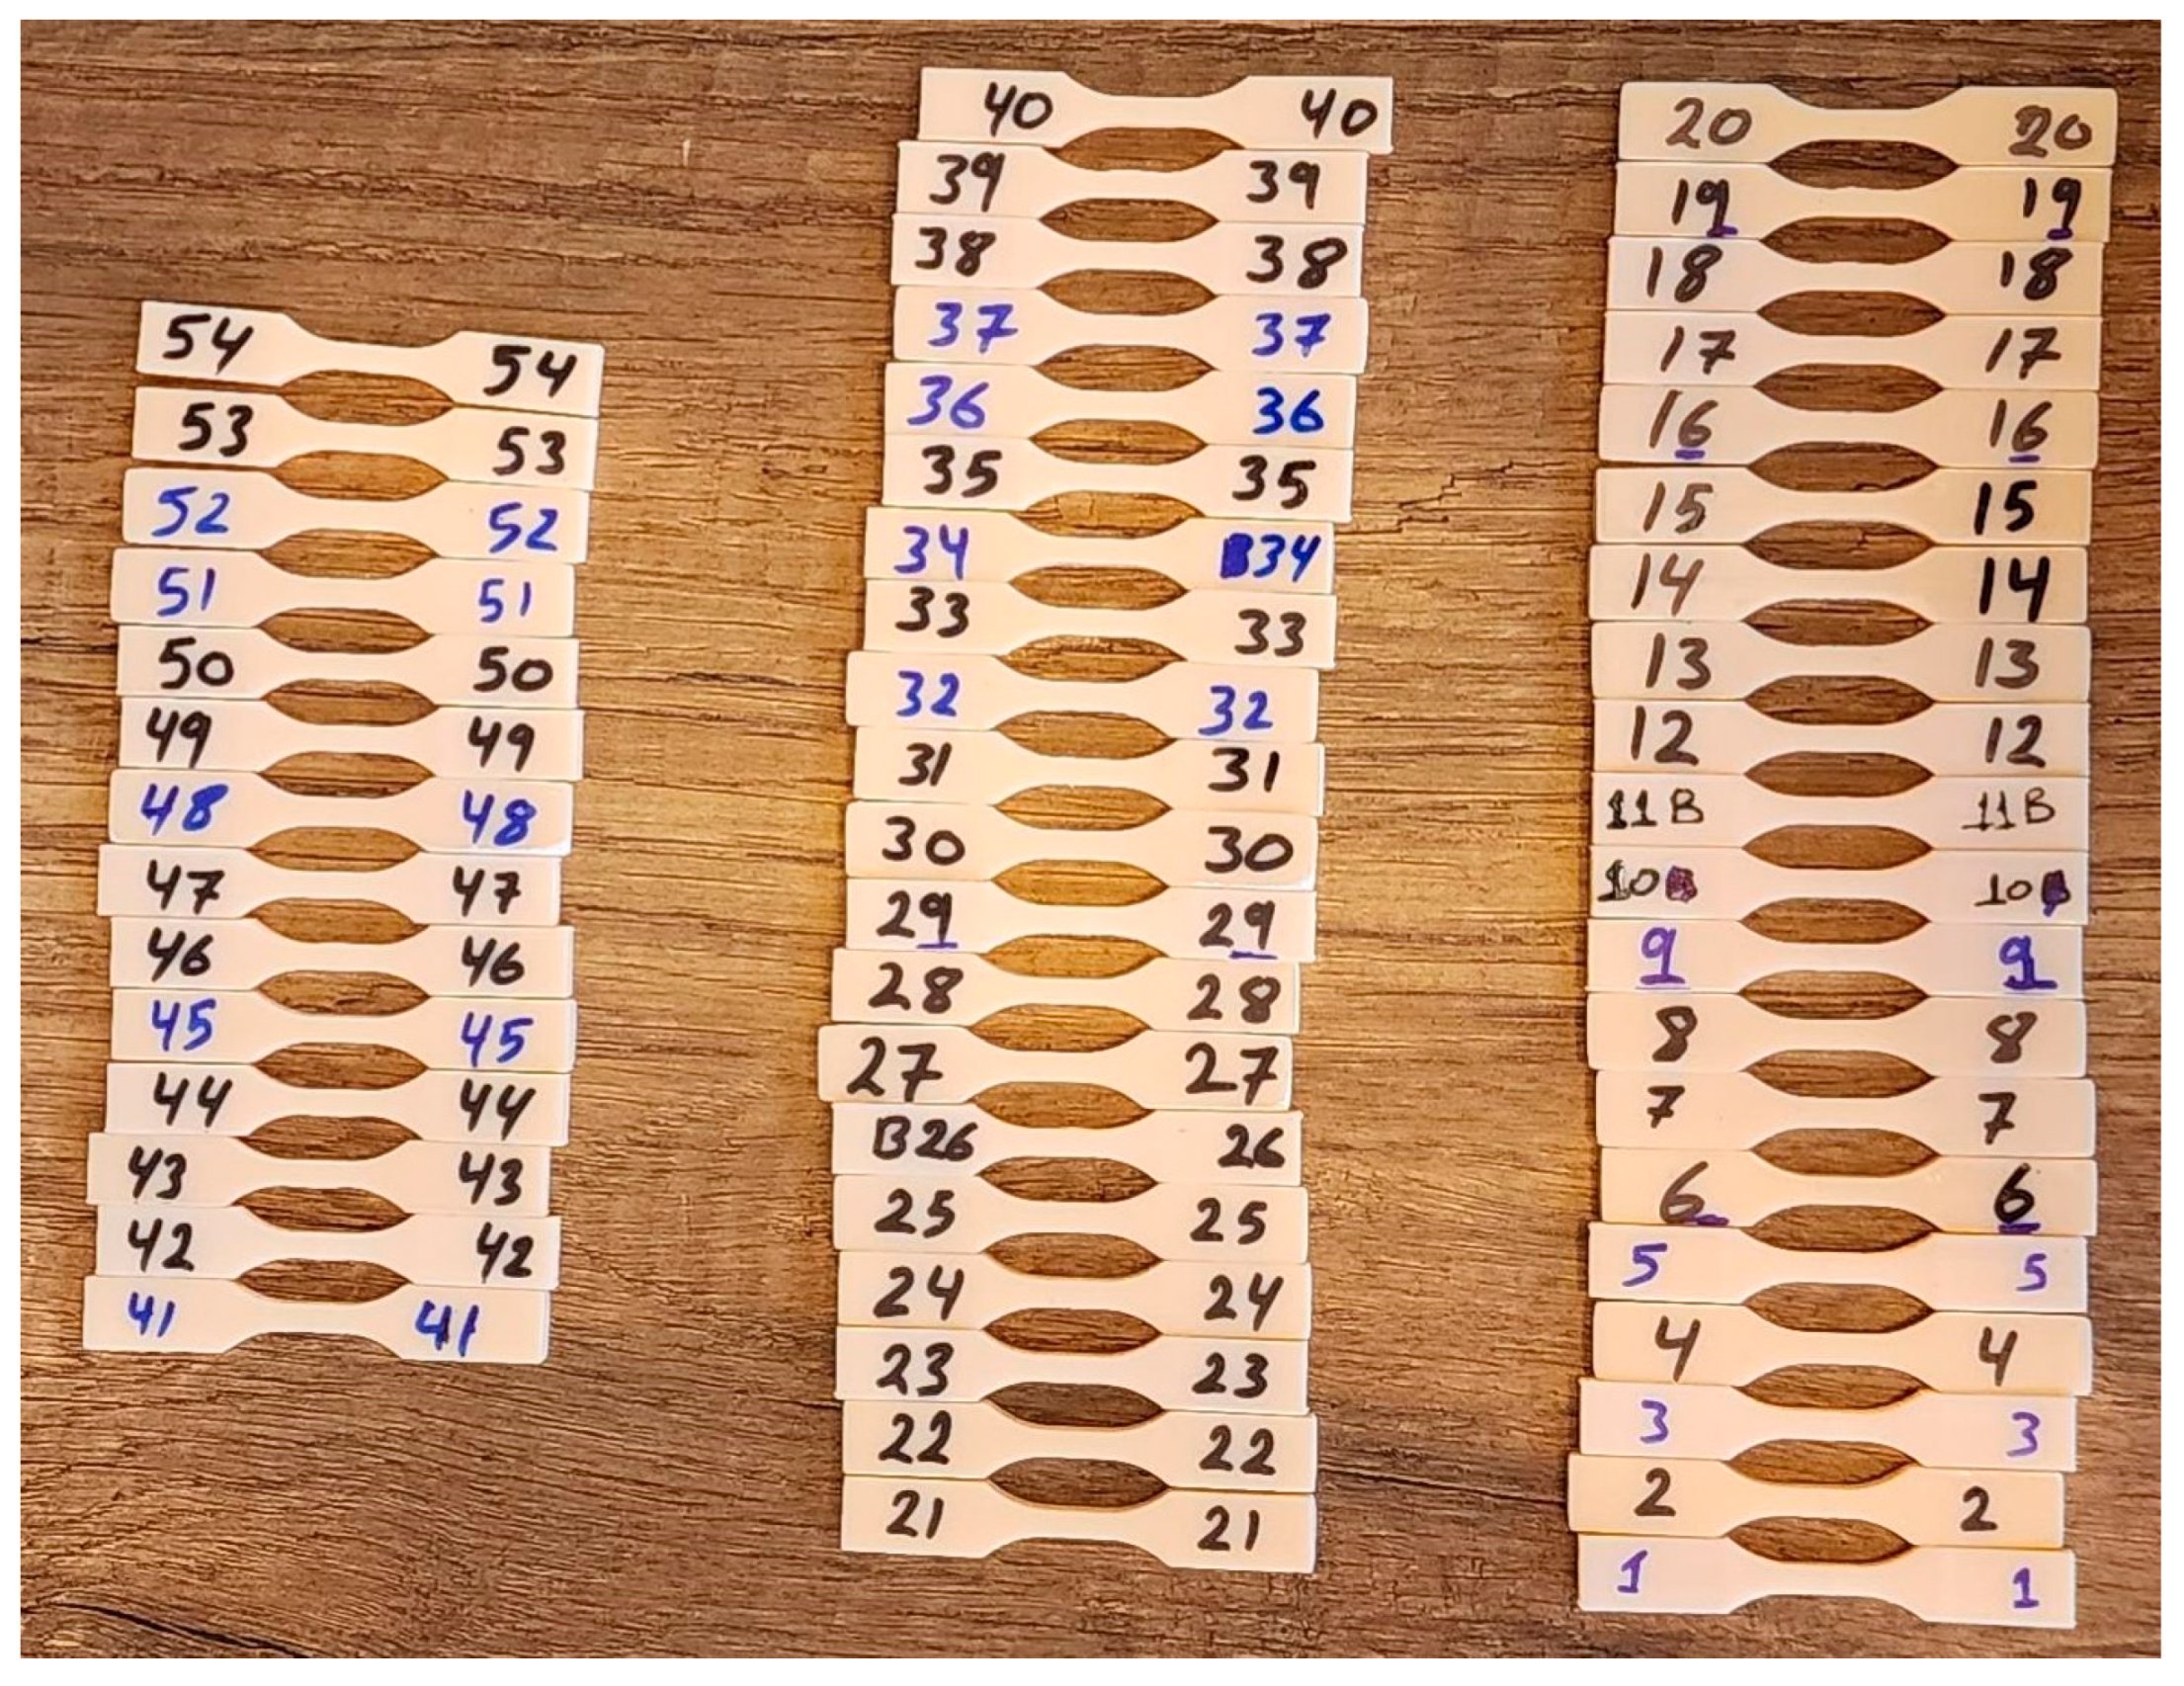
This section explains the method employed to design the experiments. It also describes the testing conducted to evaluate the mechanical properties of ABS-like photopolymer after post-curing. The samples and their mechanical properties were used to train neural network models.

2.1. Test Specimens

This work employed ASTM D-638-yr, Type V [2], tensile specimens; the dimensions are shown in Figure 1. This tensile specimen geometry was used to measure the tensile properties, Shore D hardness, and roughness of the 3D printed samples. SolidWorks-Education-2019-2020 was used to model the test specimens. The models were then sent to a slicer, and a G-code was generated for the SLA 3D printer. Fifty-four sets of tensile samples were manufactured with an SLA 3D printer using different parameter combinations. Post-curing treatments were applied to enhance their mechanical properties and ensure batch consistency.
Our parameters were varied when fabricating the fifty-four sets of test specimens: they included sample orientation, lifting speed, lifting distance, and exposure time. Table 1 presents the range and levels for each parameter. The 54 samples are depicted in Figure 2. The LD-006 SLA 3D printer features an 8.9” monochrome screen, exposure time of 1–7 s, 4K solid-state display, lifting speed range from 60–150 mm/h, print size of 192 × 120 × 250 mm, 0.05 mm XY axis precision, layer thickness of 0.01–0.1 mm, lifting distance of 4–6 mm, quartz LED, stable Z-axis with dual linear guide rails, and 4.3” color touch screen.
The samples are made based on the parameter combinations in Table 2. These parameters are used by the SLA 3D printer to create the 54 samples.

2.2. Shore D Hardness Test

Shore D is a standardized method used to determine the hardness of materials, particularly plastics and elastomers, by measuring their resistance to indentation. This test provides valuable insight into the materials’ durability and performance under stress, allowing a better understanding of how the samples will behave in real-world applications [3,6]. The Shore D hardness device used to conduct the hardness tests is from Gain Express Holdings Ltd. Hongkong-to Kwa Wan China The results of the ABS samples are shown in Table 3.

2.3. Tensile Test

The tensile test is a crucial examination that provides highly significant mechanical characteristics. This assessment evaluates how materials react to stretching forces, delivering vital information on tensile strength, elongation at break, and modulus of elasticity, all of which are fundamental for evaluating performance in various engineering applications [25].
In this work, the tensile test was applied using a computerized electric universal testing machine WDW-200. The results of the tensile test are shown in Table 3. The tensile test speed was 1 mm/min for all specimens.

2.4. Surface Roughness

Surface roughness is a critical parameter in the context of stereolithography (SLA) 3D printing, as it directly influences the printed parts’ aesthetic quality, functional performance, and mechanical properties. It refers to the texture of a surface characterized by small, irregular deviations from a perfectly flat surface. These deviations are measured in terms of roughness, such as Ra (average roughness), which quantifies the average height of surface irregularities. The Mahr MarSurf PS1 roughness test device has been used to measure the roughness for all samples. The roughness result averages six measurements in the gripping zone for both sides of each sample.
In SLA 3D printing, the surface roughness is affected by various factors, including layer thickness, exposure time, and the orientation of the printed part. A finer layer thickness generally results in smoother surfaces, as each layer is thinner and allows for better detail reproduction. Conversely, thicker layers can lead to increased roughness due to the larger steps between layers. Additionally, exposure time impacts the curing process of the resin; too little exposure can result in incomplete curing, while excessive exposure may lead to over-curing, both of which can adversely affect the surface finish.
Understanding these variables is crucial for optimizing the printing process and achieving the desired surface quality, as they directly influence not only aesthetic appeal but also the functional performance of the final product. Table 3 shows the surface roughness results.
The results of the tensile test, Shore D hardness measurements, and surface roughness are given in Table 3. Those results are used as input for the neural network models. Figure 3 shows the actual stress–strain curve for sample No. 3.

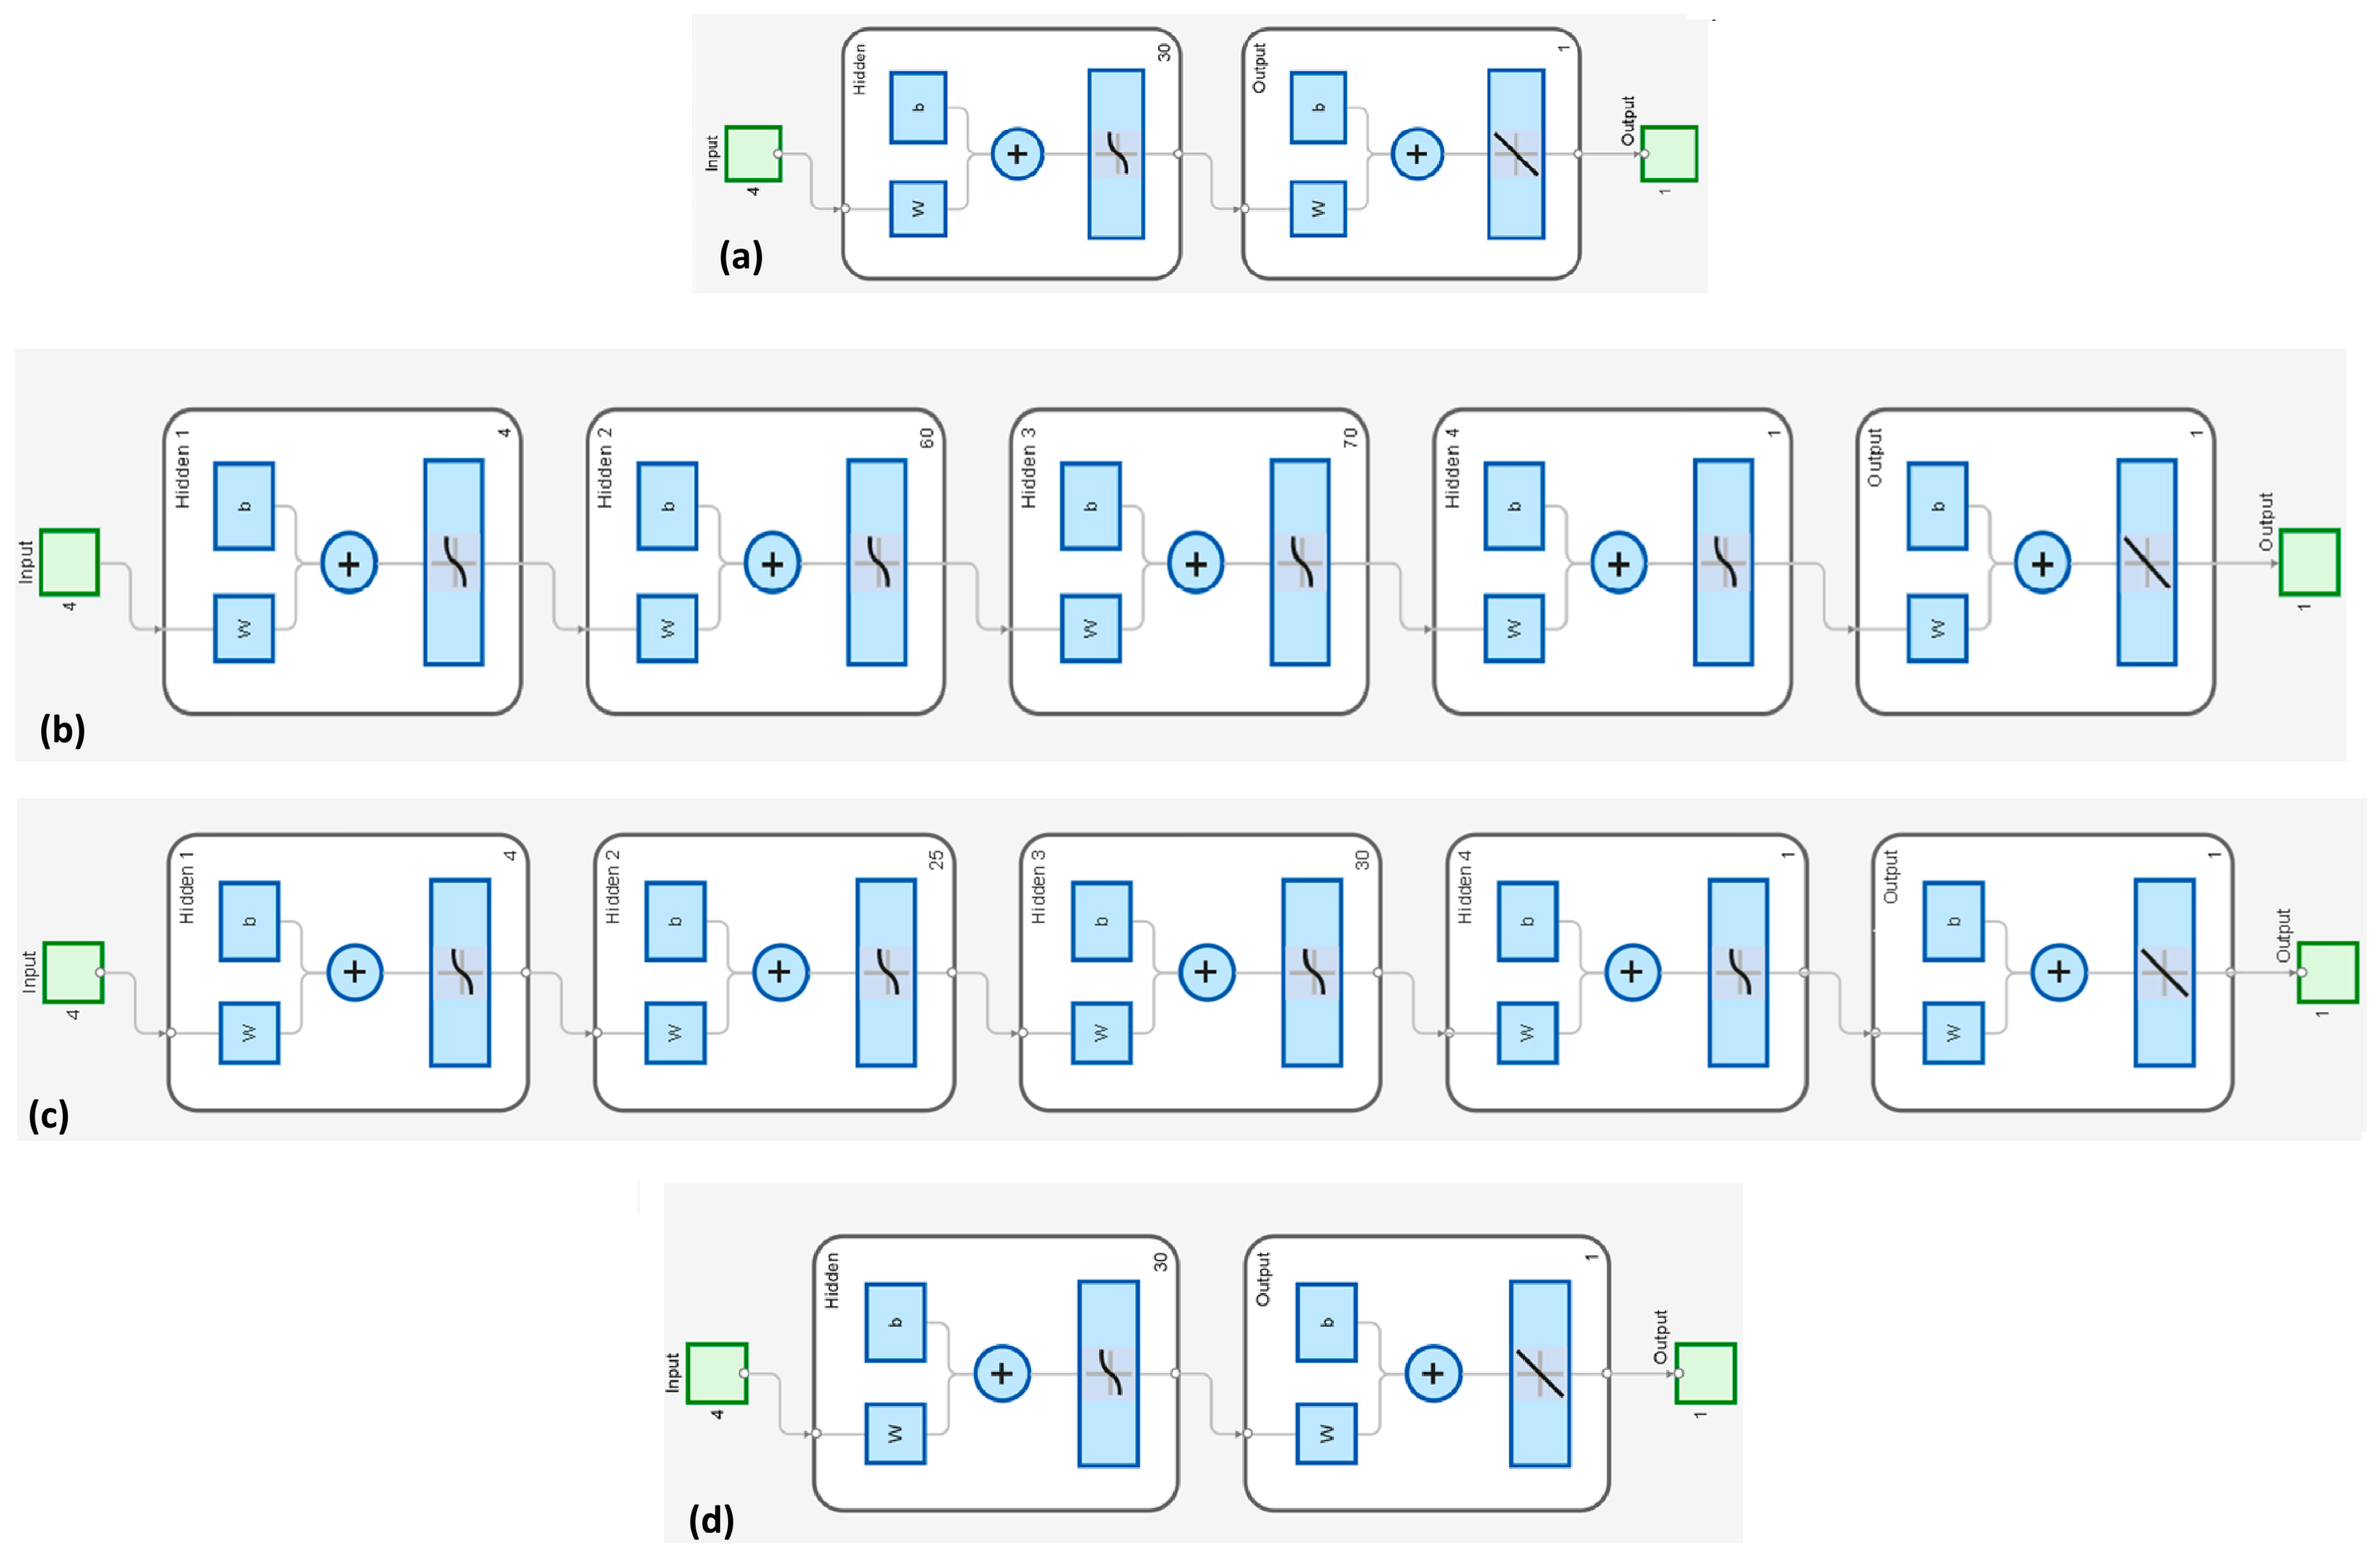
3. Neural Networks Modeling

As mentioned in advance, the feedforward neural network FNN is a parameterized, nonlinear model that can be used to perform regression, in which case a very flexible, nonlinear function is fitted to experimental data. The specifics of this method have been reviewed in the literature [32]. Neural networks are modeled after the structure of the human brain, consisting of layers of interconnected nodes or “neurons” that process input data and generate output. These networks can be simple, featuring just one or two layers, or highly complex, employing multiple hidden layers and numerous neurons [32]. The process starts with the input layer, which receives the raw data. These data are then passed through one or more hidden layers, where each neuron computes a weighted sum and applies an activation function to the inputs received from the preceding neurons. The output layer generates the final output, reflecting the learned patterns in the input data [33].
Neural networks learn from training data to model linear and nonlinear systems, often outperforming traditional linear models. Training requires optimization algorithms like gradient descent to reduce discrepancies between outputs and actual values. Backpropagation is commonly used for training feedforward networks. Extensive resources and large datasets are necessary for neural network training [34].
A primary limitation of neural networks is the requirement for substantial quantities of data and computational resources for effective training. Also, overfitting adds another challenge, whereby the network tends to memorize rather than generalize the training data. In order to overcome these issues, some techniques are applied, such as regularization, dropout, and cross-validation. In conclusion, neural networks serve as versatile and potent instruments for addressing regression and various machine-learning tasks. Their proficiency in modeling complex, nonlinear relationships renders them indispensable in numerous contemporary applications, with ongoing research continually enhancing their potential applications and capabilities [32,33].
Neural networks are connectionist systems in which various nodes called neurons are interconnected. A typical neuron receives one or more input signals and provides an output signal depending on the processing function of the neuron. This output is transferred to connected neurons in varying intensities; the weights decide the signal intensity. Feedforward networks are commonly used. A feedforward network has a sequence of layers consisting of several neurons in each layer. The output of neurons of one layer becomes input to neurons of the succeeding layer. The first layer, called an input layer, receives data from the outside world. The last layer is the output layer, which sends information to users. Layers between the input and output layers are called hidden layers and have no direct contact with the environment. Their presence is needed to provide complexity to the network architecture for modeling nonlinear functional relationships. After choosing the network architecture, the network is trained using the backpropagation algorithm, the efficient optimization method used to minimize the error through weight adjustment [31]. The trained neural network has to be tested by supplying testing data.
Neural network modeling has emerged as an indispensable instrument in numerous varied domains, including the intricate field of mechanical property optimization. These advanced computational models are directly inspired by the complex network of neurons in the human brain and exhibit a remarkable proficiency in identifying patterns and making precise predictions based on extensive datasets [35]. This innovative methodology leverages the potential of artificial intelligence to scrutinize multifaceted data sets and reveal previously inaccessible insights. Distinct types of neural networks existing feedforward, convolutional, recurrent, and others. They characterized by their architectures that distinguishing them and make them suitable for specific applications [35]. Feedforward neural networks exemplify the basic design of neural architectures. The basic configuration of this neural network consists of a single input layer, a hidden layer, and a distinct output layer. Each neuron in the input layer is connected to each neuron in the hidden layer, while the neurons in the hidden layer are connected to the neurons in the output layer. This arrangement facilitates a unidirectional data flow from the input layer towards the output layer [32].
This work used feedforward neural networks to model the mechanical properties of the ABS-like photopolymer printed parts produced by SLA printers due to their ability to perform in regression applications effectively. Those models are then used to optimize SLA parameters to get high-performance products. The backpropagation algorithm is conducted to train these models. The backpropagation algorithm is utilized from the MATLAB 2018b neural network toolbox, which gives many tools to help design, implement, and evaluate neural networks.
The backpropagation process is pivotal in deep learning, as it entails the precise computation of the gradient of the loss function concerning each specific weight, employing the chain rule. This method facilitates the efficient and systematic updating of the weights within the neural network. The iterative nature of this process is sustained until the network’s performance enhances appreciably and attains a level considered satisfactory based on predetermined criteria. Consequently, backpropagation emerges as an indispensable and foundational approach for effectively training intricate neural network models, aiding them in efficiently acquiring knowledge from data [32,33].

3.1. Tensile Strength and Yield Stress Modeling

The results of tensile tests were employed to develop two feedforward networks designed to model the relationship between the four printing parameters and both tensile strength and yield stress. The structures of these models are shown in Figure 4a and Figure 4b, respectively, where w is the weight matrix for the specified layer and b is the bias vector of that layer. The network for tensile strength consists of an input layer, two hidden layers, and an output layer. The first hidden layer has 30 neurons with a “tansig” activation function, and the second has one with a “purelin” activation function. The yield strength model, shown in Figure 4b, consists of five hidden layers, the details of which are given in Table 4. It should be noted that the difference in network architectures is due to variations in regression problems, which sometimes require more hidden layers and neurons, depending on trial and error.

3.2. Shore-D Hardness

A feedback forward neural network model has been developed to model the four printing parameters (orientation, lifting speed, lifting distance, and exposure time) with the Shore D hardness. This model is trained using the hardness data given in Table 3. Figure 4c shows the neural network model’s structure. It is clear that the model consists of five hidden layers, the details of which are shown in Table 5.

3.3. Roughness Modelling

The surface roughness modeling is constructed using the experimental data, and the model structure is shown in Figure 4d. The model structure consists of two hidden layers. The first layer has 30 neurons with “tansig” transfer function, the second layer has one neuron with “purelin” transfer function.

4. Optimization of ABS-like Photopolymer Printed Parts

Neural network modeling has emerged as an indispensable instrument in numerous domains, including the intricate field of mechanical property optimization. A weighted sum optimization method was used to enhance the performance of ABS-like photopolymer printed parts. In this work, the optimization objectives are considered as follows: Tensile strength, yield stress, and hardness must increase, whereas surface roughness should decrease. Combining all these different objectives in one optimization objective is performed by utilizing a weighted sum equation as given in Equation (1):
O b j e c t i v e   f u c n t i o n = w u l t   σ u l t + w y σ y + w s h d S h D + w r R a
where wult, wy, wshd, and wr are property optimization weights, all of which are equal to 1. The variables in sequence from left to right are ultimate tensile strength, yield strength, Shore D hardness, and surface roughness. This indicates that all properties have the same level of importance in this study. The negative sign is used to convert the maximization of ultimate strength, yield stress, and Shore D hardness into a minimization problem.
In this work, a Matlab optimization toolbox was utilized to optimize the printed parts. The “fmincon” Matlab function, which is used to find the minimum of a constrained nonlinear multivariable function, was employed. This function was applied after defining the objective function. The fmincon function then uses this objective function to identify the optimal parameters that minimize the objective function. As stated, the minimum objective function value is achieved when the tensile strength, yield stress, and Shore D hardness are maximized, and the roughness is minimized.

5. Results and Discussion

To understand the effect of the SLA 3D printer parameters on the mechanical properties of ABS-like printed parts, the main effects plots for each response against the process parameters are presented. Figure 5 displays the plot of the main effects for tensile strength, yield strength, Shore D hardness, and surface roughness, respectively.
From Figure 5a, the plot illustrates that the “Edge” orientation results in a higher ultimate tensile strength compared to the “Flat” orientation. This indicates that the material’s orientation significantly impacts its tensile strength, with “Edge” being the superior choice. In contrast, the lifting speed plot reveals a slight increase in tensile strength as the speed increases from 70 to 100 and then to 130. However, the difference is minimal, suggesting that lifting speed has a relatively minor effect on tensile strength. The plot also shows that tensile strength increases with a lifting distance of 5 but decreases significantly at 6. This implies that while increasing the lifting distance benefits tensile strength up to a certain point (5), exceeding that point (6) has a negative effect. The exposure time plot consistently increases tensile strength with longer exposure times. The ultimate tensile strength peaks at 7, indicating that extended exposure times have a positive impact on tensile strength.
In Figure 5b, the plot shows that the “Flat” orientation results in higher yield tensile strength compared to the “Edge” orientation. This observation suggests that the material’s orientation significantly affects its yield tensile strength, making “Flat” the more advantageous choice. However, when analyzing the main effect plot for orientation against both ultimate tensile strength and yield strength, it is clear that the impact is the opposite.
The lifting speed plot shows an increase in yield tensile strength as the speed rises from 70 to 100, followed by a decrease when the speed reaches 130. The lifting distance plot indicates that the yield tensile strength decreases as the lifting distance increases from 4 to 5, with a very slight difference at 6 (from 18.9 to 19). This suggests that the optimal lifting distance should be at 4, as a larger value negatively impacts yield strength. The exposure time plot reveals a consistent increase in yield strength when the time progresses from 4 to 5, whereas yield strength decreases with increasing exposure time beyond 5. The yield tensile strength is highest at 5, indicating that the optimal exposure time should be 5.
In Figure 5c, the orientation plot indicates that the “Flat” orientation yields a higher Shore D hardness value compared to the “Edge” orientation. This implies that the orientation of the material significantly impacts its hardness, with “Flat” being the preferred orientation for higher Shore D hardness values. The lifting speed plot shows a decrease in Shore D hardness from when the speed changed from 70 to 100, followed by an increase at 130. This suggests that an optimal lifting speed around 1330 yields the highest Shore D hardness value. The plot indicates a decrease in Shore D hardness as the lifting distance increases from 4 to 5, with a slight increase at 6. This suggests that increasing the lifting distance generally has a negative impact on hardness, with 5 being the least optimal distance. The exposure time plot shows a consistent increase in Shore D hardness with increasing exposure time. This indicates that longer exposure times positively affect the hardness, with the highest Shore D hardness observed at 7.
Figure 5d illustrates that the orientation plot indicates the “Edge” orientation results in a significantly higher surface roughness compared to the “Flat” orientation. This finding suggests that the orientation of the material has a substantial impact on the surface roughness value, positioning the “Flat” orientation as more effective in achieving the lowest surface roughness measurements. Moreover, the lifting speed plot demonstrates a decline in surface roughness as the speed increases from 70 to 100, followed by a marginal increase at 130. This correlation implies the existence of an optimal lifting speed of approximately 100, which minimizes the surface roughness; conversely, speeds exceeding 100 appear to slightly exacerbate the surface roughness. Furthermore, the analysis reveals an upward trend in surface roughness as the lifting distance rises from 4 to 5, with a negligible decrease noted at a distance of 6. This trend supports the assertion that increasing lifting distances generally negatively influence the surface roughness value, with a distance of 5 identified as the least favorable. Lastly, the exposure time plot reveals a relatively stable Ra value between 3 and 5, succeeded by an increase at an exposure time of 7. This observation indicates that prolonged exposure times positively correlate with Ra values, culminating in the highest Ra recorded at 7.
The correlation coefficient for each of the four trained neural network models was calculated for every model. The results were obtained. R 1 = 0.98798 for ultimate tensile strength, R 2 = 0.9879 for yield stress, R 3 = 0.9823 for Shore D hardness, and R 4 = 0.98689 for surface roughness. All models accurately reflect the experimental data and are considered reliable. Consequently, these models can be applied to the optimization problem. Figure 6 displays all the experimental data compared to the outputs of the neural network models for the same printing parameters. The red scattered plots represent the experimental data, while the blue scattered plots represent the neural network models. It is observed that the model outputs closely align with the experimental data.
The optimization algorithm determined the following optimal printing parameters: orientation set to Edge, lifting speed to 90.6962 mm/h, lifting distance to 4.8483 mm, and exposure time to 4.8152 s. These parameters resulted in a 3D-printed part with mechanical properties as follows: ultimate tensile strength of 40.4479 MPa, yield strength of 32.2998 MPa, Shore D hardness of 66.4146, and surface roughness (Ra) of 0.89947 µm.

6. Conclusions

This study demonstrates the successful application of a weighted sum optimization method to enhance the mechanical properties of ABS printed parts. Using feedforward neural network models and the MATLAB optimization toolbox, it was found that these parameters significantly improved the ultimate tensile strength to 40.4479 MPa, yield strength to 32.2998 MPa, Shore D hardness to 66.4146, and surface roughness Ra to 0.89947 µm of the printed parts. The elevated correlation coefficients derived from the neural network models denote their dependability in forecasting these properties. The results suggest that the methodological approach employed in this study can be effectively applied to similar optimization challenges, providing a beneficial framework for future research within the domain of additive manufacturing. The use of neural networks in modeling has demonstrated their capacity to represent the relationships between the SLA 3D printer’s parameters and the mechanical properties of ABS-printed parts. The models achieved average absolute errors of 0.63148 for ultimate tensile strength, 0.3505 for yield strength, 0.59559 for Shore D hardness, and 0.044492 for Ra.
The proposed method, which combines neural networks and weighted sum optimization, enables researchers to utilize this framework to model, predict, and optimize nonlinear systems and processes that cannot be modeled using traditional methods.

Funding

The author was granted financial assistance for the publication of this article by Salahadin University-Erbil and TU Bergakademie Freiberg—IMKF.

Data Availability Statement

The data utilized within this study are accessible upon formal request to the corresponding author.

Acknowledgments

The author would like to thank the staff of the Chair of Additive Manufacturing (Institute of Machine Elements, Design and Manufacturing) of TU Bergakademie Freiberg, Germany and Suli Innovation House for providing mechanical testing facilities, software and technical support.

Conflicts of Interest

The author declares no conflict of interest.

References

  1. Mukhtarkhanov, M.; Perveen, A.; Talamona, D. Application of Stereolithography Based 3D Printing Technology in Investment Casting. Micromachines 2020, 11, 946. [Google Scholar] [CrossRef] [PubMed]
  2. Salih, R.M.; Kadauw, A.; Zeidler, H.; Aliyev, R. Investigation of LCD 3D Printing of Carbon Fiber Composites by Utilising Central Composite Design. J. Manuf. Mater. Process. 2023, 7, 58. [Google Scholar] [CrossRef]
  3. Rojek, I.; Mikołajewski, D.; Dostatni, E.; Macko, M. AI-Optimized Technological Aspects of the Material Used in 3D Printing Processes for Selected Medical Applications. Materials 2020, 13, 5437. [Google Scholar] [CrossRef]
  4. Yadav, D.; Chhabra, D.; Garg, R.K.; Ahlawat, A. Optimization of FDM 3D printing process parameters for multi-material using artificial neural network. Mater. Today 2020, 21, 1583–1591. [Google Scholar] [CrossRef]
  5. Loy, J.; Novak, J.I.; Scerri, M. Developing transition research for disruptive technology: 3D printing innovation. In Advanced Perspectives on Global Industry Transitions and Business Opportunities; IGI Global: Hershey, PA, USA, 2021; Chapter 1. [Google Scholar] [CrossRef]
  6. Dzogbewu, T.C.; Amoah, N.; Fianko, S.K.; Afrifa, S.; De Beer, D. Additive manufacturing towards product production: A bibliometric analysis. Manuf. Rev. 2022, 9, 1–21. [Google Scholar] [CrossRef]
  7. Ukobitz, D.V.; Faullant, R. The relative impact of isomorphic pressures on the adoption of radical technology: Evidence from 3D printing. Technovation 2022, 113, 102418. [Google Scholar] [CrossRef]
  8. Bozkurt, Y.; Karayel, E. 3D printing technology; methods, biomedical applications, future opportunities and trends. J. Mater. Res. Technol. 2021, 14, 1430–1450. [Google Scholar] [CrossRef]
  9. Jandyal, A.; Chaturvedi, I.; Wazir, I.; Raina, A. 3D printing—A review of processes, materials and applications in industry 4.0. Sustain. Oper. 2022, 3, 33–42. [Google Scholar] [CrossRef]
  10. Liu, X.; Tian, S.; Tao, F.; Yu, W. A review of artificial neural networks in the constitutive modeling of composite materials. Compos. Part B Eng. 2021, 224, 109152. [Google Scholar] [CrossRef]
  11. Chen, C.T.; Gu, G.X. Generative Deep Neural Networks for Inverse Materials Design Using Backpropagation and Active Learning. Adv. Sci. 2020, 7, 1902607. [Google Scholar] [CrossRef]
  12. Hopkins, M.; Gunbay, S.; Hayes, C.; Moritz, V.F.; Fuenmayor, E.; Lyons, J.G.; Devine, D.M. Stereolithography SLA utilised to print injection mould tooling in order to evaluate thermal and mechanical properties of commercial polypropylene. Procedia Manuf. 2021, 55, 205–212. [Google Scholar] [CrossRef]
  13. Zhou, L.; Miller, J.; Vezza, J.; Mayster, M.; Raffay, M.; Justice, Q.; Al Tamimi, Z.; Hansotte, G.; Sunkara, L.D.; Bernat, J. Additive Manufacturing: A Comprehensive Review. Sensors 2024, 24, 2668. [Google Scholar] [CrossRef]
  14. Miller, Z.; Stidham, B.; Fairbanks, T.; Maldonado, C. The Use of Stereolithography (SLA) Additive Manufacturing in Space-Based Instrumentation. In Proceedings of the 2023 IEEE Aerospace Conference, Big Sky, MT, USA, 4–11 March 2023; pp. 1–10. [Google Scholar] [CrossRef]
  15. Chohan, J.S.; Mittal, N.; Kumar, R.; Singh, S.; Sharma, S.; Singh, J.; Rao, K.V.; Mia, M.; Pimenov, D.Y.; Dwivedi, S.P. Mechanical Strength Enhancement of 3D Printed Acrylonitrile Butadiene Styrene Polymer Components Using Neural Network Optimization Algorithm. Polymers 2020, 12, 2250. [Google Scholar] [CrossRef]
  16. Zeng, Y.-S.; Hsueh, M.-H.; Hsiao, T.-C. Effect of ultraviolet post-curing, laser power, and layer thickness on the mechanical properties of acrylate used in stereolithography 3D printing. Mater. Res. Express 2023, 10, 025303. [Google Scholar] [CrossRef]
  17. Kazemi, M.; Rahimi, A. Stereolithography process optimization for tensile strength improvement of products. Rapid Prototyp. J. 2018, 24, 688–697. [Google Scholar] [CrossRef]
  18. Li, Y.; Teng, Z. Effect of printing orientation on mechanical properties of SLA 3D-printed photopolymer. Fatigue Fract. Eng. Mater. Struct. 2024, 47, 1531–1545. [Google Scholar] [CrossRef]
  19. Wang, E.; Yang, F.; Shen, X.; Li, Z.; Yang, X.; Zhang, X.; Peng, W. Investigation and Optimization of the Impact of Printing Orientation on Mechanical Properties of Resin Sample in the Low-Force Stereolithography Additive Manufacturing. Materials 2022, 15, 6743. [Google Scholar] [CrossRef] [PubMed]
  20. Ciccone, F.; Bacciaglia, A.; Ceruti, A. Optimization with artificial intelligence in additive manufacturing: A systematic review. J. Braz. Soc. Mech. Sci. Eng. 2023, 45, 303. [Google Scholar] [CrossRef]
  21. Bolat, Ç.; Cebi, A.; Çoban, S.; Ergene, B. Estimation of friction and wear properties of additively manufactured recycled-ABS parts using artificial neural network approach: Effects of layer thickness, infill rate, and building direction. Int. Polym. Process. 2024, 39, 293–307. [Google Scholar] [CrossRef]
  22. Marković, M.-P.; Cingesar, I.K.; Vrsaljko, D. Maximizing Mechanical Performance of 3D Printed Parts Through Process Parameter Optimization. 3D Print. Addit. Manuf. 2023, 11, e2062–e2074. [Google Scholar] [CrossRef]
  23. Palacio, A.; Baniasadi, M.; Kardel, K. Investigating Mechanical Properties of Fabricated Carbon-Fiber-Reinforced Composites via LCD Additive Manufacturing. Polymers 2023, 15, 4556. [Google Scholar] [CrossRef]
  24. Castañares, M.; Antonio, J.; Rodriguez, T. Manufacturing Parameters Characterisation of a 3D Printer. Bachelor’s Thesis, Escola d’Enginyeria de Barcelona Est (EEBE), Barcelona, Spain, 2017. [Google Scholar]
  25. Hosford, W.F. Mechanical Behavior of Materials; Cambridge University Press: Cambridge, UK, 2005; Chapter 3; pp. 39–52. [Google Scholar] [CrossRef]
  26. Schmidleithner, C.; Kalaskar, D.M. Stereolithography. In 3D Printing; InTech: London, UK, 2018. [Google Scholar] [CrossRef]
  27. Hu, G.; Cao, Z.; Hopkins, M.; Hayes, C.; Daly, M.; Zhou, H.; Devine, D.M. Optimizing the hardness of SLA printed objects by using the neural network and genetic algorithm. Procedia Manuf. 2019, 38, 117–124. [Google Scholar] [CrossRef]
  28. Pérez, P.; Trier, A.; Reyes, J. Prediction of PM2.5 concentrations several hours in advance using neural networks in Santiago, Chile. Atmos. Environ. 2000, 34, 1189–1196. [Google Scholar] [CrossRef]
  29. Mahmood, M.A.; Visan, A.I.; Ristoscu, C.; Mihailescu, I.N. Artificial Neural Network Algorithms for 3D Printing. Materials 2021, 14, 163. [Google Scholar] [CrossRef]
  30. Zhang, Y.; Tiňo, P.; Leonardis, A. A survey on neural network interpretability. IEEE Trans. Emerg. 2021, 5, 726–742. [Google Scholar] [CrossRef]
  31. Agron, D.J.; Nwakanma, C.I.; Lee, J.; Kim, D. Smart Monitoring for SLA-type 3D Printer using Artificial Neural Network. 2020. Available online: https://api.semanticscholar.org/CorpusID:221147445 (accessed on 1 January 2020).
  32. Khammas, A.; AL-Khafaji, M. Neural Network Modeling of Oxidation Kinetics in Air of Steel T21 Alloy Coated by Simultaneous Germanium-Doped Aluminizing-Siliconzing Process. Eng. Technol. 2013, 31, 632–645. [Google Scholar]
  33. AL-Khafaji, M.M.; Alwan, H.L.; Albaghdadi, B.M. Roughness Assessment for Machined Surfaces in Turning Operation Using Neural Network. Eng. Technol. 2014, 32 Pt A, 1331–1344. [Google Scholar]
  34. Dabrowski, J.J.; Zhang, Y.F.; Rahman, A. ForecastNet: A time-variant deep feed-forward neural network architecture for multi-step-ahead time-series forecasting. In Neural Information Processing: 27th International Conference, ICONIP 2020, Bangkok, Thailand, 23–27 November 2020, Proceedings, Part III 27; Springer: Berlin/Heidelberg, Germany, 2020. [Google Scholar] [CrossRef]
  35. Sharkawy, A.N. Principle of neural network and its main types. J. Adv. Appl. Comput. Math. 2020, 7, 8–19. [Google Scholar] [CrossRef]
Figure 1. D638 sample—all dimensions are in mm.
Jmmp 09 00116 g001
Figure 2. Fifty-four samples used for analysis.
Jmmp 09 00116 g002
Figure 3. True stress–strain curve for sample manufactured using Edge orientation, 100 mm/h lifting speed, 6 mm lifting distance, and 5 s exposure time (sample No.3, Table 3).
Jmmp 09 00116 g003
Figure 4. Network structures for (a) tensile strength model, (b) yield strength model, (c) Shore D hardness, and (d) surface roughness.
Jmmp 09 00116 g004
Figure 5. The main effects plot for (a) ultimate tensile strength (b) yield strength, (c) Shore D hardness, and (d) surface roughness.
Jmmp 09 00116 g005
Figure 6. The neural network model’s output and experimental data for (a) ultimate tensile strength, (b) yield strength, (c) Shore D hardness, and (d) surface roughness.
Jmmp 09 00116 g006
Table 1. Levels of the parameters.
No of LevelsLevels Value
Orientation2Edge and Flat
Lifting speed370, 100, and 130 mm/h
Lifting distance34, 5, and 6 mm
Exposure time33, 5, and 7 s
Table 2. List of experimental run parameters.
Run
Order
OrientationLifting
Speed
mm/h
Lifting
Distance
mm
Exposure
Time
s
Run
Order
OrientationLifting
Speed
mm/h
Lifting
Distance
mm
Exposure
Time
s
1Edge1006728Flat10043
2Flat1005529Edge10047
3Edge1006530Flat13055
4Flat1006331Flat7067
5Edge1305732Flat10065
6Flat1306533Edge7055
7Flat705334Flat7043
8Flat704535Edge13055
9Edge705336Flat10057
10Edge1306737Flat13045
11Edge706738Edge10045
12Edge1306539Edge10043
13Flat1004540Edge7065
14Flat704741Flat13057
15Flat706542Edge7047
16Flat1304743Edge13043
17Edge704544Edge13053
18Edge1306345Flat13053
19Edge704346Edge7063
20Flat1306347Edge7057
21Flat1005348Flat13043
22Flat705549Edge10055
23Edge1304550Edge10053
24Flat705751Flat7063
25Flat1306752Flat10047
26Edge1006353Edge13047
27Flat1006754Edge10057
Table 3. Experimental results of the tensile test.
RunOrderTensile Test Results (Mpa)Shore D HDRa
μm
Max StressYield StressYoung Modulus
130.76019.118349.19476.3331.195
229.13726.591278.47075.6670.677
331.61820.711135.56867.6671.013
421.05318.027234.75175.5830.215
528.15415.654326.24974.5831.435
629.39421.625328.43474.9170.665
724.38018.595293.15974.5830.081
827.79322.207335.89179.5000.078
930.24724.432316.10764.0831.585
1030.3251.232304.32570.1671.285
1136.69824.254428.67775.8331.289
1230.22313.393429.10869.0831.485
1330.36923.256367.41884.0830.067
1430.52821.826351.45384.0000.613
1524.10021.308314.81578.6670.684
1628.05621.051366.28982.6670.077
1729.14820.299390.39567.3330.772
1820.11915.619227.37166.2501.386
196.0314.95168.79666.4171.481
2023.02919.260274.18880.7500.101
2129.91317.533340.26680.8330.579
2230.41723.541349.02182.0830.671
2326.58220.200318.09478.0831.466
2429.87822.016391.15381.2500.601
2526.80421.031352.55683.3330.065
2621.16915.846236.09067.9171.105
2728.98222.420371.24981.5830.056
2819.22816.180244.03280.5830.721
2924.26515.607293.11077.9171.494
3024.79121.459274.19781.8330.098
3130.01423.186346.04382.5000.641
3224.86020.950346.12880.3330.113
3328.78712.375379.22377.0831.182
3425.86818.838347.76481.5830.652
3528.68121.692327.75777.9171.267
3633.74921.454434.65981.4170.223
3740.94734.958495.82782.4170.092
3837.52919.451485.56372.5001.158
3934.40619.698428.31566.7500.904
4036.26918.653495.33977.3331.307
4140.39821.053488.56481.0000.786
4244.27918.905597.91678.5001.704
4334.65220.737481.97678.8331.185
4433.2650.204390.27476.2500.944
4531.86310.755463.42677.5830.843
4630.37423.594330.47765.9170.960
4739.50318.396489.17270.9171.514
4834.89418.621404.61477.2500.104
4939.24123.070456.21464.0831.256
5033.40122.539349.11371.3330.415
5130.98022.261327.93578.4170.601
5241.82523.860466.39274.8330.181
5345.00620.457505.39177.4171.404
5445.28821.542532.45468.2501.215
Table 4. Yield strength neural network model details.
Layer No.Layer Size
(Neurons)
Layer Transfer Function
(Activation Function)
14tansig
260tansig
370tansig
41tansig
51purelin
Table 5. Shore D Hardness neural network model details.
Layer No.Layer Size
(Neurons)
Layer Transfer Function
(Activation Function)
14tansig
225tansig
330tansig
41tansig
51purelin
Disclaimer/Publisher’s Note: The statements, opinions and data contained in all publications are solely those of the individual author(s) and contributor(s) and not of MDPI and/or the editor(s). MDPI and/or the editor(s) disclaim responsibility for any injury to people or property resulting from any ideas, methods, instructions or products referred to in the content.

