
Recent Advances in In Situ 3D Surface Topographical Monitoring for Additive Manufacturing Processes


Abstract
1. Introduction
2. Distinctions from Existing Review Articles
3. Working Principle of Additive Manufacturing Processes
3.1. Powder Bed Fusion
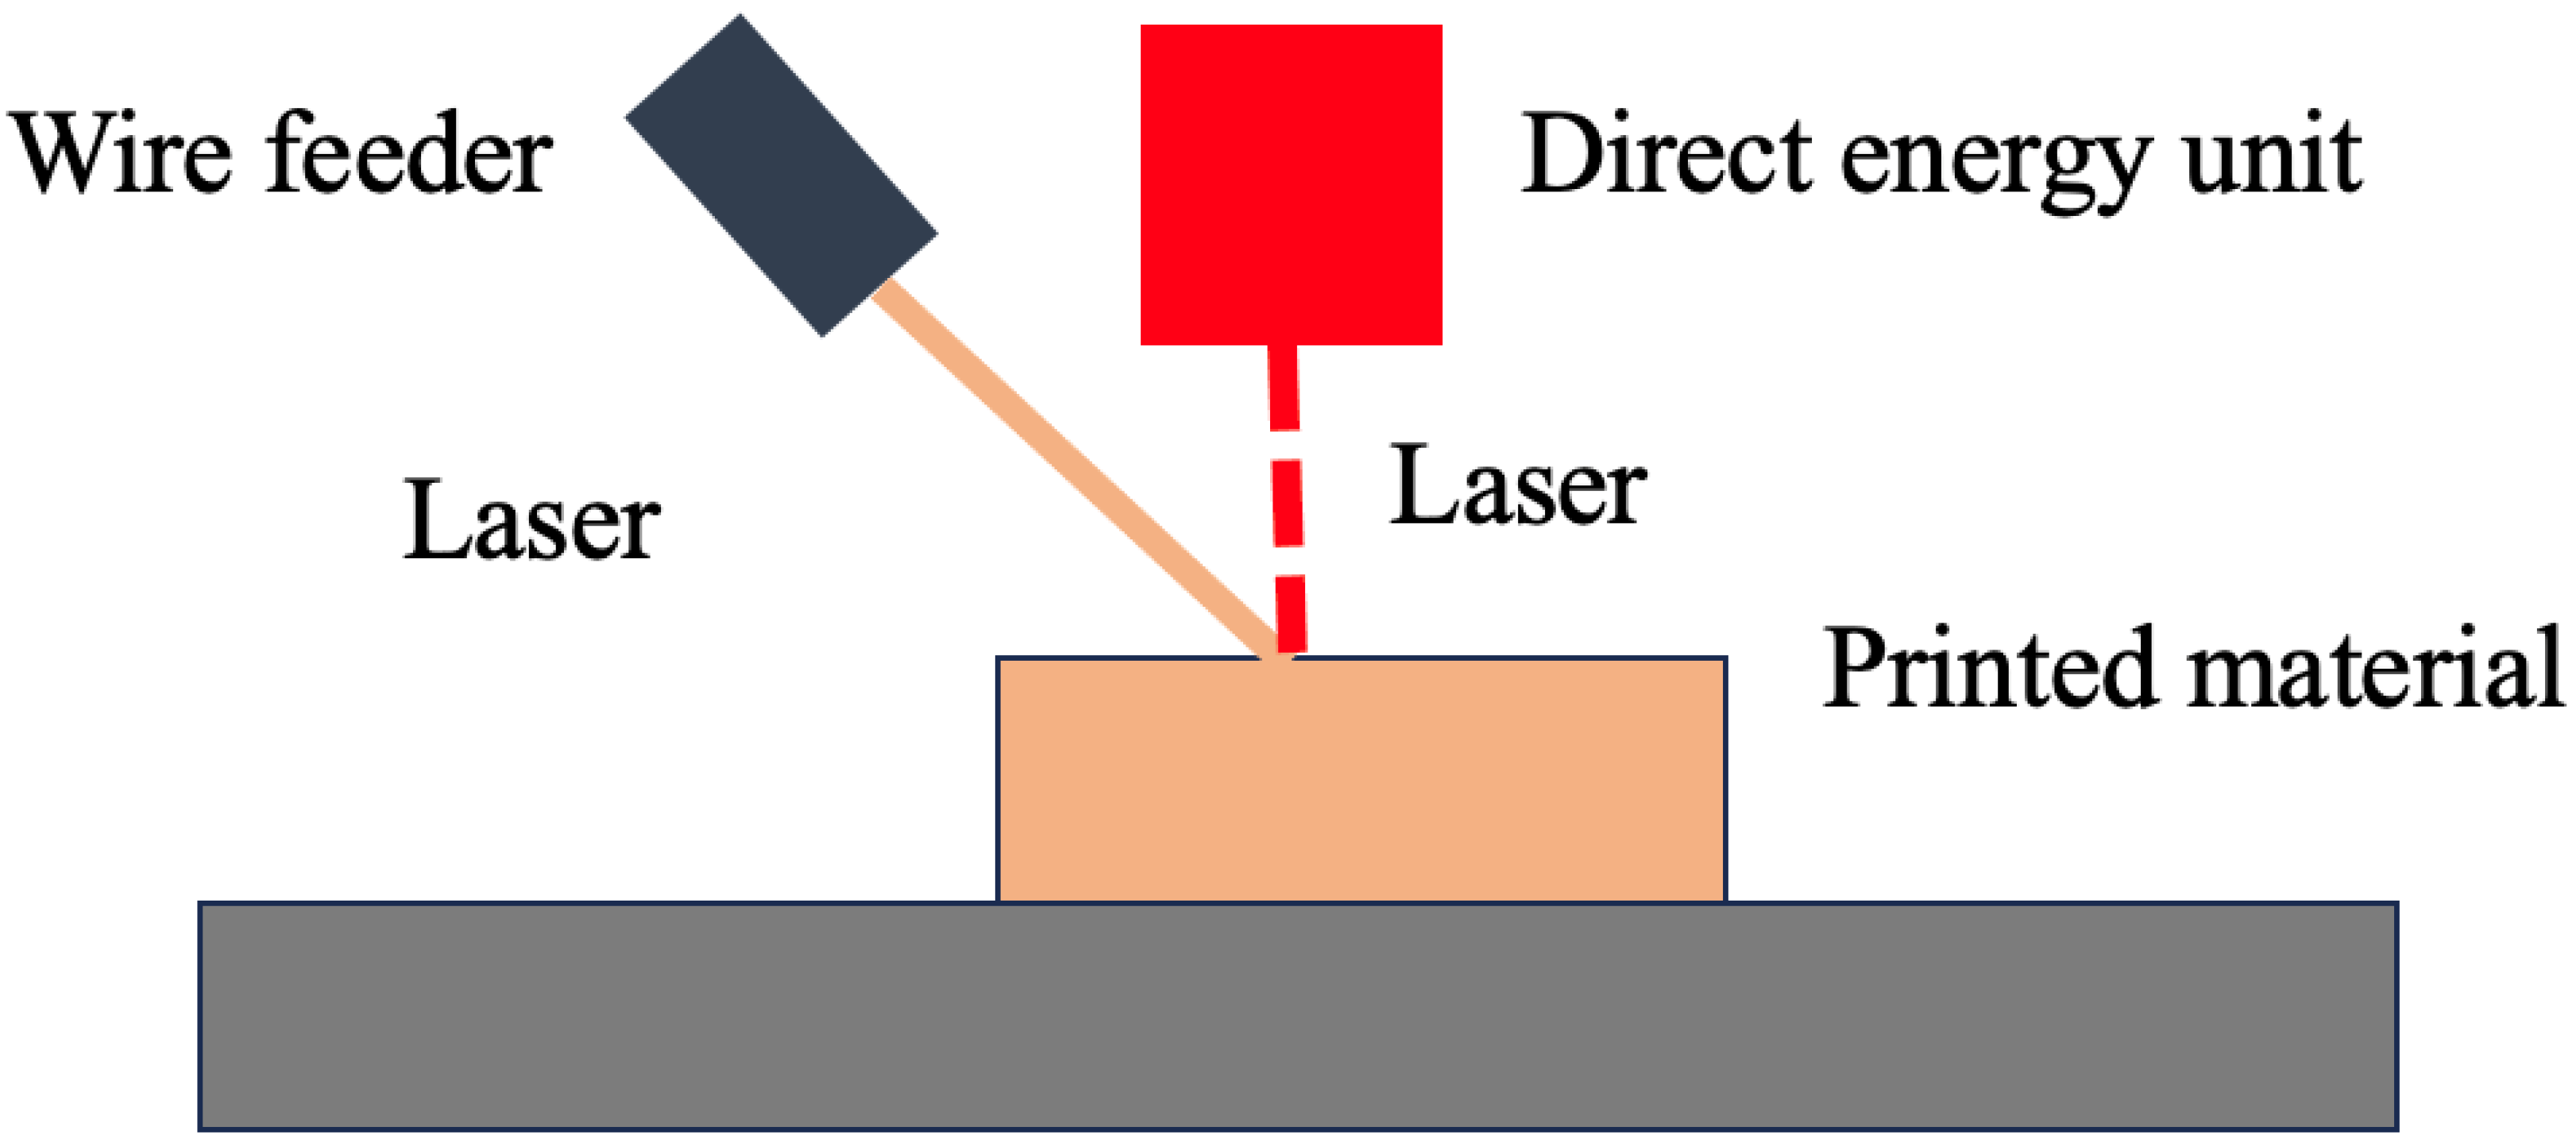
3.2. Direct Energy Deposition
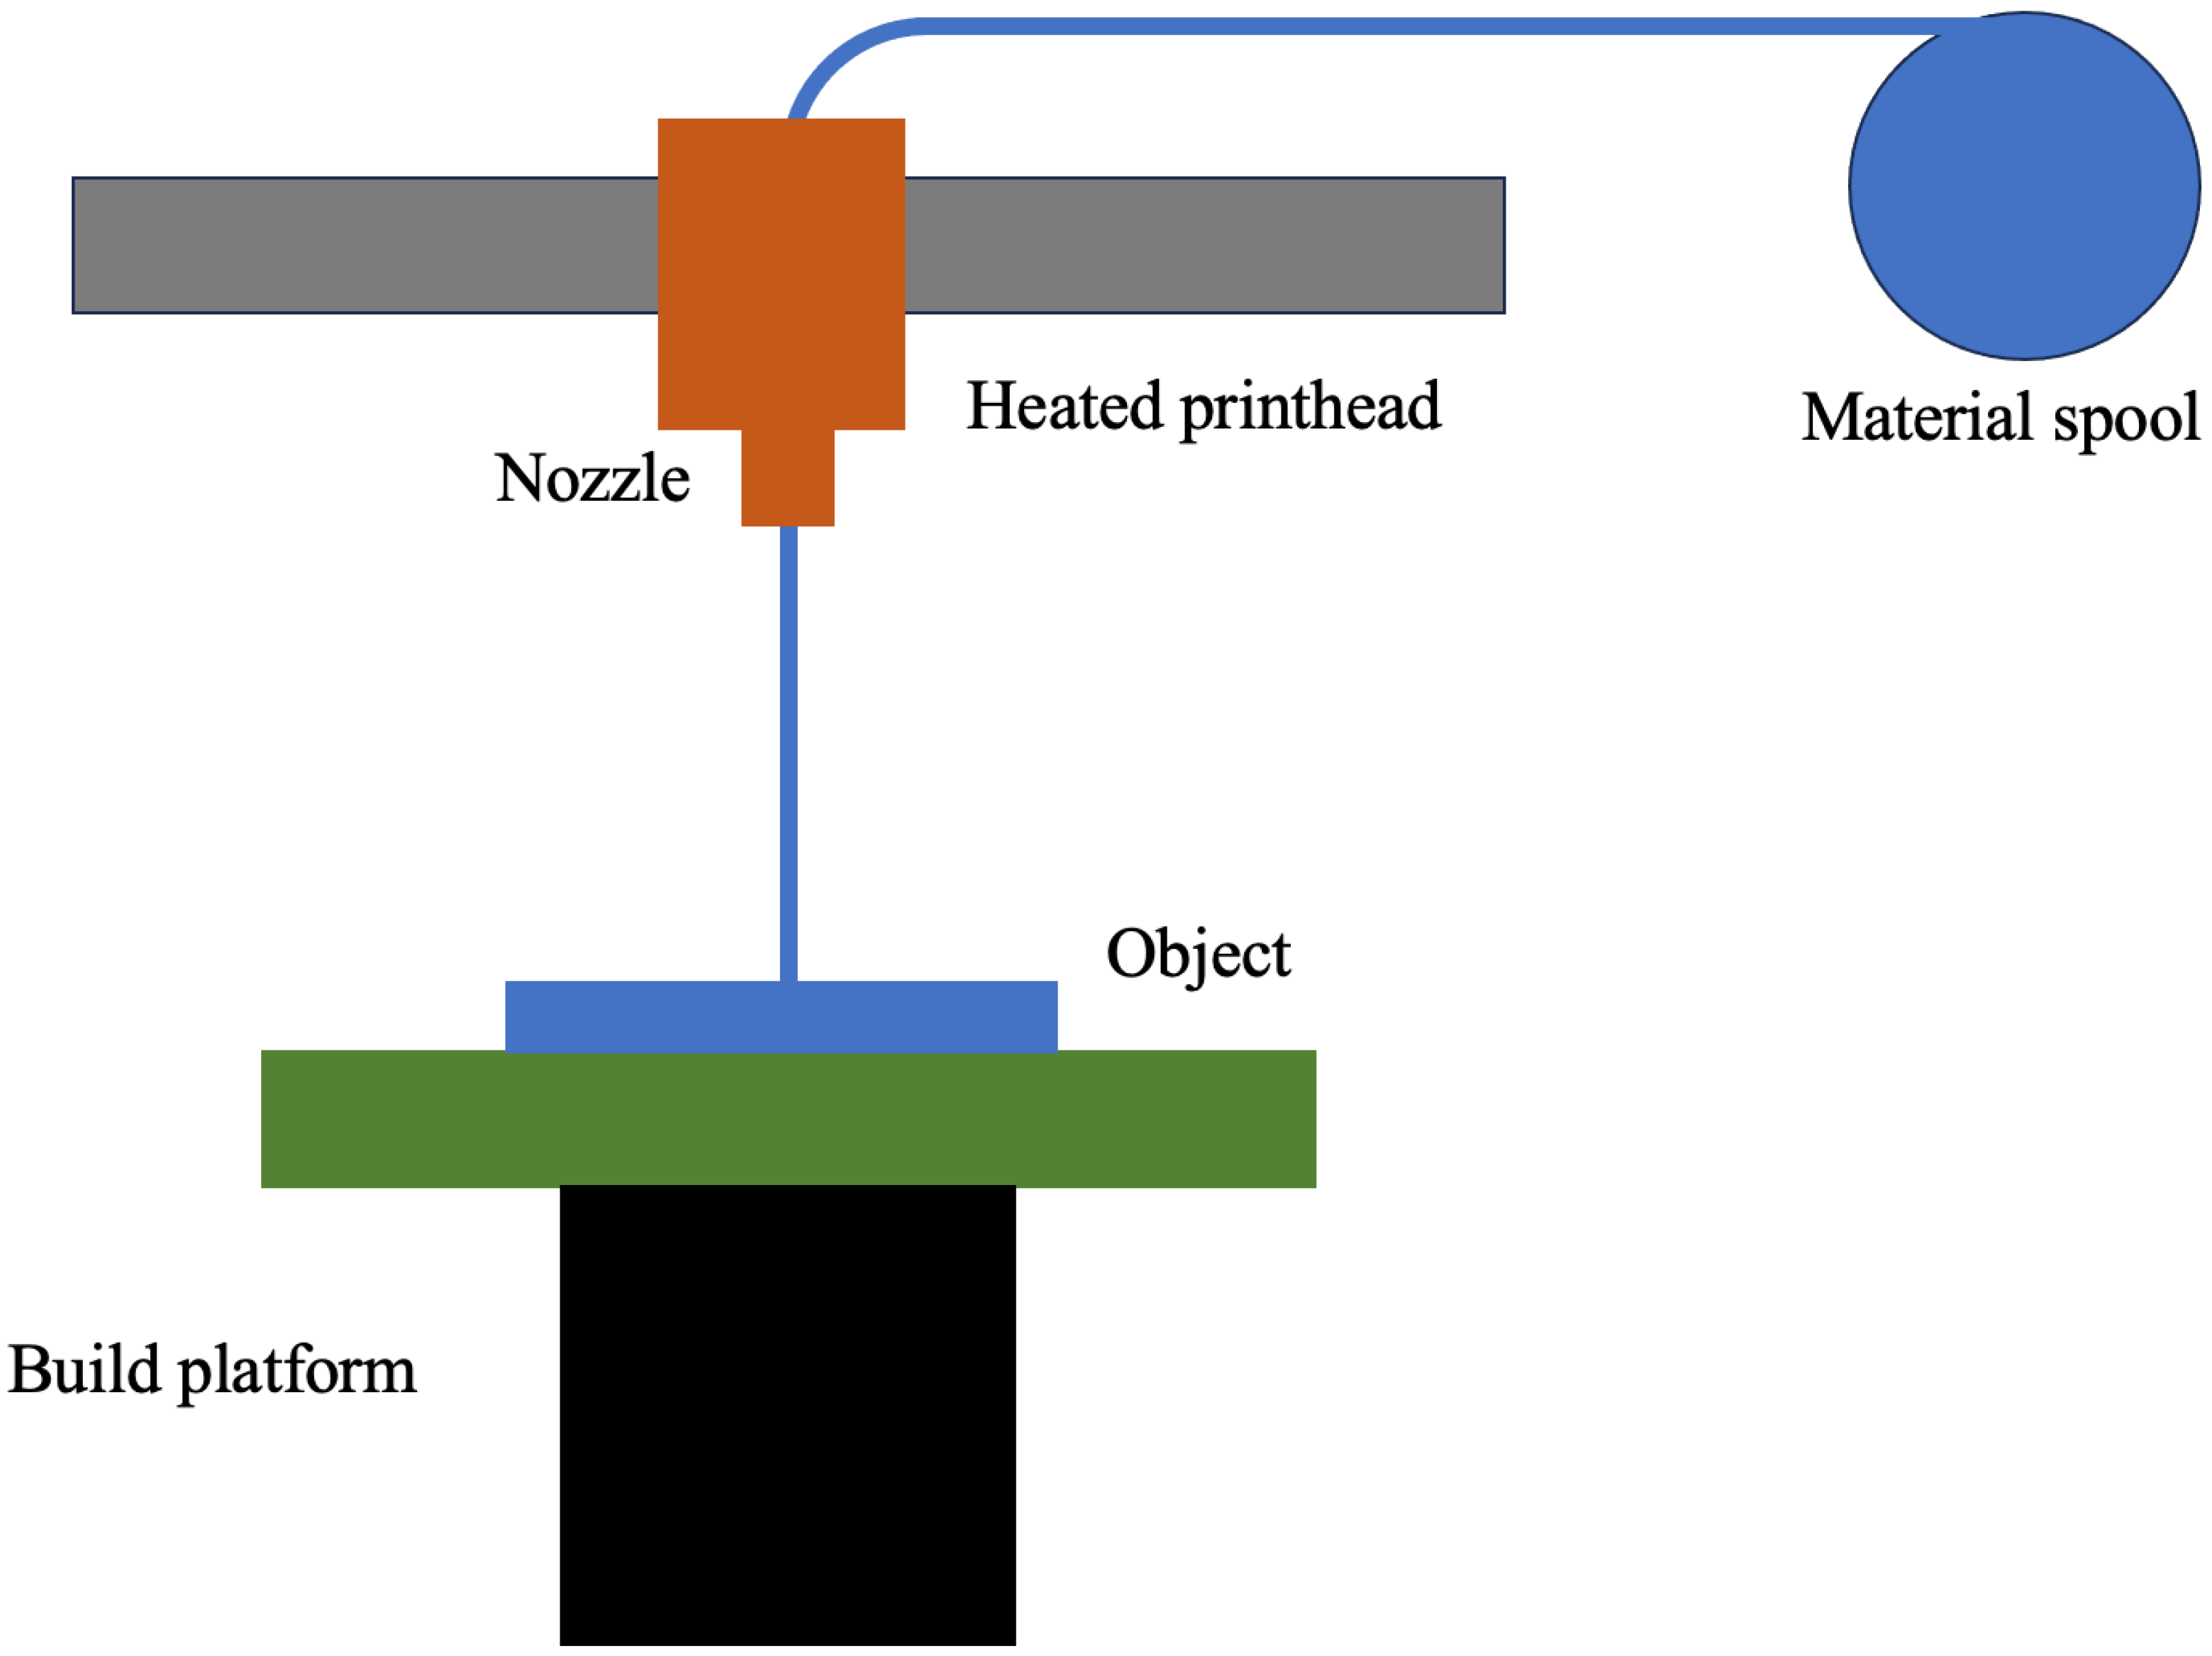
3.3. Material Extrusion
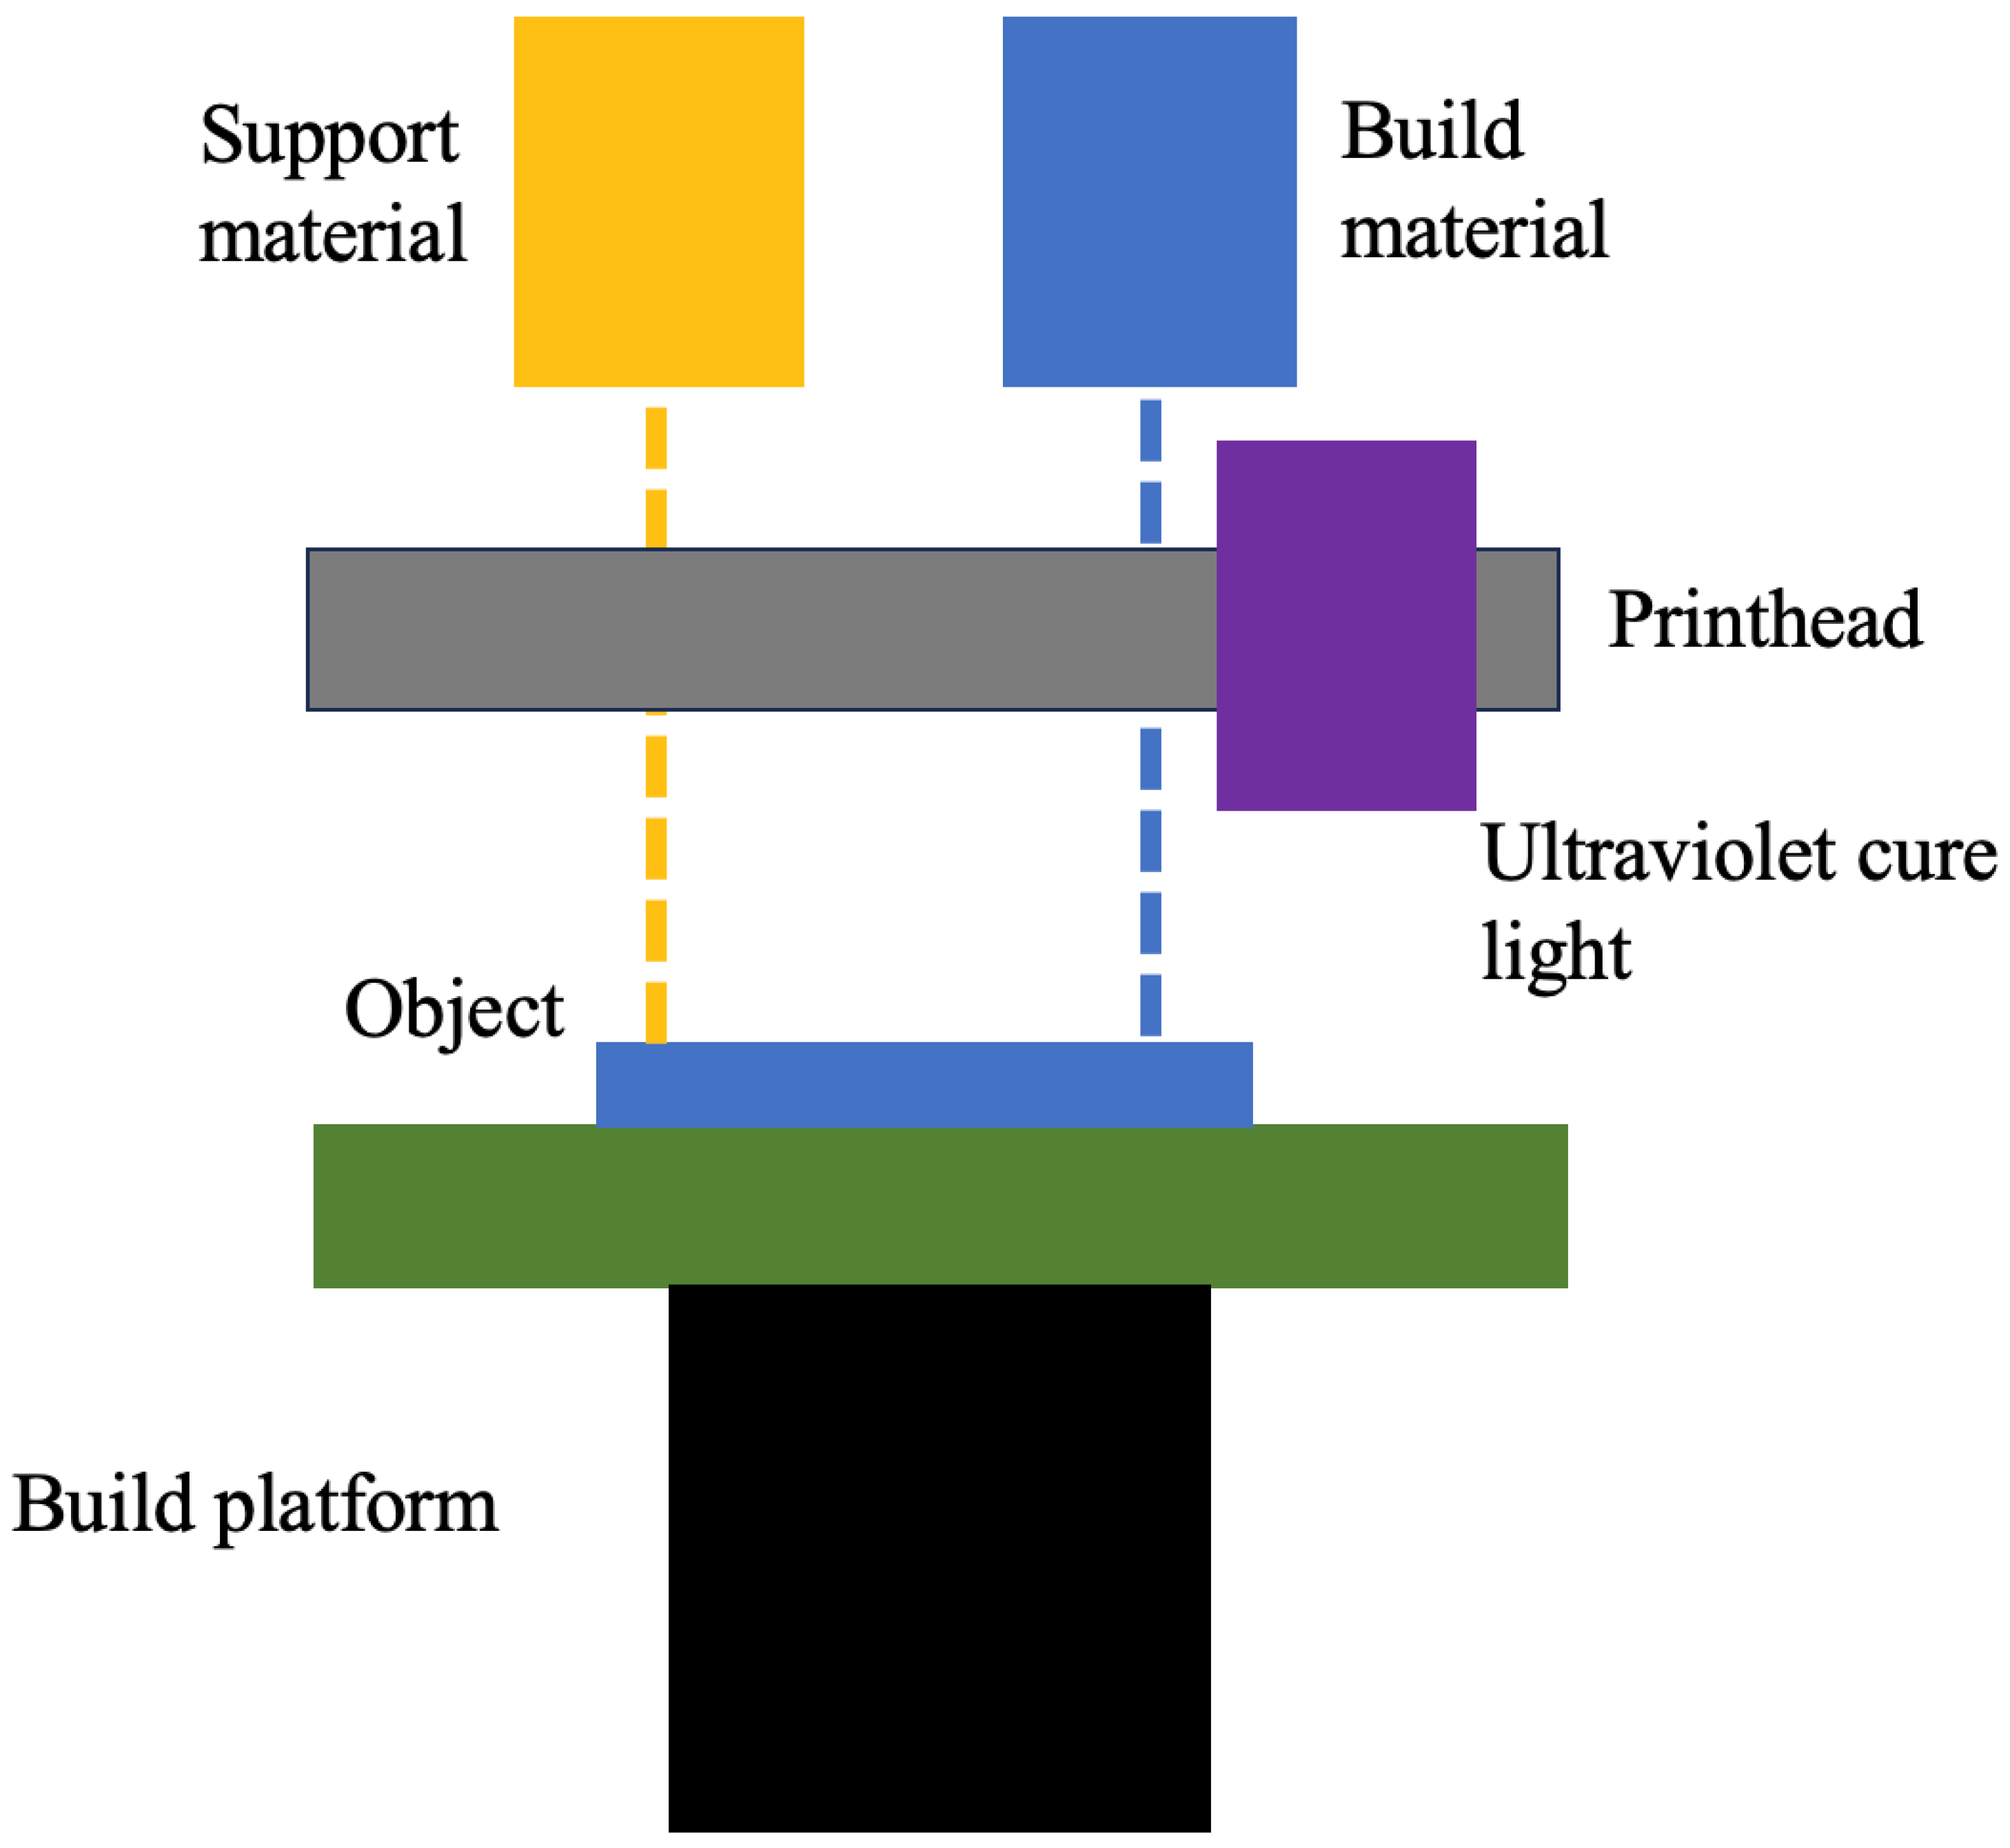
3.4. Material Jetting
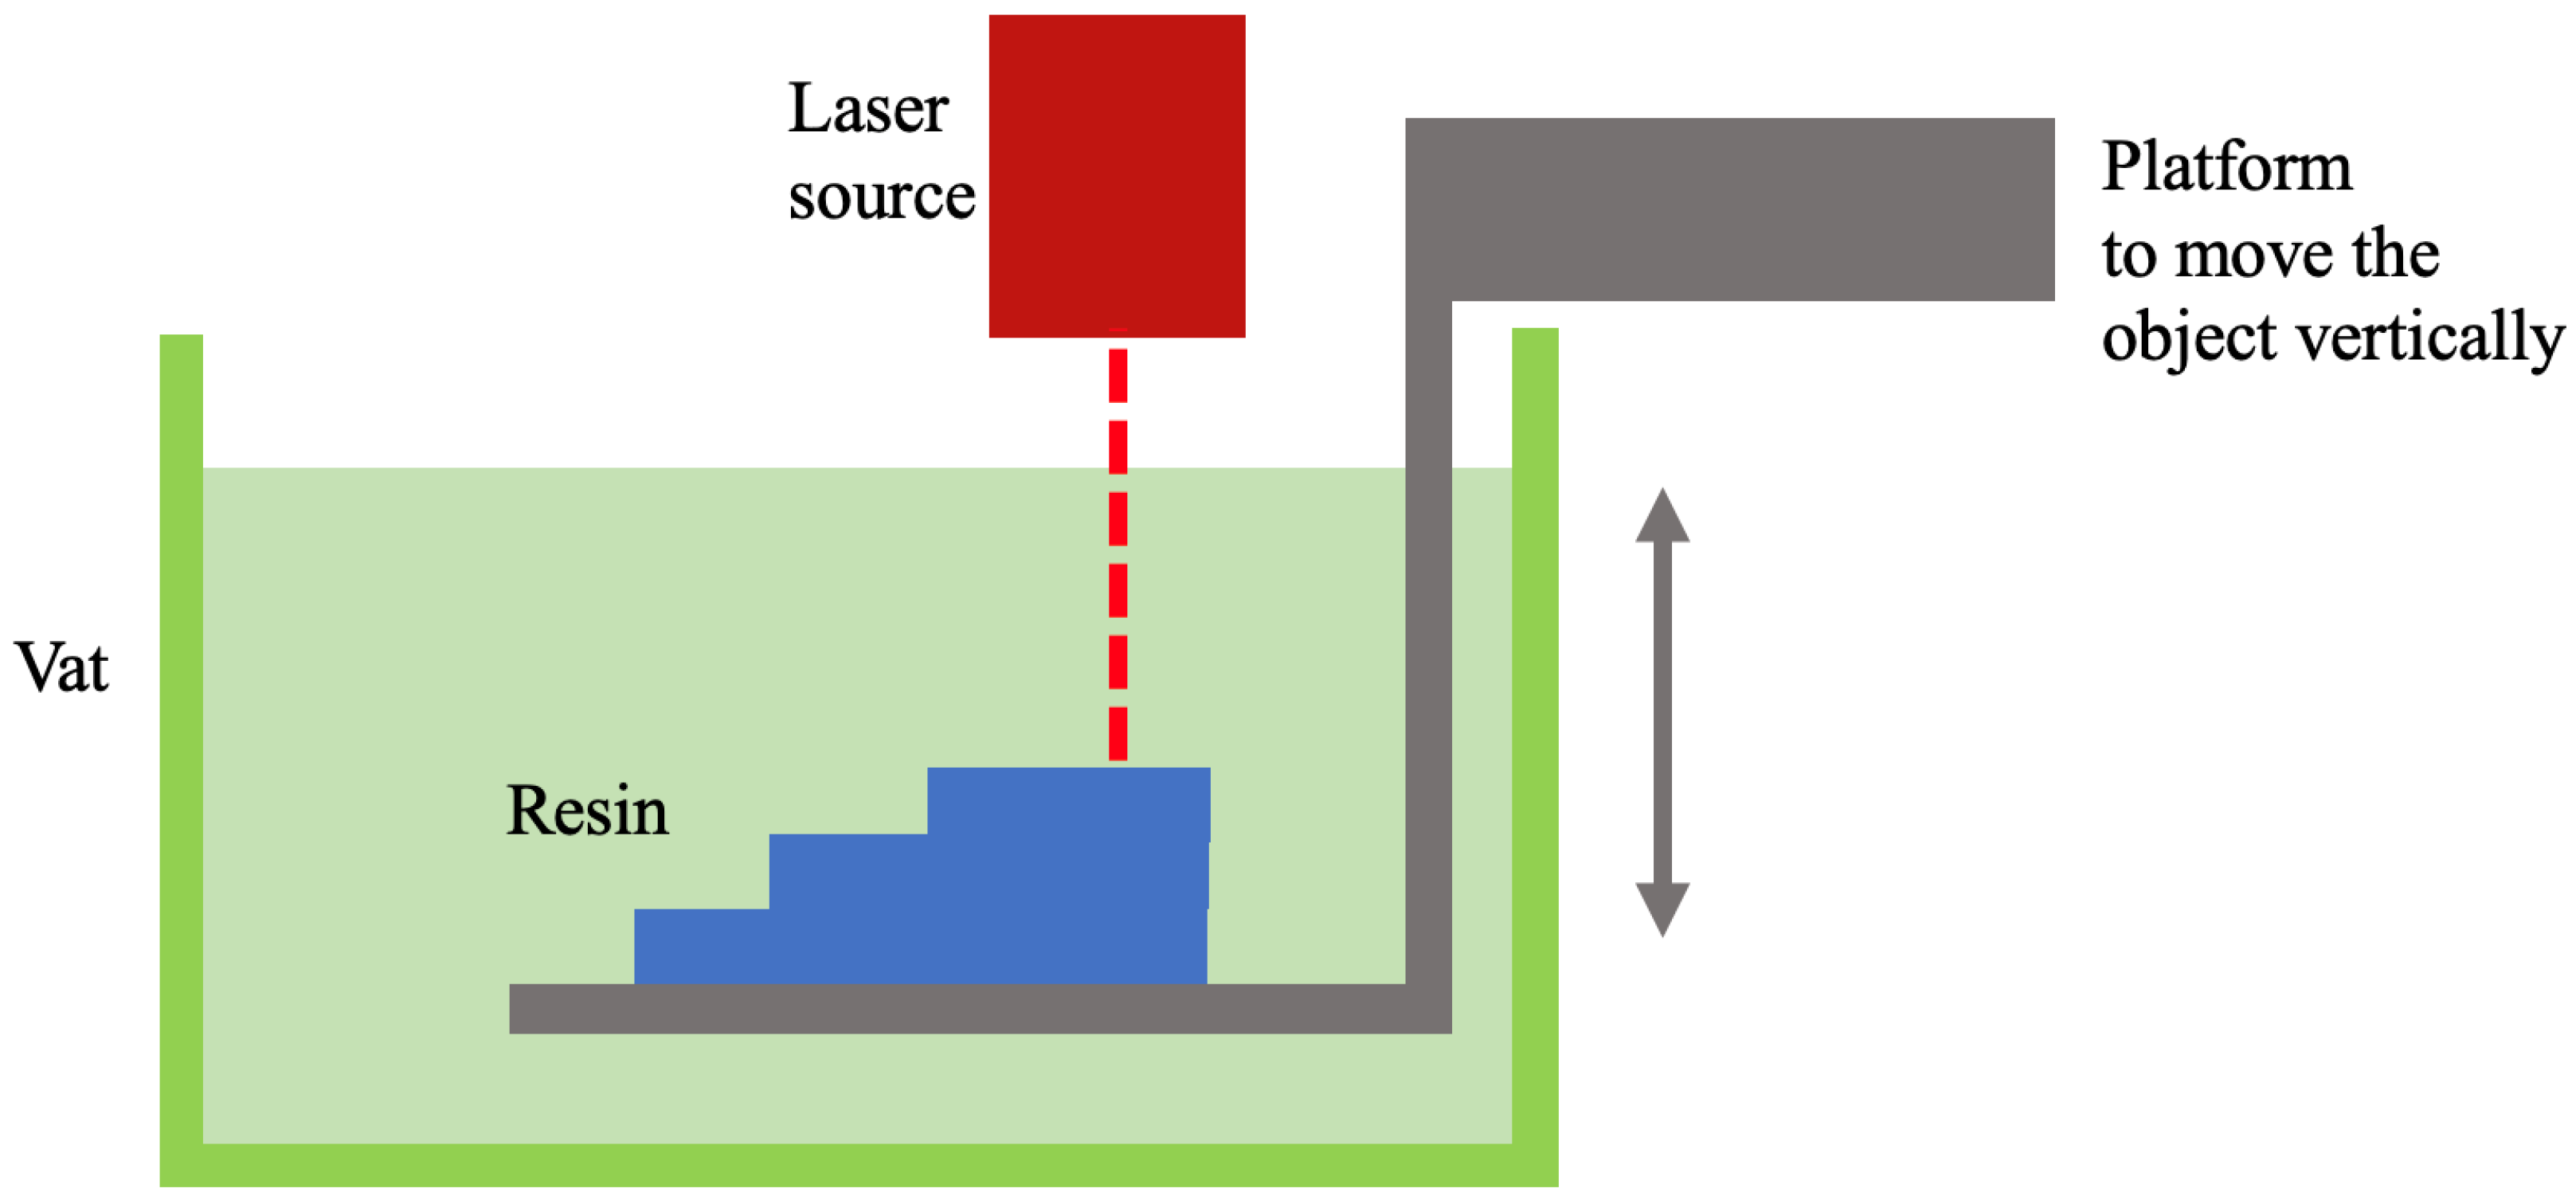
3.5. Vat Photopolymerization
3.6. Binder Jetting
3.7. Sheet Lamination
4. Three-Dimensional Topography Monitoring Technologies
4.1. Digital Image Correlation
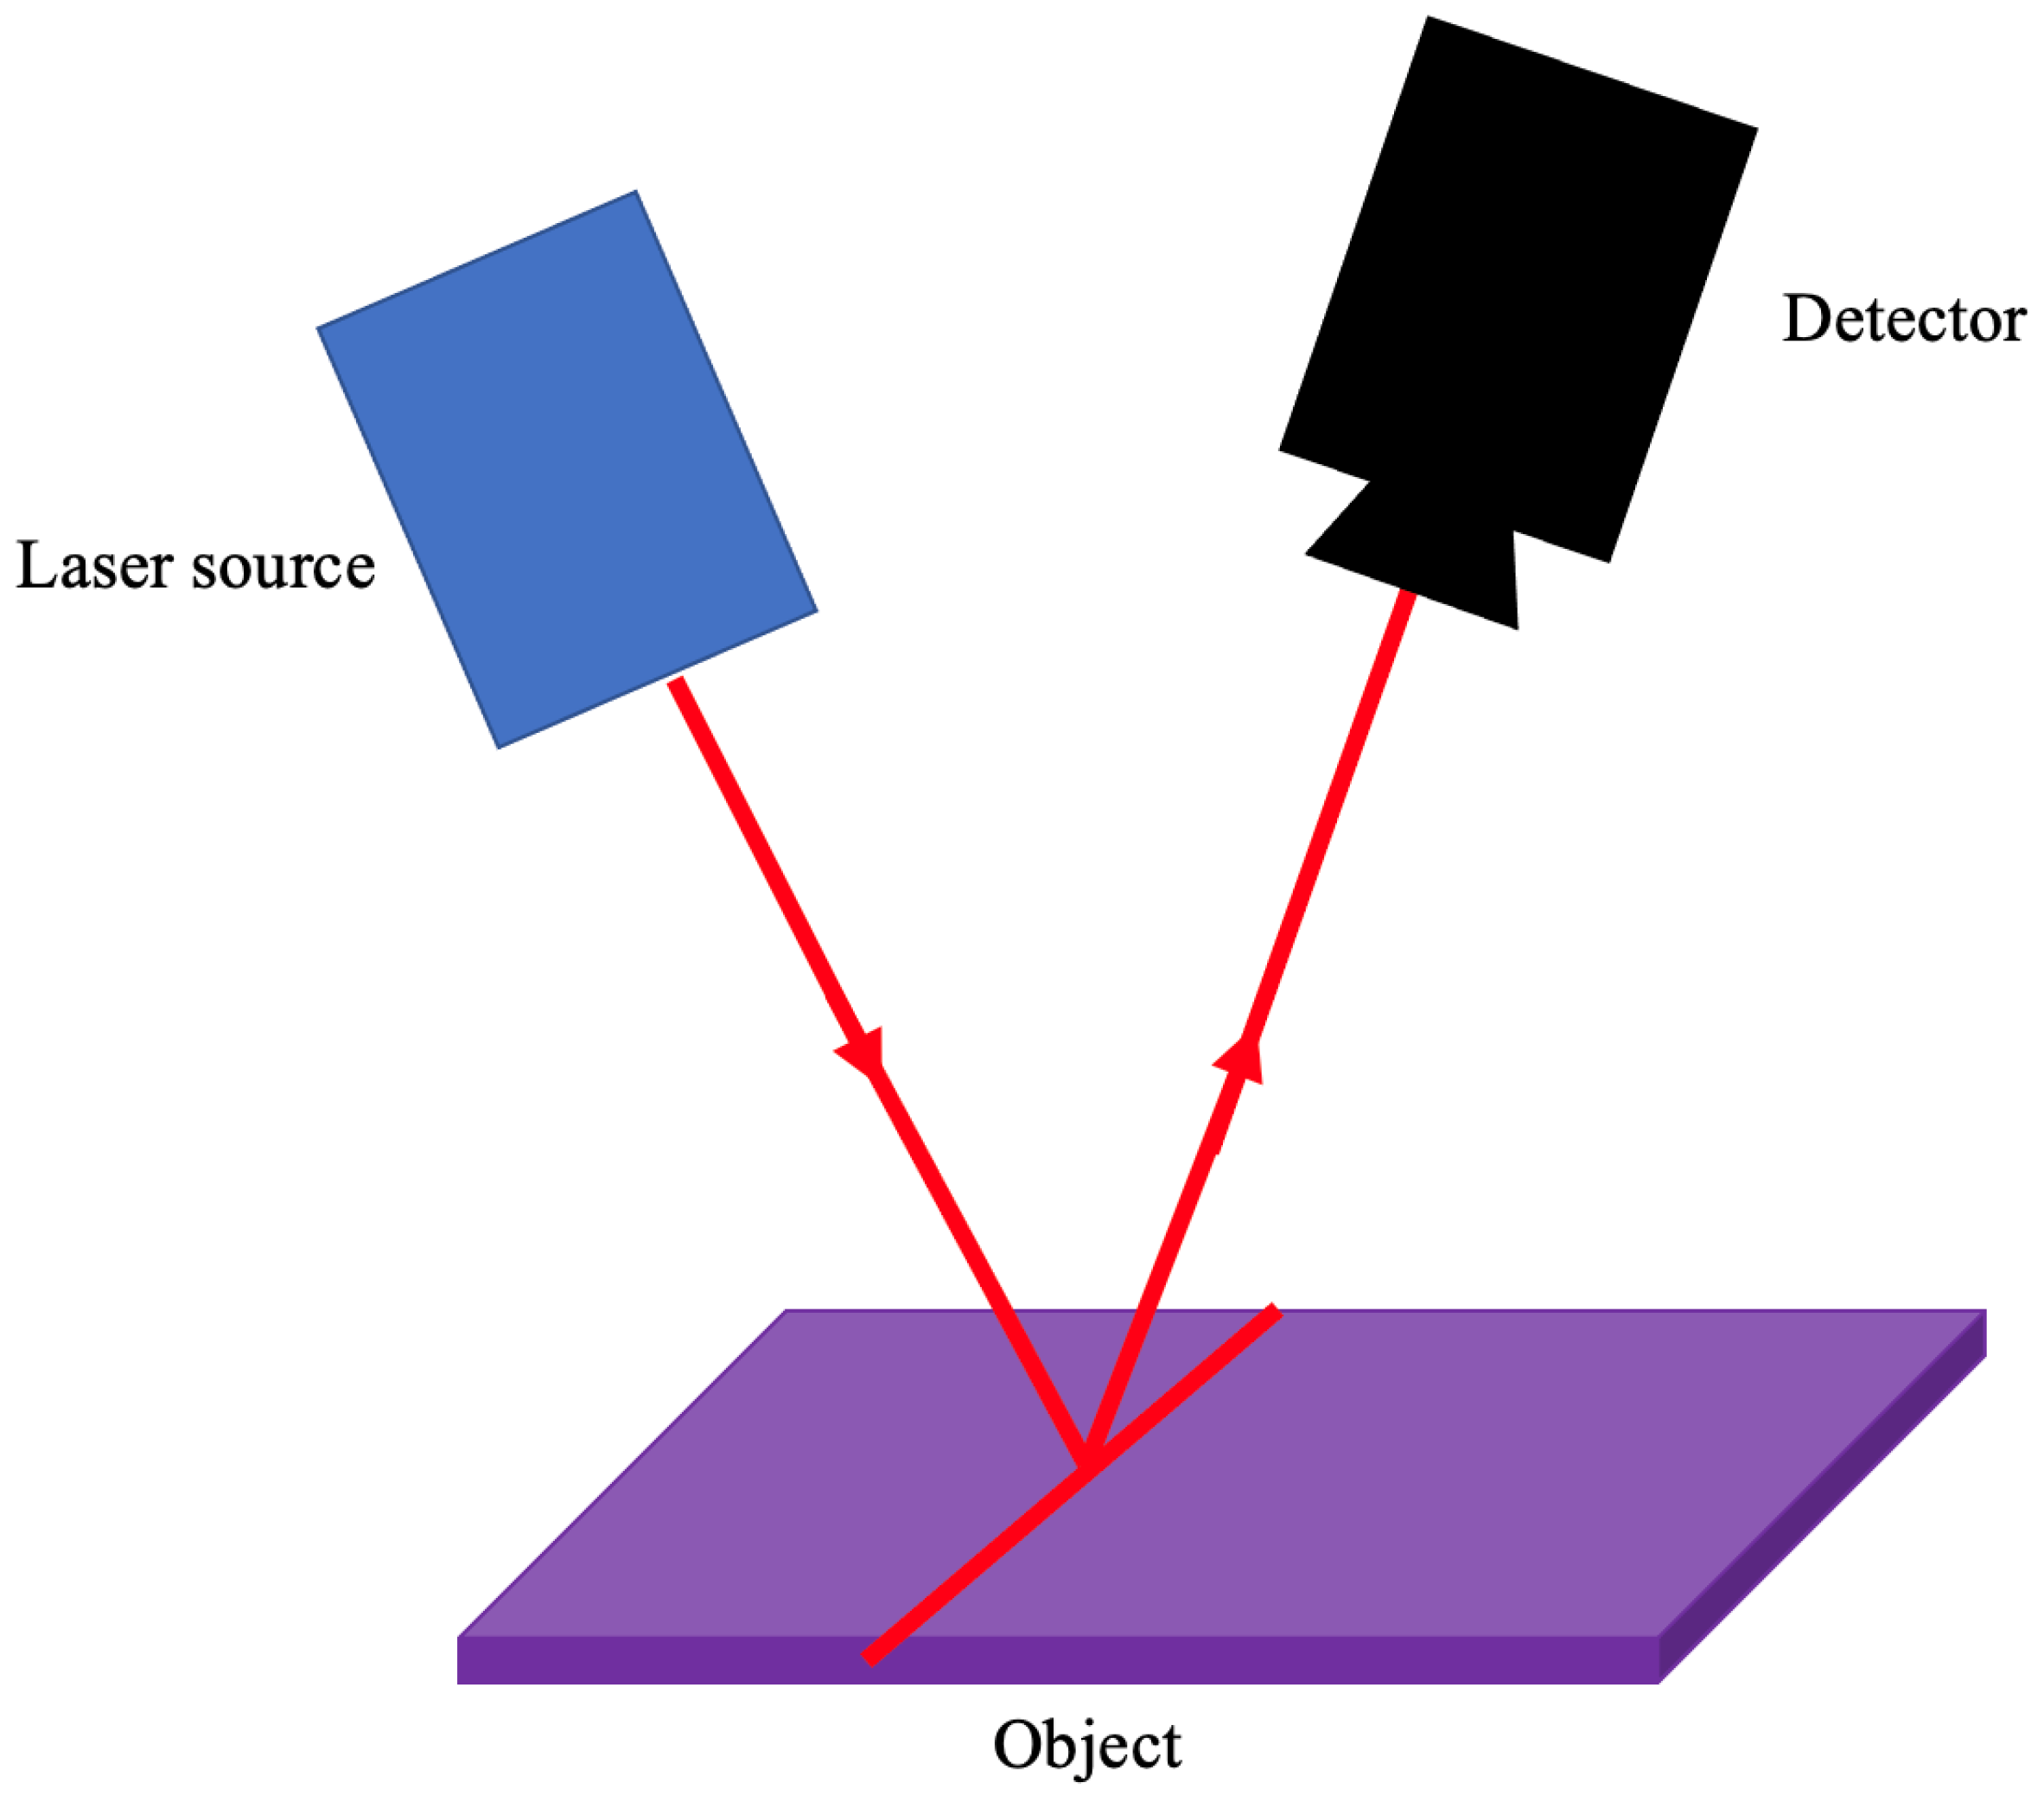
4.2. Laser Scanning
4.3. Structured Light
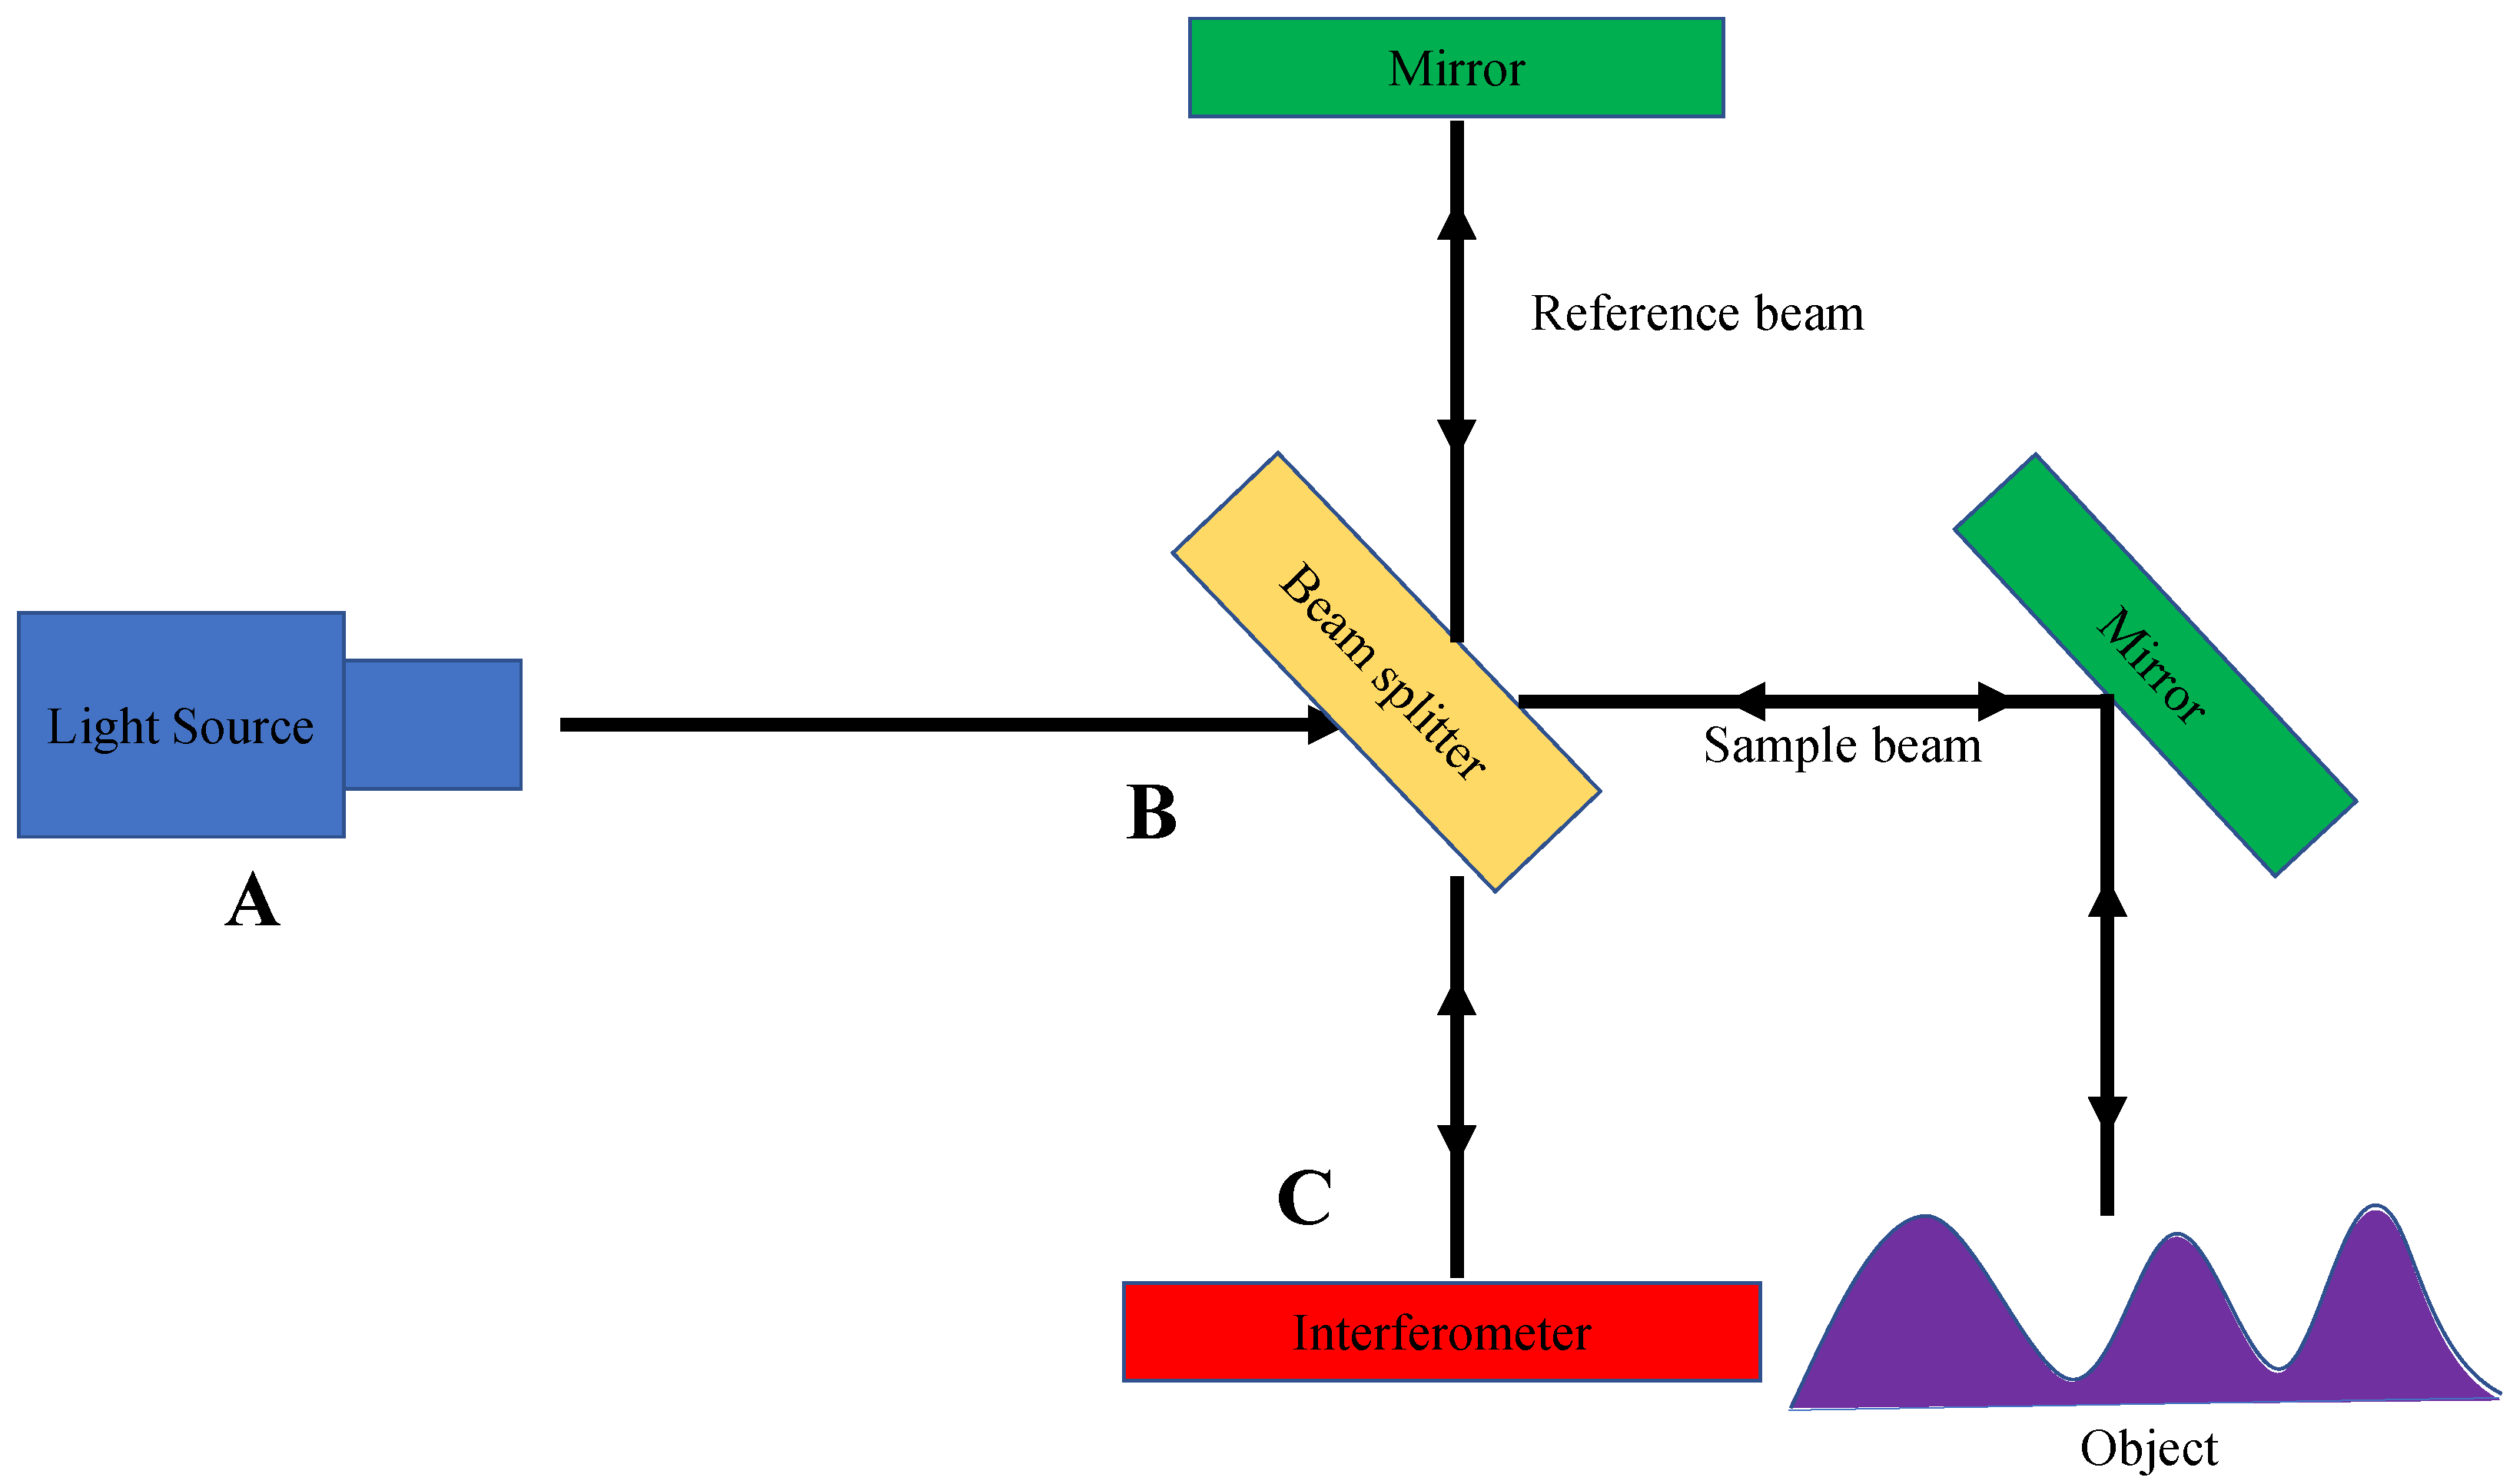
4.4. Optical Coherence Tomography
4.5. Data Processing and Analysis
5. In Situ 3D Surface Monitoring Technologies for Additive Manufacturing
5.1. In Situ 3D Monitoring for the Powder Bed Fusion Process: Current Practices and State of Closed-Loop Feedback Control
5.1.1. Current Practices: In Situ 3D Surface Monitoring for PBF
5.1.2. Current State of Closed-Loop Feedback Control for PBF Based on In Situ 3D Surface Monitoring
5.2. In Situ 3D Monitoring for Direct Energy Deposition Processes: Current Practices and the State of Closed-Loop Feedback Control
5.2.1. Current Practices: In Situ 3D Surface Monitoring for DED
5.2.2. Current State of Closed-Loop Feedback Control for DED Based on In Situ 3D Surface Monitoring
5.3. In Situ 3D Monitoring for Material Extrusion Processes: Current Practices and the State of Closed-Loop Feedback Control
5.3.1. Current Practices: In Situ 3D Surface Monitoring for Material Extrusion

| Article | Year of Publication | Three-Dimensional Monitoring Technology | In Situ Monitoring | Features Extracted | Precise Metrology | Closed-Loop Feedback Control | Accuracy of the Three-Dimensional Monitoring System |
|---|---|---|---|---|---|---|---|
| Li et al. [113] | 2018 | Laser confocal displacement meter | Yes | None (defects identified by visualization) | No | No | Not measured |
| Li et al. [114] | 2021 | Laser scanner | Yes | Geometric deviations from the CAD model | Yes | No | Mean and standard deviation of 3D deviation are and , respectively |
| Armstrong et al. [117] | 2019 | Laser scanner | Yes | Layer height and height difference from the CAD model | Yes | Yes | Not measured |
| Wi et al. [120] | 2020 | Structured light | No | Surface roughness | No | No | |
| Liu et al. [121] | 2022 | Structured light | Yes | Strain and stiffness | Yes | No | |
| Girard and Zhang [122] | 2025 | Structured light | Yes | Forced geometric error profile | Yes | Yes | Not measured |
| Holzmond and Li [123] | 2017 | 3D DIC | Yes | Height difference from the CAD model | Yes | No | Not measured |
5.3.2. Current State of Closed-Loop Feedback Control for Material Extrusion Based on In Situ 3D Surface Monitoring
5.4. In Situ 3D Monitoring for Material Jetting Processes: Current Practices and the State of Closed-Loop Feedback Control
5.4.1. Current Practices: 3D Surface Monitoring for Material Jetting
5.4.2. Current State of Closed-Loop Feedback Control Based on In Situ 3D Surface Monitoring for Material Jetting
6. Discussion
7. Summary
Author Contributions
Funding
Institutional Review Board Statement
Informed Consent Statement
Data Availability Statement
Acknowledgments
Conflicts of Interest
References
- Akbari, M.; Ha, N. Impact of additive manufacturing on the Vietnamese transportation industry: An exploratory study. Asian J. Shipp. Logist. 2020, 36, 78–88. [Google Scholar] [CrossRef]
- Khajavi, S.H. Additive manufacturing in the clothing industry: Towards sustainable new business models. Appl. Sci. 2021, 11, 8994. [Google Scholar] [CrossRef]
- Hohn, M.M.; Durach, C.F. Additive manufacturing in the apparel supply chain—Impact on supply chain governance and social sustainability. Int. J. Oper. Prod. Manag. 2021, 41, 1035–1059. [Google Scholar] [CrossRef]
- Özceylan, E.; Çetinkaya, C.; Demirel, N.; Sabırlıoğlu, O. Impacts of additive manufacturing on supply chain flow: A simulation approach in healthcare industry. Logistics 2017, 2, 1. [Google Scholar] [CrossRef]
- Pinna, C.; Ramundo, L.; Sisca, F.G.; Angioletti, C.; Taisch, M.; Terzi, S. Additive Manufacturing applications within Food industry: An actual overview and future opportunities. In Proceedings of the Summer School Francesco Turco, Naples, Italy, 13–15 September 2016; pp. 18–24. [Google Scholar]
- Mandache, C. Overview of non-destructive evaluation techniques for metal-based additive manufacturing. Mater. Sci. Technol. 2019, 35, 1007–1015. [Google Scholar] [CrossRef]
- Li, N.; Link, G.; Engler, M.; Jelonnek, J. Small-size coaxial resonant applicator for microwave heating assisted additive manufacturing. IEEE Trans. Microw. Theory Tech. 2021, 69, 4631–4638. [Google Scholar] [CrossRef]
- Ehlers, H.; Pelkner, M.; Thewes, R. Heterodyne eddy current testing using magnetoresistive sensors for additive manufacturing purposes. IEEE Sensors J. 2020, 20, 5793–5800. [Google Scholar] [CrossRef]
- Dwivedi, S.K.; Vishwakarma, M.; Soni, A. Advances and researches on non destructive testing: A review. Mater. Today Proc. 2018, 5, 3690–3698. [Google Scholar] [CrossRef]
- Buzug, T.M. Computed tomography. In Springer Handbook of Medical Technology; Springer: Berlin/Heidelberg, Germany, 2011; pp. 311–342. [Google Scholar]
- Ritman, E.L. Micro-computed tomography—Current status and developments. Annu. Rev. Biomed. Eng. 2004, 6, 185–208. [Google Scholar] [CrossRef]
- Raplee, J.; Plotkowski, A.; Kirka, M.M.; Dinwiddie, R.; Okello, A.; Dehoff, R.R.; Babu, S.S. Thermographic microstructure monitoring in electron beam additive manufacturing. Sci. Rep. 2017, 7, 43554. [Google Scholar] [CrossRef]
- Thomas, T. Roughness and function. Surf. Topogr. Metrol. Prop. 2013, 2, 014001. [Google Scholar] [CrossRef]
- Newton, L.; Senin, N.; Gomez, C.; Danzl, R.; Helmli, F.; Blunt, L.; Leach, R. Areal topography measurement of metal additive surfaces using focus variation microscopy. Addit. Manuf. 2019, 25, 365–389. [Google Scholar] [CrossRef]
- Cai, Y.; Xiong, J.; Chen, H.; Zhang, G. A review of in-situ monitoring and process control system in metal-based laser additive manufacturing. J. Manuf. Syst. 2023, 70, 309–326. [Google Scholar] [CrossRef]
- Özel, T. A review on in-situ process sensing and monitoring systems for fusion-based additive manufacturing. Int. J. Mechatron. Manuf. Syst. 2023, 16, 115–154. [Google Scholar] [CrossRef]
- Aydogan, B.; Chou, K. Review of In Situ Detection and Ex Situ Characterization of Porosity in Laser Powder Bed Fusion Metal Additive Manufacturing. Metals 2024, 14, 669. [Google Scholar] [CrossRef]
- Balhara, H.; Karthikeyan, A.; Hanchate, A.; Nakkina, T.G.; Bukkapatnam, S.T.S. Imaging systems and techniques for fusion-based metal additive manufacturing: A review. Front. Manuf. Technol. 2023, 3, 1271190. [Google Scholar] [CrossRef]
- Chen, L.; Bi, G.; Yao, X.; Su, J.; Tan, C.; Feng, W.; Benakis, M.; Chew, Y.; Moon, S.K. In-situ process monitoring and adaptive quality enhancement in laser additive manufacturing: A critical review. J. Manuf. Syst. 2024, 74, 527–574. [Google Scholar] [CrossRef]
- AbouelNour, Y.; Gupta, N. In-situ monitoring of sub-surface and internal defects in additive manufacturing: A review. Mater. Des. 2022, 222, 111063. [Google Scholar] [CrossRef]
- Zhang, Y.; Shen, S.; Li, H.; Hu, Y. Review of in situ and real-time monitoring of metal additive manufacturing based on image processing. Int. J. Adv. Manuf. Technol. 2022, 123, 1–20. [Google Scholar] [CrossRef]
- Xia, C.; Pan, Z.; Polden, J.; Li, H.; Xu, Y.; Chen, S.; Zhang, Y. A review on wire arc additive manufacturing: Monitoring, control and a framework of automated system. J. Manuf. Syst. 2020, 57, 31–45. [Google Scholar] [CrossRef]
- Lu, Q.Y.; Wong, C.H. Additive manufacturing process monitoring and control by non-destructive testing techniques: Challenges and in-process monitoring. Virtual Phys. Prototyp. 2018, 13, 39–48. [Google Scholar] [CrossRef]
- Everton, S.K.; Hirsch, M.; Stravroulakis, P.; Leach, R.K.; Clare, A.T. Review of in-situ process monitoring and in-situ metrology for metal additive manufacturing. Mater. Des. 2016, 95, 431–445. [Google Scholar] [CrossRef]
- Oleff, A.; Küster, B.; Stonis, M.; Overmeyer, L. Process monitoring for material extrusion additive manufacturing: A state-of-the-art review. Prog. Addit. Manuf. 2021, 6, 705–730. [Google Scholar] [CrossRef]
- Jacob, J.; Pejak Simunec, D.; Kandjani, A.E.; Trinchi, A.; Sola, A. A Review of Fused Filament Fabrication of Metal Parts (Metal FFF): Current Developments and Future Challenges. Technologies 2024, 12, 267. [Google Scholar] [CrossRef]
- Vora, H.D.; Sanyal, S. A comprehensive review: Metrology in additive manufacturing and 3D printing technology. Prog. Addit. Manuf. 2020, 5, 319–353. [Google Scholar] [CrossRef]
- Sun, S.; Brandt, M.; Easton, M. Powder bed fusion processes: An overview. Laser Addit. Manuf. 2017, 55–77. [Google Scholar] [CrossRef]
- Singh, D.D.; Mahender, T.; Reddy, A.R. Powder bed fusion process: A brief review. Mater. Today Proc. 2021, 46, 350–355. [Google Scholar] [CrossRef]
- Tang, M.; Pistorius, P.C.; Beuth, J.L. Prediction of lack-of-fusion porosity for powder bed fusion. Addit. Manuf. 2017, 14, 39–48. [Google Scholar] [CrossRef]
- Hou, Z.J.; Wang, Q.; Zhao, C.G.; Zheng, J.; Tian, J.M.; Ge, X.H.; Liu, Y.G. Online Monitoring Technology of Metal Powder Bed Fusion Processes: A Review. Materials 2022, 15, 7598. [Google Scholar] [CrossRef]
- Gibson, I.; Rosen, D.; Stucker, B.; Gibson, I.; Rosen, D.; Stucker, B. Directed energy deposition processes. In Additive Manufacturing Technologies: 3D Printing, Rapid Prototyping, and Direct Digital Manufacturing; Springer: New York, NY, USA, 2015; pp. 245–268. [Google Scholar]
- Ahn, D.G. Directed energy deposition (DED) process: State of the art. Int. J. Precis. Eng. Manuf.-Green Technol. 2021, 8, 703–742. [Google Scholar] [CrossRef]
- Dávila, J.L.; Neto, P.I.; Noritomi, P.Y.; Coelho, R.T.; da Silva, J.V.L. Hybrid manufacturing: A review of the synergy between directed energy deposition and subtractive processes. Int. J. Adv. Manuf. Technol. 2020, 110, 3377–3390. [Google Scholar] [CrossRef]
- Tang, Z.J.; Liu, W.W.; Wang, Y.W.; Saleheen, K.M.; Liu, Z.C.; Peng, S.T.; Zhang, Z.; Zhang, H.C. A review on in situ monitoring technology for directed energy deposition of metals. Int. J. Adv. Manuf. Technol. 2020, 108, 3437–3463. [Google Scholar] [CrossRef]
- Goh, G.D.; Yap, Y.L.; Tan, H.; Sing, S.L.; Goh, G.L.; Yeong, W.Y. Process–structure–properties in polymer additive manufacturing via material extrusion: A review. Crit. Rev. Solid State Mater. Sci. 2020, 45, 113–133. [Google Scholar] [CrossRef]
- Hsiang Loh, G.; Pei, E.; Gonzalez-Gutierrez, J.; Monzón, M. An overview of material extrusion troubleshooting. Appl. Sci. 2020, 10, 4776. [Google Scholar] [CrossRef]
- Gülcan, O.; Günaydın, K.; Tamer, A. The state of the art of material jetting—A critical review. Polymers 2021, 13, 2829. [Google Scholar] [CrossRef] [PubMed]
- Gibson, I.; Rosen, D.; Stucker, B.; Khorasani, M.; Gibson, I.; Rosen, D.; Stucker, B.; Khorasani, M. Material jetting. In Additive Manufacturing Technologies; Springer: Boston, MA, USA, 2021; pp. 203–235. [Google Scholar]
- Ogunsanya, M.; Isichei, J.; Parupelli, S.K.; Desai, S.; Cai, Y. In-Situ Droplet Monitoring Inkjet 3D Printing Process Using Image Analysis Machine Learning Models. Procedia Manuf. 2021, 53, 427–434. [Google Scholar] [CrossRef]
- Cunha, F.G.; Santos, T.G.; Xavier, J. In Situ Monitoring of Additive Manufacturing Using Digital Image Correlation: A Review. Materials 2021, 14, 1511. [Google Scholar] [CrossRef]
- Gibson, I.; Rosen, D.; Stucker, B.; Gibson, I.; Rosen, D.; Stucker, B. Vat photopolymerization processes. In Additive Manufacturing Technologies: 3D Printing, Rapid Prototyping, and Direct Digital Manufacturing; Springer: New York, NY, USA, 2015; pp. 63–106. [Google Scholar]
- Yang, F.; Kazi, A.; Marmo, A.; Grunlan, M.A.; Tai, B.L. Characterizing the separation behavior of photocurable PDMS on a hydrogel film during vat photopolymerization: A benchmark study. Addit. Manuf. 2022, 58, 103070. [Google Scholar] [CrossRef]
- Paral, S.K.; Lin, D.Z.; Cheng, Y.L.; Lin, S.C.; Jeng, J.Y. A Review of Critical Issues in High-Speed Vat Photopolymerization. Polymers 2023, 15, 2716. [Google Scholar] [CrossRef]
- Gibson, I.; Rosen, D.; Stucker, B.; Khorasani, M.; Gibson, I.; Rosen, D.; Stucker, B.; Khorasani, M. Binder jetting. In Additive Manufacturing Technologies; Springer: Boston, MA, USA, 2021; pp. 237–252. [Google Scholar]
- Mostafaei, A.; Elliott, A.M.; Barnes, J.E.; Li, F.; Tan, W.; Cramer, C.L.; Nandwana, P.; Chmielus, M. Binder jet 3D printing—Process parameters, materials, properties, modeling, and challenges. Prog. Mater. Sci. 2021, 119, 100707. [Google Scholar] [CrossRef]
- Konda Gokuldoss, P.; Kolla, S.; Eckert, J. Additive manufacturing processes: Selective laser melting, electron beam melting and binder jetting—Selection guidelines. Materials 2017, 10, 672. [Google Scholar] [CrossRef] [PubMed]
- Parab, N.D.; Barnes, J.E.; Zhao, C.; Cunningham, R.W.; Fezzaa, K.; Rollett, A.D.; Sun, T. Real time observation of binder jetting printing process using high-speed X-ray imaging. Sci. Rep. 2019, 9, 2499. [Google Scholar] [CrossRef]
- Gibson, I.; Rosen, D.W.; Stucker, B.; Gibson, I.; Rosen, D.W.; Stucker, B. Sheet lamination processes. In Additive Manufacturing Technologies: Rapid Prototyping to Direct Digital Manufacturing; Springer: Boston, MA, USA, 2010; pp. 223–252. [Google Scholar]
- Gibson, I.; Rosen, D.; Stucker, B.; Khorasani, M.; Gibson, I.; Rosen, D.; Stucker, B.; Khorasani, M. Sheet lamination. In Additive Manufacturing Technologies; Springer: Boston, MA, USA, 2021; pp. 253–283. [Google Scholar]
- Hu, Z.; Xie, H.; Lu, J.; Hua, T.; Zhu, J. Study of the performance of different subpixel image correlation methods in 3D digital image correlation. Appl. Opt. 2010, 49, 4044–4051. [Google Scholar] [CrossRef] [PubMed]
- Sutton, M.A.; Yan, J.; Tiwari, V.; Schreier, H.; Orteu, J.J. The effect of out-of-plane motion on 2D and 3D digital image correlation measurements. Opt. Lasers Eng. 2008, 46, 746–757. [Google Scholar] [CrossRef]
- Helfrick, M.N.; Niezrecki, C.; Avitabile, P.; Schmidt, T. 3D digital image correlation methods for full-field vibration measurement. Mech. Syst. Signal Process. 2011, 25, 917–927. [Google Scholar] [CrossRef]
- Gu, G. A comparative study of random speckle pattern simulation models in digital image correlation. Optik 2015, 126, 3713–3716. [Google Scholar] [CrossRef]
- Axelsson, P. Processing of laser scanner data—Algorithms and applications. ISPRS J. Photogramm. Remote Sens. 1999, 54, 138–147. [Google Scholar] [CrossRef]
- França, J.G.D.; Gazziro, M.A.; Ide, A.N.; Saito, J.H. A 3D scanning system based on laser triangulation and variable field of view. In Proceedings of the IEEE International Conference on Image Processing 2005, Genova, Italy, 14 September 2005; Volume 1, pp. 1–425. [Google Scholar]
- Acosta, D.; García, O.; Aponte, J. Laser triangulation for shape acquisition in a 3D scanner plus scan. In Proceedings of the Electronics, Robotics and Automotive Mechanics Conference (CERMA’06), Cuernavaca, Mexico, 26–29 September 2006; Volume 2, pp. 14–19. [Google Scholar]
- Payeur, P.; Desjardins, D. Structured light stereoscopic imaging with dynamic pseudo-random patterns. In Proceedings of the Image Analysis and Recognition: 6th International Conference, ICIAR 2009, Halifax, NS, Canada, 6–8 July 2009; Proceedings 6. Springer: Berlin/Heidelberg, Germany, 2009; pp. 687–696. [Google Scholar]
- Salvi, J.; Pages, J.; Batlle, J. Pattern codification strategies in structured light systems. Pattern Recognit. 2004, 37, 827–849. [Google Scholar] [CrossRef]
- Carrihill, B.; Hummel, R. Experiments with the intensity ratio depth sensor. Comput. Vision Graph. Image Process. 1985, 32, 337–358. [Google Scholar] [CrossRef]
- Huang, P.S.; Zhang, S. Fast three-step phase-shifting algorithm. Appl. Opt. 2006, 45, 5086–5091. [Google Scholar] [CrossRef]
- Zhang, S.; Huang, P.S. Novel method for structured light system calibration. Opt. Eng. 2006, 45, 083601. [Google Scholar]
- Li, B.; Karpinsky, N.; Zhang, S. Novel calibration method for structured-light system with an out-of-focus projector. Appl. Opt. 2014, 53, 3415–3426. [Google Scholar] [CrossRef]
- Zhang, S. Recent progresses on real-time 3D shape measurement using digital fringe projection techniques. Opt. Lasers Eng. 2010, 48, 149–158. [Google Scholar] [CrossRef]
- Lu, L.; Suresh, V.; Zheng, Y.; Wang, Y.; Xi, J.; Li, B. Motion induced error reduction methods for phase shifting profilometry: A review. Opt. Lasers Eng. 2021, 141, 106573. [Google Scholar] [CrossRef]
- Dickins, A.; Widjanarko, T.; Sims-Waterhouse, D.; Thompson, A.; Lawes, S.; Senin, N.; Leach, R. Multi-view fringe projection system for surface topography measurement during metal powder bed fusion. J. Opt. Soc. Am. A 2020, 37, B93. [Google Scholar] [CrossRef] [PubMed]
- Rebolleda, G.; Diez-Alvarez, L.; Casado, A.; Sánchez-Sánchez, C.; De Dompablo, E.; González-López, J.J.; Muñoz-Negrete, F.J. OCT: New perspectives in neuro-ophthalmology. Saudi J. Ophthalmol. 2015, 29, 9–25. [Google Scholar] [CrossRef]
- Schmitt, J.M. Optical coherence tomography (OCT): A review. IEEE J. Sel. Top. Quantum Electron. 1999, 5, 1205–1215. [Google Scholar] [CrossRef]
- Podoleanu, A.G.; Rogers, J.A.; Jackson, D.A.; Dunne, S. Three dimensional OCT images from retina and skin. Opt. Express 2000, 7, 292–298. [Google Scholar] [CrossRef]
- Fujimoto, J.G.; Drexler, W.; Schuman, J.S.; Hitzenberger, C.K. Optical Coherence Tomography (OCT) in ophthalmology: Introduction. Opt. Express 2009, 17, 3978–3979. [Google Scholar] [CrossRef]
- Fujimoto, J.; Swanson, E. The development, commercialization, and impact of optical coherence tomography. Investig. Ophthalmol. Vis. Sci. 2016, 57, OCT1–OCT13. [Google Scholar] [CrossRef]
- Podoleanu, A.G. Optical coherence tomography. J. Microsc. 2012, 247, 209–219. [Google Scholar] [CrossRef] [PubMed]
- Zorin, I.; Brouczek, D.; Geier, S.; Nohut, S.; Eichelseder, J.; Huss, G.; Schwentenwein, M.; Heise, B. Mid-infrared optical coherence tomography as a method for inspection and quality assurance in ceramics additive manufacturing. Open Ceram. 2022, 12, 100311. [Google Scholar] [CrossRef]
- Bartlett, J.L.; Jarama, A.; Jones, J.; Li, X. Prediction of microstructural defects in additive manufacturing from powder bed quality using digital image correlation. Mater. Sci. Eng. A 2020, 794, 140002. [Google Scholar] [CrossRef]
- Ma, D.; Tian, X.; Chang, T.; Hussain, S.; Xia, L.; Han, J. In-Situ Process Monitoring and Optimization for Extrusion-Based Silicone Additive Manufacturing. In International Manufacturing Science and Engineering Conference; American Society of Mechanical Engineers: New York, NY, USA, 2024. [Google Scholar] [CrossRef]
- Williams, R.J.; Davies, C.M.; Hooper, P.A. In situ monitoring of the layer height in laser powder bed fusion. Mater. Des. Process. Commun. 2021, 3, e173. [Google Scholar] [CrossRef]
- Gardner, M.R.; Lewis, A.; Park, J.; McElroy, A.B.; Estrada, A.D.; Fish, S.; Beaman, J.J.; Milner, T.E. In situ process monitoring in selective laser sintering using optical coherence tomography. Opt. Eng. 2018, 57, 041407. [Google Scholar] [CrossRef]
- Foster, B.; Reutzel, E.; Nassar, A.; Hall, B.; Brown, S.; Dickman, C. Optical, layerwise monitoring of powder bed fusion. In Proceedings of the 2014 International Solid Freeform Fabrication Symposium, Austin, TX, USA, 4–6 August 2014. [Google Scholar]
- Southon, N.; Stavroulakis, P.; Goodridge, R.; Leach, R. In-process measurement and monitoring of a polymer laser sintering powder bed with fringe projection. Mater. Des. 2018, 157, 227–234. [Google Scholar] [CrossRef]
- Zhang, H.; Vallabh, C.K.P.; Xiong, Y.; Zhao, X. A systematic study and framework of fringe projection profilometry with improved measurement performance for in-situ LPBF process monitoring. Measurement 2022, 191, 110796. [Google Scholar] [CrossRef]
- Zhang, H.; Vallabh, C.K.P.; Zhao, X. Machine learning enhanced high dynamic range fringe projection profilometry for in-situ layer-wise surface topography measurement during LPBF additive manufacturing. Precis. Eng. 2023, 84, 1–14. [Google Scholar] [CrossRef]
- Land II, W.S.; Zhang, B.; Ziegert, J.; Davies, A. In-situ metrology system for laser powder bed fusion additive process. Procedia Manuf. 2015, 1, 393–403. [Google Scholar] [CrossRef]
- Liu, Y.; Blunt, L.; Zhang, Z.; Rahman, H.A.; Gao, F.; Jiang, X. In-situ areal inspection of powder bed for electron beam fusion system based on fringe projection profilometry. Addit. Manuf. 2020, 31, 100940. [Google Scholar] [CrossRef]
- Zhang, B.; Ziegert, J.; Farahi, F.; Davies, A. In situ surface topography of laser powder bed fusion using fringe projection. Addit. Manuf. 2016, 12, 100–107. [Google Scholar] [CrossRef]
- Kalms, M.; Narita, R.; Thomy, C.; Vollertsen, F.; Bergmann, R.B. New approach to evaluate 3D laser printed parts in powder bed fusion-based additive manufacturing in-line within closed space. Addit. Manuf. 2019, 26, 161–165. [Google Scholar] [CrossRef]
- Li, Z.; Liu, X.; Wen, S.; He, P.; Zhong, K.; Wei, Q.; Shi, Y.; Liu, S. In situ 3D monitoring of geometric signatures in the powder-bed-fusion additive manufacturing process via vision sensing methods. Sensors 2018, 18, 1180. [Google Scholar] [CrossRef]
- Remani, A.; Rossi, A.; Peña, F.; Thompson, A.; Dardis, J.; Jones, N.; Senin, N.; Leach, R. In-situ monitoring of laser-based powder bed fusion using fringe projection. Addit. Manuf. 2024, 90, 104334. [Google Scholar] [CrossRef]
- Liu, Y.; Blunt, L.; Gao, F.; Jiang, X. High-dynamic-range 3D measurement for E-beam fusion additive manufacturing based on SVM intelligent fringe projection system. Surf. Topogr. Metrol. Prop. 2021, 9, 034002. [Google Scholar] [CrossRef]
- Kanko, J.A.; Sibley, A.P.; Fraser, J.M. In situ morphology-based defect detection of selective laser melting through inline coherent imaging. J. Mater. Process. Technol. 2016, 231, 488–500. [Google Scholar] [CrossRef]
- DePond, P.J.; Guss, G.; Ly, S.; Calta, N.P.; Deane, D.; Khairallah, S.; Matthews, M.J. In situ measurements of layer roughness during laser powder bed fusion additive manufacturing using low coherence scanning interferometry. Mater. Des. 2018, 154, 347–359. [Google Scholar] [CrossRef]
- Guan, G.; Hirsch, M.; Lu, Z.H.; Childs, D.T.; Matcher, S.J.; Goodridge, R.; Groom, K.M.; Clare, A.T. Evaluation of selective laser sintering processes by optical coherence tomography. Mater. Des. 2015, 88, 837–846. [Google Scholar] [CrossRef]
- Lewis, A.; Gardner, M.; McElroy, A.; Milner, T.; Fish, S.; Beaman, J. In-situ process monitoring and ex-situ part quality assessment of selective laser sintering using optical coherence tomography. In Proceedings of the 2016 International Solid Freeform Fabrication Symposium, Austin, TX, USA, 8–10 August 2016. [Google Scholar]
- Eschner, E.; Staudt, T.; Schmidt, M. 3D particle tracking velocimetry for the determination of temporally resolved particle trajectories within laser powder bed fusion of metals. Int. J. Extrem. Manuf. 2019, 1, 035002. [Google Scholar] [CrossRef]
- Welch, G.; Bishop, G. An Introduction to the Kalman Filter; University of North Carolina: Chapel Hill, NC, USA, 1995. [Google Scholar]
- Suresh, V.; Wang, Y.; Li, B. High-dynamic-range 3D shape measurement utilizing the transitioning state of digital micromirror device. Opt. Lasers Eng. 2018, 107, 176–181. [Google Scholar] [CrossRef]
- Dabov, K.; Foi, A.; Katkovnik, V.; Egiazarian, K. Image denoising with block-matching and 3D filtering. In Proceedings of the SPIE—The International Society for Optical Engineering, Image Processing: Algorithms and Systems, Neural Networks, and Machine Learning, San Jose, CA, USA, 25–26 January 2006; Volume 6064, pp. 354–365. [Google Scholar]
- Wang, R.; Standfield, B.; Dou, C.; Law, A.C.; Kong, Z.J. Real-time process monitoring and closed-loop control on laser power via a customized laser powder bed fusion platform. Addit. Manuf. 2023, 66, 103449. [Google Scholar] [CrossRef]
- Vasileska, E.; Demir, A.G.; Colosimo, B.M.; Previtali, B. Layer-wise control of selective laser melting by means of inline melt pool area measurements. J. Laser Appl. 2020, 32, 022057. [Google Scholar] [CrossRef]
- Shkoruta, A.; Mishra, S.; Rock, S.J. Real-Time Image-Based Feedback Control of Laser Powder Bed Fusion. ASME Lett. Dyn. Syst. Control 2021, 2, 021001. [Google Scholar] [CrossRef]
- Montazeri, M.; Yavari, R.; Rao, P.; Boulware, P. In-Process Monitoring of Material Cross-Contamination Defects in Laser Powder Bed Fusion. J. Manuf. Sci. Eng. 2018, 140, 111001. [Google Scholar] [CrossRef]
- Guerra, M.G.; Errico, V.; Fusco, A.; Lavecchia, F.; Campanelli, S.L.; Galantucci, L.M. High resolution-optical tomography for in-process layerwise monitoring of a laser-powder bed fusion technology. Addit. Manuf. 2022, 55, 102850. [Google Scholar] [CrossRef]
- Gaikwad, A.; Williams, R.J.; de Winton, H.; Bevans, B.D.; Smoqi, Z.; Rao, P.; Hooper, P.A. Multi phenomena melt pool sensor data fusion for enhanced process monitoring of laser powder bed fusion additive manufacturing. Mater. Des. 2022, 221, 110919. [Google Scholar] [CrossRef]
- Zou, Z.; Zhang, K.; Liu, T.; Li, J.; Zhu, Z.; Wei, H.; Lu, Y.; Liao, W. In situ monitoring with melt pool data based on multi-signal fusion method in laser powder bed fusion. Measurement 2024, 234, 114877. [Google Scholar] [CrossRef]
- Wang, P.; Yang, Y.; Moghaddam, N.S. Process modeling in laser powder bed fusion towards defect detection and quality control via machine learning: The state-of-the-art and research challenges. J. Manuf. Process. 2022, 73, 961–984. [Google Scholar] [CrossRef]
- Liu, C.; Roux, L.L.; Ji, Z.; Kerfriden, P.; Lacan, F.; Bigot, S. Machine Learning-enabled feedback loops for metal powder bed fusion additive manufacturing. Procedia Comput. Sci. 2020, 176, 2586–2595. [Google Scholar] [CrossRef]
- Heralić, A.; Christiansson, A.K.; Lennartson, B. Height control of laser metal-wire deposition based on iterative learning control and 3D scanning. Opt. Lasers Eng. 2012, 50, 1230–1241. [Google Scholar] [CrossRef]
- Wallén, J. Estimation-Based Iterative Learning Control. Ph.D. Thesis, Linköping University, Linköping, Sweden, 2011. [Google Scholar]
- Tang, S.; Wang, G.; Zhang, H. In situ 3D monitoring and control of geometric signatures in wire and arc additive manufacturing. Surf. Topogr. Metrol. Prop. 2019, 7, 025013. [Google Scholar] [CrossRef]
- Binega, E.; Yang, L.; Sohn, H.; Cheng, J.C. Online geometry monitoring during directed energy deposition additive manufacturing using laser line scanning. Precis. Eng. 2022, 73, 104–114. [Google Scholar] [CrossRef]
- Zhang, X.; Shen, W.; Suresh, V.; Hamilton, J.; Yeh, L.H.; Jiang, X.; Zhang, Z.; Li, Q.; Li, B.; Rivero, I.V.; et al. In situ monitoring of direct energy deposition via structured light system and its application in remanufacturing industry. Int. J. Adv. Manuf. Technol. 2021, 116, 959–974. [Google Scholar] [CrossRef]
- Akbari, M.; Kovacevic, R. Closed loop control of melt pool width in robotized laser powder–directed energy deposition process. Int. J. Adv. Manuf. Technol. 2019, 104, 2887–2898. [Google Scholar] [CrossRef]
- Gibson, B.T.; Bandari, Y.K.; Richardson, B.S.; Henry, W.C.; Vetland, E.J.; Sundermann, T.W.; Love, L.J. Melt pool size control through multiple closed-loop modalities in laser-wire directed energy deposition of Ti-6Al-4V. Addit. Manuf. 2020, 32, 100993. [Google Scholar] [CrossRef]
- Li, L.; McGuan, R.; Kavehpour, P.; Candler, R. Precision enhancement of 3D printing via in situ metrology. In Proceedings of the 2018 International Solid Freeform Fabrication Symposium, Austin, TX, USA, 13–15 August 2018. [Google Scholar]
- Li, L.; McGuan, R.; Isaac, R.; Kavehpour, P.; Candler, R. Improving precision of material extrusion 3D printing by in-situ monitoring & predicting 3D geometric deviation using conditional adversarial networks. Addit. Manuf. 2021, 38, 101695. [Google Scholar]
- Besl, P.J.; McKay, N.D. Method for registration of 3-D shapes. In Proceedings of the Sensor Fusion IV: Control Paradigms and Data Structures, Boston, MA, USA, 12–15 November 1991; SPIE: Bellingham, DC, USA, 1992; Volume 1611, pp. 586–606. [Google Scholar]
- Isola, P.; Zhu, J.Y.; Zhou, T.; Efros, A.A. Image-to-image translation with conditional adversarial networks. In Proceedings of the IEEE Conference on Computer Vision and Pattern Recognition, Honolulu, HI, USA, 21–26 July 2017; pp. 1125–1134. [Google Scholar]
- Armstrong, A.A.; Norato, J.; Alleyne, A.G.; Johnson, A.J.W. Direct process feedback in extrusion-based 3D bioprinting. Biofabrication 2019, 12, 015017. [Google Scholar] [CrossRef]
- Nuchitprasitchai, S. An Algorithm for Reconstructing Three-Dimensional Images from Overlapping Two-Dimensional Intensity Measurements with Relaxed Camera Positioning Requirements, with Application to Additive Manufacturing. Ph.D. Thesis, Michigan Technological University, Houghton, MI, USA, 2017. ISBN 9780355316131. [Google Scholar]
- Nuchitprasitchai, S.; Roggemann, M.; Pearce, J.M. Factors effecting real-time optical monitoring of fused filament 3D printing. Prog. Addit. Manuf. 2017, 2, 133–149. [Google Scholar] [CrossRef]
- Wi, K.; Suresh, V.; Wang, K.; Li, B.; Qin, H. Quantifying quality of 3D printed clay objects using a 3D structured light scanning system. Addit. Manuf. 2020, 32, 100987. [Google Scholar] [CrossRef]
- Liu, X.; Kan, C.; Ye, Z. Real-time multiscale prediction of structural performance in material extrusion additive manufacturing. Addit. Manuf. 2022, 49, 102503. [Google Scholar] [CrossRef]
- Girard, J.; Zhang, S. Fast error detection method for additive manufacturing process monitoring using structured light three dimensional imaging technique. Opt. Lasers Eng. 2025, 184, 108609. [Google Scholar] [CrossRef]
- Holzmond, O.; Li, X. In situ real time defect detection of 3D printed parts. Addit. Manuf. 2017, 17, 135–142. [Google Scholar] [CrossRef]
- Niblack, W. An Introduction to Digital Image Processing; Strandberg Publishing Company: Hovedstaden Denmark, 1985. [Google Scholar]
- Pan, B.; Qian, K.; Xie, H.; Asundi, A. Two-dimensional digital image correlation for in-plane displacement and strain measurement: A review. Meas. Sci. Technol. 2009, 20, 062001. [Google Scholar] [CrossRef]
- Faes, M.; Abbeloos, W.; Vogeler, F.; Valkenaers, H.; Coppens, K.; Goedemé, T.; Ferraris, E. Process Monitoring of Extrusion Based 3D Printing via Laser Scanning. arXiv 2014, arXiv:1612.02219. [Google Scholar] [CrossRef]
- Kucukdeger, E.; Johnson, B.N. Closed-loop controlled conformal 3D printing on moving objects via tool-localized object position sensing. J. Manuf. Process. 2023, 89, 39–49. [Google Scholar] [CrossRef]
- Sitthi-Amorn, P.; Ramos, J.E.; Wangy, Y.; Kwan, J.; Lan, J.; Wang, W.; Matusik, W. MultiFab: A machine vision assisted platform for multi-material 3D printing. Acm Trans. Graph. (Tog) 2015, 34, 1–11. [Google Scholar] [CrossRef]
- Wang, T.; Kwok, T.H.; Zhou, C.; Vader, S. In-Situ Droplet Inspection and Closed-Loop Control System Using Machine Learning for Liquid Metal Jet Printing. J. Manuf. Syst. 2018, 47, 83–92. [Google Scholar] [CrossRef]
- Inkbit Technology: 3D Printing Enhanced by Vision-Controlled Jetting (VCJ). Available online: https://inkbit3d.com/technology/ (accessed on 14 April 2025).
- Boehler, W.; Vicent, M.B.; Marbs, A. Investigating laser scanner accuracy. Int. Arch. Photogramm. Remote Sens. Spat. Inf. Sci. 2003, 34, 696–701. [Google Scholar]
- Li, B.; Zhang, S. Flexible calibration method for microscopic structured light system using telecentric lens. Opt. Express 2015, 23, 25795–25803. [Google Scholar] [CrossRef]
- Zheng, Y.; Wang, Y.; Suresh, V.; Li, B. Real-time high-dynamic-range fringe acquisition for 3D shape measurement with a RGB camera. Meas. Sci. Technol. 2019, 30, 075202. [Google Scholar] [CrossRef]
- Rao, L.; Da, F. High dynamic range 3D shape determination based on automatic exposure selection. J. Vis. Commun. Image Represent. 2018, 50, 217–226. [Google Scholar] [CrossRef]
- Park, B.H.; Pierce, M.C.; Cense, B.; Yun, S.H.; Mujat, M.; Tearney, G.J.; Bouma, B.E.; de Boer, J.F. Real-time fiber-based multi-functional spectral-domain optical coherence tomography at 1.3 µm. Opt. Express 2005, 13, 3931–3944. [Google Scholar] [CrossRef] [PubMed]
- Estalaki, S.M.; Lough, C.S.; Landers, R.G.; Kinzel, E.C.; Luo, T. Predicting defects in laser powder bed fusion using in-situ thermal imaging data and machine learning. Addit. Manuf. 2022, 58, 103008. [Google Scholar] [CrossRef]
- Dharnidharka, M.; Chadha, U.; Dasari, L.M.; Paliwal, A.; Surya, Y.; Selvaraj, S.K. Optical tomography in additive manufacturing: A review, processes, open problems, and new opportunities. Eur. Phys. J. Plus 2021, 136, 1133. [Google Scholar] [CrossRef]
- Qi, C.R.; Su, H.; Mo, K.; Guibas, L.J. Pointnet: Deep learning on point sets for 3d classification and segmentation. In Proceedings of the IEEE Conference on Computer Vision and Pattern Recognition, Honolulu, HI, USA, 21–26 July 2017; pp. 652–660. [Google Scholar]
- Qi, C.R.; Yi, L.; Su, H.; Guibas, L.J. Pointnet++: Deep hierarchical feature learning on point sets in a metric space. Adv. Neural Inf. Process. Syst. 2017, 30, 5105–5114. [Google Scholar]


| Article | AM Process | Sensing Modality | Primary Use of 3D Monitoring |
|---|---|---|---|
| Cai et al. [15] | Metal-based laser additive manufacturing | Optical, thermal, and acoustic | Low: more focused on AI-assisted 2D monitoring instead |
| Ozel [16] | Fusion-based methods | Optical, thermal, and acoustic | Low: the author explores all sensing modalities and does not explicitly focus on 3D monitoring |
| Aydogan and Chou [17] | Laser bed powder fusion | Optical, thermal, acoustic, and X-ray | Low: the authors focus on multiple sensing modalities and not explicitly on 3D monitoring |
| Balhara et al. [18] | Fusion-based metal additive processes | Imaging techniques | Low: the authors focus more on 2D imaging techniques and discuss the strengths of high-speed imaging, thermal camera, and digital cameras |
| Chen et al. [19] | Fusion-based metal additive processes | Imaging techniques | Low: the authors primarily focused on 2D, high-speed imaging in combination with AI |
| AbouelNour and Gupta [20] | Powder bed fusion and fused filament fabrication | Optical, thermal, acoustic, and X-ray | Moderate: the authors mention both 2D and 3D monitoring methods; however, they limit their context to internal defect detection in these processes |
| Zhang et al. [21] | Metal additive manufacturing | Imaging techniques | Low: the focus is on 2D imaging rather than 3D monitoring |
| Xia et al. [22] | Wire arc manufacturing system | Imaging techniques | Moderate: the authors perform a review of all sensing modalities, including vision, thermal, spectral, and acoustic-based sensing, with 3D monitoring not being their sole focus |
| Lu and Wong [23] | Examines challenges to implement thermal and acoustic NDT for AM processes, not process-specific | Thermography and acoustic techniques | None: focuses on thermography and acoustic methods |
| Everton et al. [24] | Powder bed fusion and direct energy deposition | Thermal, acoustic, and optical methods | Low: primarily focus on 2D monitoring |
| Oleff et al. [25] | Metal extrusion additive manufacturing | Thermal, acoustic, and optical methods | Moderate: the authors cite review articles that used structured light, stereo vision, and laser triangulation for material extrusion; however, 3D monitoring was not their sole focus |
| Jacob et al. [26] | Fused filament fabrication (material extrusion process) | Imaging techniques | None: the authors reviewed the different metals used in the fabrication process and discussed the limitations in the process but did not perform a review on 3D monitoring techniques used for extrusion process |
| Vora et al. [27] | All AM processes | Multiple sensing modalities are mentioned including acoustic, thermal, and optical techniques | None: the authors briefly describe the merits and demerits of each sensing modality, including 3D monitoring, but do not perform a review of literature in this area |
| Article | Year of Publication | Three-Dimensional Monitoring Technology | In Situ Monitoring | Features Extracted | Precise Metrology | Closed-Loop Feedback Control | Accuracy of the Three-Dimensional Monitoring System |
|---|---|---|---|---|---|---|---|
| Williams et al. [76] | 2021 | Laser scanner | Yes | Layer height | No | No | Not Measured |
| Dickins et al. [66] | 2020 | Structured light | No | None (topography was visualized) | No | No | Not Measured |
| Southon et al. [79] | 2018 | Structured light | Yes | Surface curling, irregularities, and powder spreader blade interactions | No | No | Stated volumetric accuracy of 15 µm after calibration |
| Zhang et al. [80] | 2022 | Structured light | Yes | None (topography was visualized) | No | No | 12.01 µm across powder surface and 19.23 µm across printed surface |
| Zhang et al. [81] | 2023 | Structured light | Yes | Height maps | No | No | RMSE of 4.35 µm |
| Land et al. [82] | 2015 | Structured Light | Yes | None (topography was visualized) | No | No | 18 µm in the vertical measurement |
| Liu et al. [83] | 2020 | Structured Light | Yes | Thermal swelling (resulting in an increase in the average height of the topography) | No | No | 15.8 µm |
| Zhang et al. [84] | 2016 | Structured Light | Yes | Splatter and height variations in the printed layer | No | No | 0.47 µm |
| Kalms et al. [85] | 2019 | Structured Light | Yes | Height variations caused by surface irregularity | No | No | 10 µm |
| Li et al. [86] | 2018 | Structured Light | Yes | Surface contours and height variations in the surface | No | No | Not Measured |
| Remani et al. [87] | 2024 | Structured Light | Yes | Surface roughness parameters | No | No | Not Measured |
| Liu et al. [88] | 2021 | Structured Light | Yes | Edge thermal swelling and surface depressions | Yes | No | 15.8 µm |
| Kanko et al. [89] | 2016 | Inline coherent imaging | Yes | Height map and melt pool depth | No | No | Not Measured |
| DePond et al. [90] | 2018 | Spectral domain OCT | Yes | Surface patterns, geometry, profile thickness, and surface roughness | No | No | Not Measured |
| Guan et al. [91] | 2015 | OCT | No | Voids, surface roughness, and fewer solidified regions | No | No | 30 µm |
| Lewis et al. [92] | 2016 | OCT | Yes | Curls on the surface | Yes | No | Not Measured |
| Gardner et al. [77] | 2018 | OCT | Yes | Curls on the surface, melt pool depth (solidification behavior), and surface irregularities caused by excessive heat | Yes | No | Not Measured |
| Article | Year of Publication | Three-Dimensional Monitoring Technology | In Situ Monitoring | Features Extracted | Precise Metrology | Closed-Loop Feedback Control | Accuracy of the Three-Dimensional Monitoring System |
|---|---|---|---|---|---|---|---|
| Heralic et al. [106] | 2012 | Laser scanner | Yes | Layer height | No | Yes | Not Measured |
| Tang et al. [108] | 2019 | Laser scanner | Yes | Surface deviations from the CAD model | Yes | Yes | Average error of the system is between and |
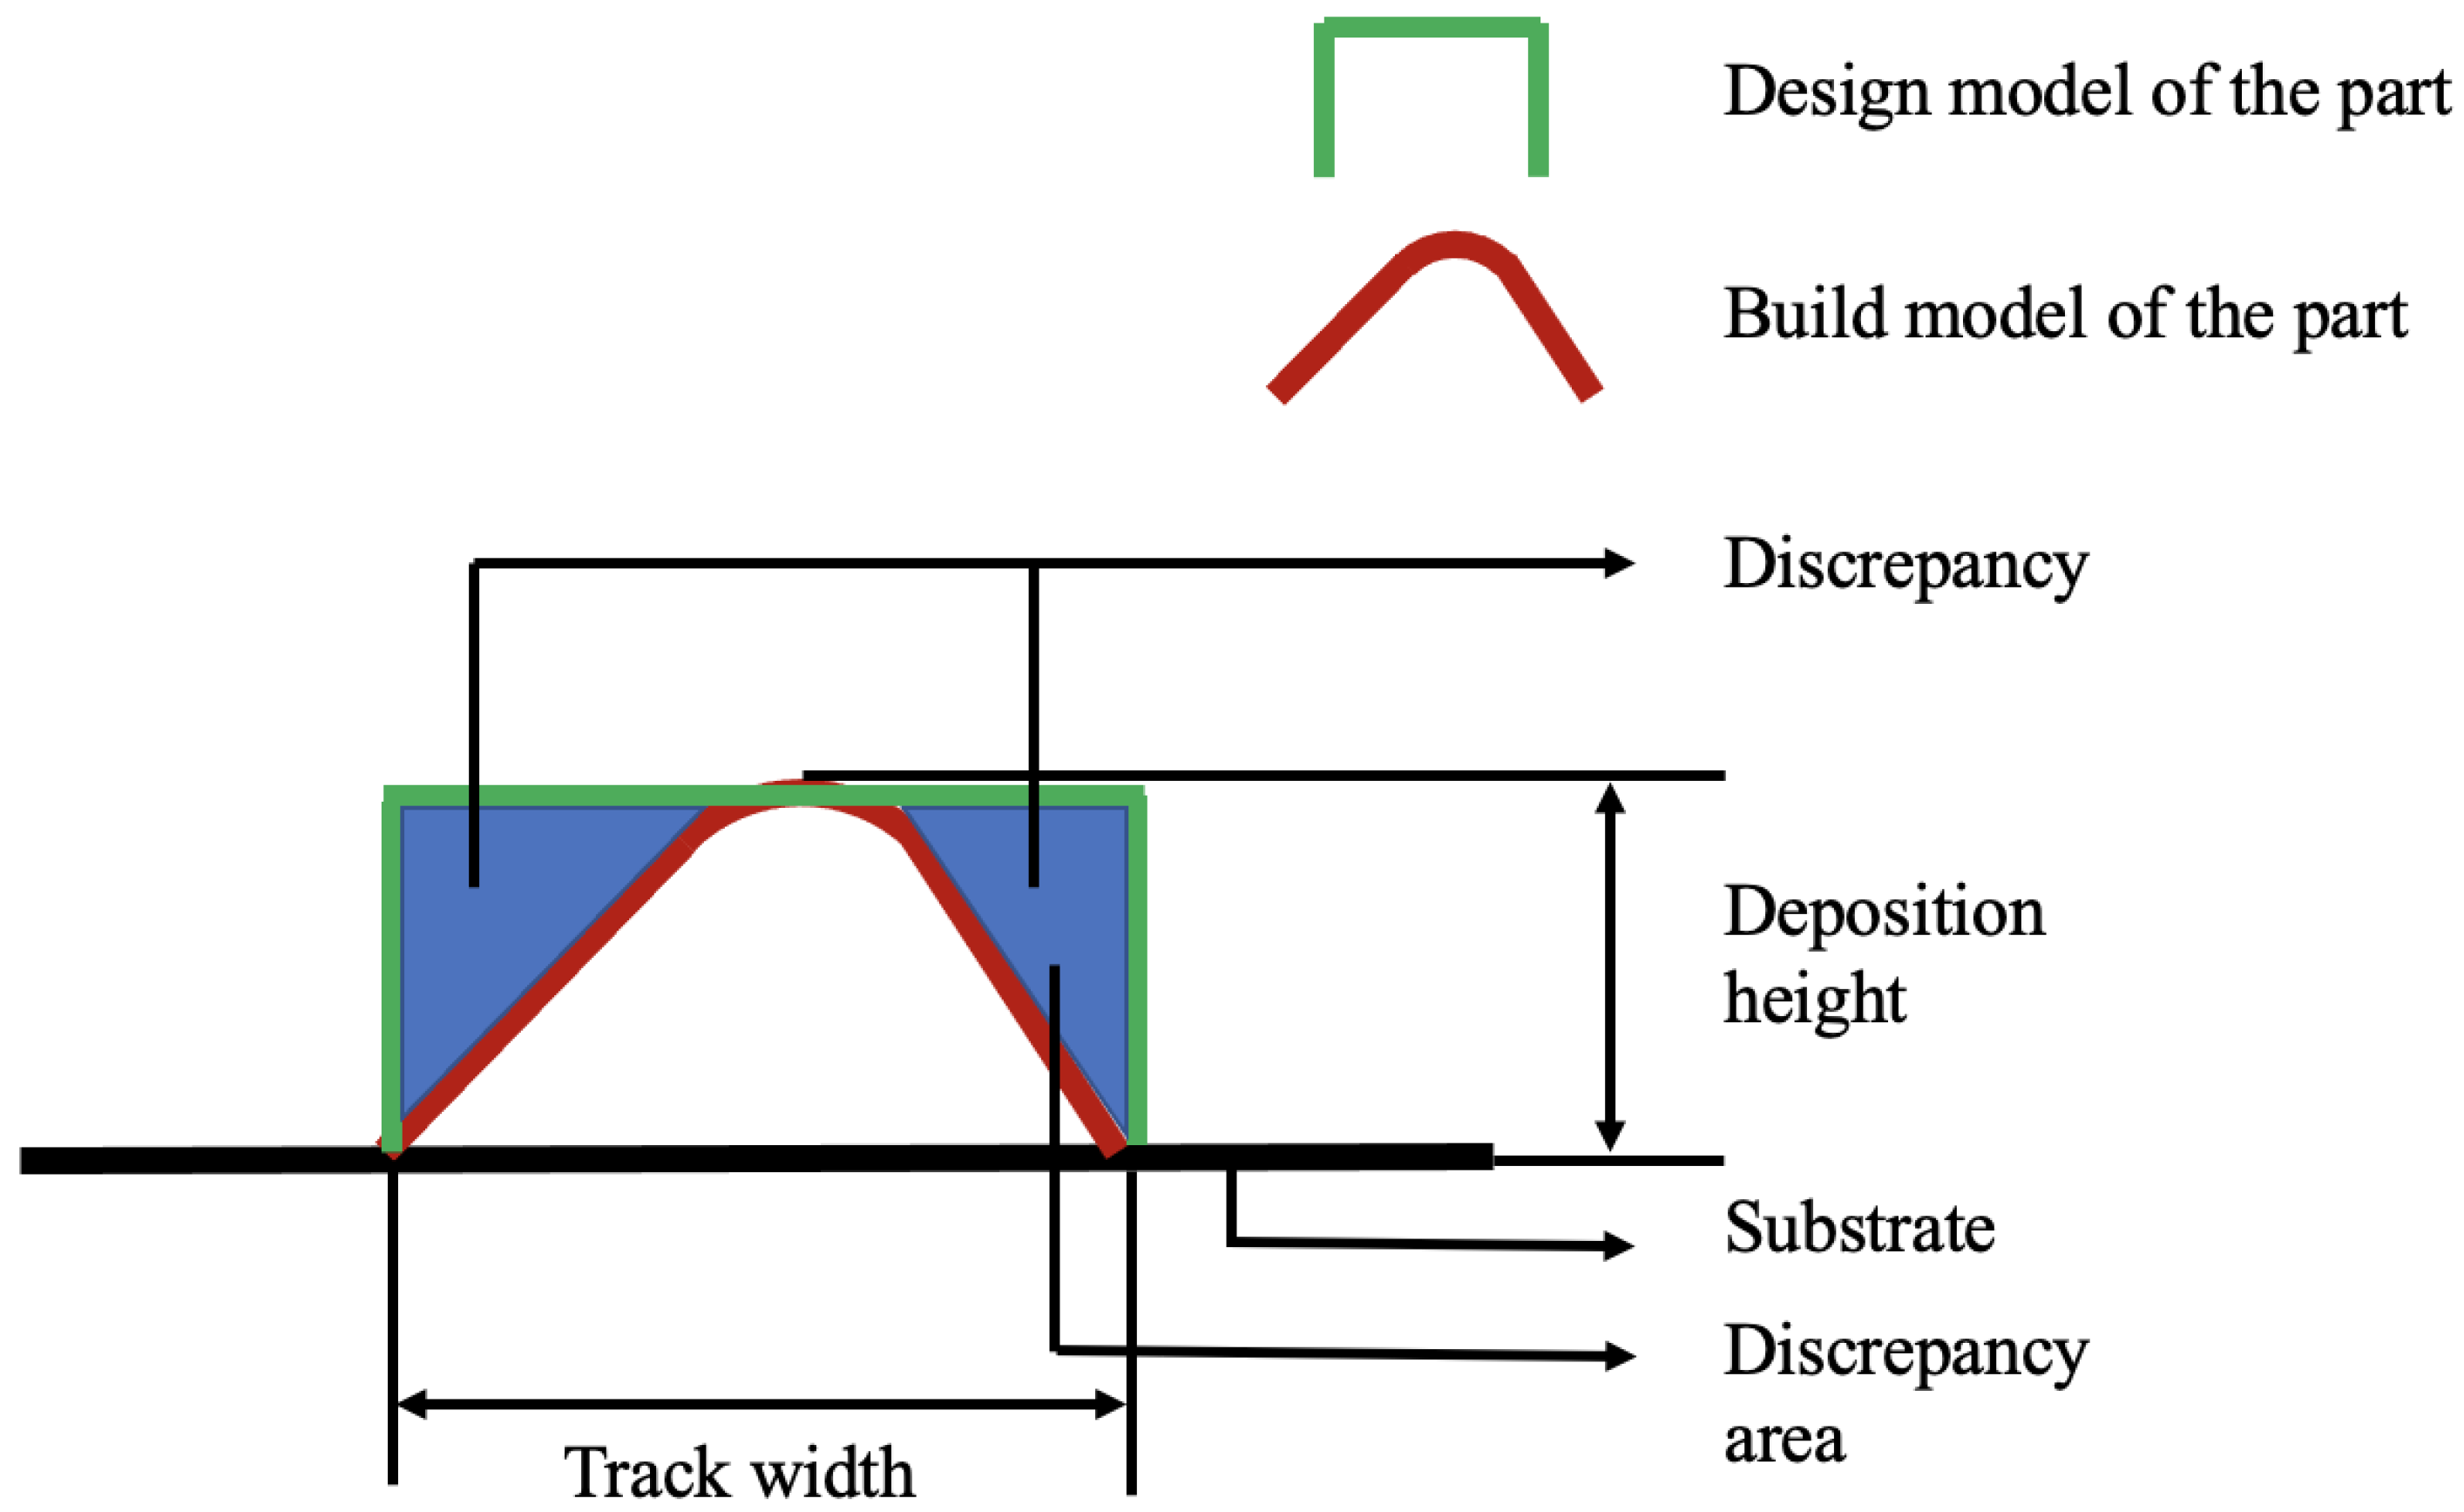
| Binega et al. [109] | 2022 | Laser scanner | Yes | Track width, deposition height, and discrepancy area | Yes | No | Overall RMSE error of deposition height is and overall RMSE of track width is |
| Zhang et al. [110] | 2021 | Structured light | Yes | Defects such as holes | Yes | Yes | Not Measured |
| Three-Dimensional Monitoring | Digital Image Correlation | Laser Scanning | Structured Light | Optical Coherence Tomography | |
|---|---|---|---|---|---|
| AM Technologies | |||||
| Powder Bed Fusion | N/A | Williams et al. [76]. | Dickins et al. [66], Southon et al. [79], Zhang et al. [80], Zhang et al. [81], Land et al. [82], Liu et al. [83], Zhang et al. [84], Kalms et al. [85], Li et al. [86], Remani et al. [87], Liu et al. [88], | Kanko et al. [89], DePond et al. [90], Guan et al. [91], Lewis et al. [92], Gardner et al. [77] | |
| Direct Energy Deposition | N/A | Heralic et al. [106], Tang et al. [108], Binega et al. [109] | Zhang et al. [110] | N/A | |
| Material Extrusion | Holzmond and Li [123] | Li et al. [113], Armstrong et al. [117] | Wi et al. [120], Liu et al. [121], Girard and Zhang [122] | N/A | |
| Material Jetting | N/A | N/A | N/A | Sitthi-Amorn et al. [128] | |
| Three-Dimensional Monitoring Technology | Strengths of Monitoring Technology | Limitations of Monitoring Technology | AM Processes That the Technology Has Been Used to Monitor by Researchers |
|---|---|---|---|
| Laser Scanning | Well commercialized leading to easy integration with AM processes | Involves line-by-line scanning, leading to slower scan speeds; there exists an accuracy trade-off with field of view | Laser bed powder fusion, direct energy deposition, material extrusion, and material jetting |
| Structured Light | Superfast (up to kilohertz), can achieve sub-millimeter accuracy, and can perform simultaneous whole-area scanning | Occlusion/shadow regions and reflective surfaces | Laser bed powder fusion, direct energy deposition, and material extrusion |
| Optical Coherence Tomography | Has highest accuracy (under 1 m) | Slowest scanning speed, making real-time process monitoring extremely challenging | Laser bed powder fusion, direct energy deposition, material extrusion, and material jetting |
Disclaimer/Publisher’s Note: The statements, opinions and data contained in all publications are solely those of the individual author(s) and contributor(s) and not of MDPI and/or the editor(s). MDPI and/or the editor(s) disclaim responsibility for any injury to people or property resulting from any ideas, methods, instructions or products referred to in the content. |
© 2025 by the authors. Licensee MDPI, Basel, Switzerland. This article is an open access article distributed under the terms and conditions of the Creative Commons Attribution (CC BY) license (https://creativecommons.org/licenses/by/4.0/).
Share and Cite
Suresh, V.; Balasubramaniam, B.; Yeh, L.-H.; Li, B. Recent Advances in In Situ 3D Surface Topographical Monitoring for Additive Manufacturing Processes. J. Manuf. Mater. Process. 2025, 9, 133. https://doi.org/10.3390/jmmp9040133
Suresh V, Balasubramaniam B, Yeh L-H, Li B. Recent Advances in In Situ 3D Surface Topographical Monitoring for Additive Manufacturing Processes. Journal of Manufacturing and Materials Processing. 2025; 9(4):133. https://doi.org/10.3390/jmmp9040133
Chicago/Turabian StyleSuresh, Vignesh, Badrinath Balasubramaniam, Li-Hsin Yeh, and Beiwen Li. 2025. "Recent Advances in In Situ 3D Surface Topographical Monitoring for Additive Manufacturing Processes" Journal of Manufacturing and Materials Processing 9, no. 4: 133. https://doi.org/10.3390/jmmp9040133
APA StyleSuresh, V., Balasubramaniam, B., Yeh, L.-H., & Li, B. (2025). Recent Advances in In Situ 3D Surface Topographical Monitoring for Additive Manufacturing Processes. Journal of Manufacturing and Materials Processing, 9(4), 133. https://doi.org/10.3390/jmmp9040133