Abstract
The tensile properties and the Weibull statistical distributions of the tensile strength of poly-(para-phenylene-2,6-benzobisoxazole) (PBO), poly-(para-phenylene terephthalamide) (PPTA), copoly-(para-phenylene-3,4′-oxydiphenylene terephthalamide (PPODTA), polyarylate (PAR), and polyethylene (PE) polymeric fiber epoxy-impregnated bundle composites have been investigated. The results show that the Weibull modulus decreases as the tensile modulus, strength, and inverse of the failure strain increase. The interfacial shear properties were also examined using the microdroplet composite. For the lower interfacial shear strength of polymeric fibers, the Weibull modulus decreases as interfacial shear strength increases. Conversely, for the higher interfacial shear strength of polymeric fibers, the Weibull modulus increases as interfacial shear strength increases. Interestingly, these inflection points were also observed for the 20–30 MPa interfacial shear strength.
1. Introduction
Commercially available polymeric fibers, including Zylon, Kevlar, Twaron, Technora, Vectran, Dyneema, and Spectra, exhibit high tensile strength and modulus and low density (0.9–1.6 g/cm3). These fibers also demonstrate excellent strength-to-weight ratios, good dimensional stability, and enhanced thermal and chemical resistance [1,2]. Extensive research has been conducted to study the properties of polymeric fibers and their composites. Marder et al. [3] characterized the adhesion properties between Zylon fiber with some surface modifications (ultraviolet irradiation, plasma, and acidic treatments) and an epoxy matrix. Murthy et al. [4] examined the tensile behavior and fracture of Kevlar and Spectra fiber bundles at both quasi-static and high strain rates. Farris et al. [5] and Wu and Blackwell [6] evaluated the relationships between the structure parameters using the X-ray diffraction and mechanical properties of Technora and Kevlar fibers. Pegoretti et al. [7] examined the possibility of preparing polymer composites based on Vectran fibers. Xu and Farris [8] reported the physical, thermomechanical, and microstructural properties of Dyneema and Spectra fibers and their composites. In order to evaluate the mechanical properties of these polymeric fibers, it is necessary to have an understanding of their mechanical characteristics. The morphology and tensile mechanical responses of single fibers have been investigated by Naito [9].
Polymeric fibers are generally used in these fiber-reinforced polymer matrix composites. Clarifying the mechanical properties of polymeric fibers and polymer composites reinforced with polymer fibers is important. Bundle composites are basic fiber-reinforced polymer matrix composites [7,10]. One of the main possible advantages of this type of composite is that many samples can be easily produced. Another important advantage is the ease of comparing the mechanical properties of the various fiber-reinforced polymer matrix composites that can be achieved using the same polymer matrix. This aspect is particularly desirable for high-volume industries. In fact, in the field of traditional fiber-reinforced polymer composites, bundle composites are widely used to evaluate the mechanical properties of fiber-reinforced polymer matrix composites [11,12].
The objective of the present study was to evaluate the tensile properties of commercially available polymeric fiber epoxy-impregnated bundle composites. Weibull statistical distributions on tensile strengths and interfacial shear properties between fiber and matrix were also evaluated, with the objective of deriving a deeper understanding of the tensile properties of polymeric-fiber-reinforced epoxy matrix composites. The novelty and advantage of this study are to reveal the modulus, strength (including Weibull modulus), failure strain, and interfacial shear strength of polymeric fiber epoxy-impregnated composites with varying modulus/strength of polymeric single fibers, and to comprehensively elucidate the complex relationship between the Weibull modulus and the modulus, strength, failure strain, and interfacial shear strength of polymeric fiber epoxy-impregnated composites.
2. Materials and Methods
2.1. Materials
The polymeric fibers used in this study [9] were PBO (poly-(para-phenylene-2,6-benzobisoxazole)) fibers (ZylonAS, ZylonHS), PPTA (poly-(para-phenylene terephthalamide)) fibers (Kevlar29, Kevlar49, Kevlar119, Kevlar129, Twaron), PPODTA (co-poly-(para-phenylene-3,4′-oxydiphenylene terephthalamide)) fiber (Technora), PAR (liquid crystal polymer polyarylate) fibers (VectranHT, VectranUM), and PE (polyethylene) fibers (Spectra S900, Spectra S1000, Spectra S2000, Dyneema SK60, Dyneema SK71). The Zylon/Dyneema, Kevlar, Twaron/Technora, Vectran, and Spectra fibers were supplied by Toyobo Co., Ltd., Osaka, Japan, DuPond-Toray Co., Ltd., Teijin Techno Products, Ltd., Tokyo, Japan, Kuraray Co., Ltd., Tokyo, Japan, and Honeywell International, Inc., North Carolina, USA, respectively. The physical and tensile properties of these polymeric fibers are listed in Table 1 [9]. The density of the polymeric fibers was found to be lower than that of the carbon fibers. The tensile strength of the polymeric fibers was observed to be similar to that of the carbon fibers, while the failure strain of the polymeric fibers was determined to be higher than that of the carbon fibers. Consequently, these polymeric fibers were selected for the preparation of the bundle composites.

Table 1.
Physical and tensile properties of polymeric fiber epoxy-impregnated bundle composites.
The solution of thermoset epoxy consists of JER813 (diglycidyl ether of bisphenol A) epoxy and YH306 (acid anhydride grade hardener) at a ratio of JER813:YH306 = 100:124 by weight. The JER813/YH306 were supplied by Mitsubishi Chemical Corp., Tokyo, Japan.
The bundles were impregnated with a liquid solution, and excess resin was removed with a roller. The bundles were cured at a temperature rise rate of 3 °C/min at 150 °C for 6 h (12 h at 120 °C for PE fiber bundle composite) with tension applied by hanging a weight on the bundle. The volume fractions of polymeric fibers were controlled to 50% ± 5%.
2.2. Tensile Test
Tensile tests of the bundle composites (gage length, L of 25 mm) were performed using a universal testing machine (Autograph AG-series, Shimadzu Corp., Kyoto, Japan) with a 5 kN load cell and active gripping systems. Crosshead speeds of 5 mm/min were applied. The tensile test provides a load P as a function of extension U* curve. The tensile stress σ and strain ε were calculated according to the following formulae:
The total cross-sectional area of filaments in a bundle, denoted by S, can be calculated from the bundle tex, Tex, and density, ρf, of the fibers. From Equation (1), it can be seen that the fiber bundle bears all the load, with the effects of the resin being ignored. Consequently, the stress experienced by the fiber bundle is considered, but the impact of the polymeric fiber volume fraction is not. L* is the distance between targets and is ≈ 15 mm. The extension U* was measured using a non-contact video extensometer (DVE-201, Shimadzu Corp.). All tests were performed in a laboratory environment under ambient conditions (23 °C ± 3 °C and 50% ± 5% relative humidity). Thirty specimens were tested, including stress–strain analysis.
After testing, the fracture surfaces of the specimens were osmium coated (HPC-1SW, Vacuum Device, Ibaraki, Japan) and then examined using a high-resolution scanning electron microscope (Quanta 200FEG, Thermo Fisher Scientific, Tokyo, Japan) at an operating voltage of 5 kV.
The specimen preparation and test procedures were conducted in accordance with the standards in JIS R7608 and ISO 10618.
2.3. Interfacial Shear Strength Test
The interfacial shear properties were evaluated using microdroplet composites [13,14]. A single filament of the polymeric fiber was fastened to a thin stainless steel holder with the epoxy matrix (JER813/YH306). The microdroplet composites were cured under the same conditions as the bundle composites.
Interfacial shear tests were conducted using an interfacial micro-bond evaluation instrument (HM410, Tohei Sangyo, Tokyo, Japan) with a 5 N load cell and a 0.12 mm/min crosshead speed. All tests were conducted under laboratory conditions. A total of 100 samples were tested for each instance.
3. Results and Discussion
3.1. Stress–Strain Relationship
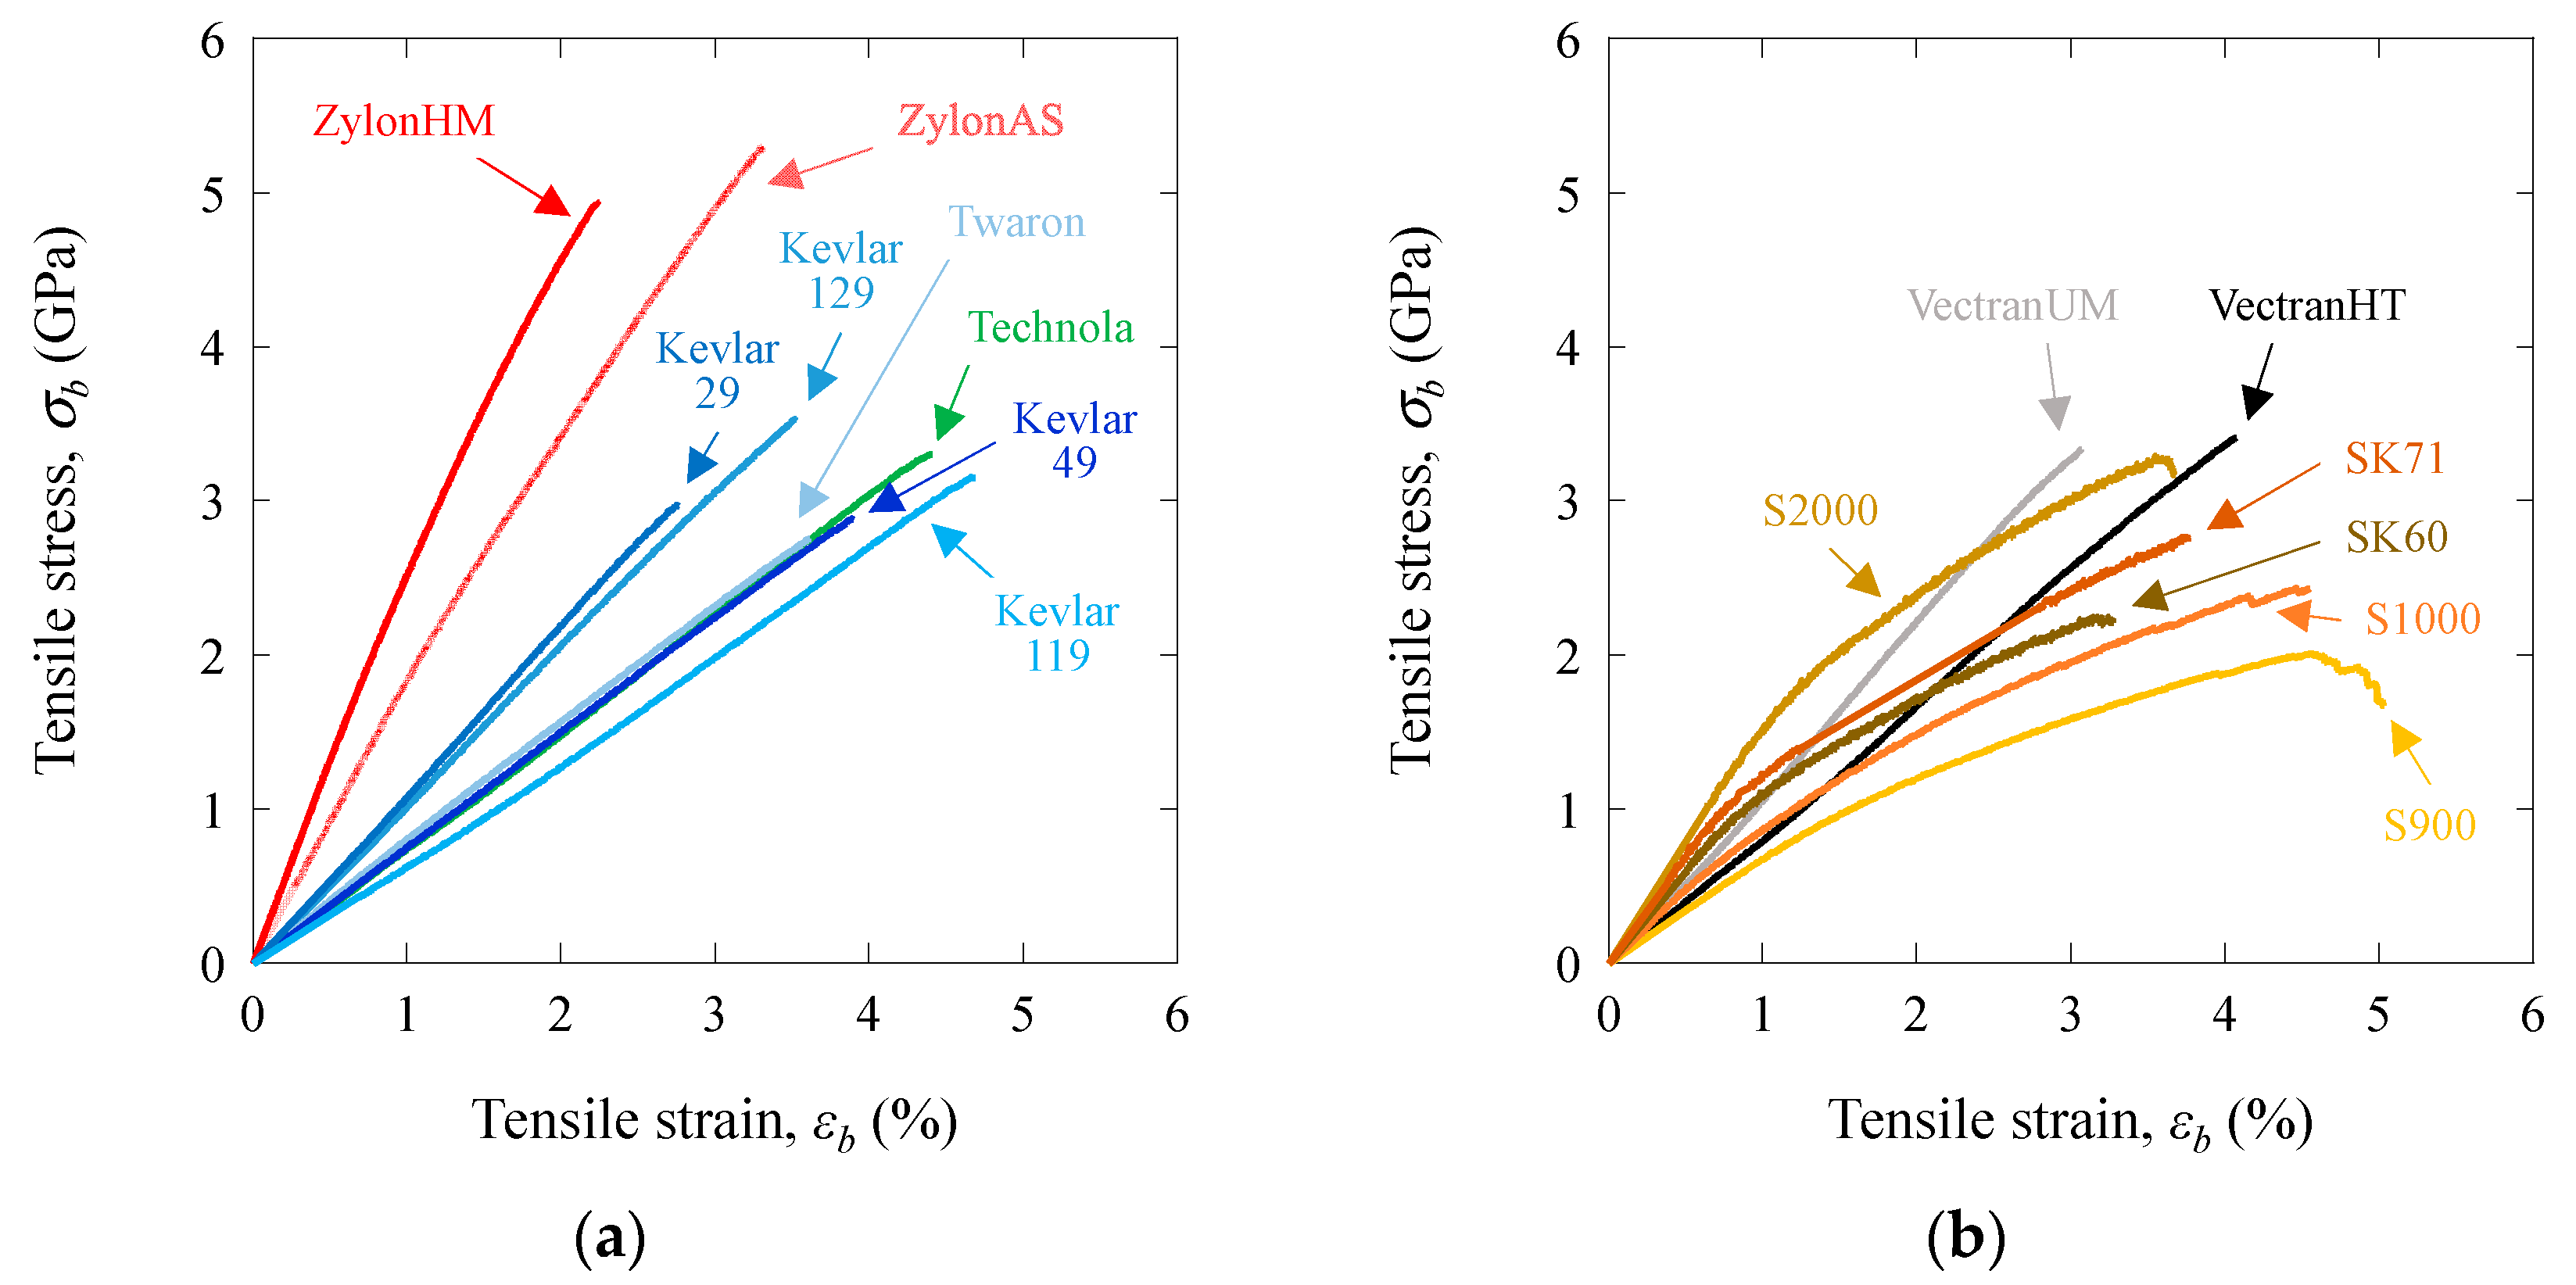
Figure 1 shows typical tensile stress–strain (σ-ε) curves for the PBO, PPTA, PPODTA, PAR, and PE polymeric fiber epoxy-impregnated bundle composites.
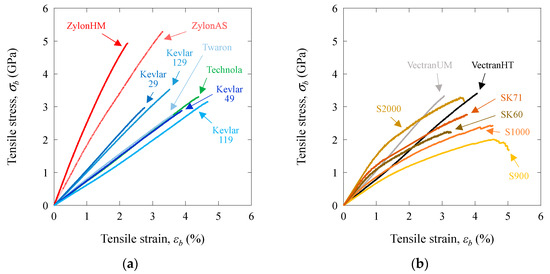
Figure 1.
Typical tensile stress–strain curves for the PBO, PPTA, PPODTA, PAR, and PE polymeric fiber epoxy-impregnated bundle composites: (a) PBO, PPTA, and PPODTA fiber bundle composites; (b) PAR and PE fiber bundle composites.
For the PBO, PPTA, PPODTA, and PAR fiber bundle composites, the stress–strain curves exhibit slight nonlinear behavior. The stress–strain curve for the PE fiber bundle composites also exhibits a significant degree of nonlinearity. The tensile strengths of all polymeric fiber bundle composites exhibited high values (exceeding 2 GPa), which were comparable to those of carbon fiber bundle composites. Furthermore, the failure strains of these polymeric fiber bundle composites demonstrated high values (exceeding 2%), which were higher than those of carbon fiber bundle composites (less than 2%). Additionally, the tensile responses of these fiber bundle composites exhibited linear behaviors during the initial stage of loading. The design of the strength criterion was straightforward, and these composites are among the most robust load-bearing components in a polymeric fiber-reinforced composite. However, it is crucial to assess the interfacial shear strength, particularly in PBO and PE fiber bundle composites. Similar behaviors were observed for the PBO, PPTA, PAR, and PE composites in previous studies [3,4,7].
3.2. Tensile Modulus, Strength, and Failure Strain
The tensile modulus Eb was calculated using a least square method for the straight-line section of the stress–strain curve. The tensile strength of the polymer fiber bundle composites σbf was calculated as
where Pmax is the maximum fracture load of the specimen. The failure strain εbf was defined as the maximum strain. The average values Eb.ave, σbf.ave, and εbf.ave are summarized in Table 1.
The Eb.ave, σbf.ave, and εbf.ave of these fiber bundle composites were almost equal to those given in the manufacturers’ product data. The PBO fiber bundle composites have σbf.ave values of 5.14 GPa (ZylonAS) and 4.46 GPa (ZylonHM), and εbf.ave values of 3.03% (ZylonAS) and 2.22% (ZylomHM). The PPTA, PPODTA, PAR, and PE fiber bundle composites have σbf.ave values ranging from 2.09 to 3.32 GPa and εbf.ave values ranging from 2.60 to 5.38%, respectively.
3.3. Weibull Modulus
The Weibull statistical distribution of strength is attributed to the nature and distribution of the flaws, which are present in the fibers; while the strength is assumed to be controlled by defects, which are statistically distributed. The weakest link hypothesis is taken into account in the Weibull approach.
The results presented in Table 1 demonstrate a notable dispersion in tensile strength. The statistical distribution is typically described by the Weibull equation [15,16]. The two-parameter Weibull distribution is defined as follows:
where PF is the cumulative probability of failure at an applied tensile strength (σbf), mb is the Weibull modulus, and σb0 is the Weibull scale parameter. The cumulative probability of failure PF under a particular stress is defined as follows:
where i is the number of fiber bundles that have broken at or below a stress level and n is the total number of fiber bundles tested. Rearrangement of the two-parameter Weibull statistical distribution expression (Equation (4)) yields the following:
Consequently, the mb can be derived through linear regression from a Weibull plot of Equation (6).
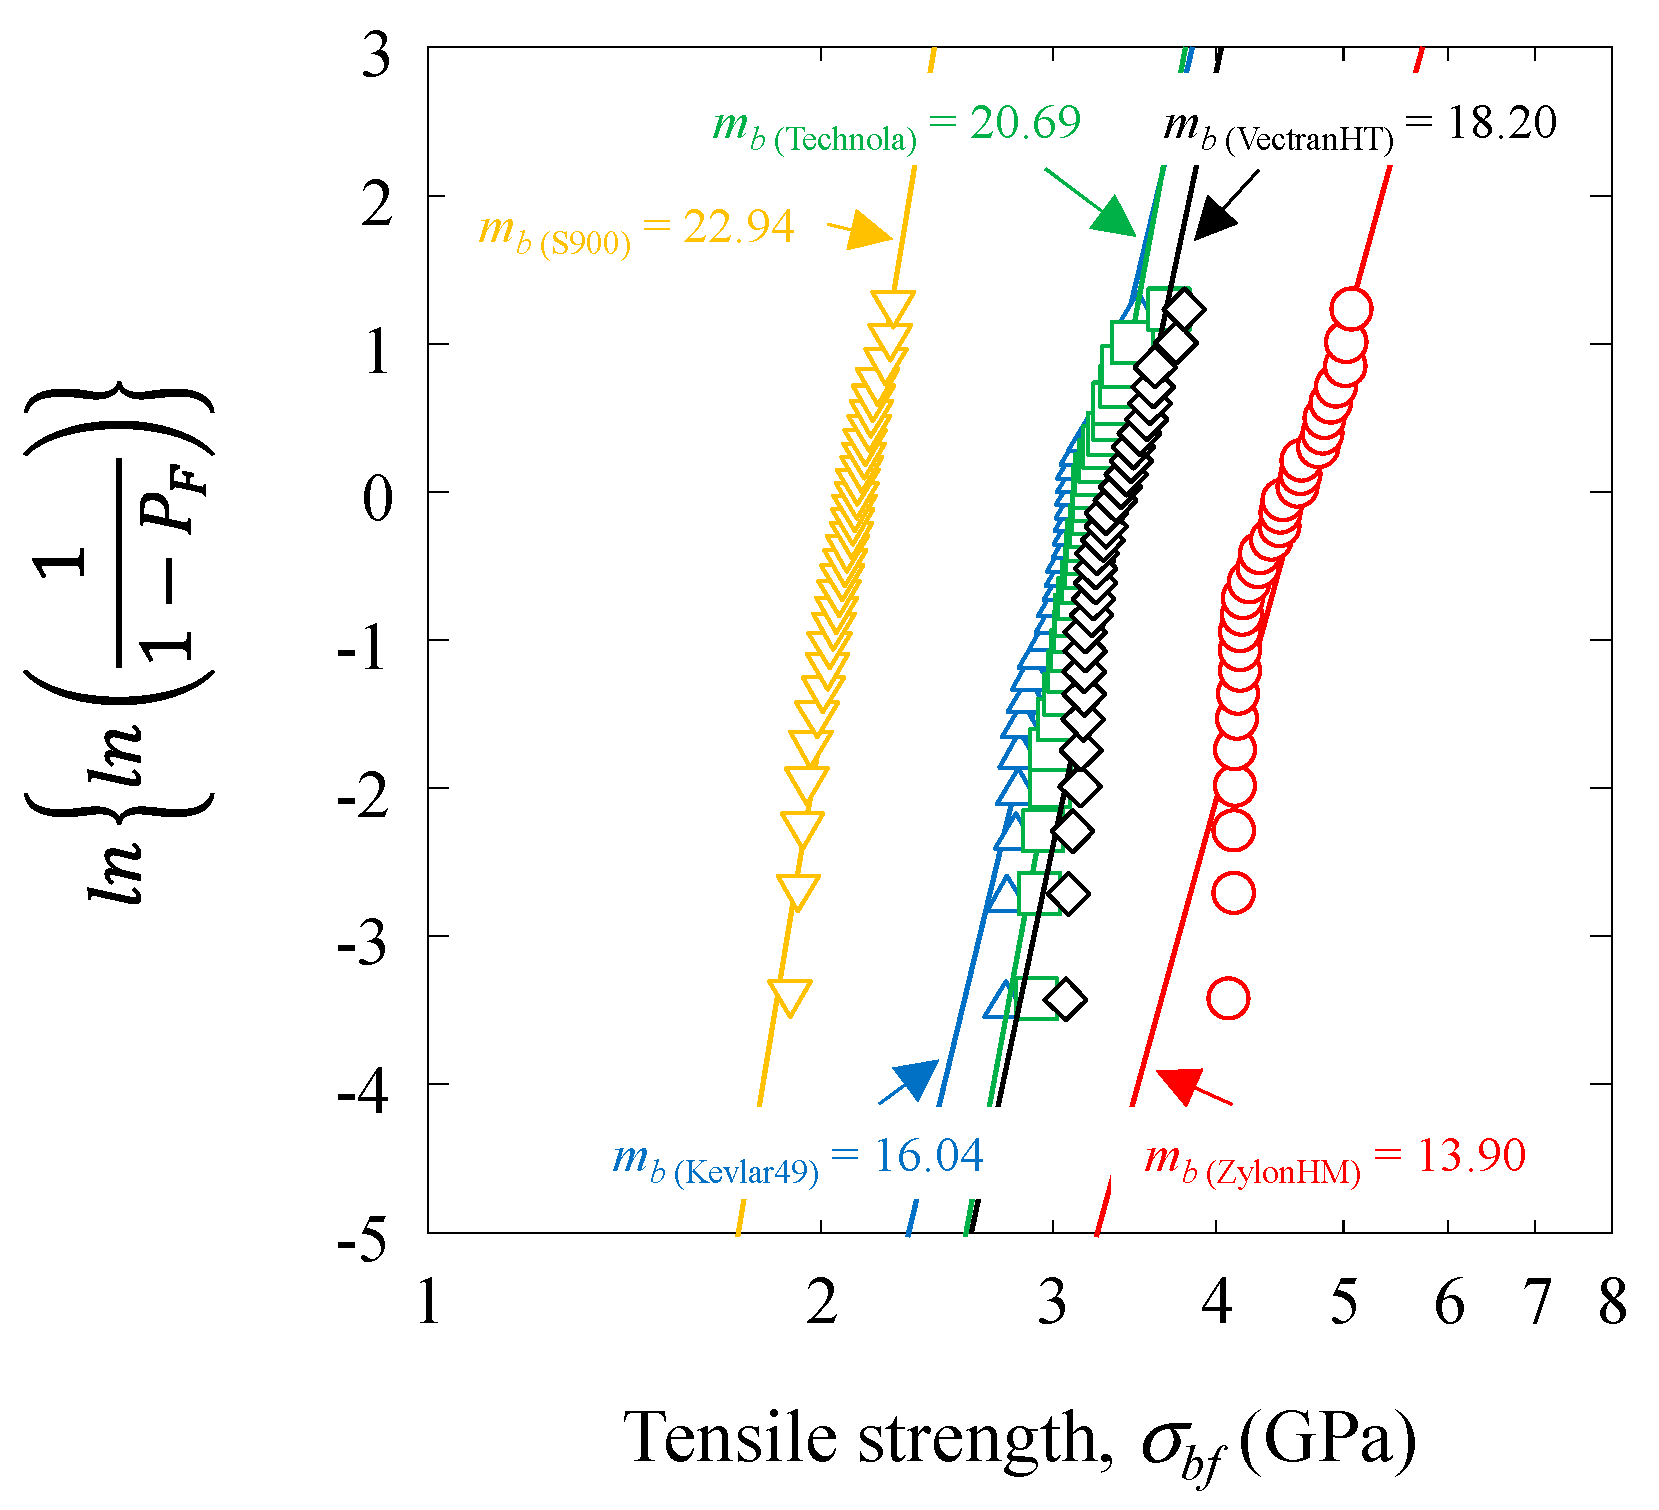
Figure 2 shows the Weibull plots of the ZylonHM, Kevlar49, Technora, VectranHT, and S900 fiber bundle composites.
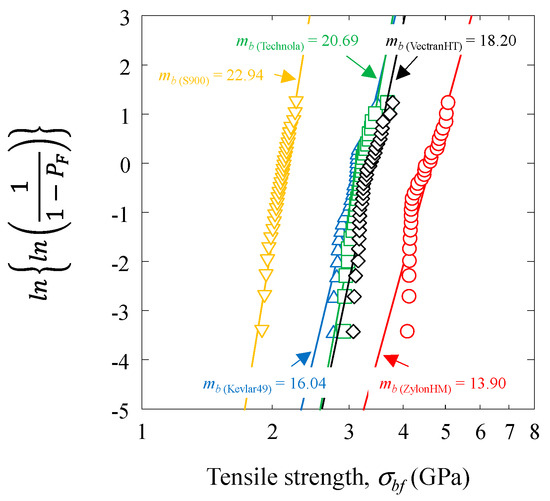
Figure 2.
Weibull plots of ZylonHM, Kevlar49, Technora, VectranHT, and S900 fiber bundle composites.
The mb for the ZylonHM, Kevlar49, Technora, VectranHT, and S900 fiber bundle composites were calculated to be 13.90, 16.04, 20.69, 18.20, and 22.94, respectively. The mb values are also summarized in Table 1. The results clearly show that the high modulus ZylonHM fiber bundle composite has the lowest mb and εbf, while the high ductility S900 fiber bundle composite has the highest mb and εbf.
3.4. Weibull Modulus vs. Tensile Modulus and Strength and Failure Stain
In the previous investigation of single carbon [17] and polymeric fibers [9], it was observed that the Weibull modulus decreased as the tensile modulus and strength increased and the failure strain decreased. Additionally, a linear relationship between the tensile modulus, failure strain, and the Weibull modulus was identified on the log–log scale.
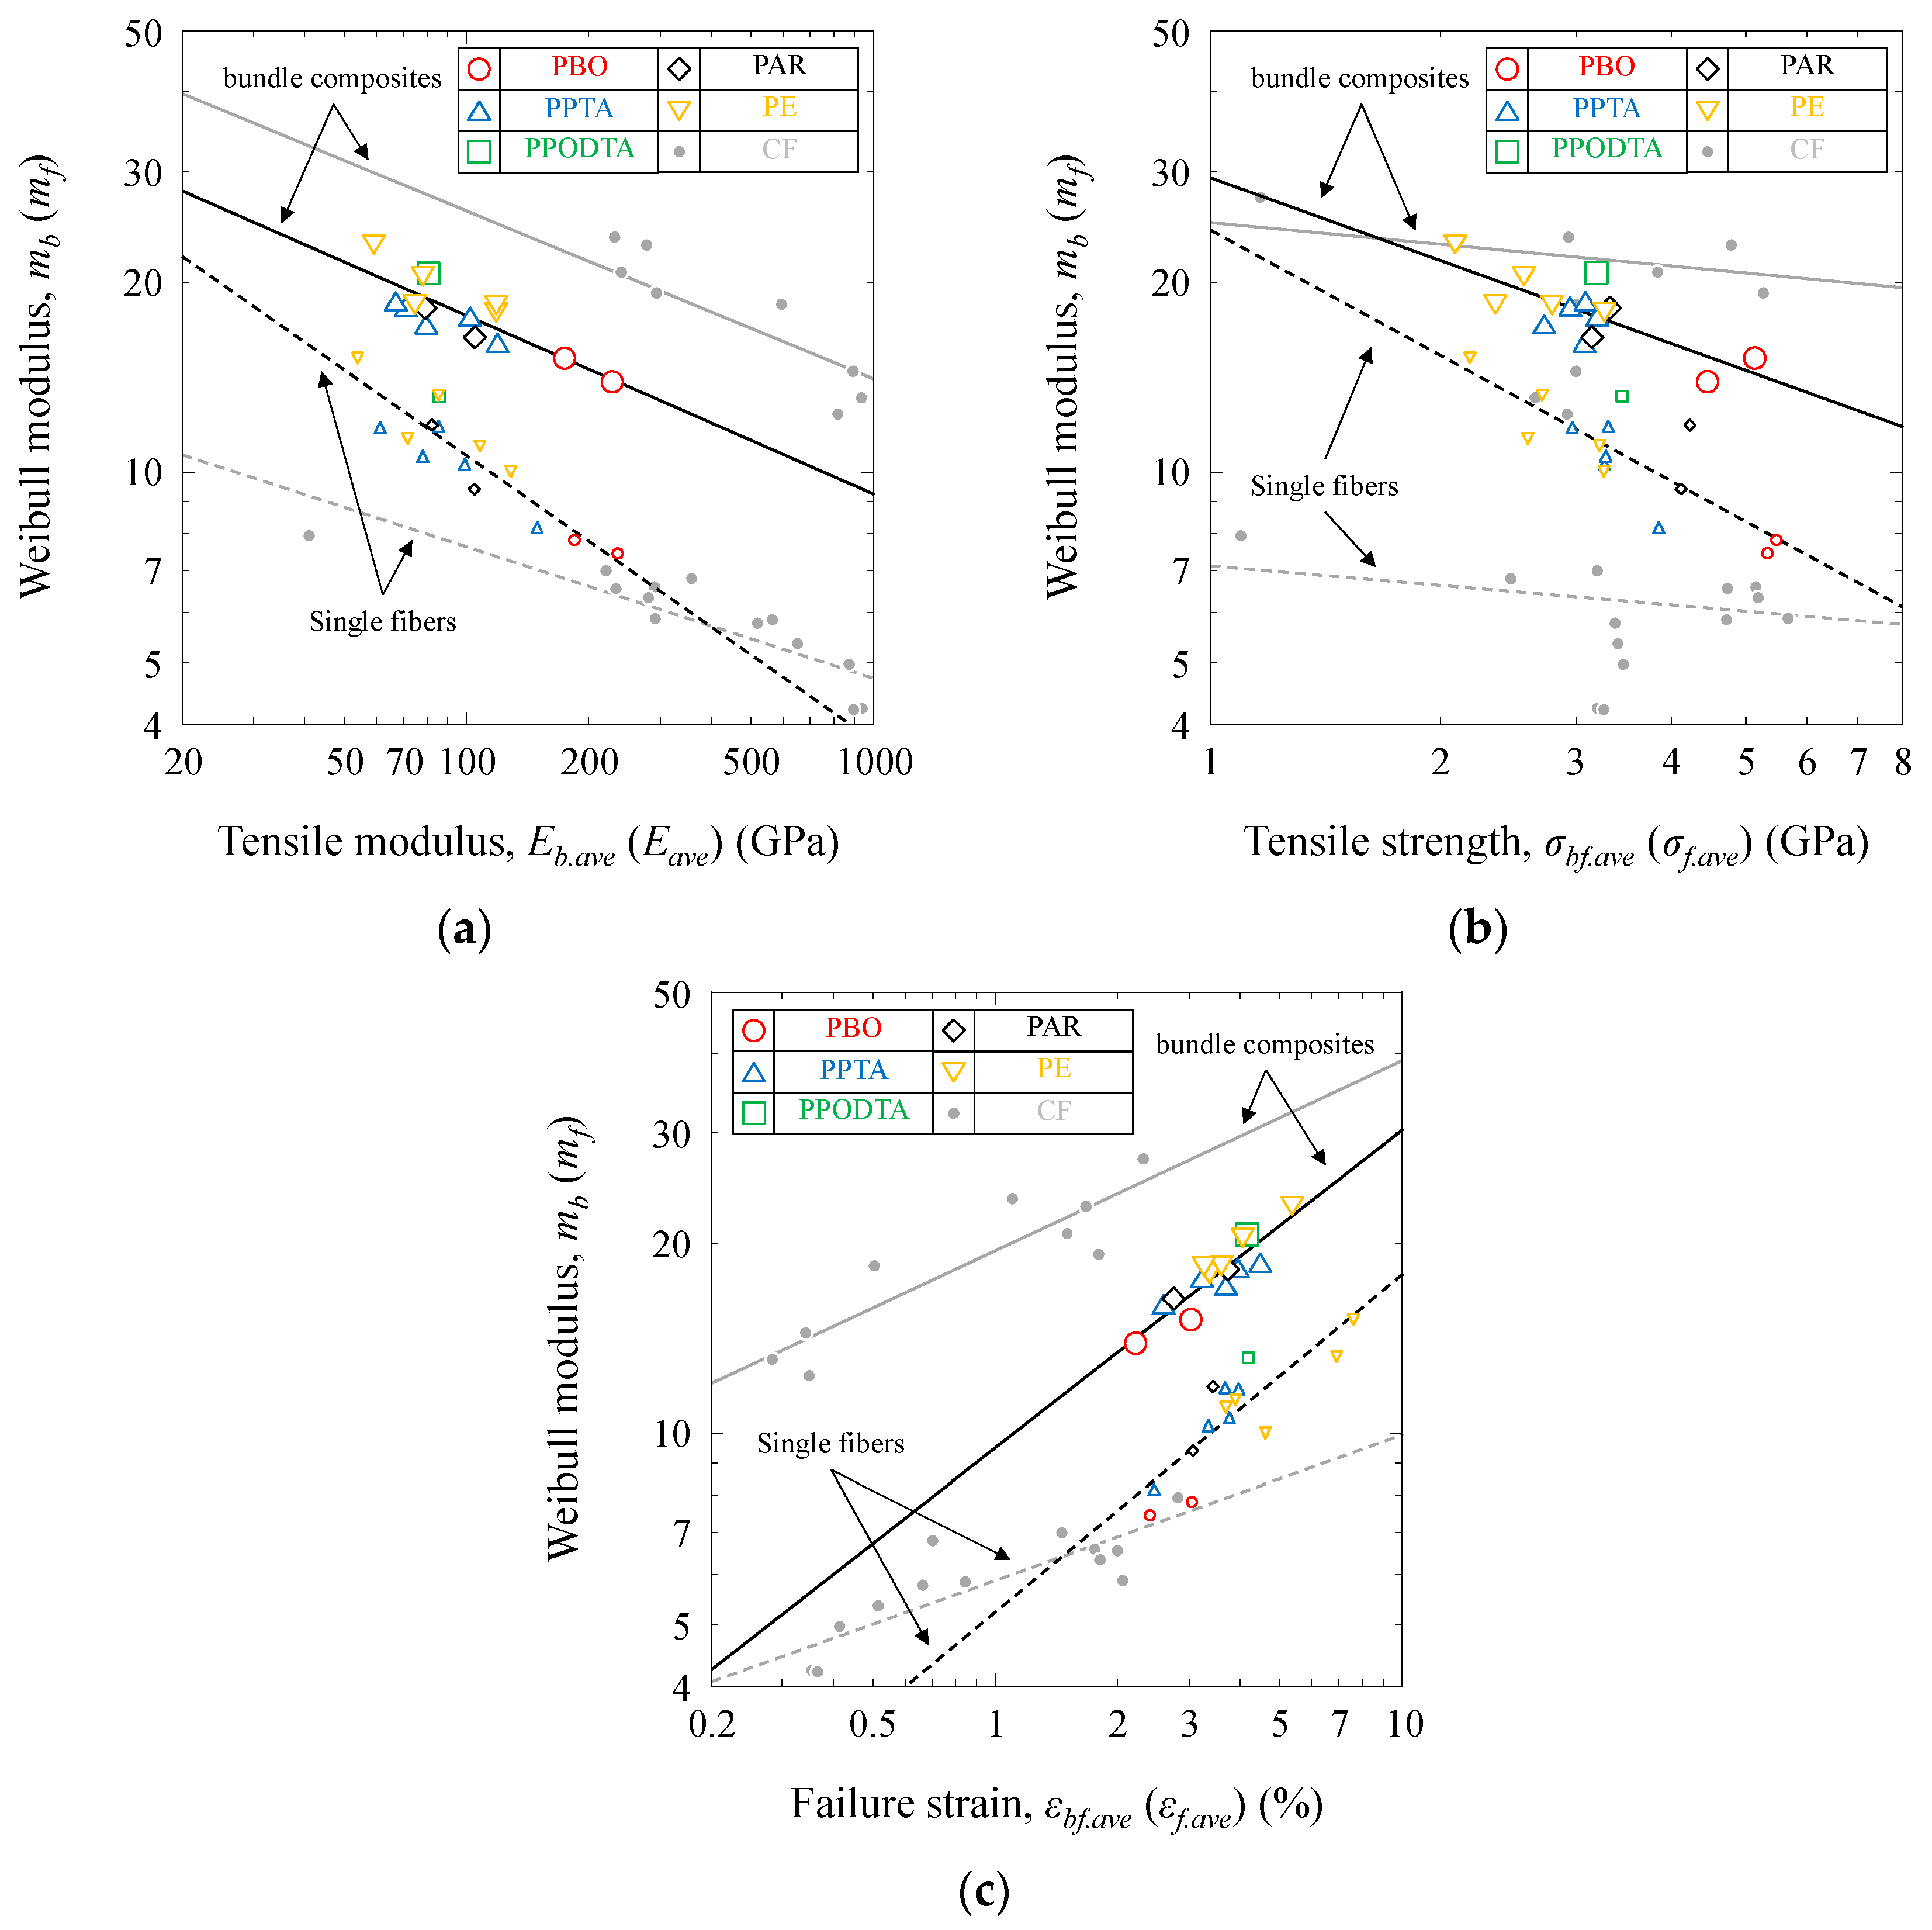
Figure 3 shows a representation of mb as a function of Eb.ave, σbf.ave, and εbf.ave for the PBO, PPTA, PPODTA, PAR, and PE fiber bundle composites. The results for the single polymeric [9], single carbon fibers of the same gage length (25 mm) [17], and unidirectional carbon fiber laminate composites [18] are also shown in this figure (Unidirectional carbon fiber laminate composites were produced using epoxy or cyanate-ester matrix-based unidirectional CFRP prepreg material P3060-15 (fiber: T300, matrix: #3601), P3212G-25 (fiber: T700SC, matrix: #3631), QC133-149A (fiber: IM600, matrix: 133), M60JB-WF150/EX-1515 (fiber: M60JB, matrix: EX-1515), K13C-150grm/EX-1515 (fiber: K13C, matrix: EX-1515), HYEJ16M95DHX1 (fiber: K13D, matrix: HX1), and E0536A-10N (fiber: XN-05, matrix: NM-.35). Fiber orientation of the laminate composites were set to [0]8 ([0]4 for P3212G-25) and the laminate composites were fabricated by an autoclave (Ashida Mfg. Co., Ltd., Osaka, Japan, ACA Series) in the laboratory. The rectangular straight-sided tensile test specimens with length of 200 mm (gage length 100 mm) and width of 10 mm were used).
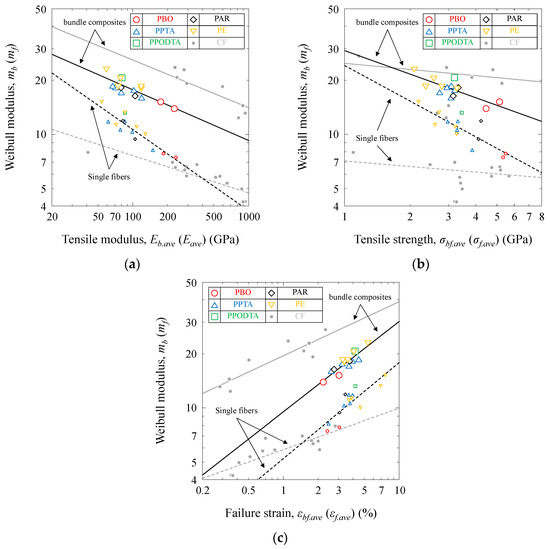
Figure 3.
Relationship between the Weibull modulus and the tensile modulus and strength and failure strain of PBO, PPTA, PPODTA, PAR, and PE fiber bundle composites: (a) tensile modulus; (b) tensile strength; (c) failure strain.
From the viewpoints of the Weibull modulus distribution, it can be seen that for all polymeric fiber bundle composites, the mb tends to decrease with an increase in the Eb.ave and σbf.ave and a decrease in the εbf.ave. Additionally, there is an almost linear relation between the Eb.ave, σbf.ave, εbf.ave, and mb on a log–log scale. For the carbon fiber bundle composites, the mb also decreases with an increase in the Eb.ave and a decrease in the εbf.ave. There is also an almost linear relation between the Eb.ave, εbf.ave, and mb on the log–log scale. The mb also decreases with an increase in the σbf.ave. However, a clear linear relationship on the log–log scale was not observed between the σbf.ave and the mb.
The Weibull modulus is indicative of the strength distribution, while the tensile modulus is indicative of flaw sensitivity [19,20]. These relationships indicate that the tensile strength distribution of fibers is strongly dependent on the flaw sensitivity and strength values, and are clearly observed in Figure 3a,b. Weibull modulus values highly depend on the failure strain, as illustrated in Figure 3c, due to the nonlinear tensile responses of the polymeric fibers and the ductile nature of the fracture process. The εbf.ave is a valuable parameter for illustrating the differences in tensile properties, including the mb. For example, the higher the Eb.ave, the broader the distribution of tensile strength. Consequently, higher σbf.ave and lower εbf.ave lead to a broader distribution of tensile strength.
3.5. Fracture Morphology
Scanning electron microscope (SEM) micrographs of longitudinal-sectional views for the tensile fractured surfaces of the ZylonAS, Kevlar29, Technora, VectranHT, and Dyneema SK60 fiber bundle composites are shown in Figure 4.
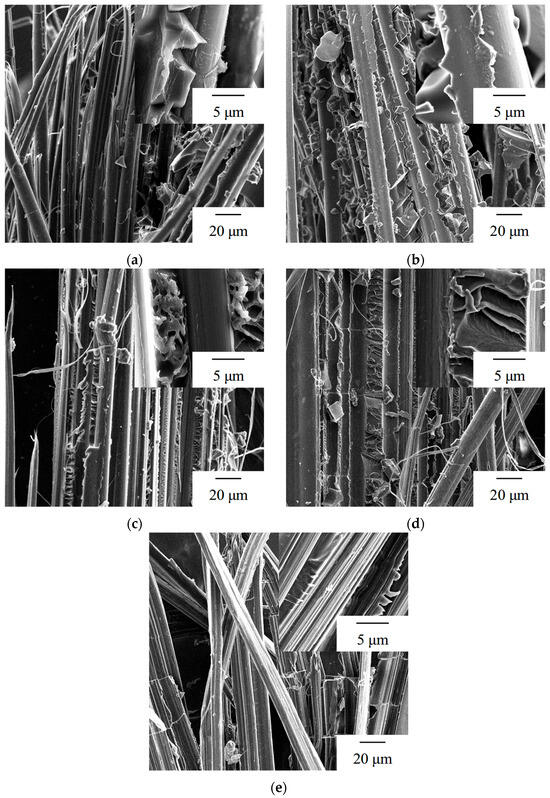
Figure 4.
SEM longitudinal views of the tensile fractured surfaces of the polymeric fiber bundle composites: (a) ZylonAS; (b) Kevlar29; (c) Technora; (d) VectranHT; (e) Dyneema SK60.
A report indicated that a unidirectional carbon-fiber-reinforced polymer (CFRP) specimen exhibited axial tension failure, resulting in a fracture in the transverse direction at multiple points, which was associated with longitudinal splitting of the composite, resulting in a brush-like fracture surface [21]. This suggested that fiber-dominated fracture behavior was present [10]. The bundle composites exhibit smooth fiber surfaces with a small amount of resin. The fracture morphology (amount of resin in polymeric fibers) is roughly summarized in Table 1. It was difficult to establish the relationship between the fracture morphology and tensile properties. The polymeric fibers may result in weak interfacial properties (strength) between fiber and matrix. Similar fracture behaviors were observed for the PPTA and PE in a previous study [4].
3.6. Interfacial Property
The load was found to be almost linearly proportional to the displacement, and interfacial fracture was observed for all microdroplet composites.
The interfacial shear strength τIFSS was calculated as follows:
where Pmax, df, and le are the maximum fracture load, diameter of fibers, and embedded length of the individual microdroplet, respectively. This equation is predicated on the assumption that the shear lag model is that of a cylindrical fiber embedded in a surrounding matrix [14].
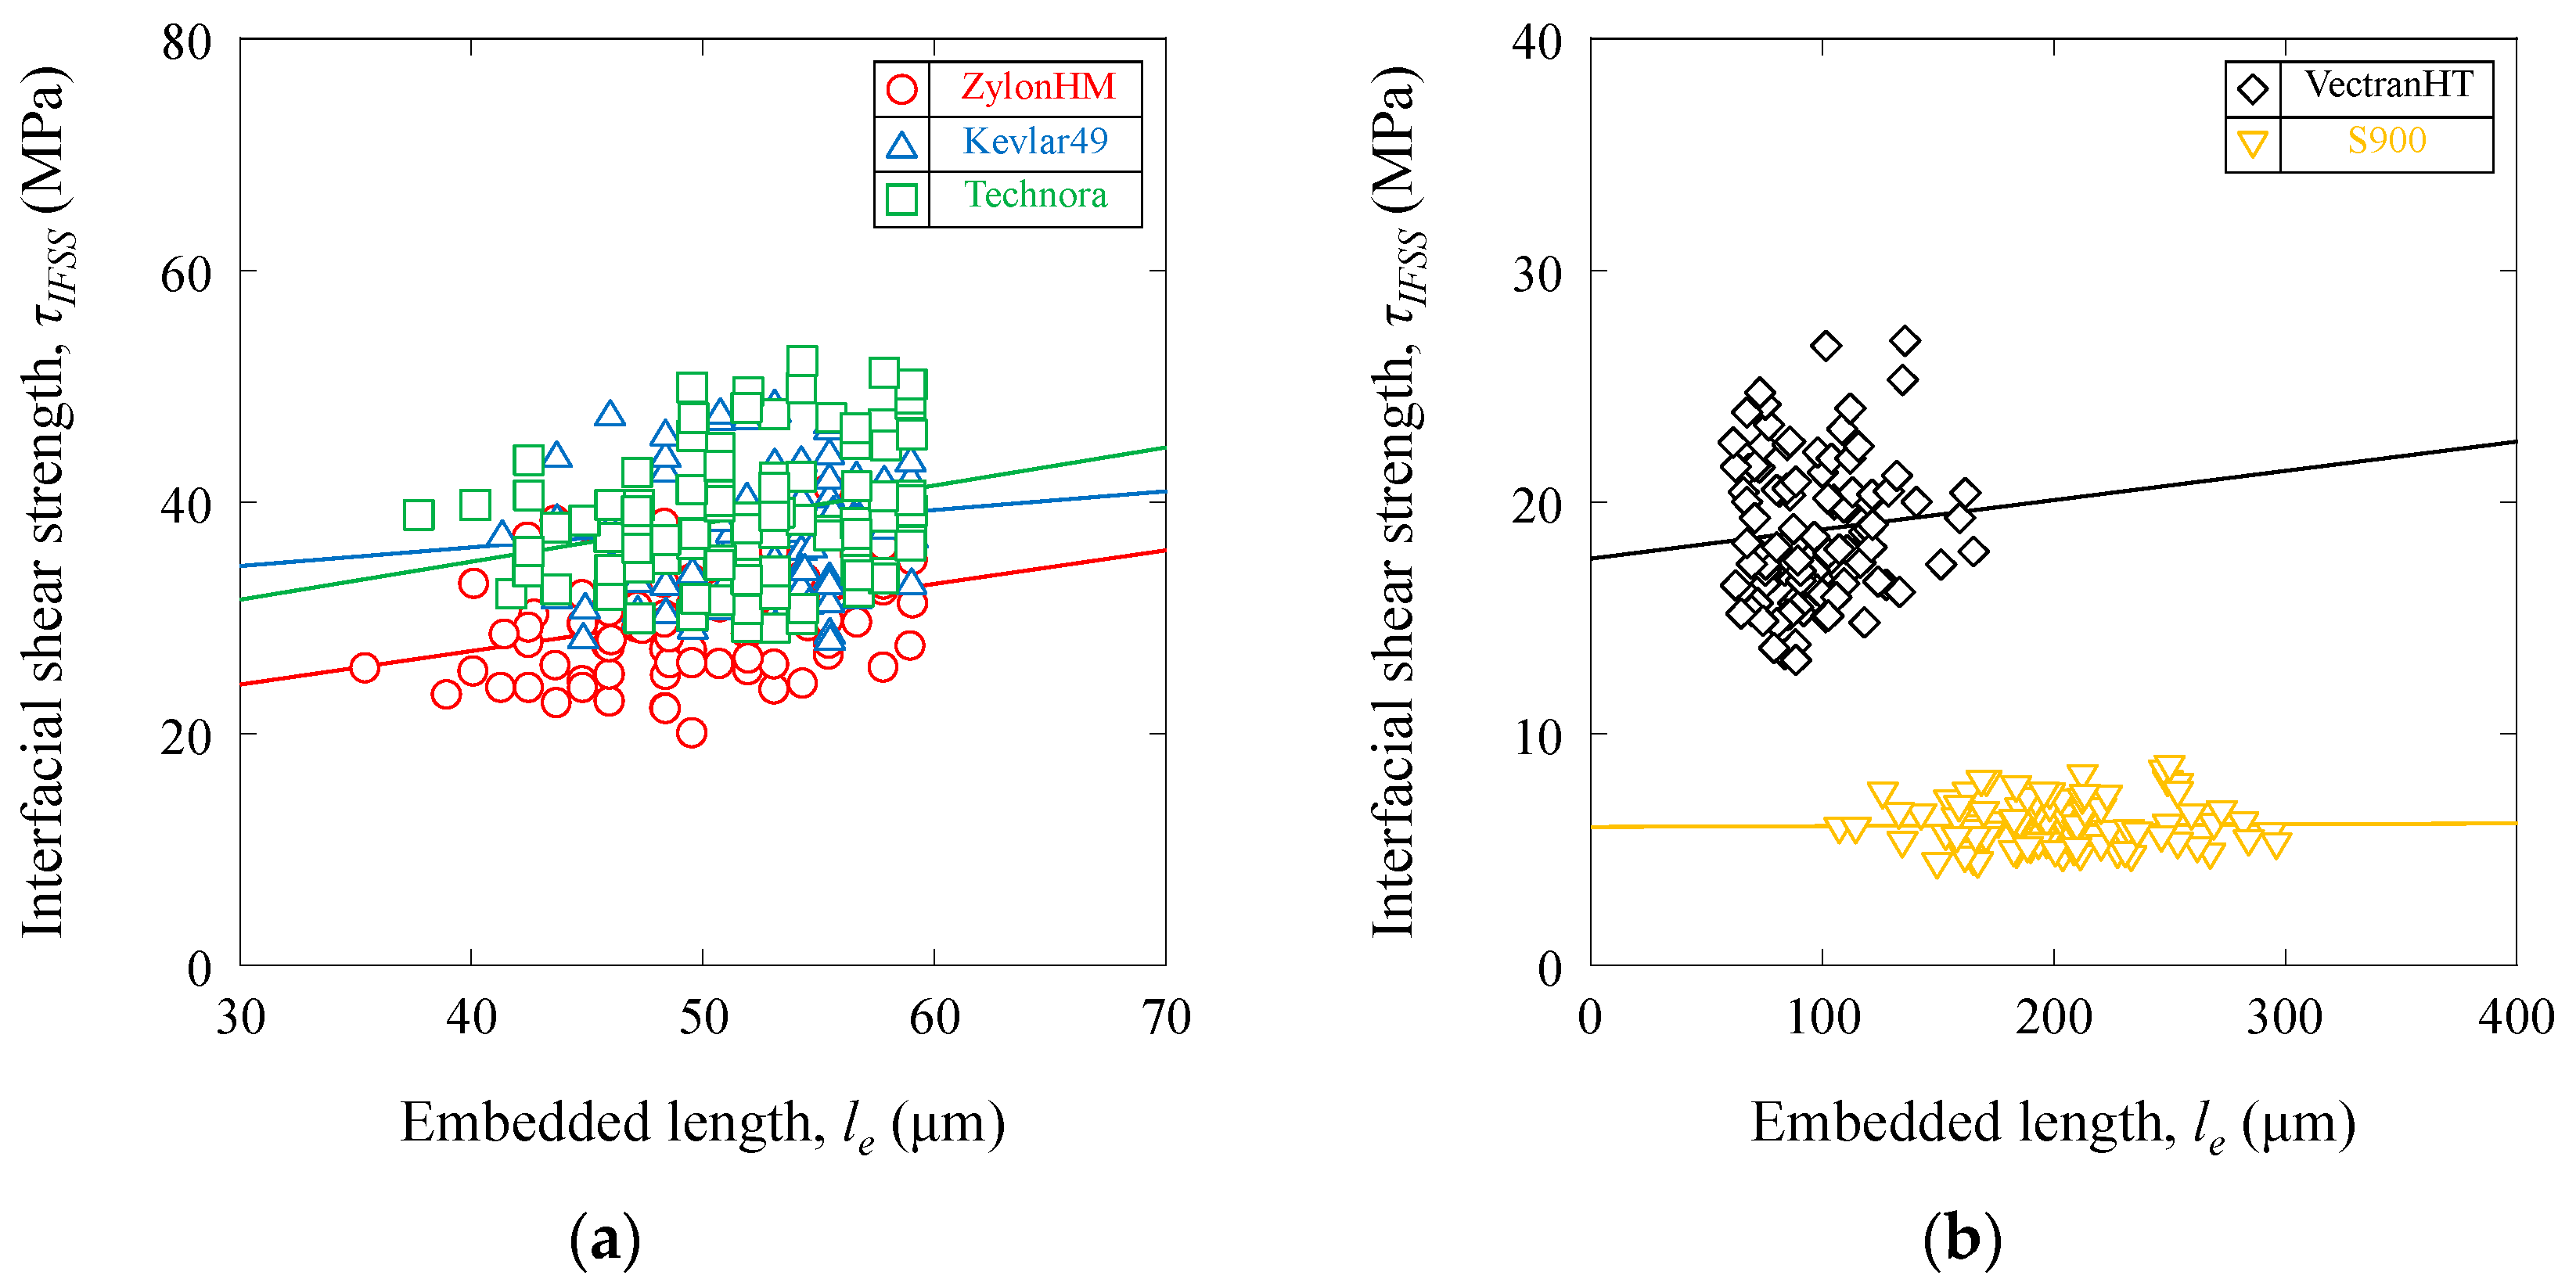
Figure 5 shows the interfacial shear strength τIFSS vs. the embedded length le obtained from the microdroplet test. The average value τIFSS.ave is summarized in Table 1.
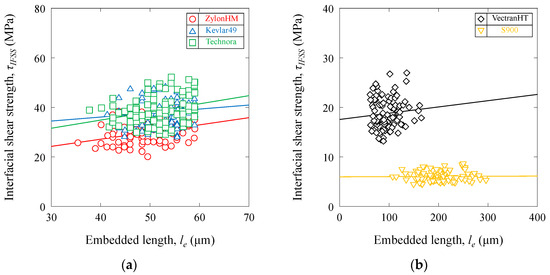
Figure 5.
Interfacial shear strength-embedded length curves for the ZylonHM, Kevlar49, Technora, VectranHT, and S900 polymeric fiber microdroplet composites: (a) ZylonHM, Kevlar49, and Technora fibers; (b) VectranHT and S900 fibers.
The τIFSS.ave values of the microdroplet composites of the PBO, PPTA, and PPODTA fibers are 35.64 ± 5.68 MPa, which are 193% higher than those of the PAR and PE fiber samples (12.17 ± 3.93 MPa), although the τIFSS.ave of all polymeric fiber microdroplet composites were lower than those of carbon fiber samples (47.75 ± 16.38 MPa). There is no difference in the fracture surface morphology of the microdroplet composites among all polymeric fibers. The microdroplet composites have smooth original fiber surfaces with a small amount of resin. Similar results were observed in Figure 4. A correlation was identified between the fracture morphology and interfacial shear strength. Bundle composites with smooth original fiber surfaces exhibited lower interfacial shear strength. The interfacial shear strengths using a single fiber pull-out test for the PBO fiber with several modifications were measured in ref. [3].
3.7. Weibull Modulus vs. Interfacial Shear Strength
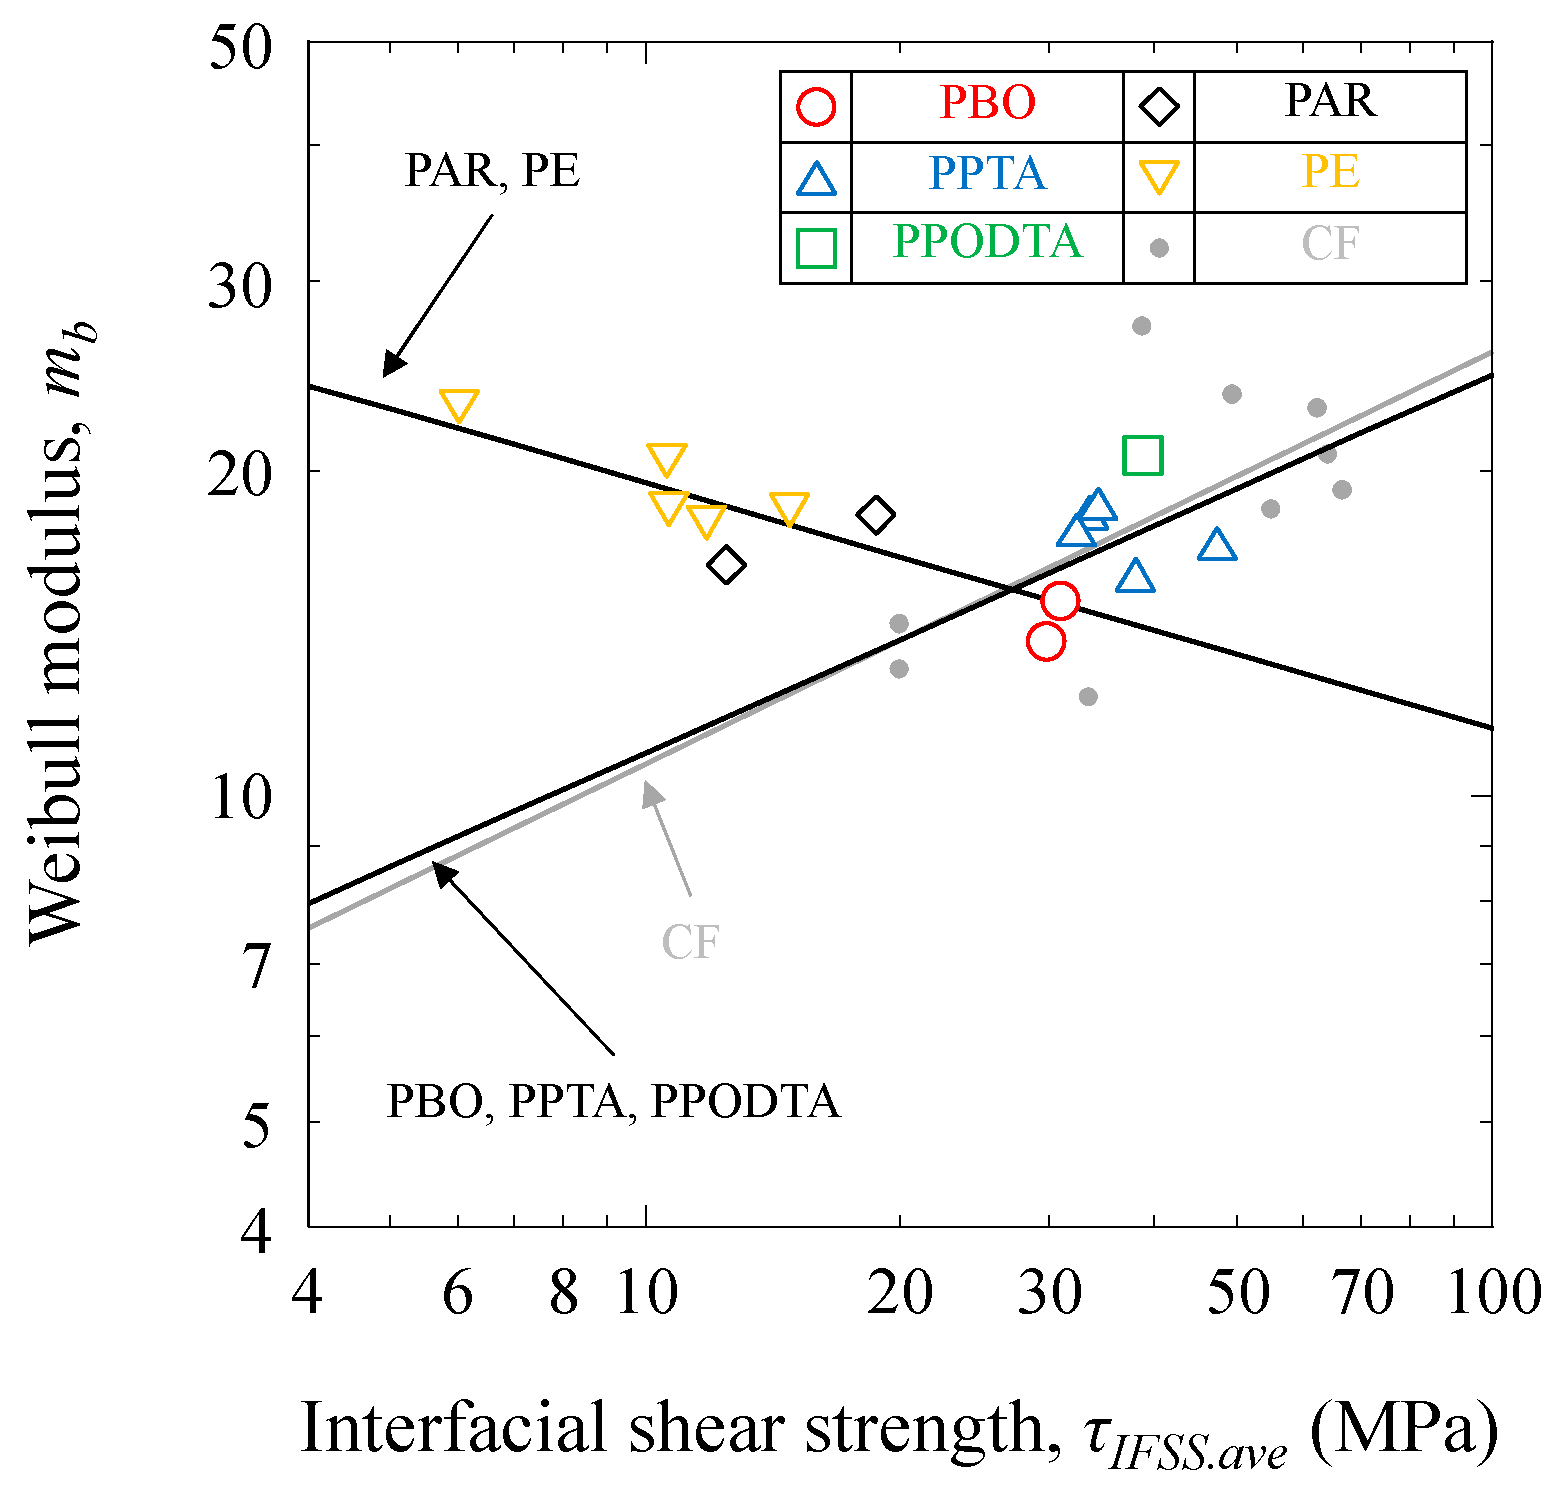
Figure 6 is a representation of the mb as a function of the τIFSS.ave for the PBO, PPTA, PPODTA, PAR, and PE fiber bundle composites. The results for the unidirectional carbon fiber laminate composites [18] are also shown in this figure.
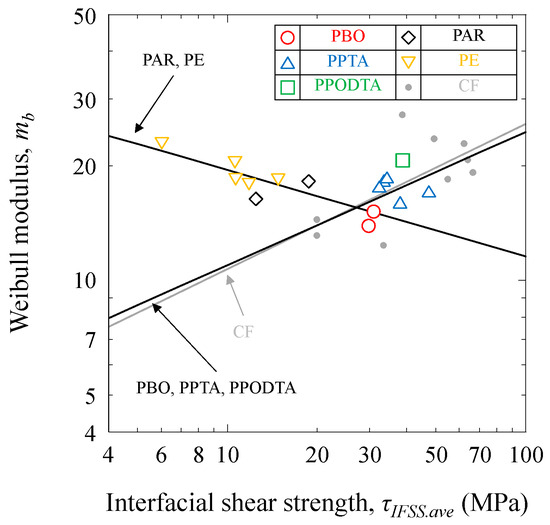
Figure 6.
Weibull modulus of PBO, PPTA, PPODTA, PAR, and PE fiber bundle composites as a function of the interfacial shear strength.
For the lower τIFSS.ave of PAR and PE fibers, the mb decreases with an increase in the τIFSS.ave and there is an almost linear relation between the τIFSS.ave and the mb on a log–log scale. Conversely, for the higher τIFSS.ave of the PBO, PPTA, PPODTA fibers and carbon fibers, the mb increases with an increase in the τIFSS.ave and there is also an almost linear relation between the τIFSS.ave and the mb on a log–log scale. There seems to be an inflection point in the 20–30 MPa interfacial shear strength.
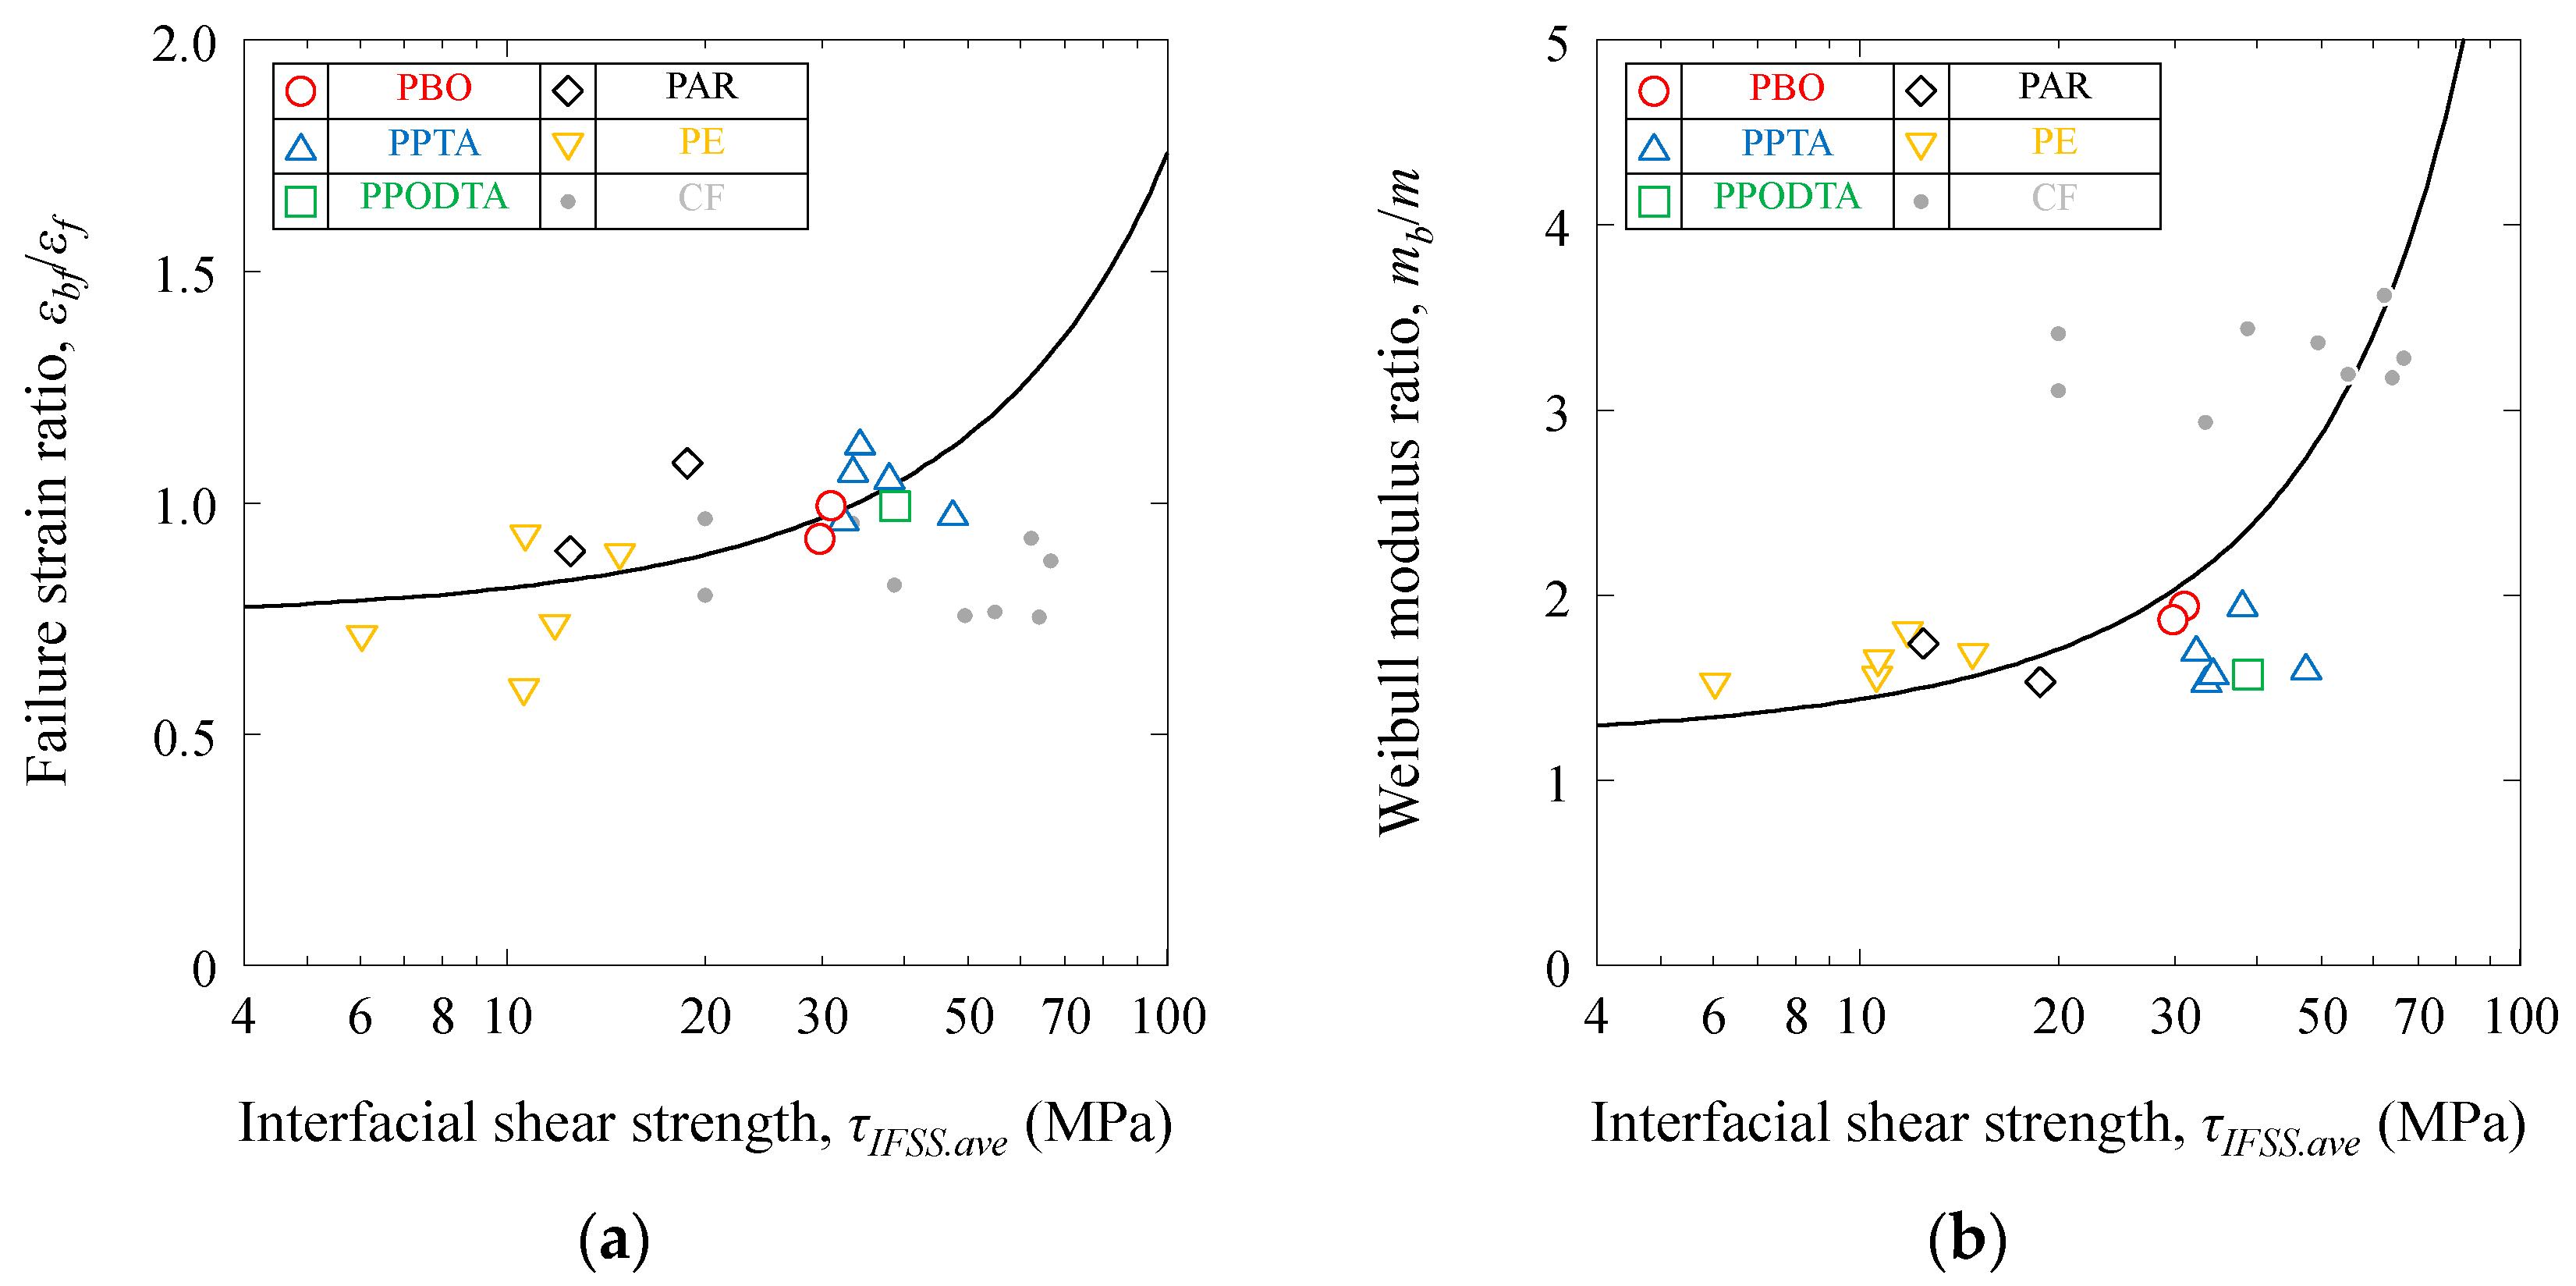
The ratio of the tensile modulus (Eb/E) and strength (σbf/σf) in fiber bundle composites is less sensitive to the interfacial shear strength because the bundle composites are the basic tensile load-bearing component [10] and shows fiber-dominated behavior. Actually, Eb/E = 1.00 ± 0.09 and σbf/σf = 0.90 ± 0.08 for all bundle composites including carbon fibers. However, the ratio of the failure strain and the Weibull modulus in fiber bundle composites is related to the interfacial shear strength. Figure 7 shows the ratio of the failure strain (εbf/εf) and the Weibull modulus (mb/m) of the PBO, PPTA, PPODTA, PAR, and PE fiber bundle composites as a function of the interfacial shear strength. The results for the single carbon fibers [17] and unidirectional carbon fiber laminate composites [18] are also shown in this figure.
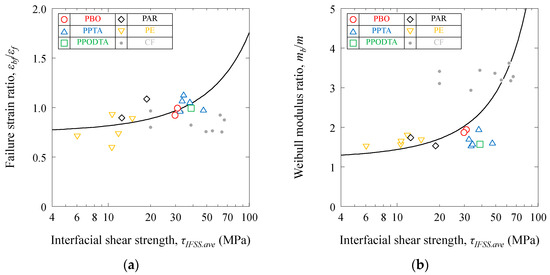
Figure 7.
Failure strain and Weibull modulus ratios of the PBO, PPTA, PPODTA, PAR, and PE polymeric fiber bundle composites as a function of the interfacial shear strength: (a) failure strain ratio; (b) Weibull modulus ratio.
The failure strain (εbf/εf) and the Weibull modulus (mb/m) ratios of the polymeric fiber bundle composites increase with an increase in the interfacial shear strength, although the εbf/εf of the carbon fiber composites showed almost equal values among the low-high interfacial shear strength range because of lower failure strain compared with the polymeric fibers. Interestingly, these inflection points were also observed for the 20–30 MPa interfacial shear strength.
The Weibull modulus of tensile strengths for bundle composites (as well as the tensile modulus and strength and failure strain) is typically dependent on that of the fiber-reinforced composites (laminate composites) [10,18]. However, the interfacial shear strengths are also dependent on the Weibull modulus of the fiber-reinforced composites. These relationships, as illustrated in Figure 3 and Figure 6, are considered useful for material selection.
The polymer fibers reinforcing the epoxy composites demonstrated enhanced axial tensile properties, although the interfacial shear properties of PAR and PE fibers exhibited low values. This is due to the fact that the bundle composites display fiber-dominated behavior. Polymeric-fiber-reinforced polymer composites are poised to become dominant materials in lightweight tension and reinforcing members for transportation and infrastructure applications.
4. Conclusions
The tensile properties of PBO, PPTA, PPODTA, PAR, and PE polymeric fiber bundle composites have been investigated. Weibull modulus values of the tensile strength for the PBO, PPTA, PPODTA, PAR, and PE fiber bundle composites were also characterized. In addition, the interfacial shear properties were evaluated using microdroplet composites. The results can be briefly summarized as follows:
- The Weibull modulus decreases as the tensile modulus and strength increase and the failure strain decreases. In addition, there is a nearly linear relationship between the tensile modulus and strength and failure strain and the Weibull modulus on a log–log scale.
- For the lower interfacial shear strength polymeric fibers, the Weibull modulus decreases as the interfacial shear strength increases. Conversely, for the higher interfacial shear strength polymeric fibers, the Weibull modulus increases as the interfacial shear strength increases. There is also an almost linear relation between the interfacial shear strength and the Weibull modulus on a log–log scale.
Author Contributions
K.N.: Conceptualization, Methodology, Software, Validation, Formal analysis, Investigation, Resources, Data curation, Writing–original draft, Writing–review and editing, Visualization, Supervision. C.N.: Validation, Investigation, Writing–review and editing. S.K.: Validation, Investigation, Writing–review and editing. All authors have read and agreed to the published version of the manuscript.
Funding
This paper is based on results obtained from a future pioneering project commissioned by the New Energy and Industrial Technology Development Organization (NEDO) and the Innovative Science and Technology Initiative for Security Projects (JPJ004596) commissioned by the Acquisition, Technology & Logistics Agency (ATLA).
Data Availability Statement
The datasets supporting the conclusions of this article are included within the article.
Conflicts of Interest
The authors declared no potential conflicts of interest with respect to the research, authorship, and/or publication of this article.
References
- Kumar, S.; Wang, Y. Fibers, fabrics, and fillers. In Composite Engineering Handbook; Mallick, P.K., Ed.; Marcel Dekker: New York, NY, USA, 1997; pp. 51–100. [Google Scholar]
- Hersh, S.P. Polyblend fibers. In Handbook of Fiber Science and Technology; Lewin, M., Preston, B.V., Eds.; Marcel Dekker: New York, NY, USA, 1985; Vol. III: High technology fibers Part A; pp. 1–50. [Google Scholar]
- Marder, E.; Melcher, S.; Liu, J.W.; Gao, S.I.; Bianchi, A.D.; Zherlitsyn, S.; Wosnitza, J. Adhesion of PBO fiber in epoxy composites. J. Mater. Sci. 2007, 42, 8047–8052. [Google Scholar] [CrossRef]
- Languerand, D.L.; Zhang, H.; Murthy, N.S.; Ramesh, K.T.; Sansoz, F. Inelastic behavior and fracture of high modulus polymeric fiber bundles at high strain-rates. Mat. Sci. Eng. A-Struct. 2009, 500, 216–224. [Google Scholar] [CrossRef]
- Rao, Y.; Waddon, A.J.; Farris, R.J. Structure-property relation in poly(p-phenylene terephthalamide) (PPTA) fibers. Polymer 2001, 42, 5937–5946. [Google Scholar] [CrossRef]
- Wu, T.M.; Blackwell, J. Comparison of the axial correlation lengths and paracrystalline distortion for Technora and Kevlar aromatic polyamide fibers. Macromolecules 1996, 29, 5621–5627. [Google Scholar] [CrossRef]
- Pegoretti, A.; Zanolli, A.; Migliaresi, C. Preparation and tensile mechanical properties of unidirectional liquid crystalline single-polymer composites. Compos. Sci. Technol. 2006, 66, 1970–1979. [Google Scholar] [CrossRef]
- Xu, T.; Farris, R.J. Comparative studies of ultra high molecular weight polyethylene fiber reinforced composites. Polym. Eng. Sci. 2007, 47, 1544–1553. [Google Scholar] [CrossRef]
- Naito, K. Tensile properties and Weibull modulus of some high performance polymeric fibers. J. Appl. Polym. Sci. 2013, 128, 1185–1192. [Google Scholar] [CrossRef]
- Hansen, A.; Hemmer, P.C.; Pradhan, S. Average Properties. In The Fiber Bundle Model: Modeling Failure in Materials; Hansen, A., Hemmer, P.C., Pradhan, S., Eds.; Willey: New York, NY, USA, 2015; pp. 11–26. [Google Scholar]
- Li, W.; Chen, W.; Tang, L.; Jiang, Z.; Huang, P. A general strength model for fiber bundle composites under transverse tension or interlaminar shear. Compos. Part. A Appl. Sci. Manuf. 2019, 121, 45–55. [Google Scholar] [CrossRef]
- Gao, X.; Zhu, D.; Fan, S.; Rahman, M.Z.; Guo, S.; Chen, F. Structural and mechanical properties of bamboo fiber bundle and fiber/bundle reinforced composites: A review. J. Mater. Res. Technol. 2022, 19, 1162–1190. [Google Scholar] [CrossRef]
- Miller, B.; Gaur, U.; Hirt, D.E. Measurement and mechanical aspects of the microbond pull-out technique for obtaining fiber/resin interfacial shear strength. Compos. Sci. Technol. 1991, 42, 207–219. [Google Scholar] [CrossRef]
- Nishikawa, M.; Okabe, T.; Hemmi, K.; Takeda, N. Micromechanical modeling of the microbond test to quantify the interfacial properties of fiber-reinforced composites. Int. J. Solids Struct. 2008, 45, 4098–4113. [Google Scholar] [CrossRef]
- Weibull, W. A statistical distribution function of wide applicability. J. Appl. Mech. 1951, 18, 293–297. [Google Scholar] [CrossRef]
- Sarwar, M.A.; Noor-ul-Amin, M.; Khan, I.; Ismail, E.A.A.; Sumelka, W.; Nabi, M. A Weibull process monitoring with AEWMA control chart: An application to breaking strength of the fibrous composite. Sci. Rep. 2023, 13, 19873. [Google Scholar] [CrossRef] [PubMed]
- Naito, K.; Tanaka, Y.; Yang, J.M.; Kagawa, Y. Tensile properties of ultrahigh strength PAN-based, ultrahigh modulus pitch-based and high ductility pitch-based carbon fibers. Carbon 2008, 46, 189–195. [Google Scholar] [CrossRef]
- Naito, K.; Yang, J.M.; Kagawa, Y. Tensile properties of high strength polyacrylonitrile (PAN)-based and high modulus pitch-based hybrid carbon fiber-reinforced epoxy matrix composite. J. Mater. Sci. 2012, 47, 2743–2751. [Google Scholar] [CrossRef]
- Davies, I.J. Best estimate of Weibull modulus obtained using linear least squares analysis: An improved empirical correction factor. J. Mater. Sci. 2004, 39, 1441–1444. [Google Scholar] [CrossRef]
- Absi, J.; Fournier, P.; Glandus, J.C. Influence of experimental parameters on the estimated value of Weibull’s modulus. J. Mater. Sci. 1999, 34, 1219–1227. [Google Scholar] [CrossRef]
- Peijs, T.; Rijsdijk, H.A.; de Kok, J.M.M.; Lemstra, P.J. The Role of interface and fibre anisotropy in controlling the performance of polyethylene-fibre-reinforced composites. Compos. Sci. Technol. 1994, 52, 449–466. [Google Scholar] [CrossRef]

Disclaimer/Publisher’s Note: The statements, opinions and data contained in all publications are solely those of the individual author(s) and contributor(s) and not of MDPI and/or the editor(s). MDPI and/or the editor(s) disclaim responsibility for any injury to people or property resulting from any ideas, methods, instructions or products referred to in the content. |
© 2024 by the authors. Licensee MDPI, Basel, Switzerland. This article is an open access article distributed under the terms and conditions of the Creative Commons Attribution (CC BY) license (https://creativecommons.org/licenses/by/4.0/).