Article

Characterisation of the Mechanical Properties of Natural Fibre Polypropylene Composites Manufactured with Automated Tape Placement

1
Processing of Composites and Design for Recycling, Montanuniversität Leoben, 8700 Leoben, Austria
2
Materials Science and Testing of Polymers, Montanuniversität Leoben, 8700 Leoben, Austria
*
Author to whom correspondence should be addressed.
J. Compos. Sci. 2024, 8(10), 396; https://doi.org/10.3390/jcs8100396
Submission received: 26 August 2024 / Revised: 13 September 2024 / Accepted: 23 September 2024 / Published: 1 October 2024
(This article belongs to the Special Issue Advances in Continuous Fiber Reinforced Thermoplastic Composites)

Abstract

:
The integration of natural fibre thermoplastic composites, particularly those combining flax fibres with polypropylene, offers a promising alternative to traditional synthetic composites, emphasising sustainability in composite materials. This study investigates the mechanical properties of flax/polypropylene composites manufactured using flashlamp automated tape placement and press consolidation, individually and in combination. Tensile, compression, three-point bending, and double cantilever beam tests are utilised for comparing these manufacturing processes and the mechanical performance of the resulting composites. The microstructure of the tapes is investigated using cross-sectional microscopy, and the thermophysical behaviour is analysed utilising thermogravimetric analysis and differential scanning calorimetry. The temperature during placement is monitored using an infrared camera, and the pressure is mapped with pressure-sensitive films. The natural fibre tapes show a good aptitude for being manufactured with automated tape placement. The tensile performance of tapes manufactured with automated tape placement is close to that of press consolidated samples. Compression, flexural properties, and the mode I fracture toughness critical energy release rate all benefit from a second consolidation step.

1. Introduction

Increasing environmental concerns and the demand for sustainable materials have generated considerable interest in composites reinforced with natural fibres (NFs) [1]. These materials, combining natural fibres with polymer matrices, offer an eco-friendly alternative to traditional composites made from synthetic fibres such as carbon or glass fibres [2,3]. Among the various natural fibres available, flax (FLX) has emerged as a promising candidate due to its excellent mechanical properties, biodegradability, and availability [4]. The integration of natural fibres such as flax into polymer matrices not only enhances the mechanical properties of the resulting composites but also significantly reduces their environmental impact, promoting a more sustainable approach to material design and manufacturing [5]. Inexpensive thermoplastic matrix systems are especially appealing to industries that prioritise cost and high production volume, such as the automotive sector [6]. These systems are advantageous because they have high toughness, can tolerate damage, and are easier to recycle compared to thermoset structures [7]. High-performance thermoplastic polymers such as PEEK or PEI are not suitable for use in producing NF composites due to their high melting point [8]. An elevated temperature can damage the fibres and lead to degradation. A temperature above 200 °C can deteriorate the strength and stiffness of the fibres [9]. It is therefore important to choose a polymer matrix, which can be processed at a temperature below the degradation onset of the fibres. Polypropylene (PP) is a widely used low-cost thermoplastic polymer known for its balance of properties, including low density, flame resistance, high impact strength, high heat distortion temperature, and dimensional stability [10]. When combined with natural fibres, PP composites can achieve a favourable balance of mechanical properties and environmental benefits. In addition to the choice of fibre and matrix, the manufacturing method plays a crucial role in determining the final properties of these composites. The ability to tailor the manufacturing process to the specific characteristics of natural fibres is essential for optimising the performance and reliability of the resulting materials. Automated tape placement (ATP) is a popular manufacturing technology that produces high-quality composite parts with precise control over fibre placement and orientation [11].
The predominant techniques for processing fibre-reinforced thermoplastic tapes with ATP involve the use of laser [12,13,14,15,16] or hot gas torch heating systems [17,18,19,20,21,22,23]. Hot gas torch heating systems exhibit a lower energy density and longer response time in comparison to laser systems. This imposes constraints on the potential processing speed and limits the design space. Laser systems involve higher equipment expenses and necessitate placement in a segregated chamber to ensure safety compared to hot gas torch systems [24]. Regarding these aspects, flashlamp systems can serve as an intermediary between hot gas torch and laser heating techniques for thermoplastic ATP. These devices employ pulsed light technology and utilise intense bursts of energy to heat the tapes. These systems use xenon gas entrapped in a lamp to generate energy. The gas is ionised using high voltage to conduct electricity. Periodic discharges of the capacitors produce flashes. These flashes transfer thermal energy to the target. Quartz guides serve as an optical medium for focusing the flashes. These systems possess reduced procurement and operational expenses, along with less stringent safety prerequisites, being more compact and easier to scale, while providing equivalent power to laser systems [25,26].
The ability of flashlamp heating systems to process natural fibre composites has not yet been investigated, and only one study was found that investigates the processability of FLX/PP tapes with laser-assisted ATP [8] and one study that explores the manufacturability of FLX/polylactide (PLA) composites with hot gas torch ATP [27]. Baley et al. [8] investigated the mechanical behaviour of samples manufactured with ATP and a subsequent consolidation step in the press, whereas McGregor et al. [27] tested samples produced directly from the ATP process. McGregor et al. [27] reported an average tensile strength of 202.8 MPa with an average tensile modulus of 16.59 GPa at a fibre mass fraction of around 78% (70% fibre volume fraction). Baley et al. [8] reported an average tensile strength of 183 MPa and an average tensile modulus of 28.9 GPa at a fibre volume fraction of around 41%. The comprehensive evaluation of the mechanical properties is essential for identifying the optimal manufacturing conditions and processing parameters that can enhance the performance of natural fibre composites. Natural fibres exhibit inherent variability in properties such as diameter, length, and mechanical strength, which can lead to inconsistencies in composite performance [28]. Understanding the influence of different processing methods on the microstructure and mechanical behaviour of FLX/PP composites is crucial for advancing their application in industries such as automotive or aerospace. Due to their discontinuous nature, NFs also offer the possibility of being used in novel ATP processes such as stretch-steering, which can further enhance the design capabilities of natural fibres [29].
This paper aims to study the processability of FLX/PP tapes with flashlamp ATP. As a first step, the effect of processing temperature on the tapes is investigated. Different power levels are chosen to find the optimal balance between a temperature level sufficiently high to melt the polymer matrix while mitigating degradation damage to the fibres. The temperature of the substrate and incoming tapes is monitored using an IR camera. The pressure distribution on the tapes is investigated using pressure-sensitive films. To aid in choosing optimal processing parameters, thermogravimetric analysis (TGA) is conducted to find the degradation onsets of the tapes. The effects of the processing method on the mechanical properties of the composite are investigated using a comparative study of samples manufactured with ATP, ATP and press consolidation, and solely press consolidation. The processes are compared using tensile, compression, three-point bending, and double cantilever beam (DCB) tests. The resulting crystallinity of the matrix due to the different heating cycles is analysed using differential scanning calorimetry (DSC). Additionally, the microstructure of the composites is investigated using cross-sectional microscopy. By optimising the manufacturing techniques and thoroughly characterising the materials, this study seeks to contribute to the development of high-performance, sustainable composites suitable for various engineering applications.

2. Materials and Methods

2.1. Materials

The FLX/PP tapes are supplied by FUSE Composite (Zwenkau, Germany). The areal weight is 200 g/m2 with a fibre mass fraction of 50%. No other properties of the tapes are known. The melting point of PP can vary based on the differences in crystallinity. A range of 130 °C to 171 °C is possible. However, most commercially available PP materials (isotactic) have a melting point ranging from 160 °C to 166 °C [10]. The thickness of the tapes is measured with a micrometre at 5 positions on each tape. The width is calculated by image analysis using ImageJ, v1.54j (National Institute of Health, Bethesda, USA) on the same 5 positions by scanning the tapes. A scanner (bizhub c300i; Konica Minolta, Tokyo, Japan) is used to digitise the tapes for the tape width image analysis. The scanner has a resolution of 600 × 600 dpi, which results in a resolution of 23.4 px/mm. The thickness of the tapes before the placement is measured on 16 tapes. A mean thickness of 0.37 mm with a standard deviation of 0.030 mm and a minimum thickness of 0.30 mm and a maximum thickness of 0.42 mm is observed. These results show that there is a high variation in thickness. This results in a different thickness of the laminates over the length of the placement, affecting the mechanical properties locally. The width of the same 16 tapes is measured to be, on average, 25.11 mm before placement with a standard deviation of 0.13 mm. A minimum width of 24.87 mm and a maximum width of 25.47 mm are measured. An exact measurement of the width poses a challenge, as the tapes show fraying on the edges. The high variations in the thickness and width measurements can be attributed to the inherent variations in natural fibres.
The flax fibres are extracted from the stem of the flax plant. Therefore, flax is a bast fibre. Other sources of fibres include leaves or seeds [30]. The structure of a flax plant consists of (from the outside to the inside of the plant) a bark layer, phloem, xylem, and a lumen in the centre. The fibres are present in bundles of 10 to 40 and are linked with pectin. The fibres in return consist of multiple fibrils at a microscopic scale [5]. The centre of the elementary fibre contains the lumen. The fibre consists of multiple layers, with each layer consisting of a different architecture if viewed at a micro scale. The secondary wall is the thickest cell wall and contains fibrils oriented at a 10° angle with the fibre angle. Those fibrils are responsible for the tensile strength of the fibre [4]. The fibrils are bonded by the pectin matrix and consist of cellulose chains, which form a crystalline area if viewed at a nanoscale [31].
The properties of the flax fibre are mainly dictated by the chemical composition. The main components are cellulose, hemicellulose, lignin, pectin, and wax. Cellulose, hemicellulose, and lignin are responsible for the physical properties. Cellulose is the main bearer of the stiffness of the fibre and is also responsible for the hydrophilic nature of natural fibres due to a great amount of hydroxyl groups. The hydrophilic nature of the fibre alters the interface properties when the fibre is used as reinforcement in hydrophobic matrices [32]. This could lead to an inferior composite structure compared to its individual components in many cases. Cellulose is responsible for around 64 to 75% [5] of the chemical composition of the flax fibres. An overview of the chemical composition of the natural fibres can be seen in Table 1. The variability is caused by differences in flax species, agricultural influences, soil quality, climate conditions, manufacturing processes, and measurement conditions [4]. Studies [33] showed cellulose has a strong positive correlation with the tensile strength, whereas hemicellulose, lignin (strong influence), pectin, and wax have a negative influence. Cellulose and pectin have a negative correlation with the moisture absorption, whereas hemicellulose, lignin, and wax have a positive correlation. Cellulose, hemicellulose, and wax content have a predominantly negative influence on the failure strain, whereas lignin and pectin have a positive influence. All components also strongly influence the microfibril angle, which in turn influences the mechanical performance. The mechanical properties of flax fibres are also greatly influenced by the plant growth environment, plant species, harvesting conditions, fibre extraction process, transportation/storage condition, measurement methodology of the properties, and the surface treatment of the fibres [5].
Moisture absorption is a critical parameter when processing natural fibres. Water from the fibres can cause debonding in the fibre and the matrix due to swelling of the fibres. The resulting loss in interfacial bonding between the matrix and the fibre has a negative impact on the strength because the stress transfer from the matrix to the fibre is interrupted when applying force. This results in diminished tensile, compression, and fracture properties [34]. The interfacial bonding between the fibre and matrix is a combination of different mechanisms: molecular entanglement, inter-diffusion of elements, electrostatic attraction, chemical reactions between the matrix and the fibre, as well as mechanical interlocking [35]. The interfacial bonding layer is a combination of the natural fibre and the matrix with different characteristics compared to the non-interfacial parts of the matrix/fibre. Surface treatment, atmospheric conditions while processing the composite, and chemical reactions between the matrix and fibre can alter the surface properties of the fibre, thus decreasing the interfacial bonding.
The fibre volume fraction (FVF) of the composite was calculated based on Equation (1) [36]. Here, ρ P P is the mass density of the matrix, ρ F L X the mass density of the flax fibres, and w f is the fibre mass fraction. It is assumed that there are no voids in the composite. Since neither the mass density of the fibre nor the mass density of the matrix are known from the manufacturer of the tapes, average values from the literature are used. There is a wide range of values for flax fibre densities available. The mass density is highly influenced by the measurement method and the sample preparation. The values can range from 1340 kg/m3 to 1570 kg/m3 [37]. The mass density of polypropylene can be found at 900 kg/m3 [38]. This leads to a calculated fibre volume fraction ranging from 40.2% to 36.4% with an average of 38.2%. However, it needs to be noted that, for NF-reinforced composites, an evaluation of the results based on the fibre mass fraction could be more expressive due to the variation in the natural fibres (e.g., diameter, lumen structure, mass density, etc.).
FVF = ρ P P ρ F L X ( 1 w f 1 ) + ρ P P

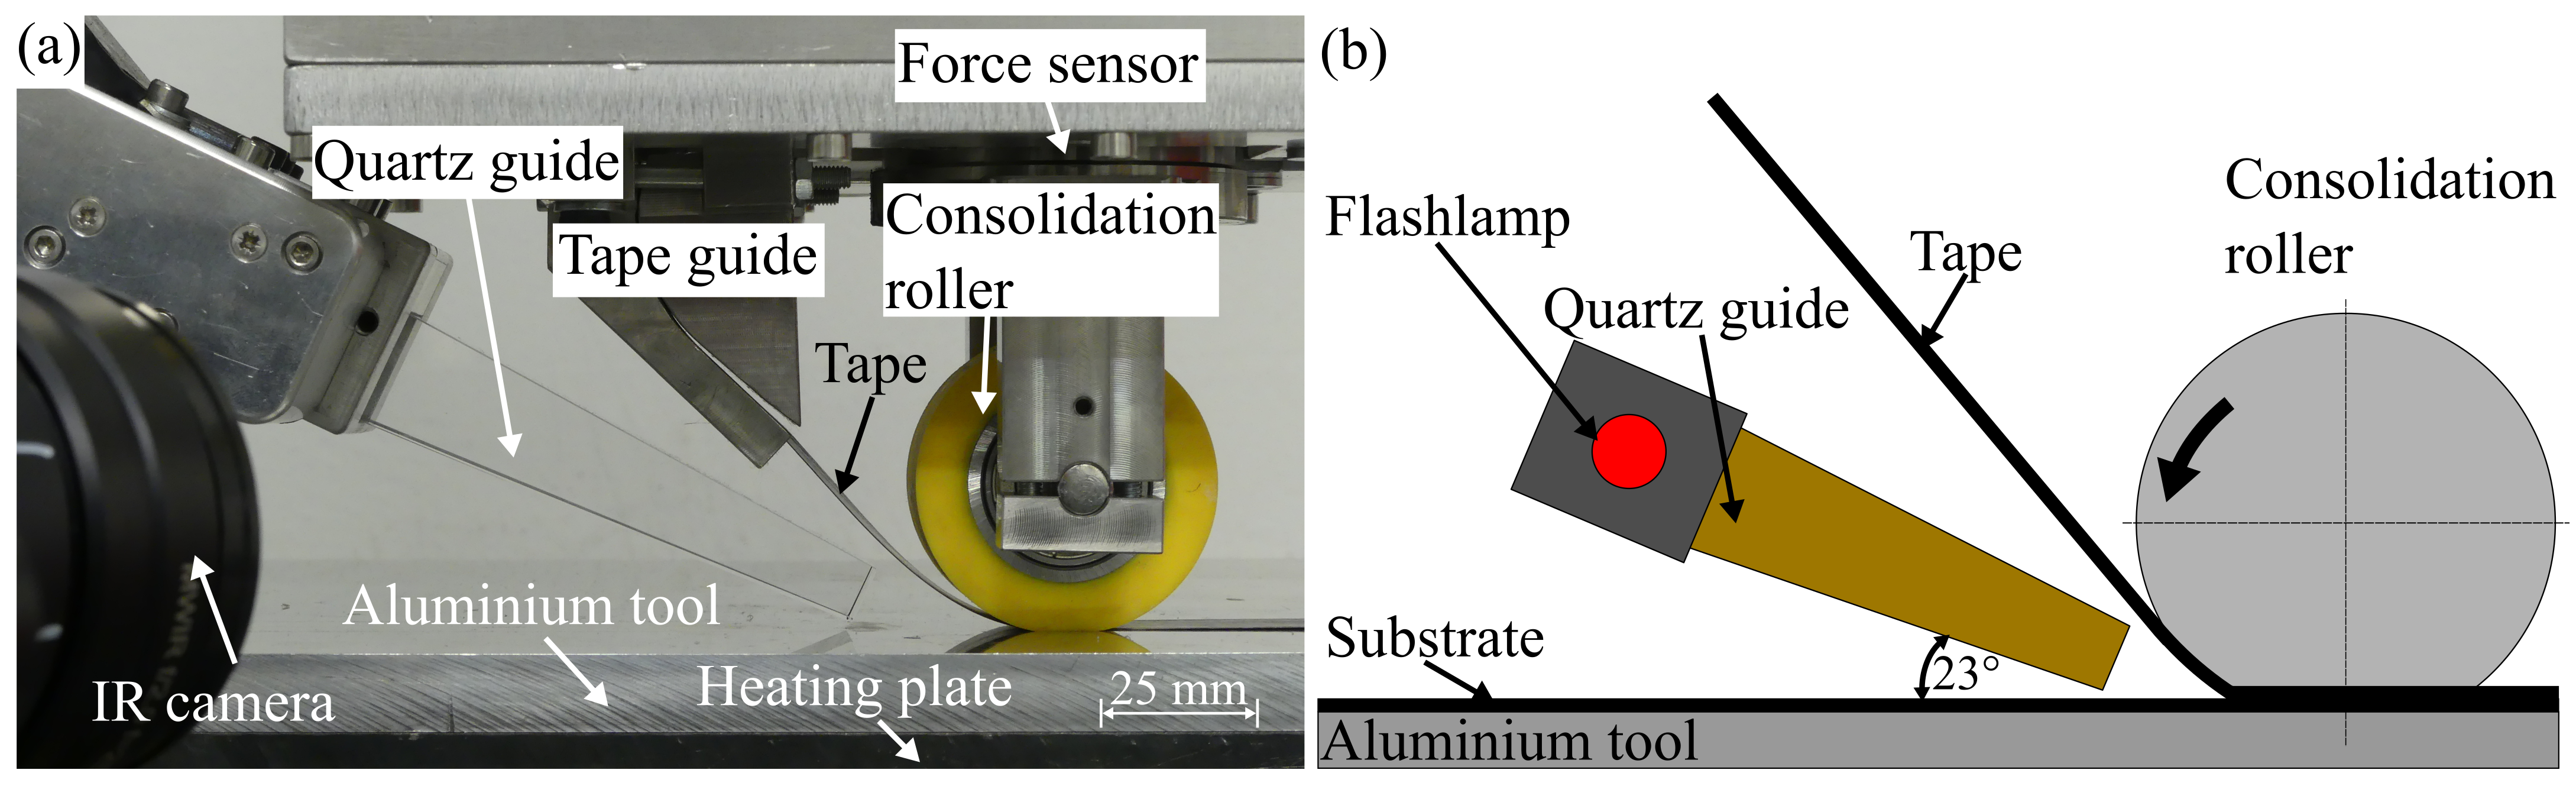
2.2. ATP System and Placement Trials

The ATP system utilised in this investigation is depicted in Figure 1a and consists of a placement head with a feeding unit, a silicone compaction roller with a hardness of 70 Shore A, a width of 30 mm, and a diameter of 50 mm. The system is capable of placing 25.4 mm wide tapes onto a heated aluminium tool with dimensions of 700 mm × 350 mm. The tool can be heated with a precision of ±1 °C. The consolidation force is quantified using a multi-component sensor that has a precision of 4 N and a resolution of 0.2 N. A hygrometer is utilised to monitor the ambient temperature and humidity in the placement room and material storage. The hygrometer has a temperature measurement accuracy of ±0.5 °C and a resolution of 0.1%. The humidity can be measured with an accuracy of ±3% and a resolution of 0.1%. The placement tests are conducted using a humm3 flashlamp system (Excelitas Novlelight, Hanau, Germany) as the heating source (see Figure 1b). The quartz guide is inclined at an angle of 23° with respect to the substrate and has a width of approximately 30 mm. Figure 1b displays the configuration of a chamfered quartz guide with a single radiating surface used in this investigation. The tapes are placed directly onto the aluminium tool.
This study investigates three processes for the manufacturing of the samples: ATP, ATP + press consolidation, and press consolidation. The natural fibre materials have been dried in a vacuum oven for 72 h at 80 °C before manufacturing the samples. All samples manufactured with ATP use a consolidation force of 200 N. The lay-up speed is set to 50 mm/s, and the tool temperature is kept at 120 °C. The heating parameters for the flashlamp system are set to 120 V, 60 Hz, and 2000 µs. This results in power of 2928 W. After manufacturing, the samples are kept under vacuum except for the phase of gluing the end tabs (24 h). The samples manufactured with ATP + press consolidation use the same ATP parameters. These samples are consolidated after the ATP process in a press using spacers to achieve the desired thickness. The press temperature is set to 170 °C for all samples. The tapes are placed into the press, and the press is closed until the force reaches 120 kN. It needs to be noted that the high force is a result of the press pressing onto the spacing frame. We hold the samples at 170 °C under vacuum for 30 min to ensure even heating. After this phase, the samples are cooled down under pressure until they reach 100 °C (around 6 h). The samples solely manufactured with press consolidation use the same press steps.
The DCB samples (with a thickness of 5 mm) are made from 24 layers, and the samples for all other mechanical tests (with a thickness of 2 mm) consist of 10 layers. For the tensile, compression, and three-point bending tests, 6 samples are produced. From each tape specimen produced, a tensile, compression, and three-point bending sample is cut from the centre of the tape specimen. Two samples are manufactured for the DCB tests. Each sample contains 3 DCB test samples. A Kapton film for crack initiation is placed between layers 12 and 13 during the manufacturing of these DCB samples for crack initiation. The fracture surface was investigated using a Clara Scanning Electron Microscope (SEM) (Tescan, Brno, Czech Republic). Three NF/PP plates are manufactured with the press: one for the tensile and three-point bending samples, one for the compression test samples, and one for the DCB samples.

2.3. Temperature and Pressure Measurement

The temperature of the incoming tape and the substrate is measured using an Image IR 8300 IR camera (InfraTec, Dresden, Germany). The detector has a format of 640 × 512 pixels and a temperature resolution of 0.025 K at 30 °C. A lens with a 25 mm focal length is used. The temperature range is set at 125 °C to 300 °C with an integration time of 30 µs. The acquisition frequency is set to 200 Hz. The temperature was measured close to the nip point by utilising a measuring area across the tape width to obtain an average temperature. It needs to be mentioned that effects of surface emittance and specular reflections of the opposing surface could lead to distortions in the temperature measurement [39]. An emissivity factor of 1 was chosen for the IR camera based on temperature measurement. The measured temperature could therefore be different from the actual processing temperature, as the real emissivity is not known and the temperature is not measured at the nip point. However, the IR setup and all settings were kept constant for all ATP experiments, and thus, qualitative comparability was ensured. To assess the impact of flashlamp heating parameters on fibre degradation, a set of tapes is placed with varying power levels. The pulse width and voltage are fixed and set to 2200 µs and 120 V, respectively. The frequency is varied, ranging from 40 to 80 Hz. The consolidation force is set to 200 N, the lay-up speed to 50 mm/s, and the tool temperature to 120 °C. The consolidation force was selected based on previous trials to ensure good consolidation while keeping the squeeze flow low. The temperature of the incoming tape is measured close to the nip point as an average of an elliptical area, and the temperature on the substrate is measured with a circular area. Both measurement areas are close to the nip point. Direct measurement of the nip point is not possible with the IR camera. A series of tapes is placed with two tapes on top of each other, resulting in a [ 0 ] 2 laminate. These tapes are used to evaluate the temperature of the incoming tape and the substrate during placement. The temperature of the first layer is not measured due to the reflections of the aluminium tool, which results in an incorrect temperature measurement.
The consolidation pressure is, together with the temperature and the lay-up speed, one of the most important components in achieving good consolidation and therefore high mechanical properties [21]. Prescale LLW pressure-sensitive films (Fujifilm, Minato, Japan) are used to quantify the pressure of the consolidation roller. These films have a precision of ±10% at 23 °C and 65% humidity. The LLW films can measure pressure ranging from 0.5 to 2.5 MPa. The pressure is measured by placing the films under the consolidation roller and pressing onto the film. The force is increased continuously from 0 N to the target force for 5 s and held at the target force for an additional 5 s. After applying the pressure to the films, they are scanned using a bizhub c300i scanner at a resolution of 600 dpi. The scans are evaluated using a custom python script. The greyscale–density relationship was extracted from the data sheet of the pressure measurement film. A cubic function is fit to the greyscale–density relationship and a polynomial to the order of 5 to the density–pressure relationship.

2.4. Thermogravimetric Analysis

Thermogravimetric analysis is used to investigate the degradation behaviour of the FLX/PP tapes used for this study. The measurements were performed with a TGA/DSC 3+ STARe (Mettler Toledo, Columbus, USA) system. Samples are extracted from the tapes from various locations along the length and width of a random selection of places to avoid systematic influences on the results. The sample weights range from 9 to 15 mg. All measurements start at a temperature of 25 °C, and the samples are heated up to 650 °C. The heating rate is 10 °C/min, and all measurements are conducted under nitrogen atmosphere at a flow rate of 50 mL/min.

2.5. Differential Scanning Calorimetry

The melting point and crystallisation temperature of the FLX/PP tapes for all manufacturing methods and a virgin sample are measured to compare the influence of the manufacturing method on the crystallinity. The result from the virgin sample is used to find the adequate processing temperature and compare the changes in crystallinity after processing. This helps to link any changes in molecular structure to the mechanical tests. All DSC tests are conducted on a DSC 8000 device (PerkinElmer, Waltham, MA, USA). The samples are heated from 25 °C to 200 °C and held at this temperature for 2 min to eliminate prior processing effects and residual crystal formations. Subsequently, the samples are cooled to −50 °C and then reheated to 250 °C to assess any changes in crystallisation due to processing. The samples are once again cooled down to 25 °C. The heating rate for all measurements is 10 °C/min, and all tests are conducted under nitrogen atmosphere with a flow rate of 50 mL/min. All samples have a weight of around 20 mg to ensure at least 10 mg of matrix for each test. Crystallinity ( X c ) is calculated based on Equation (2) [40]. Here, Δ H m is the enthalpy of melting, Δ H f 0 is the enthalpy of fusion of a totally crystalline polymer, and w f is the fibre mass fraction. The value for Δ H f 0 is obtained from the literature ( Δ H f 0 = 207 J/g) [41].
X c = Δ H m Δ H f 0 ( 1 w f )

2.6. Mechanical Tests

All mechanical tests are conducted with a Z250 Zwick Roell universal testing machine (Zwick Roell, Ulm, Germany), and the data are evaluated using the testXpert III, v1.9 (Zwick Roell, Ulm, Germany) software from Zwick Roell. The samples are all prepared according to relevant standards, but it needs to be mentioned that none of the standards mention NF tapes explicitly. Therefore, the test procedures and dimensions of the NF samples are selected based on experience and the standards for the other fibre types. Furthermore, there is currently no standard for the double cantilever beam test for thermoplastic materials. All samples are unidirectional and are tested in the fibre direction for the tensile and compression tests.

2.6.1. Tensile Test Setup

Figure 2a shows the setup for the tensile tests. All samples are prepared according to DIN EN ISO 527-4:2023 [42] and tested accordingly. A 10 kN load cell and test speed of 2 mm/min are used for all samples. The strain is measured using extensometers. The samples are prepared according to type 2 samples and have a dimension of 250 × 25 × 2 mm. End tabs are cut from glass fibre boards and have a fibre orientation of ±45°. An epoxy glue (UHU Plus Endfest 300; UHU, Bühl, Germany) is used for the end tabbing. The glue is cured under pressure at room temperature for 24 h. The glue provided high enough strength for the samples and did not fail for any tests. However, methyl methacrylate (MMA) adhesives are recommended for PP samples, especially for higher-strength fibre types. The gauge length for all samples is 150 mm.

2.6.2. Compression Test Setup

Figure 2b shows the compression test setup. The tests are carried out according to ISO 14126:2023 [43]. A 250 kN load cell is used for all samples, and the samples are clamped with a hydraulic composite compression fixture (HCCF) with 150 bar clamping pressure. All samples are end tabbed with the same methodology as for the tensile tests. The samples have a dimension of 150 × 10 × 2 mm. The gauge length is set to 10 mm. The strain measurement is conducted with digital image correlation (DIC). A speckle pattern is applied to the gauge section using black spray paint, and a white ground coat is used to enhance contrast. A 3D DIC system from Mercury (Brno, Czech Republic) is used. The strain data are analysed with Mercury RT V2.9 software. The cameras (Prosilica GR 6600) for the DIC system are supplied by Allied Vision (Stadtroda, Germany). A 100 mm macro lens is used for both cameras. The exposure time is set to 8 ms, the frame rate is 3 fps, and the aperture is set to f/2.8. The test speed is set to 1 mm/min for all samples.

2.6.3. Three-Point Bending Test Setup

Figure 2c shows the setup for the three-point bending tests as specified by ISO 14125:1998 [44]. The samples are prepared according to class III and have a dimension of 60 × 15 × 2 mm. A 10 kN load cell is used for the data collection. The radius of the bearing is 5 mm. All samples have a gauge length of 40 mm. The displacement is measured with a displacement transducer below the samples. The tests were carried out at a speed of 1 mm/min.

2.6.4. Double Cantilever Beam Setup

Figure 2d shows the DCB test setup. The tests are conducted according to ISO 15024:2023 [45]. The Kapton film used for crack initiation has a thickness of 50 µm. The section with the film inserts is 60 mm long, whereas the measurement section is at least 80 mm long. All samples have a width of 20 mm. The thickness is set to 5 mm. At the first stage of the test, the samples are loaded until the crack is drawn out of the insert area and then unloaded again. After the initial position is reached again, the test is started until a crack length of at least 100 mm. The crack is monitored using a camera, and a picture is taken every 2 s. The test speed is 1 mm/min. The crack length is measured using a scale transferred onto the sample with white paint. The holders for the sample are glued onto the sample with a two-component epoxy glue (3M Scotch-Weld DP490; 3M, Saint Paul, USA) and cured for 2 h under pressure at 60 °C.

3. Results and Discussion

3.1. Temperature Evaluation

Figure 3a shows the circular and elliptical area used for all temperature evaluations done in this study. The average temperature over the steady-state placement length of the incoming tape for the second tape layer of a [ 0 ] 2 laminate is shown in Figure 4a. It can be seen that the temperature increases as the frequency increases, and therefore the power increases. Compared to carbon fibre (CF)/PA6 tape with the same setup [46], the temperature is around 100 °C lower for all frequency levels. This can be explained with a different heat transfer of the fibres and the polymer. Figure 4b shows the average steady-state temperature of the substrate (previously placed NF tapes). The temperature on the substrate is higher and has a higher variation. This could lead to the burning of the fibres on the substrate. The higher temperature on the substrate is a result of the quartz guide placement configuration. The angle of the quartz relative to the substrate and the incoming tape results in a higher heat distribution to the substrate. The angle, however, cannot be changed to reduce the heat transfer to the substrate due to the restrictions of the ATP machine.
Figure 3b shows the tool-facing side of the tapes placed with varying frequency values. The tapes placed at 40 Hz and 50 Hz show no burned fibres, whereas the tapes with 70 Hz and 80 Hz show clearly burned fibres. The tape placed with a frequency of 60 Hz and a pulse width of 2200 µs shows punctual burned fibres black circles). A minimal amount of the surface fibres start to burn at an average placement temperature of around 190 °C. This can be attributed to some of the fibres not being fully embedded in the matrix of the tape and therefore experiencing a higher temperature. The substrate tapes are less likely to have burned fibres due to the consolidation step embedding the fibres into the matrix. It needs to be noted that the emissivity in this study is set to 1, and the measured temperature can vary from the true temperature. The temperature in this study is used to compare the different process parameters with each other and to monitor the process. Burned fibres could influence the mechanical properties of the composite and are therefore deemed a crucial factor in selecting the settings of the flashlamp. The selected temperature must ensure sufficient melting of the matrix to guarantee bonding without degrading the fibres. The heat transfer of the FLX/PP is taking place over the fibres. This was confirmed by placing glass fibre/PP tapes at the same processing conditions. No heat transfer was observed in the IR images, and no melting of the matrix could be seen. In order to mitigate the influence of burned fibres, the pulse width for all subsequent placement trials is set to 2000 µs, and a frequency of 60 Hz is chosen. The resulting temperature is therefore below the start of degradation of the fibres measured from the TGA tests at around 220 °C and over the melting point of the matrix at around 162 °C measured with DSC (see Section 3.3).
The temperature for all mechanical test samples has been monitored over the whole placement length. Figure 4c shows the average temperature for the substrate and incoming tape of the samples manufactured for tensile, compression, and three-point bending tests (consisting of 10 layers each). The first tape layer shows only the temperature for the incoming tape because the first tape for all samples was placed directly onto the aluminium tool. For all subsequent layers, the incoming tape and the substrate (the previous placed layer) are measured. The temperature is steady for most of the layers of the placement for both the incoming tape and the substrate.

3.2. Pressure Measurement

Figure 5 shows the pressure distribution of the 70 Shore A consolidation roller and a NF tape with 200 N and 500 N consolidation force (Figure 5a,b, respectively). Figure 5c shows the pressure distribution on a carbon fibre tape with 500 N consolidation force. The 500 N consolidation force was selected to show the differences in pressure distribution between an NF tape and a CF tape more clearly compared to the 200 N consolidation force used for all experiments in this study. The load bearing on the NF tape is not as even compared to the CF tape due to a more uneven fibre distribution across the width of the NF tape. However, the pressure difference between the carbon fibres and the matrix-rich zones is higher compared to the NF tapes. The carbon fibres take most of the load, whereas the load bearing is distributed between the fibres and matrix in the NF tapes. The stiffness of the fibres could play a role in this effect, as the natural fibres are more easily squeezed and are conformable. Furthermore, it can be seen that not all fibres are aligned straight in the placement direction. This could result in worse mechanical performance compared to a higher-aligned tape. The fibre orientation plays a major role in the mechanical performance of fibre-reinforced composites. However, the contact length is greater on the NF tape, resulting in a 299 mm2 contact area compared to the CF tape’s 273 mm2. This results in an increase in time available for bonding, which could increase the bonding strength. The difference in contact area could be a result of the stiffness difference between the tapes. The NF tape is less stiff and therefore results in less resistance to bending and conforms better with the consolidation roller. The mean pressure on the CF tape for 500 N is higher (1.68 MPa) compared to the NF tape at the same force level (1.57 MPa). The NF tape with 200 N consolidation force has a mean pressure of 1.01 MPa and a consolidation area of 108 mm2.

3.3. Thermophysical Analysis

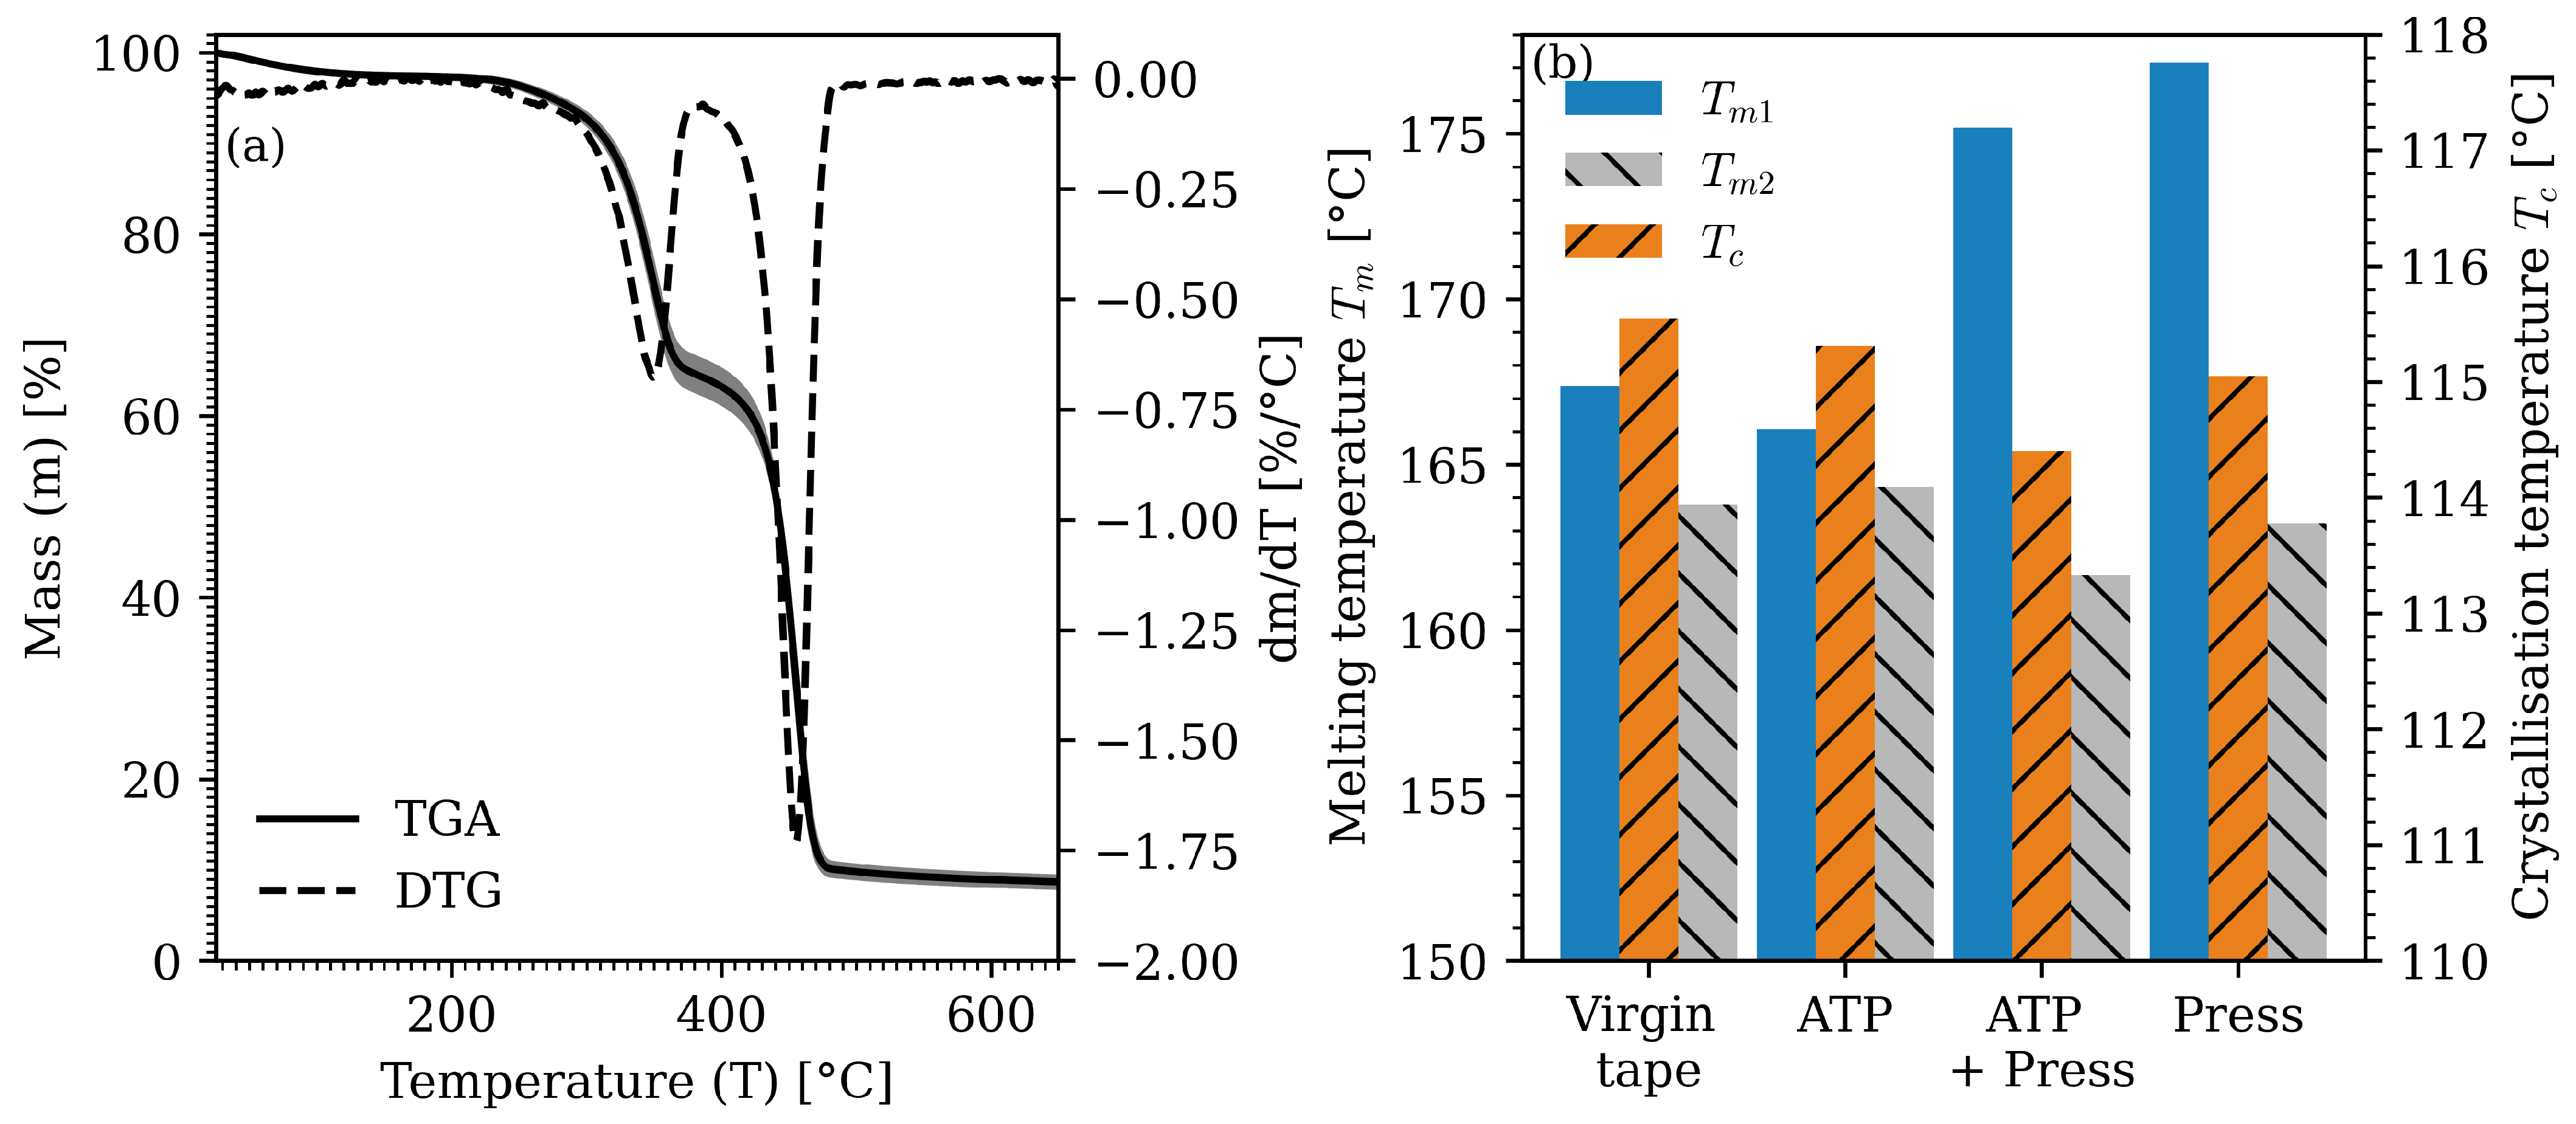
3.3.1. TGA Measurements

Figure 6a shows the result (TGA and derivative thermogravimetry (DTG) curve) of the three TGA measurements conducted for samples of the FLX/PP tape before processing. The data of the three measurements were combined, and the average of these measurements is displayed. The standard deviation is annotated with the shaded region around the TGA curve. The data for the TGA and DTG are smoothed with a Savitzky–Golay filter with window length of 30 and a polynomial order of 2. It can be seen that the degradation consists of two main stages. The first stage starts at around 218 °C (dm/dT < −0.01%/°C) until around 397 °C (lowest dm/dT after the first peak). This stage mainly consists of the degradation of the flax fibres. The fastest degradation takes place at the first peak at 360 °C. The second main stage starts at around 397 °C to around 533 °C (dm/dT > −0.01%/°C), with the fastest degradation taking place at 467 °C. This stage is mainly characterised by the degradation of the PP matrix. The degradation of the flax fibre and the PP matrix cannot be clearly separated. Some components of the flax fibre (e.g., hemicellulose and cellulose) degrade at a lower temperature (around 330 °C under air atmosphere), whereas other components (e.g., lignin, sugar mallard derivatives) need a temperature of up to 550 °C to fully degrade (around 433 °C under air atmosphere). The degradation of the flax fibres started at around 220 °C under air atmosphere [47]. This is similar to the starting point of degradation for the FLX/PP samples. In addition to those two main stages, an initial degradation can be seen, which can be attributed to the evaporation of the moisture enclosed within the tapes. This stage accounts for around 2.7 m% weight loss. TGA measurements of CF/PP and glass fibre/PP samples showed that the PP matrix sees maximum degradation at 454 °C for both samples. The degradation of the PP sample starts at around 352 °C (dm/dT < −0.01%/°C) and ends at around 480 °C (dm/dT > −0.01%/°C). The PP matrix of these samples, however, is not the same as for the FLX/PP tapes because they are supplied from a different supplier. These samples aid in helping categorise the degradation temperature steps of the NF tapes.

3.3.2. DSC Measurements

Figure 6b shows the results of the DSC tests for a virgin FLX/PP sample and a FLX/PP sample from each of the manufacturing methods. The first peak melting temperature ( T m 1 ) and crystallisation temperature ( T c ) are annotated. The second peak melting temperature ( T m 2 ) was obtained after the first cooling to −50 °C. The first crystallisation temperature is used to compare the crystallinity of the samples to draw conclusions about differences in mechanical performance due to the different heating and cooling rates during manufacturing of the samples. The second melting temperature is used to draw conclusions about any degradation in the matrix due to processing. It needs to be mentioned that this measurement can just give hints and no final conclusion, as the second melting temperature is too insensitive. Based on Equation (2), the crystallinity of the virgin sample is calculated as 72% for the initial melting cycle. The ATP sample has a crystallinity of 59% for the first melting cycle and 53% for the second one, whereas the press samples have 73% crystallinity for the first and 50% crystallinity for the second heating cycle. Additionally, T m 1 for the virgin sample is around 162 °C, whereas for the ATP sample, T m 1 is higher at 166 °C. The press consolidated sample shows the highest T m 1 at 177 °C. The second melting cycle shows no significant difference in the temperature, and the crystallisation temperature is also similar for all three samples. The difference in T m 1 can be explained by the different crystalline structure of the matrix, as α -crystals melt at a higher temperature compared to β -crystals [48].
The press consolidation step has a lower cooling rate compared to the ATP process and, therefore, a higher level of crystallinity and a higher content of the stable α -crystals are expected [49]. A cooling rate approaching 1 K/min leads to a near 100% α -crystalline structure (in terms of ratio of α and β -crystals, not absolute crystallinity). This coincides with the high T m 1 of the press consolidated sample due to an average cooling rate of 0.2 K/min. Since the difference between mechanical parameters of the matrix and the flax fibres is smaller compared to glass or carbon fibre, it is expected that the matrix plays a non-negligible role in the mechanical performance of the composite.

3.4. Mechanical Tests

3.4.1. Tensile Tests

Figure 7 shows the results of the tensile tests for all three manufacturing methods. The results are also summarised in Table 2. Young’s modulus ( E t ), tensile strength ( σ t M ), and elongation at break ( ε t ) are depicted in the table as well as in the figure. The mean and standard deviation are calculated using all six samples for each configuration, except for the press method. One sample was classified as an outlier and removed based on the 1.5 IQR method. Also, E t as well as ε M are outside of the 1.5 IQR range, and the sample is therefore removed. The ATP + press method yields the highest Young’s modulus at (17.4 GPa), followed by the press method (15.5 GPa). The ATP method shows the lowest Young’s modulus but has the lowest variation within the three measured mechanical parameters. The tensile strength in contrast is lowest for the press method (133.7 MPa), followed by the ATP method at 134.4 MPa. Both values, however, are within one standard deviation of each other. The elongation at break is nearly identical for all three methods and lies between 1.3 and 1.4%. An analysis of variance (ANOVA) at a significance level of α = 0.05 and a comparison with the Tukey method for the means show that E t , σ t M , and ε t are significantly different between the ATP and ATP + press method as well as the press consolidation and ATP + press method. The means that the ATP and the press method are not significantly different, showing that the manufacturing with ATP achieves comparable mechanical performance to press consolidation.
The tensile properties of the composite are dominated by the fibrous reinforcement. Typical values for flax fibres are: E t = 12 GPa to 103 GPa, σ t M = 343 MPa to 2000 MPa, and ε t = 0.94% to 4%. Young’s modulus is affected by multiple factors, including the number and diameter of the fibres, the molecular composition of the flax fibre, and the interface layer treatment (e.g., coupling agents or chemical treatments) [4,5,50]. It was also shown that the gauge length of the testing has an influence on the mechanical properties [51]. Young’s modulus and tensile strength of the matrix are lower, with E t between 0.95 and 1.77 GPa and σ t M between 26 and 41.4 MPa. The elongation at break, however, is higher, with values for ε t between 15% and 700%. A higher fibre mass content increases the tensile strength but decreases the elongation at break [50].

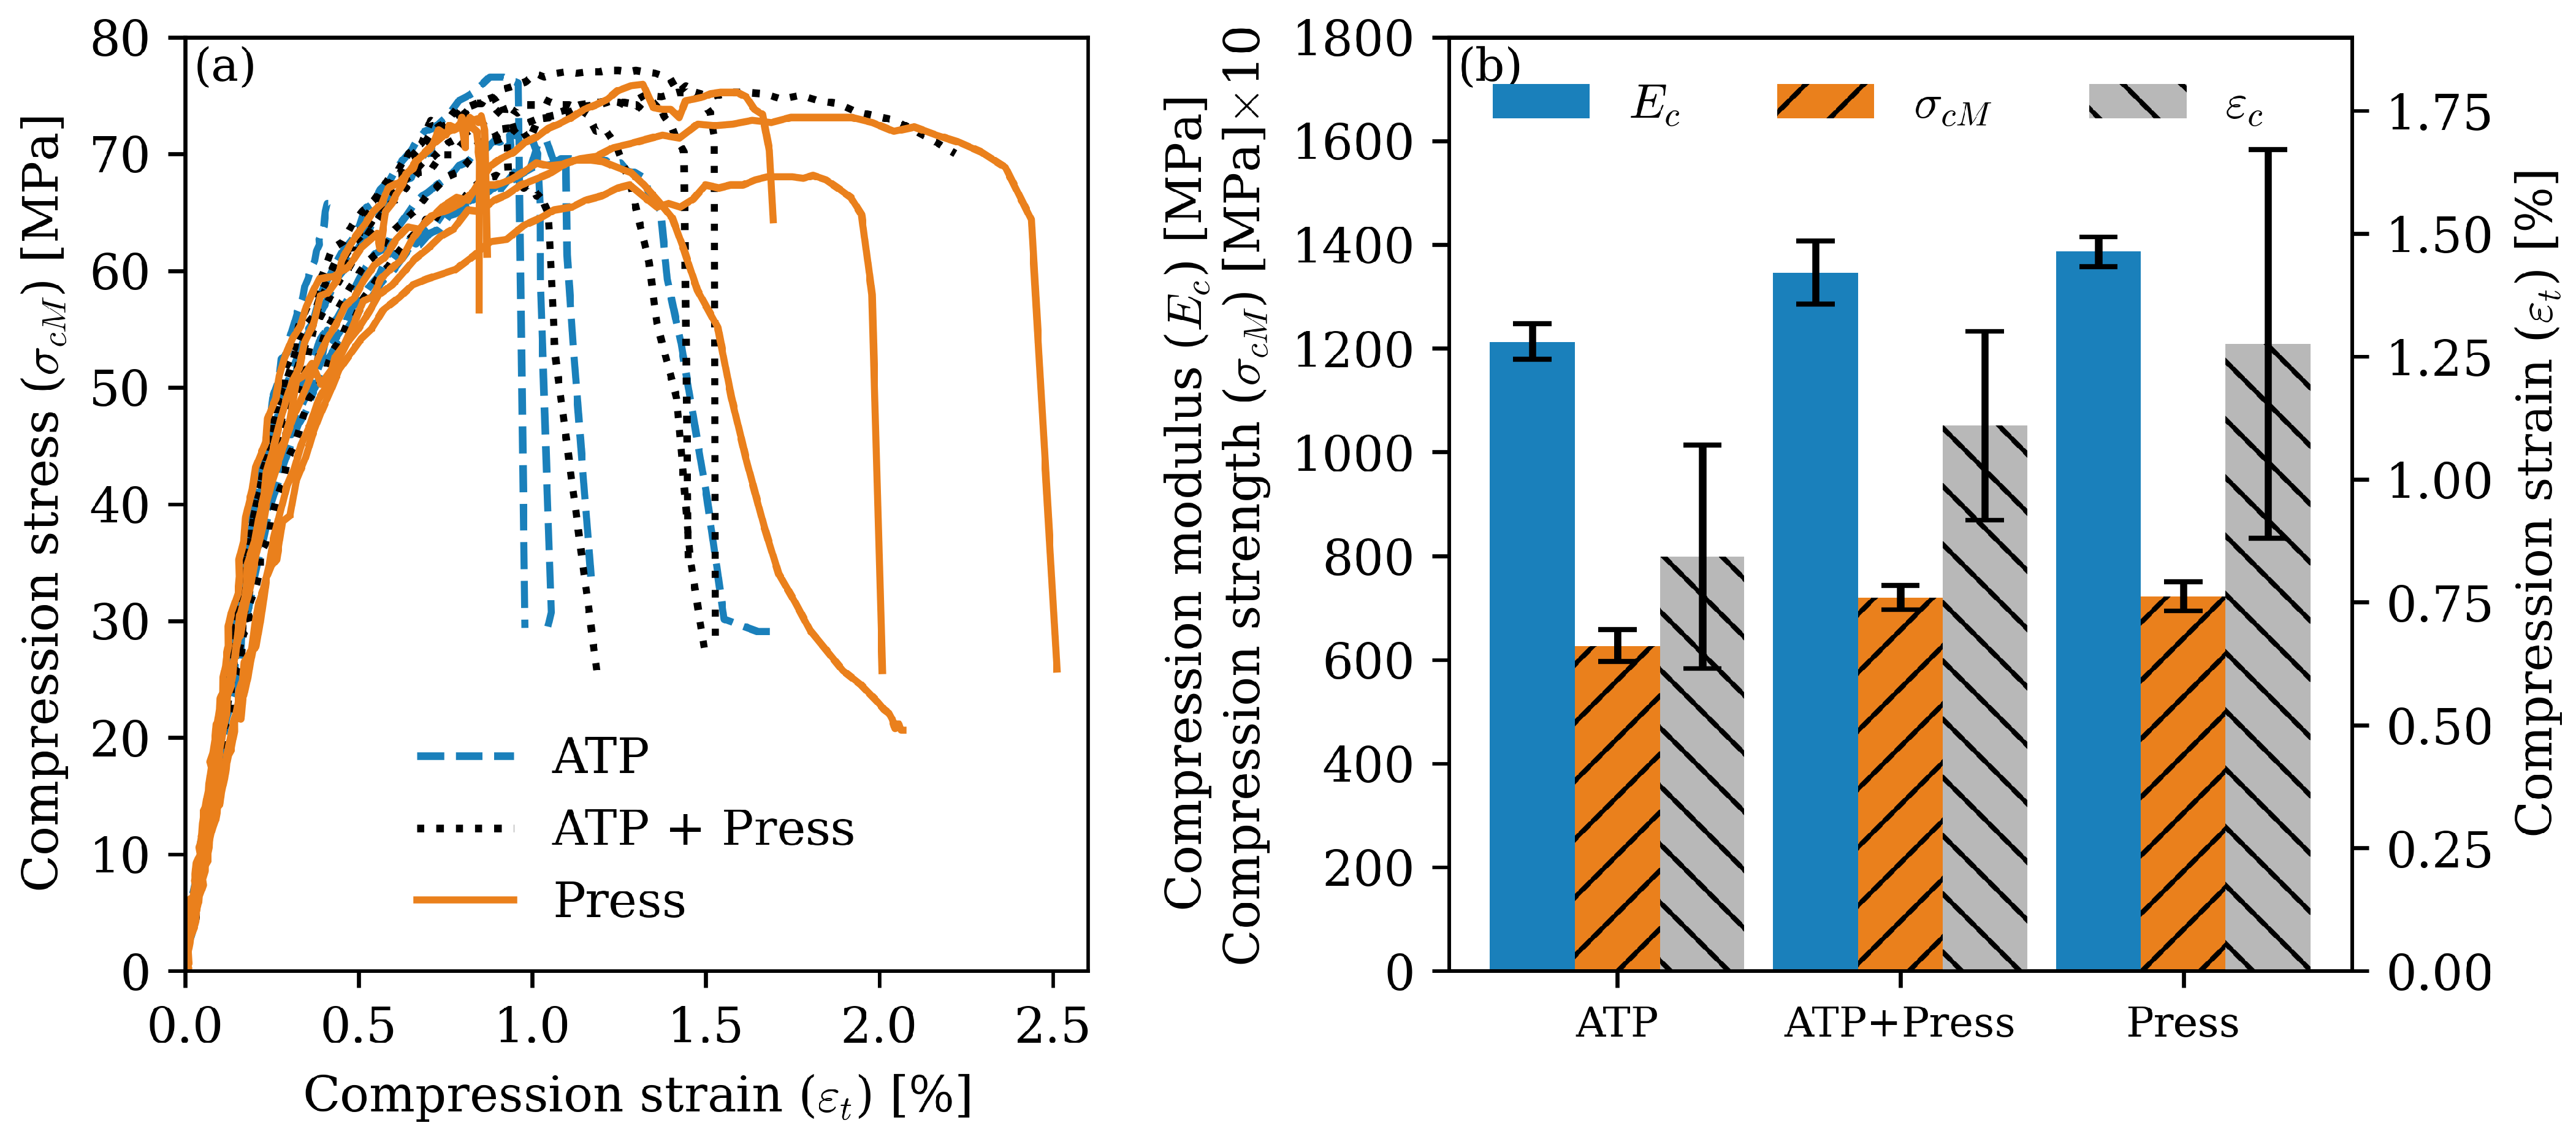
3.4.2. Compression Tests

Figure 8 shows the results of the compression tests for all process combinations. The mean and standard deviation of the compression modulus ( E c ), the compression strength ( σ c M ), and the compression strain ( ε c ) are summarised in Table 3. Six samples are analysed for all manufacturing methods. The press method has the highest compression modulus, compression strength, and compression strain, followed by the ATP + press method and the ATP method. The ATP + press and press methods have values close to each other and are within their respective standard deviations. The ANOVA for the compression tests and the Tukey method at α = 0.05 show that E c and σ c M are significantly different for ATP and ATP + press as well as for the ATP and press manufacturing method. This shows that the ATP samples benefit from a secondary consolidation step to increase the compression modulus, compression strength, and compression strain.
The compression strength σ c M of elementary flax fibres was found to be 1200 MPa, obtained by a loop test for fibres without kink bands. Kink bands, however, significantly decrease the compression strength [52]. Other studies found a value of 206 MPa and a ε c of 0.36% [53]. The compression modulus for a flax fibre can be found to be, on average, around 56.8 GPa [54]. The apparent compression modulus for a polypropylene homopolymer was found to be around 2000 MPa [55] and the compression strain to be around 48 MPa [56]. These values show that the matrix properties dominate for the compression tests.

3.4.3. Three-Point Bending Tests

Figure 9 shows the results of the three-point bending tests for all samples. Table 4 shows a summary of the results for the flexural modulus ( E f ), the flexural strength ( σ f M ), and the flexural strain ( ε f ). For each value, the mean and standard deviation are shown. The tapes manufactured with solely press consolidation have the highest flexural modulus (17.9 GPa) and average flexural strength (172.8 MPa). There are several factors that could account for the variations within the NF tapes (e.g., Young’s modulus, moment of inertia, or differences in crystallinity). The samples manufactured with ATP have a rapid cooling phase compared to the samples manufactured with press consolidation, whereas the samples manufactured with ATP + press consolidation exhibit two heating and cooling cycles, which affect the crystalline structure. In general, the values for the NF samples that have a press consolidation step in their processing methodology show higher flexural modulus and flexural strength but a lower flexural strain compared to the samples manufactured with ATP alone. All samples tested show valid failure modes, with tensile failure of the fibre. An ANOVA at a significance level of α = 0.05 and a comparison with the Tukey method for the means show that E f and σ f M are significantly different between all three manufacturing methods. However, ε M is not significantly different between the ATP + press and the press manufacturing methods.
The flexural properties of FLX/PP composites have been shown to be impacted by the crystallinity of the polymer. PP with α -crystals has a higher flexural strength and modulus compared to PP with β -crystals [57]. The percentage of crystallinity also impacts the flexural properties, with a higher level of crystallinity increasing the flexural properties [58]. These findings are supported by the results found in this study. The samples with a press consolidation step are expected to have a higher amount of α -crystals due to the lower cooling rates. It was also shown by the DSC measurements that the press consolidated samples have a higher percentage of crystallinity.

3.4.4. Double Cantilever Beam Tests
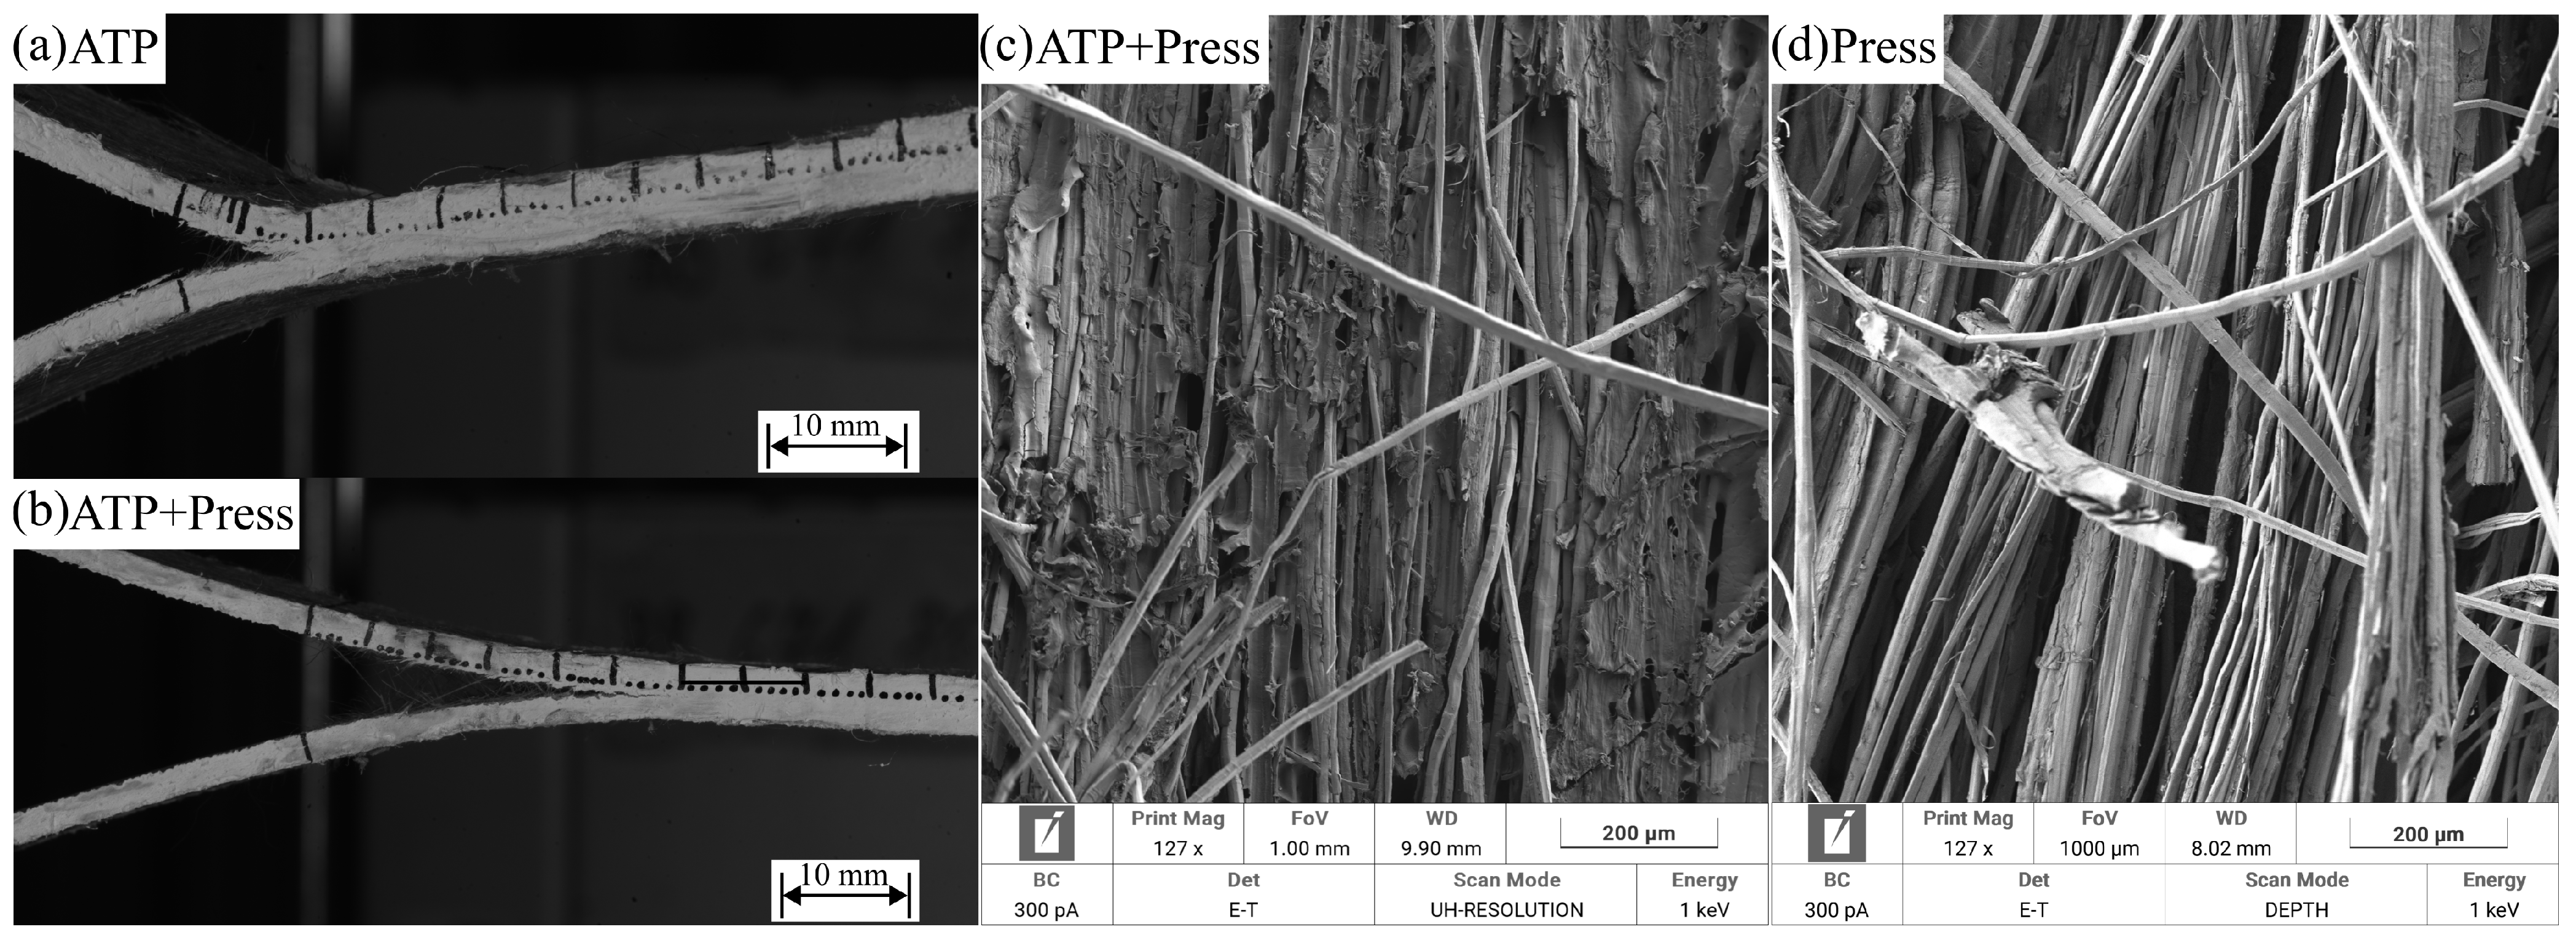
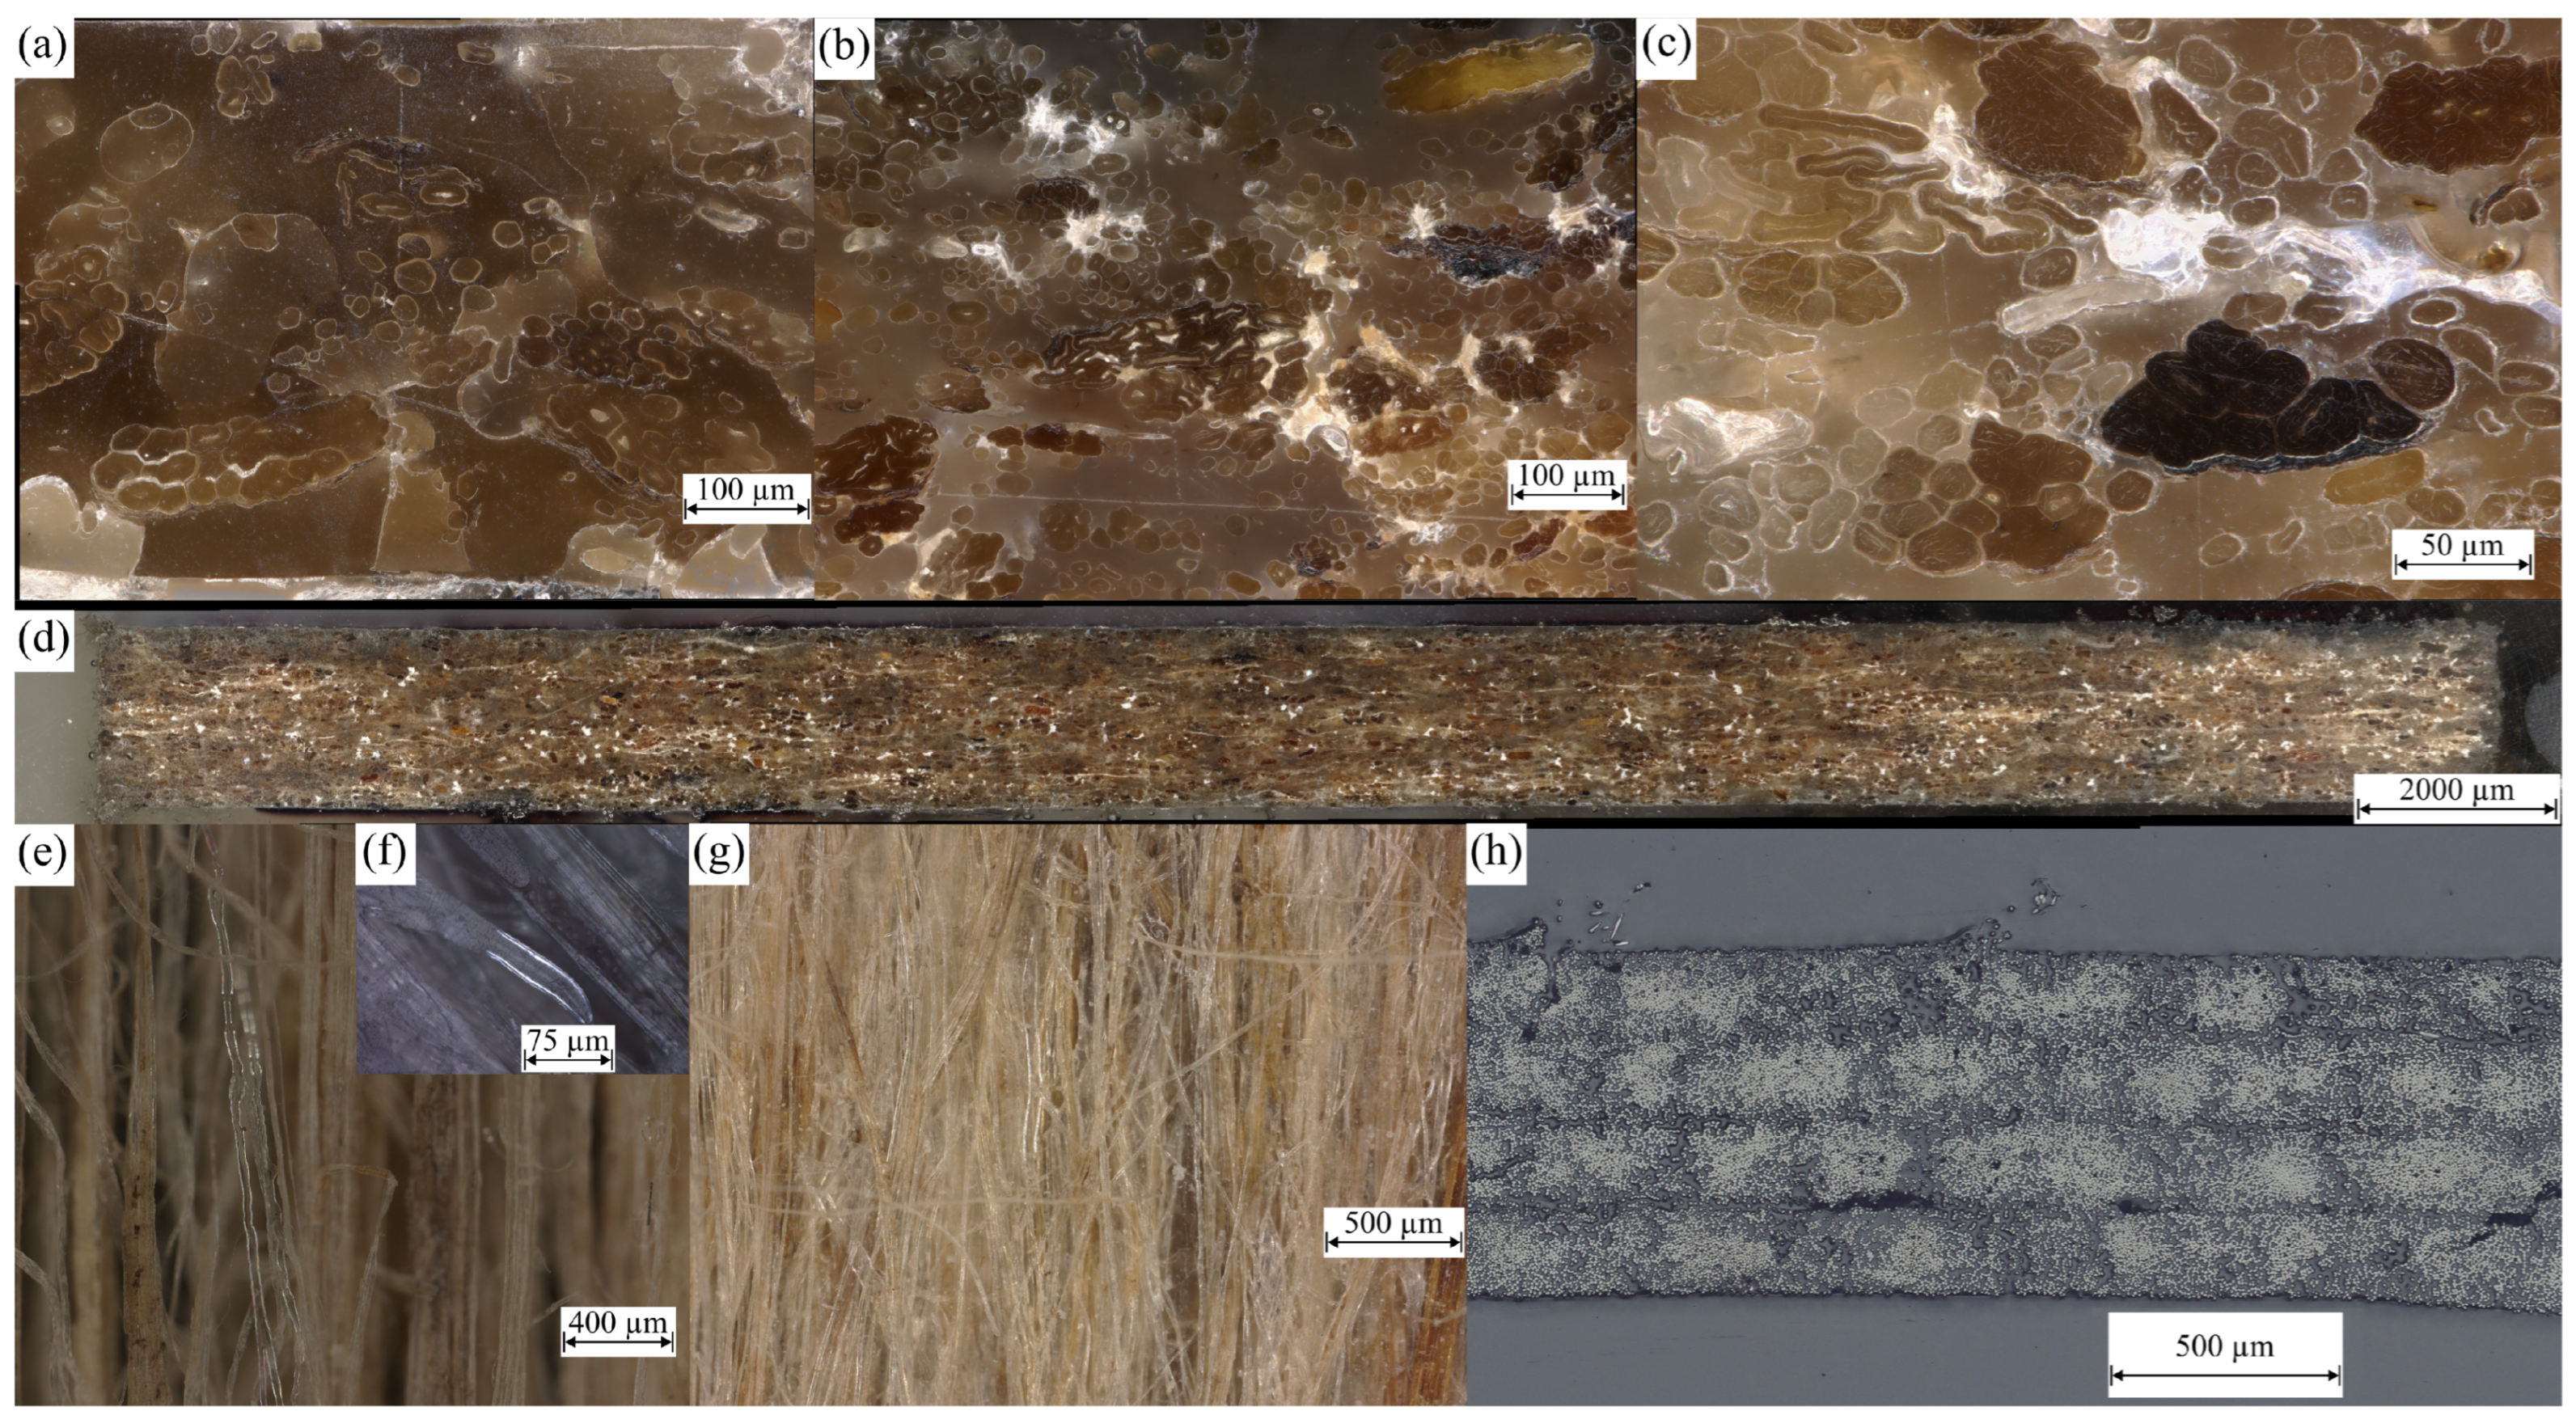
All samples manufactured solely with ATP showed invalid failure modes. The tapes have a slight bend at the edges, which could influence the test results. This bend cannot be seen in the other samples due to the press consolidation step. Furthermore, the stiffness of some of the samples is not high enough, which leads to a bending of the samples at the start of crack initiation (see Figure 10a). This could be an indicator that G I C for the ATP samples is higher compared to the other samples or that the crack cannot propagate into the sample due to plastification or the test configuration (e.g., foil insert thickness). Figure 10b shows a sample manufactured with ATP + press consolidation. These samples did not show any bending after the initialisation of the crack into the testing area. The difference in fracture toughness could be accounted for by the difference in crystallinity of the samples. Another contributing factor could be the unevenness in geometry of the ATP samples or the fact that the foil could not initiate a sharp crack into the sample. The samples manufactured with press consolidation and ATP + press consolidation are expected to have a higher level of α -crystals compared to the ATP sample. The α -phase shows lower fracture toughness compared to the β -phase [48]. A higher amount of β -phase could therefore be the reason the ATP samples bent and the crack did not propagate. Figure 10c shows an SEM image of the fracture surface of a sample produced with ATP + press consolidation, and Figure 10d shows a sample manufactured with press consolidation. Both images show weak bonding of the thermoplastic matrix to the natural fibres. It can be seen that no thermoplastic matrix is visible on the fibres in the forefront of the picture, indicating that the matrix is not adhering to the fibre. The combination of natural fibres with a thermoplastic matrix poses a challenge in testing fracture toughness. The current method needs to be updated in order to reliably test those samples.
Figure 11 shows the results of the DCB tests, and Table 5 summarises the results for all natural fibre manufacturing methods. All samples reveal high variation. It needs to be noted that these results are not a definitive assessment of the mode I fracture toughness qualities of the samples due to the small sample size. However, initial conclusions can be drawn about the performance of the FLX/PP composite and the manufacturing methods. Figure 11a shows no plateau of the G I C over the crack length. This can be explained with the small load values measured during the experiments. Therefore, a noticeable amount of noise is present in the data.

3.5. Micrographs

Figure 12 shows cross sections (Figure 12a–d,h) and top-down microscopic images of the natural fibre tapes and a CF (Figure 12h) tape. The cross section of the tape before manufacturing is shown in Figure 12a. This picture shows shiny silver particles within the matrix, which can also be seen in the samples after processing (Figure 12b–d). This suggests that those inclusions cannot stem from the manufacturing process. Furthermore, the sample preparation can also be excluded. Diamonds in the grinding paste would reveal straight, clearly distinct lines and structures. A reference sample of a CF/PP tape (Figure 12h) did not show these inclusions. Figure 12e,f show hemp fibres from the same manufacturer without the matrix. The shiny silver inclusion can be seen around the fibres. Figure 12g shows the top side of a tensile test sample at the break point, with the inclusions visible on some of the fibres. It can be concluded that those samples are a product of the processing of the natural fibres at the material supplier. Lubricants from the machines, sizing, or wax could be a possible explanation. However, a detailed description of the tape manufacturing process is not available. The cross sections of the processed samples (Figure 12b–d) show no significant voids. A difference in fibre diameter can be observed, and some fibres are collected in bundles, whereas single fibres are also embedded in the matrix. The lumen on the elemental fibres is clearly visible for some of the fibres. Figure 12g shows that the fibres are not all orientated in one direction, and some fibres across the width of the tape can be observed, which could cause a decline in mechanical properties.

4. Conclusions

In this study, the mechanical properties of natural fibre polypropylene composites manufactured using automated tape placement, press consolidation, and a combination of both methods were investigated. The use of flax fibre as the reinforcing material in polypropylene demonstrated significant potential for sustainable composite materials. It was shown that the fibre is the main source of heat transfer through the tape. Care must be taken when choosing an adequate power level for processing flax fibres to avoid thermal degradation of the fibres. However, the temperature needs to be high enough to melt the matrix throughout the tape material. The flashlamp heating system proved to be a reliable system for applying the required processing temperature. A modification of the PP matrix could be of help to ensure better heat transfer through the whole tape for flashlamp heating systems.
Mechanical tests showed that tapes placed with ATP have tensile properties similar to the laminates produced with press consolidation. However, a second consolidation step did increase the tensile properties. The press consolidation method showed the highest mechanical performance for the flexural and compression tests. The ATP method properties increased after a second consolidation step and are close to those of solely press consolidation. Matrix crystallinity could play a role in the difference in properties due to a difference in cooling rates and heating cycles of all methods. The mechanical and thermophysical properties of the matrix could play a key role in natural fibre composites because the mechanical performance of those fibres is not as high compared to carbon or glass fibres. The mechanical performance of these synthetic fibres is way higher compared to the matrix, and therefore the matrix properties can be neglected (in tensile, compression, or three-point bending tests). Double cantilever beam tests pose a challenge for natural fibre composites and thermoplastic materials in general. Due to plastic deformation of the matrix, crack progress can be hindered. Matrix crystallinity and the test method play a crucial role in these tests. More work needs to be conducted to develop a DCB method specifically for thermoplastic materials. In this initial study, the ATP + press consolidation method showed the best results for the DCB tests. The ATP samples showed invalid failure modes due to bending deformation of the samples during the test. The crack could not propagate in these samples. This points to the need for improved testing methodologies and a better understanding of the influence of fibre–matrix interactions on the fracture behaviour of natural fibres with a thermoplastic matrix. The surface treatment of the fibres and the processing of the composite have significant influence on the mechanical performance of the composites. The resulting interfacial bonding from different processing methods between the fibre and matrix should be studied in more detail to gain a deeper understanding of their effects. A comparison of the mechanical performance with other studies is difficult due to the various influences on the mechanical properties (e.g., interfacial bonding, processing, chemical composition, etc.). The microstructural analysis confirmed an even fibre distribution with minimal voids, which is crucial for consistent mechanical properties.
In summary, the study demonstrates that NF/PP composites, particularly those reinforced with flax fibres, can be successfully processed with ATP. These findings contribute to the broader field of composite materials by supporting the viability of sustainable natural fibre composites as alternatives to traditional synthetic fibres. Future research should focus on optimising the manufacturing parameters and testing methods to further enhance the performance and reliability of these eco-friendly materials.

Author Contributions

Conceptualisation, A.L.; methodology, A.L., L.H. and E.F.; validation, A.L.; formal analysis, A.L.; investigation, A.L.; resources, M.F. and E.F.; data curation, A.L.; writing—original draft preparation, A.L.; writing—review and editing, M.F. and E.F.; visualisation, A.L.; supervision, E.F. All authors have read and agreed to the published version of the manuscript.

Funding

This research received no external funding.

Data Availability Statement

The data presented in this study are available on reasonable request from the corresponding author.

Acknowledgments

Technical support from the Chair of Chemistry of Polymeric Materials, Montanuniversität Leoben, is kindly acknowledged.

Conflicts of Interest

The authors declare no conflicts of interest.

References

  1. Asim, M.; Paridah, M.T.; Chandrasekar, M.; Shahroze, R.M.; Jawaid, M.; Nasir, M.; Siakeng, R. Thermal stability of natural fibers and their polymer composites. Iran. Polym. J. 2020, 29, 625–648. [Google Scholar] [CrossRef]
  2. Alves, C.; Ferrão, P.; Silva, A.J.; Reis, L.G.; Freitas, M.; Rodrigues, L.B.; Alves, D.E. Ecodesign of automotive components making use of natural jute fiber composites. J. Clean. Prod. 2010, 18, 313–327. [Google Scholar] [CrossRef]
  3. Sanjay, M.R.; Arpitha, G.R.; Naik, L.L.; Gopalakrishna, K.; Yogesha, B. Applications of Natural Fibers and Its Composites: An Overview. Nat. Resour. 2016, 7, 108–114. [Google Scholar] [CrossRef]
  4. Baley, C. Analysis of the flax fibres tensile behaviour and analysis of the tensile stiffness increase. Compos. Part A Appl. Sci. Manuf. 2002, 33, 939–948. [Google Scholar] [CrossRef]
  5. Yan, L.; Chouw, N.; Jayaraman, K. Flax fibre and its composites—A review. Compos. Part B Eng. 2014, 56, 296–317. [Google Scholar] [CrossRef]
  6. Wazeer, A.; Das, A.; Abeykoon, C.; Sinha, A.; Karmakar, A. Composites for electric vehicles and automotive sector: A review. Green Energy Intell. Transp. 2023, 2, 100043. [Google Scholar] [CrossRef]
  7. Nishida, H.; Carvelli, V.; Fujii, T.; Okubo, K. Thermoplastic vs. thermoset epoxy carbon textile composites. IOP Conf. Ser. Mater. Sci. Eng. 2018, 406, 012043. [Google Scholar] [CrossRef]
  8. Baley, C.; Kervoëlen, A.; Lan, M.; Cartié, D.; Le Duigou, A.; Bourmaud, A.; Davies, P. Flax/PP manufacture by automated fibre placement (AFP). Mater. Des. 2016, 94, 207–213. [Google Scholar] [CrossRef]
  9. Gourier, C.; Le Duigou, A.; Bourmaud, A.; Baley, C. Mechanical analysis of elementary flax fibre tensile properties after different thermal cycles. Compos. Part A Appl. Sci. Manuf. 2014, 64, 159–166. [Google Scholar] [CrossRef]
  10. Shubhra, Q.T.H.; Alam, A.; Quaiyyum, M.A. Mechanical properties of polypropylene composites. J. Thermoplast. Compos. Mater. 2013, 26, 362–391. [Google Scholar] [CrossRef]
  11. Neitzel, M.; Mitschang, P.; Breuer, U. (Eds.) Handbuch Verbundwerkstoffe: Werkstoffe, Verarbeitung, Anwendung, 2nd ed.; Carl Hanser Verlag GmbH Co KG: Munich, Germany, 2014. [Google Scholar]
  12. Jiang, W.; Chen, C.; Chen, Z.; Huang, Z.; Zhou, H. Effect of crystallinity on optical properties of PEEK prepreg tapes for laser-assisted automated fiber placement. Compos. Commun. 2023, 38, 101490. [Google Scholar] [CrossRef]
  13. Zhang, B.; Kim, B.C. Experimental characterisation of large in-plane shear behaviour of unidirectional carbon fibre/epoxy prepreg tapes for continuous tow shearing (CTS) process. Compos. Part A Appl. Sci. Manuf. 2022, 162, 107168. [Google Scholar] [CrossRef]
  14. Çelik, O.; Bussink, T.; Peeters, D.; Teuwen, J.; Dransfeld, C. The effect of Laser-Induced deconsolidation on the compaction behavior of thermoplastic composite tapes. Compos. Part A Appl. Sci. Manuf. 2021, 151, 106670. [Google Scholar] [CrossRef]
  15. Chanteli, A.; Bandaru, A.K.; Peeters, D.; O’Higgins, R.M.; Weaver, P.M. Influence of repass treatment on carbon fibre-reinforced PEEK composites manufactured using laser-assisted automatic tape placement. Compos. Struct. 2020, 248, 112539. [Google Scholar] [CrossRef]
  16. Clancy, G.; Peeters, D.; Oliveri, V.; Jones, D.; O’Higgins, R.M.; Weaver, P.M. A study of the influence of processing parameters on steering of carbon Fibre/PEEK tapes using laser-assisted tape placement. Compos. Part B Eng. 2019, 163, 243–251. [Google Scholar] [CrossRef]
  17. Shafaq; Donough, M.J.; Farnsworth, A.L.; Phillips, A.W.; St John, N.A.; Gangadhara Prusty, B. Influence of deposition rates on the mode I fracture toughness of in-situ consolidated thermoplastic composites. Compos. Part B Eng. 2023, 251, 110474. [Google Scholar] [CrossRef]
  18. Moghadamazad, M.; Hoa, S.V. Models for heat transfer in thermoplastic composites made by automated fiber placement using hot gas torch. Compos. Part C Open Access 2022, 7, 100214. [Google Scholar] [CrossRef]
  19. Khodaei, A.; Shadmehri, F. Intimate contact development for automated fiber placement of thermoplastic composites. Compos. Part C Open Access 2022, 8, 100290. [Google Scholar] [CrossRef]
  20. Gain, A.K.; Oromiehie, E.; Prusty, B.G. Nanomechanical characterisation of CF-PEEK composites manufactured using automated fibre placement (AFP). Compos. Commun. 2022, 31, 101109. [Google Scholar] [CrossRef]
  21. Oromiehie, E.; Gain, A.K.; Donough, M.J.; Prusty, B.G. Fracture toughness assessment of CF-PEEK composites consolidated using hot gas torch assisted automated fibre placement. Compos. Struct. 2022, 279, 114762. [Google Scholar] [CrossRef]
  22. Satheesh, B.; Tonejc, M.; Potakowskyj, L.; Pletz, M.; Fauster, E.; Kaynak, B.; Schledjewski, R. Peel strength characterisation on ply/ply interface using wedge and T-peel/pull-type tests. Polym. Polym. Compos. 2018, 26, 431–445. [Google Scholar] [CrossRef]
  23. Rajasekaran, A.; Shadmehri, F. Steering of carbon fiber/PEEK tapes using Hot Gas Torch-assisted automated fiber placement. J. Thermoplast. Compos. Mater. 2022, 36, 1651–1679. [Google Scholar] [CrossRef] [PubMed]
  24. Grouve, W. Weld Strength of Laser-Assisted Tape-Placed Thermoplastic Composites. Ph.D. Thesis, University of Twente, Enschede, The Netherlands, 2012. [Google Scholar]
  25. Danezis, A.; Williams, D.; Edwards, M.; Skordos, A.A. Heat transfer modelling of flashlamp heating for automated tape placement of thermoplastic composites. Compos. Part A Appl. Sci. Manuf. 2021, 145, 106381. [Google Scholar] [CrossRef]
  26. Di Boon, Y.; Joshi, S.C.; Bhudolia, S.K. Review: Filament Winding and Automated Fiber Placement with In Situ Consolidation for Fiber Reinforced Thermoplastic Polymer Composites. Polymers 2021, 13, 1951. [Google Scholar] [CrossRef] [PubMed]
  27. McGregor, O.; Duhovic, M.; Somashekar, A.A.; Bhattacharyya, D. Pre-impregnated natural fibre-thermoplastic composite tape manufacture using a novel process. Compos. Part A Appl. Sci. Manuf. 2017, 101, 59–71. [Google Scholar] [CrossRef]
  28. Elfaleh, I.; Abbassi, F.; Habibi, M.; Ahmad, F.; Guedri, M.; Nasri, M.; Garnier, C. A comprehensive review of natural fibers and their composites: An eco-friendly alternative to conventional materials. Results Eng. 2023, 19, 101271. [Google Scholar] [CrossRef]
  29. Legenstein, A.; Füssel, L.; Heider, D.; Gillespie, J.W., Jr.; Cender, T.A. Stretch-Steering of Highly Aligned Discontinuous Fiber Tape with Automated Fiber Placement. Compos. Part B Eng. 2024, 287, 111801. [Google Scholar] [CrossRef]
  30. Bledzki, A.K.; Sperber, V.E.; Faruk, O. Natural and Wood Fibre Reinforcement in Polymers, 13th ed.; Smithers Rapra Publishing: Shawbury, UK, 2002. [Google Scholar]
  31. Charlet, K.; Baley, C.; Morvan, C.; Jernot, J.P.; Gomina, M.; Bréard, J. Characteristics of Hermès flax fibres as a function of their location in the stem and properties of the derived unidirectional composites. Compos. Part A Appl. Sci. Manuf. 2007, 38, 1912–1921. [Google Scholar] [CrossRef]
  32. Bledzki, A.K.; Mamun, A.A.; Lucka-Gabor, M.; Gutowski, V.S. The effects of acetylation on properties of flax fibre and its polypropylene composites. Express Polym. Lett. 2008, 2, 413–422. [Google Scholar] [CrossRef]
  33. Komuraiah, A.; Kumar, N.S.; Prasad, B.D. Chemical Composition of Natural Fibers and its Influence on their Mechanical Properties. Mech. Compos. Mater. 2014, 50, 359–376. [Google Scholar] [CrossRef]
  34. Mohammed, M.; Rasidi, M.S.; Mohammed, A.; Rahman, R.; Osman, A.; Adam, T.; Betar, B.; Dahham, O. Interfacial bonding mechanisms of natural fibre-matrix composites: An overview. BioResources 2022, 17, 7031–7090. [Google Scholar] [CrossRef]
  35. Drzal, L.T.; Rich, M.J.; Lloyd, P.F. Adhesion of Graphite Fibers to Epoxy Matrices: I. The Role of Fiber Surface Treatment. J. Adhes. 1983, 16, 1–30. [Google Scholar] [CrossRef]
  36. Messiry, M.E. Theoretical analysis of natural fiber volume fraction of reinforced composites. Alex. Eng. J. 2013, 52, 301–306. [Google Scholar] [CrossRef]
  37. Le Gall, M.; Davies, P.; Martin, N.; Baley, C. Recommended flax fibre density values for composite property predictions. Ind. Crop. Prod. 2018, 114, 52–58. [Google Scholar] [CrossRef]
  38. Maddah A., H. Polypropylene as a Promising Plastic: A Review. Am. J. Polym. Sci. 2016, 6, 1–11. [Google Scholar] [CrossRef]
  39. Stokes-Griffin, C.M.; Compston, P. A combined optical-thermal model for near-infrared laser heating of thermoplastic composites in an automated tape placement process. Compos. Part A Appl. Sci. Manuf. 2015, 75, 104–115. [Google Scholar] [CrossRef]
  40. Lafranche, E.; Oliveira, V.M.; Martins, C.I.; Krawczak, P. Prediction of injection-moulded flax fibre reinforced polypropylene tensile properties through a micro-morphology analysis. J. Compos. Mater. 2015, 49, 113–128. [Google Scholar] [CrossRef]
  41. Ahmed, A.K.; Atiqullah, M.; Pradhan, D.R.; Al-Harthi, M.A. Crystallization and melting behavior of i-PP: A perspective from Flory’s thermodynamic equilibrium theory and DSC experiment. RSC Adv. 2017, 7, 42491–42504. [Google Scholar] [CrossRef]
  42. DIN EN ISO 527-4:2023-07; Plastics—Determination of Tensile Properties—Part 4: Test Conditions for Isotropic and Orthotropic Fibre-Reinforced Plastic Composites. International Organization for Standardization: Geneva, Switzerland, 2023. [CrossRef]
  43. ISO 14126:2023; Fibre-Reinforced Plastic Composites—Determination of Compressive Properties in the In-Plane Direction. International Organization for Standardization: Geneva, Switzerland, 2023.
  44. ISO 14125:1998; Fibre-Reinforced Plastic Composites: Determination of Flexural Properties. International Organization for Standardization: Geneva, Switzerland, 1998.
  45. ISO 15024:2023; Fibre-Reinforced Plastic Composites: Determination of Mode I Interlaminar Fracture Toughness, GIC, for Unidirectionally Reinforced Materials. International Organization for Standardization: Geneva, Switzerland, 2023.
  46. Legenstein, A.; Fauster, E. Effect of Flashlamp Heating System Parameters on the Wedge Peel Strength of Thermoplastic Carbon Fiber Tape in the Automated Tape Placement Process. J. Manuf. Mater. Process. 2024, 8, 91. [Google Scholar] [CrossRef]
  47. Bourmaud, A.; Morvan, C.; Baley, C. Importance of fiber preparation to optimize the surface and mechanical properties of unitary flax fiber. Ind. Crop. Prod. 2010, 32, 662–667. [Google Scholar] [CrossRef]
  48. Tordjeman, P.; Robert, C.; Marin, G.; Gerard, P. The effect of α, β crystalline structure on the mechanical properties of polypropylene. Eur. Phys. J. E 2001, 4, 459–465. [Google Scholar] [CrossRef]
  49. Hu, Y.; Liao, Y.; Zheng, Y.; Ikeda, K.; Okabe, R.; Wu, R.; Ozaki, R.; Xu, J.; Xu, Q. Influence of Cooling Rate on Crystallization Behavior of Semi-Crystalline Polypropylene: Experiments and Mathematical Modeling. Polymers 2022, 14, 3646. [Google Scholar] [CrossRef] [PubMed]
  50. Ku, H.; Wang, H.; Pattarachaiyakoop, N.; Trada, M. A review on the tensile properties of natural fiber reinforced polymer composites. Compos. Part B Eng. 2011, 42, 856–873. [Google Scholar] [CrossRef]
  51. Baley, C.; Gomina, M.; Breard, J.; Bourmaud, A.; Davies, P. Variability of mechanical properties of flax fibres for composite reinforcement. A review. Ind. Crop. Prod. 2020, 145, 111984. [Google Scholar] [CrossRef]
  52. Bos, H.L.; van den Oever, M.J.A.; Peters, O.C.J.J. Tensile and compressive properties of flax fibres for natural fibre reinforced composites. J. Mater. Sci. 2002, 37, 1683–1692. [Google Scholar] [CrossRef]
  53. Baley, C.; Goudenhooft, C.; Perré, P.; Lu, P.; Pierre, F.; Bourmaud, A. Compressive strength of flax fibre bundles within the stem and comparison with unidirectional flax/epoxy composites. Ind. Crops Prod. 2019, 130, 25–33. [Google Scholar] [CrossRef]
  54. Prapavesis, A.; Tojaga, V.; Östlund, S.; van Willem Vuure, A. Back calculated compressive properties of flax fibers utilizing the Impregnated Fiber Bundle Test (IFBT). Compos. Part A Appl. Sci. Manuf. 2020, 135, 105930. [Google Scholar] [CrossRef]
  55. Jerabek, M.; Major, Z.; Lang, R.W. Uniaxial compression testing of polymeric materials. Polym. Test. 2010, 29, 302–309. [Google Scholar] [CrossRef]
  56. International Polymer Solutions Inc. Irvine, USA. Polypropylene—Datasheet, 2024. Available online: https://www.ipolymer.com/pdf/Polypropylene.pdf (accessed on 9 September 2024).
  57. Wu, C.M.; Lai, W.Y.; Wang, C.Y. Effects of Surface Modification on the Mechanical Properties of Flax/β-Polypropylene Composites. Materials 2016, 9, 314. [Google Scholar] [CrossRef]
  58. Karian, H.G. Handbook of Polypropylene and Polypropylene Composites; Plastics Engineering; Marcel Dekker: New York, NY, USA, 2003; Volume 51. [Google Scholar]
Figure 1. (a) ATP setup used in this study, with main components annotated. (b) Flashlamp system within the ATP setup.
Jcs 08 00396 g001
Figure 2. (a) Tensile test setup with extensometers and FLX/PP sample in between the clamps. (b) Compression test setup with DIC system and FLX/PP sample in between the HCCF. (c) Three-point bending setup with FLX/PP sample. (d) DCB setup of a FLX/PP sample during the test and a close-up of a sample before the test.
Jcs 08 00396 g002
Figure 3. (a) Measuring area (red circle and ellipse) for the second layer of a tape placed at 60 Hz and 2200 µs. (b) Tapes placed at different frequency settings (40–80 Hz) and a constant pulse width (2200 µs) with burned fibres at the 60 Hz (black circles) to 80 Hz samples.
Jcs 08 00396 g003
Figure 4. Average temperature within the steady-state region for different frequency levels at a constant pulse width of 2200 µs (a) for the incoming tape and (b) for the substrate. (c) Average temperature for the substrate and incoming tape over 6 samples for mechanical testing.
Jcs 08 00396 g004
Figure 5. Pressure distribution on (a) an NF tape with 200 N, (b) an NF tape with 500 N, and (c) a CF tape with 500 N consolidation force. The tape boundaries are marked with dashed lines.
Jcs 08 00396 g005
Figure 6. (a) Results from TGA measurements (TGA and DTG curves) of three FLX/PP curves averaged to one curve. (b) Melting and crystallisation temperature for a virgin FLX/PP sample and one FLX/PP sample from each manufacturing method (ATP, ATP + press consolidation, and press consolidation).
Jcs 08 00396 g006
Figure 7. (a) Tensile stress–strain curve of the samples for all manufacturing methods. (b) Average Young’s modulus, tensile strength, and elongation at break for the tested samples.
Jcs 08 00396 g007
Figure 8. (a) Compression stress–strain curve of all samples for all manufacturing methods. (b) Average compression modulus, compression strength, and compression strain for the tested samples.
Jcs 08 00396 g008
Figure 9. (a) Stress–strain curves for all samples for all manufacturing methods. (b) Average flexural modulus, flexural strength, and flexural strain for the tested samples.
Jcs 08 00396 g009
Figure 10. (a) ATP DCB sample with clear bending of the top portion of the sample. (b) ATP + press consolidation sample during the DCB test. SEM images of fracture surface after DCB testing of (c) ATP + press consolidation sample and (d) press consolidation sample.
Jcs 08 00396 g010
Figure 11. (a) Mode I fracture toughness critical energy release rate over the crack length. (b) Mode I fracture toughness critical energy release rate ( G I C ) values of the test samples for the different manufacturing methods and three different calculation methods: modified compliance calibration (MCC), corrected beam theory (CBT), and beam theory (BT). The value for the first millimetre of the crack into the matrix is shown.
Jcs 08 00396 g011
Figure 12. (a) Cross section of a single FLX/PP tape before processing. (b) Cross section of a tensile test sample manufactured with press consolidation. (c) Cross section of a tensile test sample manufactured with solely ATP. (d) Cross section of a tensile test sample manufactured with ATP + press consolidation. (e) Top-down view of the hemp fibres from the same manufacturer without the PP matrix. (f) Ending of a single hemp fibre separated from the polymer matrix. (g) Top-down view of the break area after the tensile for a sample manufactured with ATP + press consolidation. (h) Cross section of a CF specimen with 4 tape layers.
Jcs 08 00396 g012
Table 1. Chemical composition of flax fibres [5].
CelluloseHemicellulosePectinLigninWaxMoisture
64.1–75%11–20.6%1.8–2.3%2–2.9%1.5–1.7%7.9–10 w%
Table 2. Tensile properties of the test samples for all manufacturing methods.
MaterialProcessing
Method
Young’s Modulus
( E t ) [GPa]
Tensile Strength
( σ tM ) [MPa]
Elongation at Break
( ε t ) [%]
FLX/PPATP14.9 ± 0.3134.4 ± 2.51.4 ± 0.03
FLX/PPATP + Press17.4 ± 1.0143.9 ± 6.21.3 ± 0.03
FLX/PPPress15.5 ± 0.9133.7 ± 5.61.4 ± 0.07
Table 3. Compression properties of the test samples for all manufacturing methods.
MaterialProcessing
Method
Compression Modulus
( E c ) [MPa]
Compression Strength
( σ cM ) [MPa]
Compression Strain
( ε c ) [%]
FLX/PPATP1213.0 ± 37.162.7 ± 3.40.84 ± 0.25
FLX/PPATP + Press1346.2 ± 66.472.0 ± 2.61.11 ± 0.21
FLX/PPPress1386.2 ± 31.572.2 ± 3.11.28 ± 0.43
Table 4. Flexural properties of the test samples for all manufacturing methods.
MaterialProcessing
Method
Flexural Modulus
( E f ) [GPa]
Flexural Strength
( σ fM ) [MPa]
Flexural Strain
( ε f ) [%]
FLX/PPATP11.7 ± 1.0137.7 ± 6.52.5 ± 0.1
FLX/PPATP + Press16.4 ± 0.6156.2 ± 8.02.0 ± 0.1
FLX/PPPress17.9 ± 0.5172.8 ± 5.52.1 ± 0.07
Table 5. Mode I fracture toughness critical energy release rate ( G I C ) values of the test samples for the ATP + press and the press consolidation methods and three different calculation methods: beam theory (BT), modified compliance calibration (MCC), and corrected beam theory (CBT). The value for the first millimeter of the crack into the matrix is shown.
MaterialProcessing
Method
G IC BT
[J/m2]
G IC CBT
[J/m2]
G IC MCC
[J/m2]
FLX/PPATP---
FLX/PPATP + Press393.70 ± 223.00390.02 ± 220.58413.13 ± 170.28
FLX/PPPress32.95 ± 20.6623.18 ± 14.1472.70 ± 57.95
Disclaimer/Publisher’s Note: The statements, opinions and data contained in all publications are solely those of the individual author(s) and contributor(s) and not of MDPI and/or the editor(s). MDPI and/or the editor(s) disclaim responsibility for any injury to people or property resulting from any ideas, methods, instructions or products referred to in the content.

