Abstract
This paper studies the behavior of S2-glass woven fabric reinforced polymer composite under low-velocity impact at 18–110 J energy. A macro-homogeneous finite element model for the prediction of their response is implemented, considering the non-linear material behavior and intralaminar and interlaminar failure modes for the prediction of impact damage. The model accurately predicted the permanent indentation caused by impact. By applying the Ramberg-Osgood formulation, different initial stiffness values are examined to assess the post-impact unloading response. This approach reveals the significant role of initial stiffness in inelastic strain accumulation and its consequent effect on permanent indentation depth. A higher initial stiffness correlates with increased inelastic strain, influencing the impactor rebound and resulting in greater permanent indentation. By accurately predicting permanent indentation, and damage accumulation for different impact energies, this study contributes to a better understanding of the impact behavior of composite materials, thereby promoting their wider application.
1. Introduction
One of the major drawbacks in using composite laminates in many applications is their susceptibility to impacts that can cause barely visible impact damage (BVID) [1,2]. In particular, low-velocity impact (LVI) during service life can cause delamination, matrix failure, debonding, and fibre breakage [3,4,5,6,7,8,9]. The impact response of fibre reinforced polymer (FRP) composites has been extensively explored over many years [10,11,12,13,14,15,16], contributing foundational insights on mechanisms of damage and failure in composite materials [17,18,19,20,21], and has also provided the experimental and theoretical frameworks that are used to studying and mitigating such issues focusing on aspects like material type [22,23,24,25,26], test method [27,28,29], impactor type [30,31,32,33], and modelling approach [34,35,36].
Different numerical approaches have been recently used to simulate the complex failure of composites under LVI loads [37,38,39,40,41,42]. While accurate results of interlaminar and intralaminar damage prediction were obtained [43,44], less attention has been paid to permanent indentation/deformation due to impact [45,46,47,48]. Measuring permanent indentation or dent depth, i.e., the distance between the surface of the laminate and the lowest point in the dent of an impact, is commonly used to inspect BVID in aeronautical structures [49,50,51]. The mechanism leading to permanent indentation is important in understanding residual strength of the composite, allowing the design of components with greater impact damage tolerance [46,52,53,54].
Resin plasticity is commonly considered the main contributor to the formation of an impact dent [48,55,56]. The permanent indentation due to LVI in cross-ply laminates has been simulated using non-linear modelling of their shear behaviour [45,46]. For compression after impact [57,58], permanent indentation must be considered in order to obtain an acceptable finite element (FE) prediction of the mechanical and damage response [45,59]. In their study, Singh and Mahajan [47] found that permanent indentation is caused by the inelastic deformation in a localized region in the vicinity of the impact point and the unrecoverable deformation [60] in the contact area. Chen et al. [20] studied the static indentation of laminates and found a correlation between fibre failure and permanent indentation. A comparison between impact dent caused by quasi-static indentation and LVI was performed in [61]. The permanent indentation was more severe in the quasi-static test due to the longer contact time, which hindered rebounding to the initial position. Bouvet et al. [48,62] described permanent indentation by the interaction between through-thickness 45° matrix cracks and impact debris that prevented crack closure, with compaction or plasticity of the resin also contributing.
While some attempts have been made to predict permanent indentation due to impact using FE simulations, all focused on unidirectional laminates. For woven fabric composites, only experimental observations can be found. For example, Vieille et al. [63] found that matrix plasticization in matrix-rich areas plays a significant role in permanent deformation and indentation in impact. In addition, fibre bridging was found to mitigate permanent indentation by preventing mode-I opening and slowing damage propagation. Although not supported by microscopic observations, Elias et al. [64] discussed that permanent impact indentation in 3D woven composites is due to the complex morphology of cracks and debris in matrix cracks.
Within this scope, this work investigated the low-velocity impact behaviour of S2-glass woven fabric laminates in a wide energy range (18–110 J). A macro-heterogeneous simulation approach is presented to account for the non-linear material behaviour and accumulation of inelastic strain during impact. A nonlinear material constitutive law is implemented in Abaqus solver employing a user-defined material model. The model considers several intralaminar and interlaminar failure models and damage accumulation, being validated against experimental data, including permanent indention, and a detailed discussion is presented.
2. Materials and Methods
2.1. Experimental Activities
Building on previous studies [65,66], this work focuses on Hexcel® 8-harness satin S2-glass fabrics reinforced with epoxy resin laminates produced by vacuum infusion, layering 16 dry fabric layers in a [0°/90°]8 sequence on a mould. Resin was introduced under vacuum (100 kPa), which was followed by a 24-h cure at room temperature and 16-h post-cure at 65 °C. The resulting 4-mm thick laminates showed homogeneous resin distribution, confirmed by C-scan ultrasonic testing.
Specimens for impact testing were prepared using water jet cutting. The tests were performed as per ASTM D7136 [67] in specimens (150 mm × 100 mm; 6.96 kg/m2 areal density) using a 16-mm diameter hemispherical impactor. Impact energies ranged from 18.5 J to 110 J by varying the impactor mass and drop height. Specimen fixation on a rigid plate ensured a consistent test setup, and a pneumatic arm prevented multiple impacts. Impact damage [68] and permanent indentation [68] were quantified using backlighting for damaged area assessment and a dial gauge for indentation depth, following previously established methodologies for composite analysis [65,66].
2.2. Numerical Model
2.2.1. Interlaminar and Intralaminar Damage Models
A Continuum Damage Mechanics (CDM) approach [69,70,71] based on selectively degrading the stiffness parameters of the corresponding failure modes has been implemented to consider damage in the macro-homogeneous FE model. Several damage variables are defined to replicate damage. The intralaminar failure criterion follows the Chang–Chang model, which has proven accurate in predicting damage in woven composites [72,73]. The intralaminar failure criterion is described as:
where i = t indicates tension and i = c indicates compression.
When the failure criterion is met, the linear strain-based damage evolution law (Equation (2)) increases from zero (undamaged) to one representing ultimate failure [46,74].
where and represent damage evolution in different material directions. and are complete failure strains in each material direction following the regularization method proposed in [75,76] being dependent on fracture toughness (G) and element characteristic length (l) to reduce mesh sensitivity [77]. The default method for calculating characteristic length of the element in Abaqus [78] was used, being equal to the cubic root of its volume. and are the constant equivalent strains at the onset of damage when the criteria shown as Equation (1) is met in the simulation; and are the equivalent strains [45], calculated based on Table 1.

Table 1.
Strain formulations for the progressive damage law.
By using the damage variables shown in Table 1, three damage indices are calculated for the failure of the material, and for the different material directions of the fibre, and for the matrix, according to Equation (3):
The failure indexes in Equation (3) are irreversible. In each time step, their values are compared with those from the previous time step and the maximum is selected. and are constant values used to avoid element distortion in the simulation, being equal to 0.5 and 0.9, respectively [79,80].
The interlaminar failure criteria follow the bilinear traction separation law, employing a stress-based criterion damage initiation and Benzeggagh and Kenane (B-K) [81] to account for the progressive damage behaviour at the interfaces. These are given in Equations (4) and (5), respectively.
where < > is the Macaulay bracket; N the normal interface strength and S the shear interface strength; and are the dissipated energies; is a material constant for (B-K) law; and , are the fracture energies. This law is employed by cohesive contacts [42,82,83].
2.2.2. Nonlinear Material Constitutive Behaviour
The explicit incremental implementation of the material constitutive behaviour relies on the in-situ calculation of the stiffness matrix components according to the loading/unloading or damaged/undamaged status of each element during the FE solution. Two different approaches have been used in the literature to describe the nonlinear material behaviour: (i) based on pre-failure nonlinearities using associated and non-associated flow rules [84] and (ii) by evaluating nonlinearities using non-linear equations describing the pre-failure material constitutive behaviour [42,45,68,83,85]. The latter approach was chosen to describe those nonlinearities in both in-plane material directions since it is more pragmatic and requires less input data. Before initiation of the damage, the transient stiffness is estimated by the Ramberg–Osgood formulation. The through-thickness direction is defined as linear-elastic until failure. The stress-strain relationship is given by:
The terms of the stiffness matrix are calculated as:
where .
During the explicit solve, the current stress is calculated using the strain increment, , and the stress of the previous time increment, , according to:
The nonlinear macroscopic material behaviour of the composite is predicted by using a stress-strain function based on the Ramberg–Osgood model, which was used in [86,87] for composite materials.
where is the initial modulus; is the asymptotic stress level and m is the shape parameter, calculated by fitting the experimental stress-strain curve using Equation (9).
The tangent or instantaneous stiffness, , which is a function of the current strain state, is calculated as [88]:
During the loading stage, the stiffness parameters of Equation (7), i.e., and , are calculated for each element according to Equation (10), while in the unloading stage, they are equal to the initial stiffness of the material, to account for the accumulation of plastic strain. The total strain at the current time step is calculated as:
where is the strain increment.
The total strain in the first and second directions, i.e., and , are comprised of elastic and plastic strains:
and the plastic strain, , is measured as:
Before damage initiation, the initial stiffness is used for unloading of the material, as shown in Figure 1. When material degradation starts, the material constants corresponding to damage variables are selectively degraded according to Equation (14) [45]. The shear moduli are degraded directly using the shear damage index, .
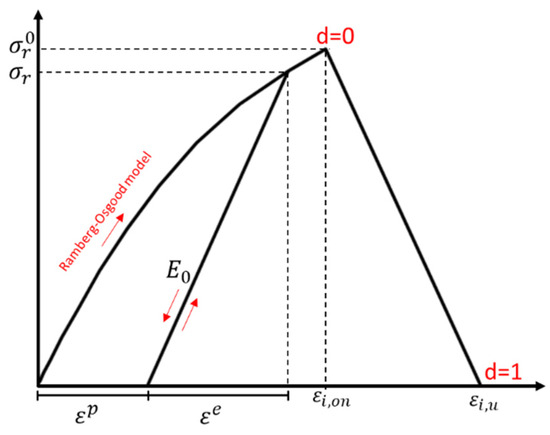
Figure 1.
Nonlinear material stress-strain behavior and post-damage softening (loading and unloading are indicated with the red arrows).
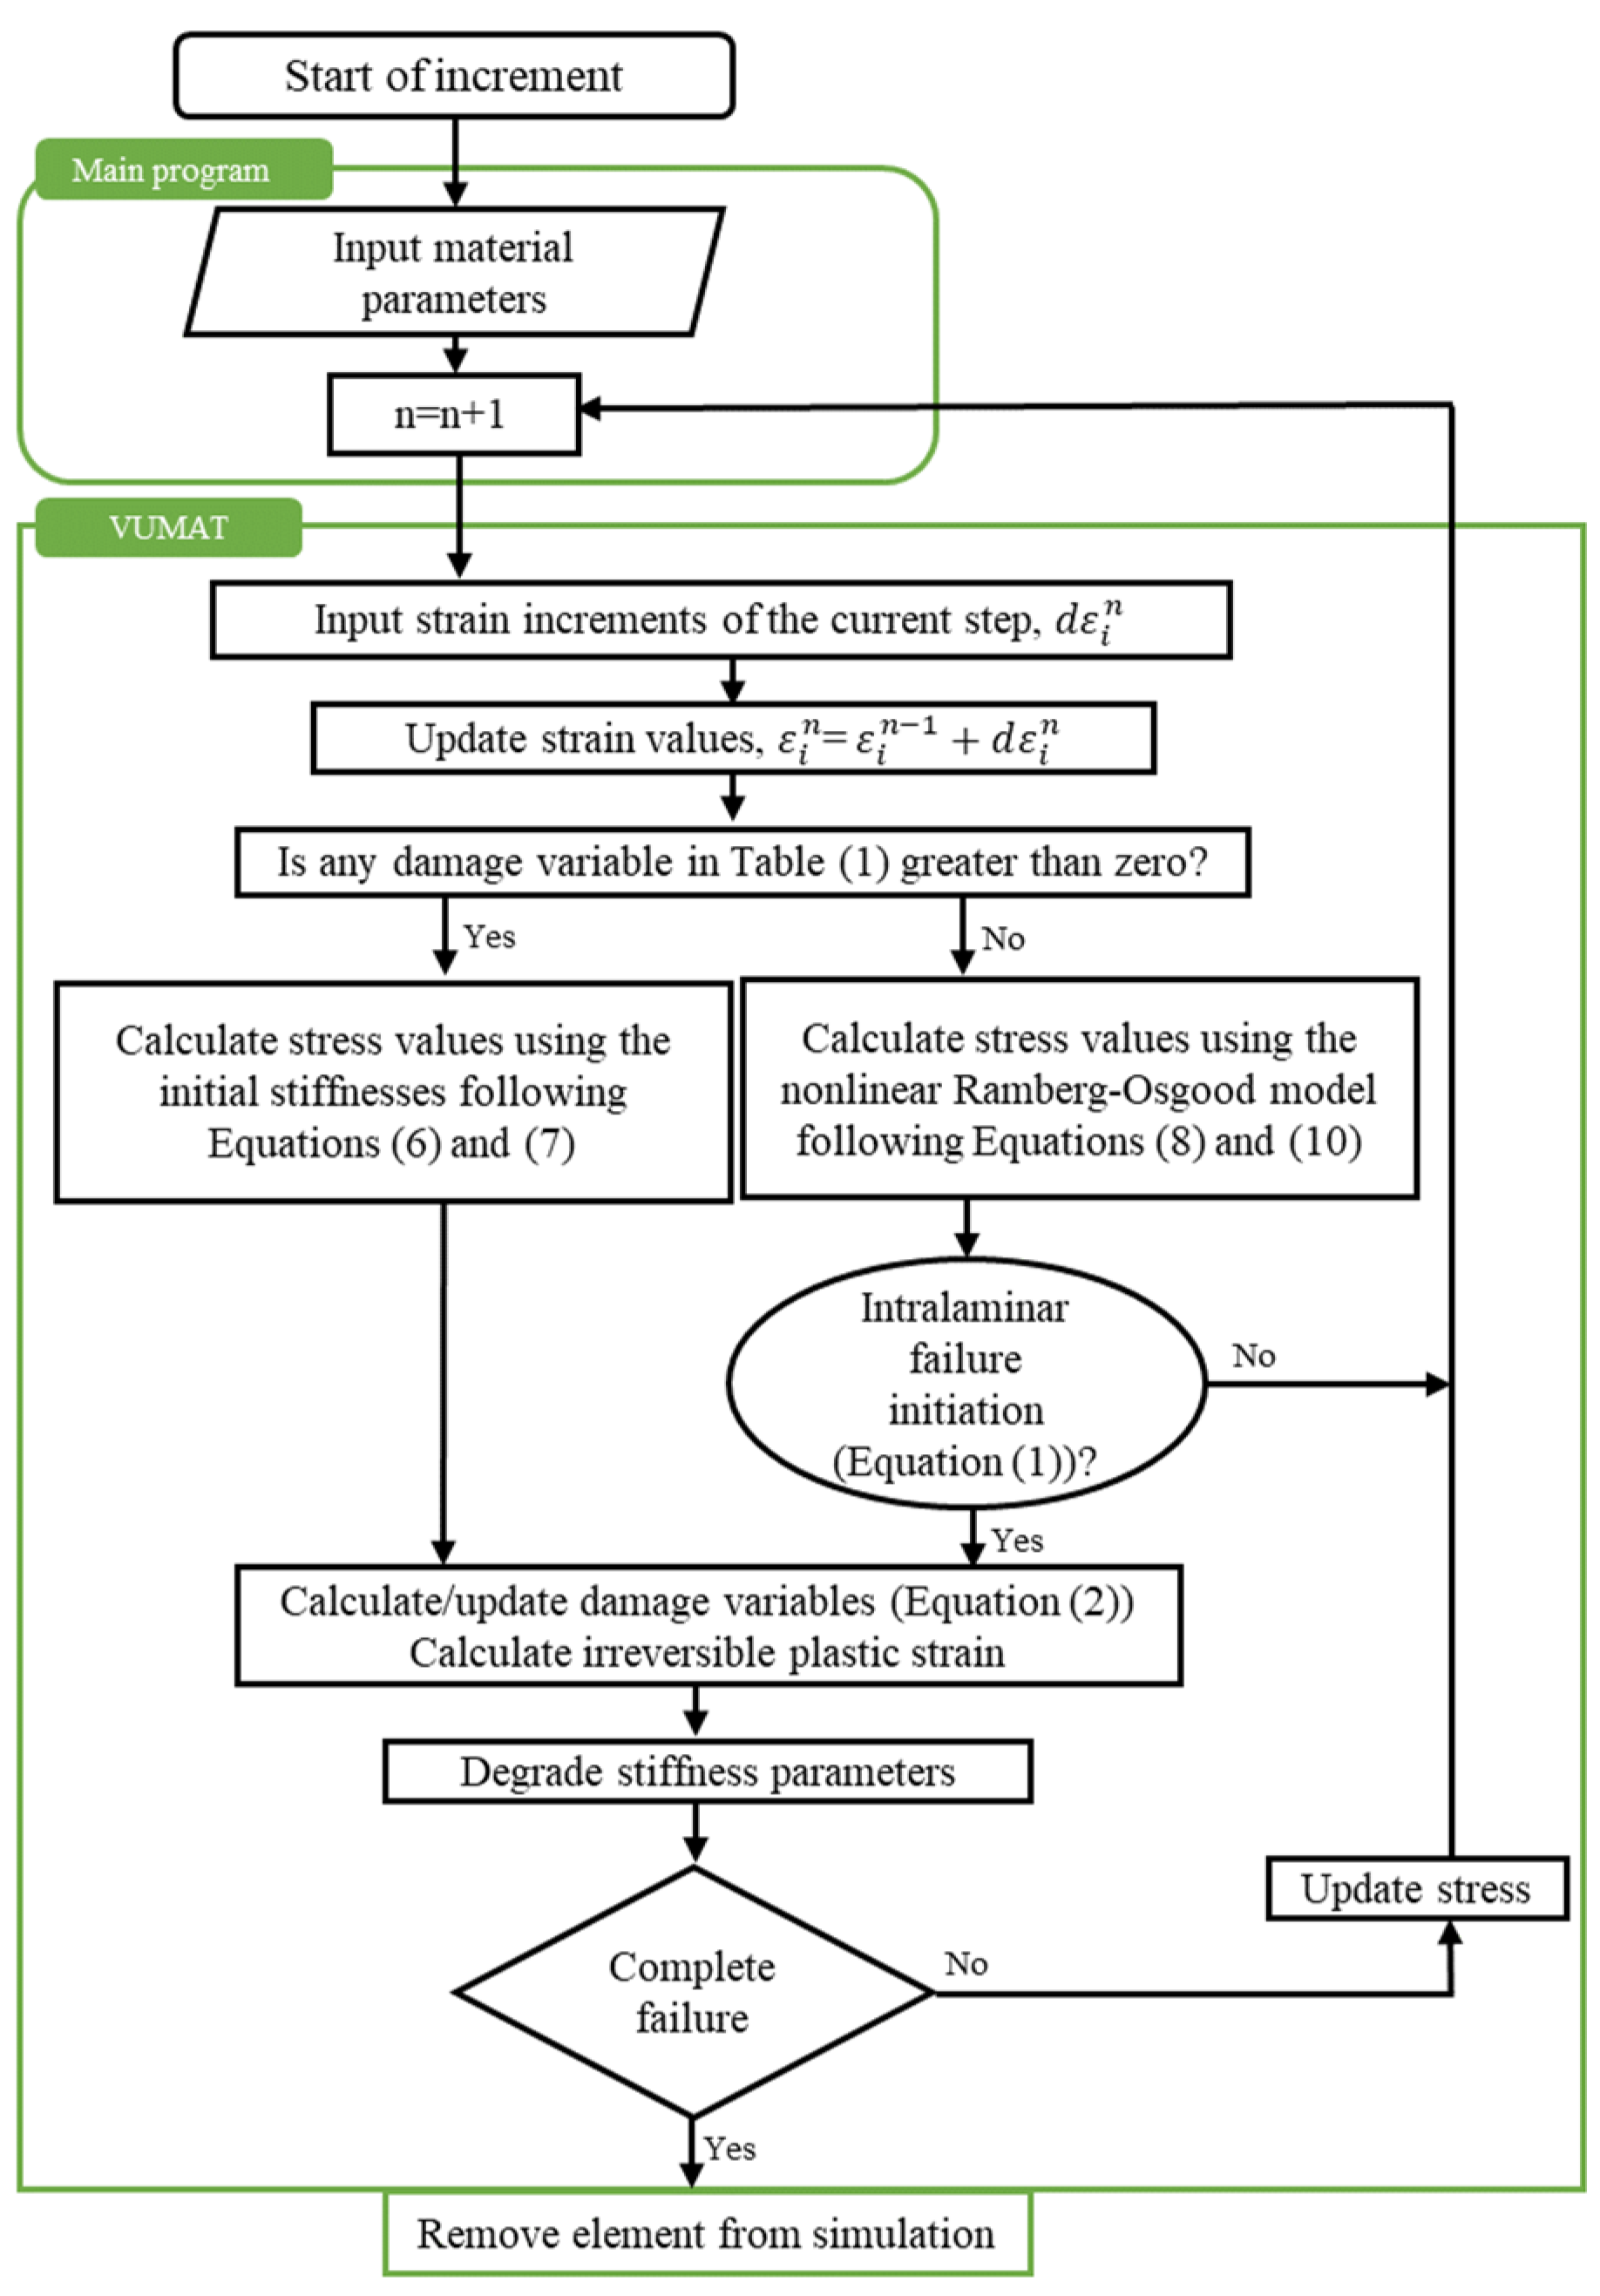
A flowchart of the numerical implementation of the material model is shown in Figure 2. Fully failed elements are deleted from the simulations to capture the perforation of the impactor and to reduce numerical instabilities due to thinning of elements and negative volume. Element deletion follows the method proposed by Gama et al. [89,90], which has proven accurate in predicting perforation in quasi-static punch, LVI, and ballistic impact tests. In this work, an element is removed from the simulation when it meets one of the criteria: (a) the tensile strain is greater than a specified value (E_LIMIT = 0.4) in both the first and second material directions, (b) the element volume to initial volume ratio is lower than the specified limit (ECRSH = 0.001), and (c) the element volume to initial volume ratio is greater than a specified value (EEXPN = 2).
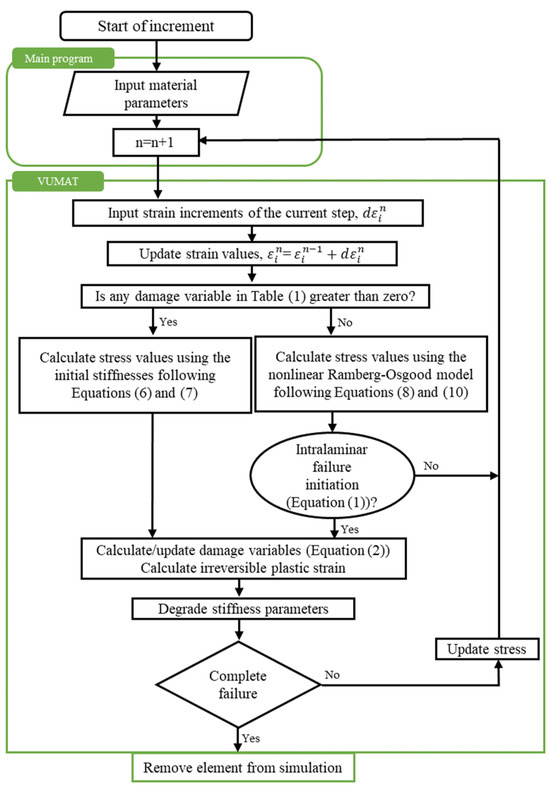
Figure 2.
Flowchart of the VUMAT or user-defined model for the material.
2.2.3. Definition of the Model
The stacked dynamic FE model of the laminate was simulated using Lagrangian 3D elements, as shown in Figure 3. The element type for the GFRP layers was C3D8R indicating a linear brick element with eight nodes and reduced integration. Hourglass control option Enhanced was used for the simulations. Due to symmetry, the simulation only required modelling a quarter of the laminate, with dimensions of (75 × 50) mm. A fixed rigid clamp, emulating the experimental setup boundary condition, held the laminate back surface, counteracting the impact force. To simulate the experimental rubber fixture that prevents the laminate from moving out of its plane, the laminate corner nodes were restricted. Near the contact area between the impactor and the laminate, a refined mesh with an element size of 1 by 1 mm was established to capture precise impact effects. A less detailed mesh with an element size of 5 by 5 mm was used further away from the contact zone to enhance computational efficiency. In the analysis, a rigid impactor (diameter: 16 mm) was modelled to strike the laminate at the same initial energy and velocity recorded in the physical experiments. The interface damage was modelled by using fifteen cohesive contacts between sixteen 0.25 mm thick layers, allowing damage at each interface [91].
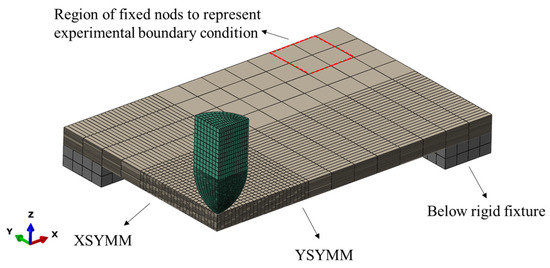
Figure 3.
3D finite element model of the laminate, clamping fixture, and hemispherical impactor.
The material constants of the laminate layer and cohesive contacts are summarized in Table 2. In addition to the properties from [65], tensile tests were performed in normal and shear directions to better characterize the nonlinear behaviour of the material. The inputs for the Ramberg–Osgood formulation were obtained by fitting the experimental tensile stress-strain curve obtained according to ASTM D3039 [92], as shown in Figure 4. When certain experimental data were lacking, properties for comparable GFRP composites cited in the literature were utilized.
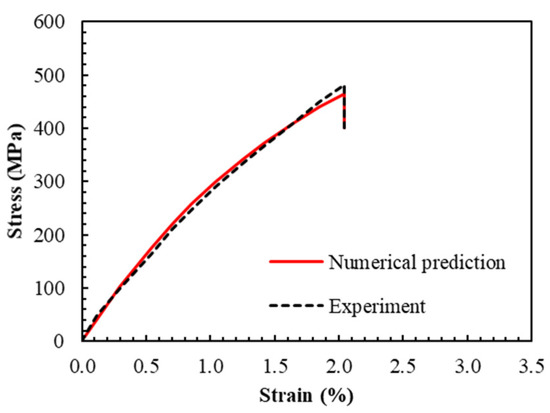
Figure 4.
Experimental and numerical (from the Ramberg–Osgood formulation) stress-strain curves for the S2-glass woven fabric reinforced polymer composites.
To model intralaminar failure, a penalty-based general contact algorithm was employed for the interaction between adjacent plies, with a set friction coefficient of 0.5 [93]. Additionally, the friction coefficient for the contact between the impactor and the laminate was set at 0.3 [94].
Table 2.
Material constants of the GFRP and cohesive contact.
Table 2.
Material constants of the GFRP and cohesive contact.
| Lamina Properties | Symbol [unit] | Value |
|---|---|---|
| Density | ρ [kg/m3] | 1740 **** |
| Initial modulus | E0 [GPa] | 36.5 * |
| Asymptotic stress level | [MPa] | 900 * |
| Shape parameter | m | 1.24 * |
| Elastic modulus | E3 [GPa] | 11.8 ** [65] |
| Shear modulus | [GPa] | 1.81 * |
| Shear modulus | , [GPa] | 2.14 ** [65] |
| Poisson’s ratio | 0.12 ** [65] | |
| Poisson’s ratio | , | 0.18 ** [65] |
| Tensile strength 1 | [MPa] | 482.8 * |
| Compressive strength 1 | [MPa] | 333.2 ** [65] |
| Tensile strength 2 | [MPa] | 482.8 * |
| Compressive strength 2 | [MPa] | 337.3 ** [65] |
| Shear strength 12 | [MPa] | 82 * |
| Shear strength 13 | [MPa] | 58 *** [90] |
| Intralaminar fracture toughness | , [N/mm] | 30 *** [95] |
| Interface properties | ||
| Contact stiffness | [GPa] | 12.1 *** [96] |
| [GPa] | 3.4 *** [96] | |
| Strength | [MPa] | 45.9 *** [96] |
| [MPa] | 49.5 *** [96] | |
| Interlaminar fracture toughness | [N/mm] | 0.98 *** [96] |
| [N/mm] | 3.71 *** [96] | |
| Mode interaction | 1.4 *** [96] |
* Properties obtained in this work; ** Properties from previous work on the same material; *** Literature value for a similar material; **** Rule of mixtures.
3. Results
3.1. Experimental Observations
3.1.1. Impact Force, Displacement and Absorbed Energy
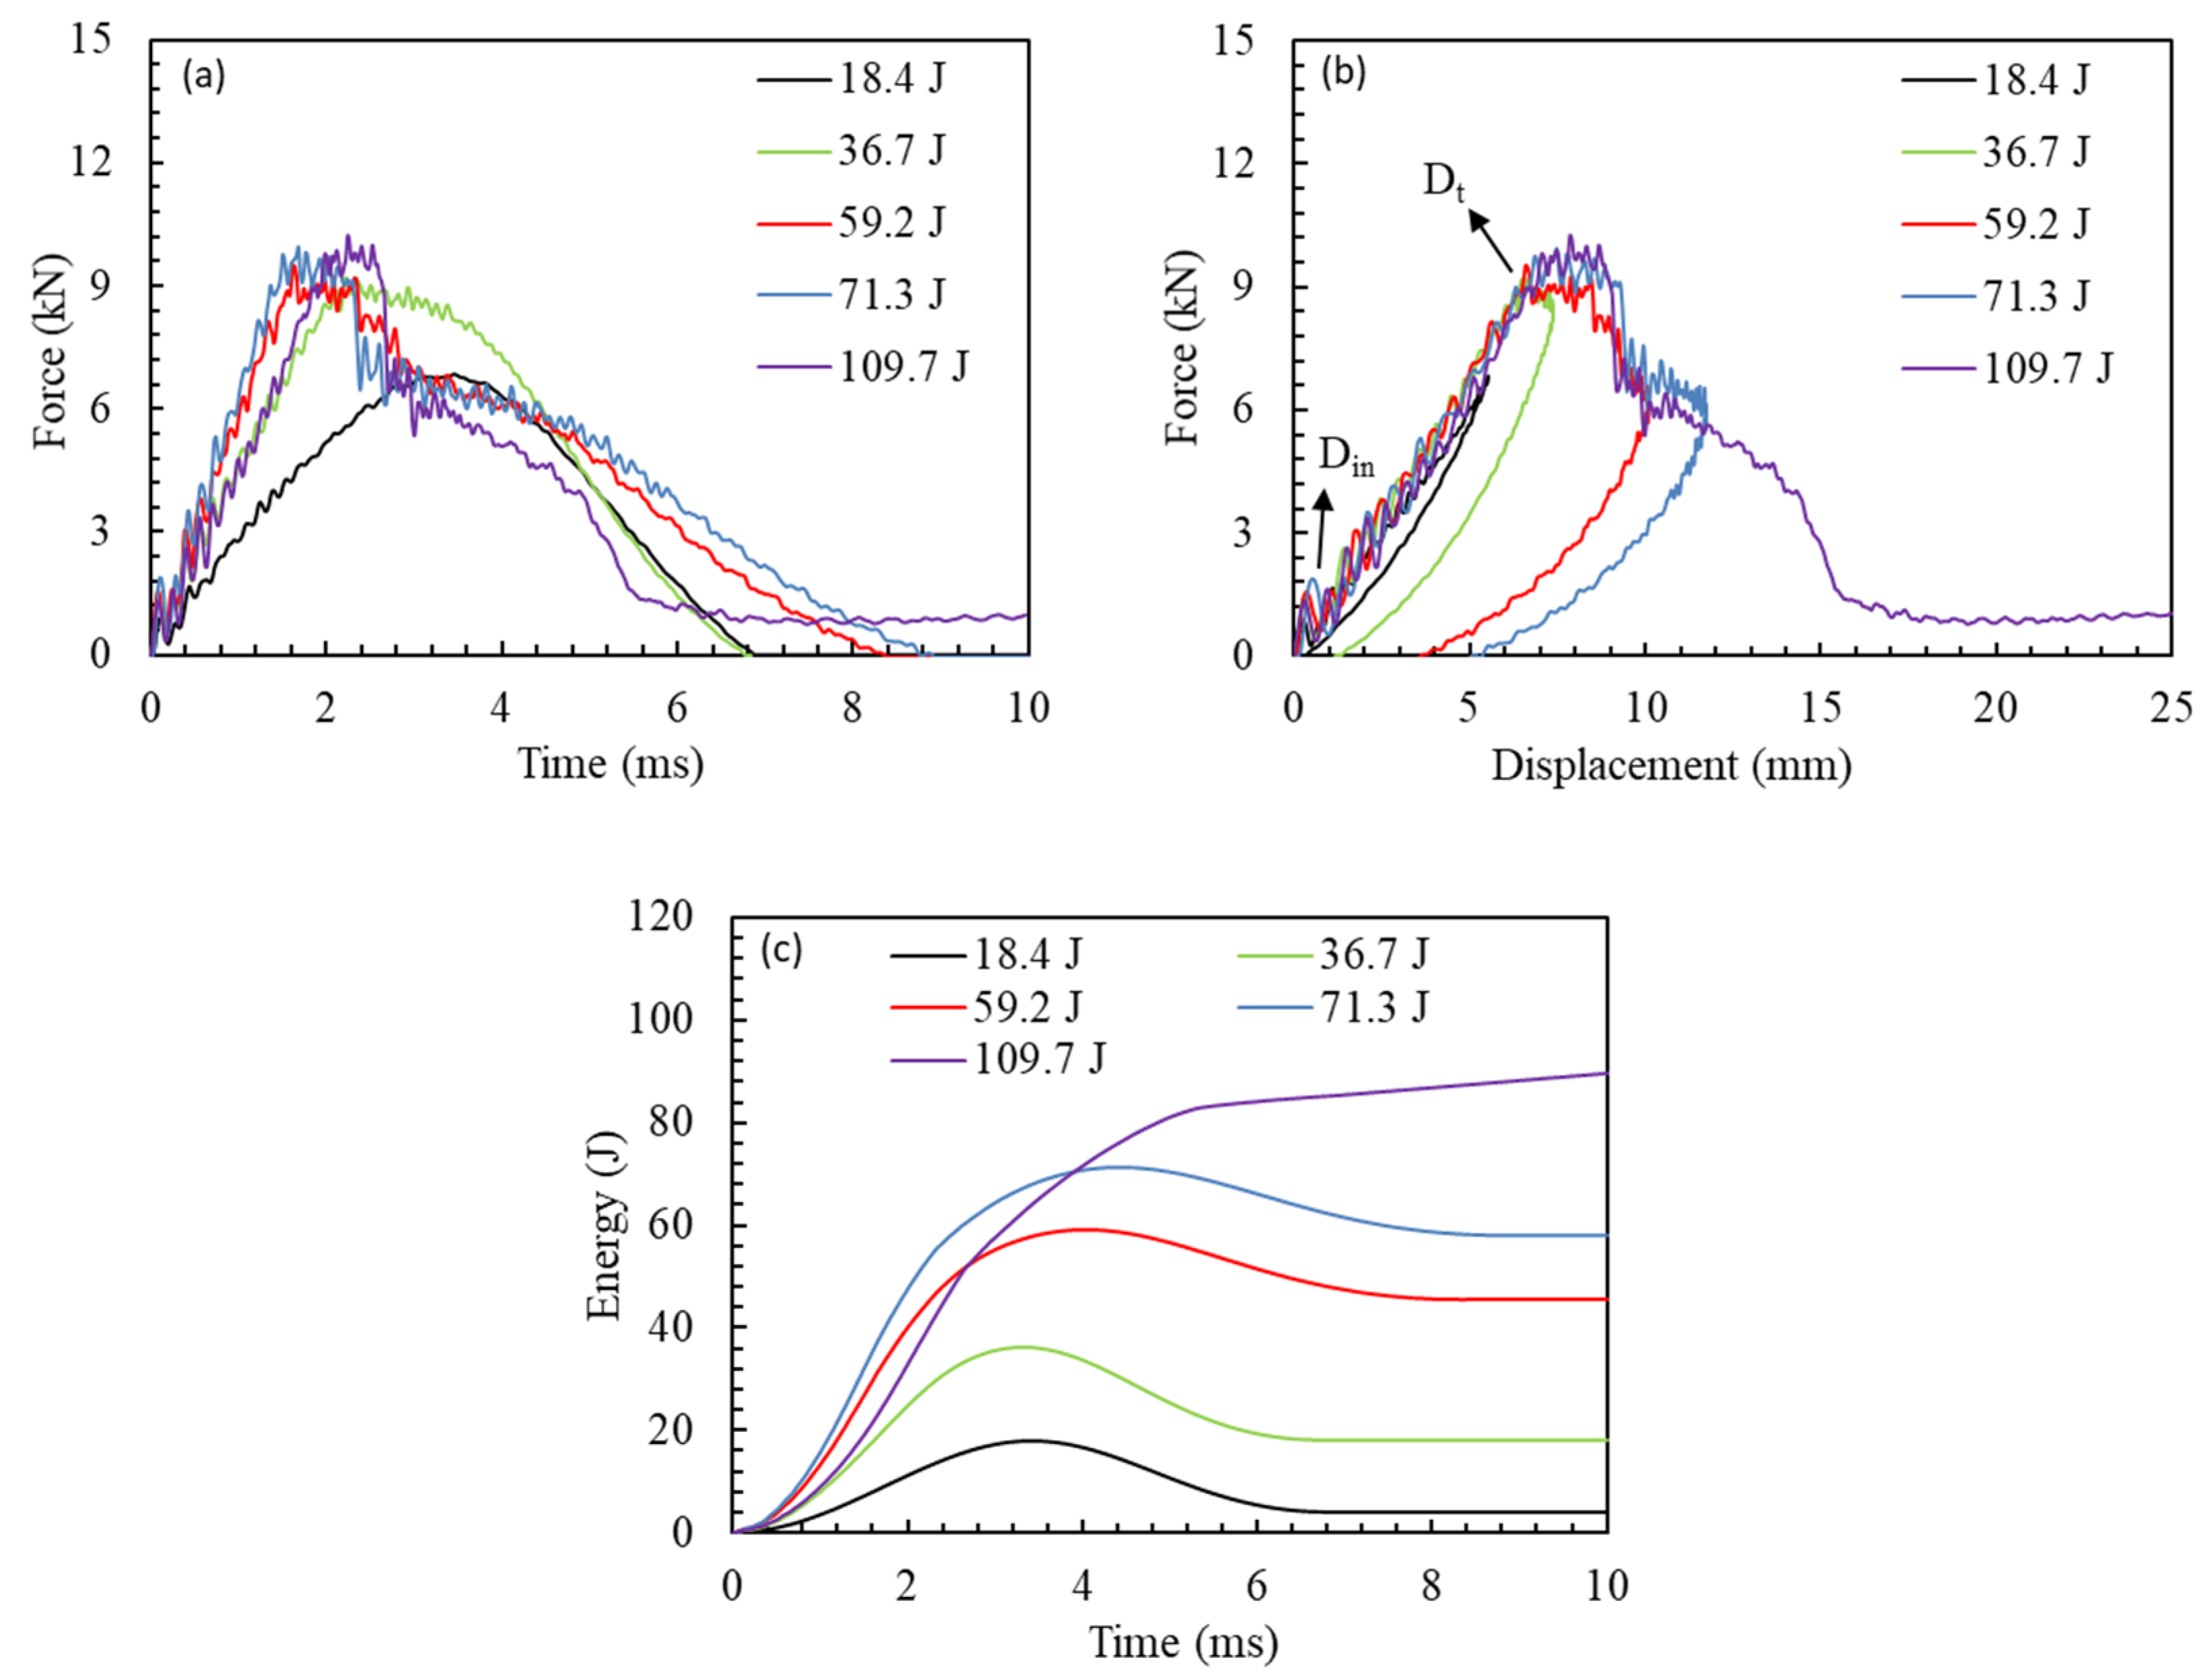
Figure 5 shows the force-time/energy and force-displacement curves of the LVI on the GFRP laminates at different energies. The impact response can be categorized into three energy ranges. From 18.4 J to 36.7 J, a smooth force-time curve was observed (Figure 5a), indicating that no severe damage occurred. The peak impact force increased with the impact energy and, due to the limited damage, the absorbed energy to impact energy ratio was low. From 36.7 J to 59.2 J, a gradual force drop was seen in the force-time history after reaching the peak impact force, attributed to the more severe failure and initiation of fibre damage that reduced the load-bearing capacity of the laminate. For energies higher than 36.7 J, the damage transition point “Dt” was located at similar locations at the force-displacement curves and, above that, no further increase in impact force was observed. The higher impact energy range, above 59.2 J, showed higher deformations during the propagation of damage, as previously reported for both thermoset and thermoplastic composites [97]. A sudden force drop in the force-time curves was observed for impacts above 59.2 J until the penetration threshold, indicating significant damage.
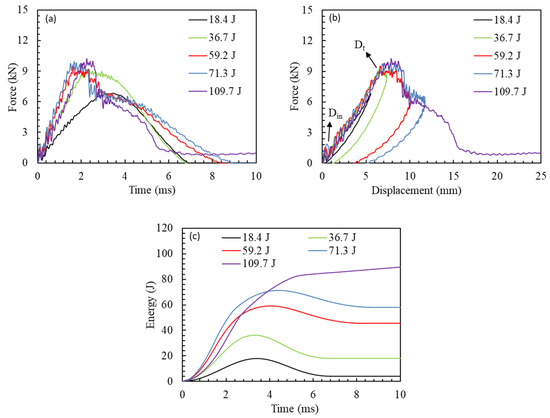
Figure 5.
Force-time (a), force-displacement (b), energy-time (c), curves obtained for low-velocity impacts at different energy levels.
The slopes in Figure 5b of the ascending segment of the force-displacement response has been described as impact stiffness [42,98]. While a rate-dependent impact stiffness has been reported in the literature [99], the impact stiffness here was nearly the same. The first drop in force-displacement response (at Din in Figure 5b) was associated with the initiation of damage [97]. The change in slope of the force-displacement curve at “Dt” indicated the propagation of damage with a more sudden change in slope and a larger peak displacement at higher impact energy. This change in slope and the sudden force drop indicated severe fibre breakage, which led to perforation at higher energies. In addition, more oscillation in the force-displacement response was observed with the increase in impact energy, attributed to the progressive nature of the damage and its severity. Figure 5c indicates higher dissipated energy ratios (evaluated following the procedures outlined in the ASTM D7136 Standard [67]) with the increase in impact energy. For energies above the penetration threshold, the laminate was unable to absorb all energy from the impactor, leading to residual values in the force-time curve due to the friction between impactor and laminate after perforation.
3.1.2. Damaged Area
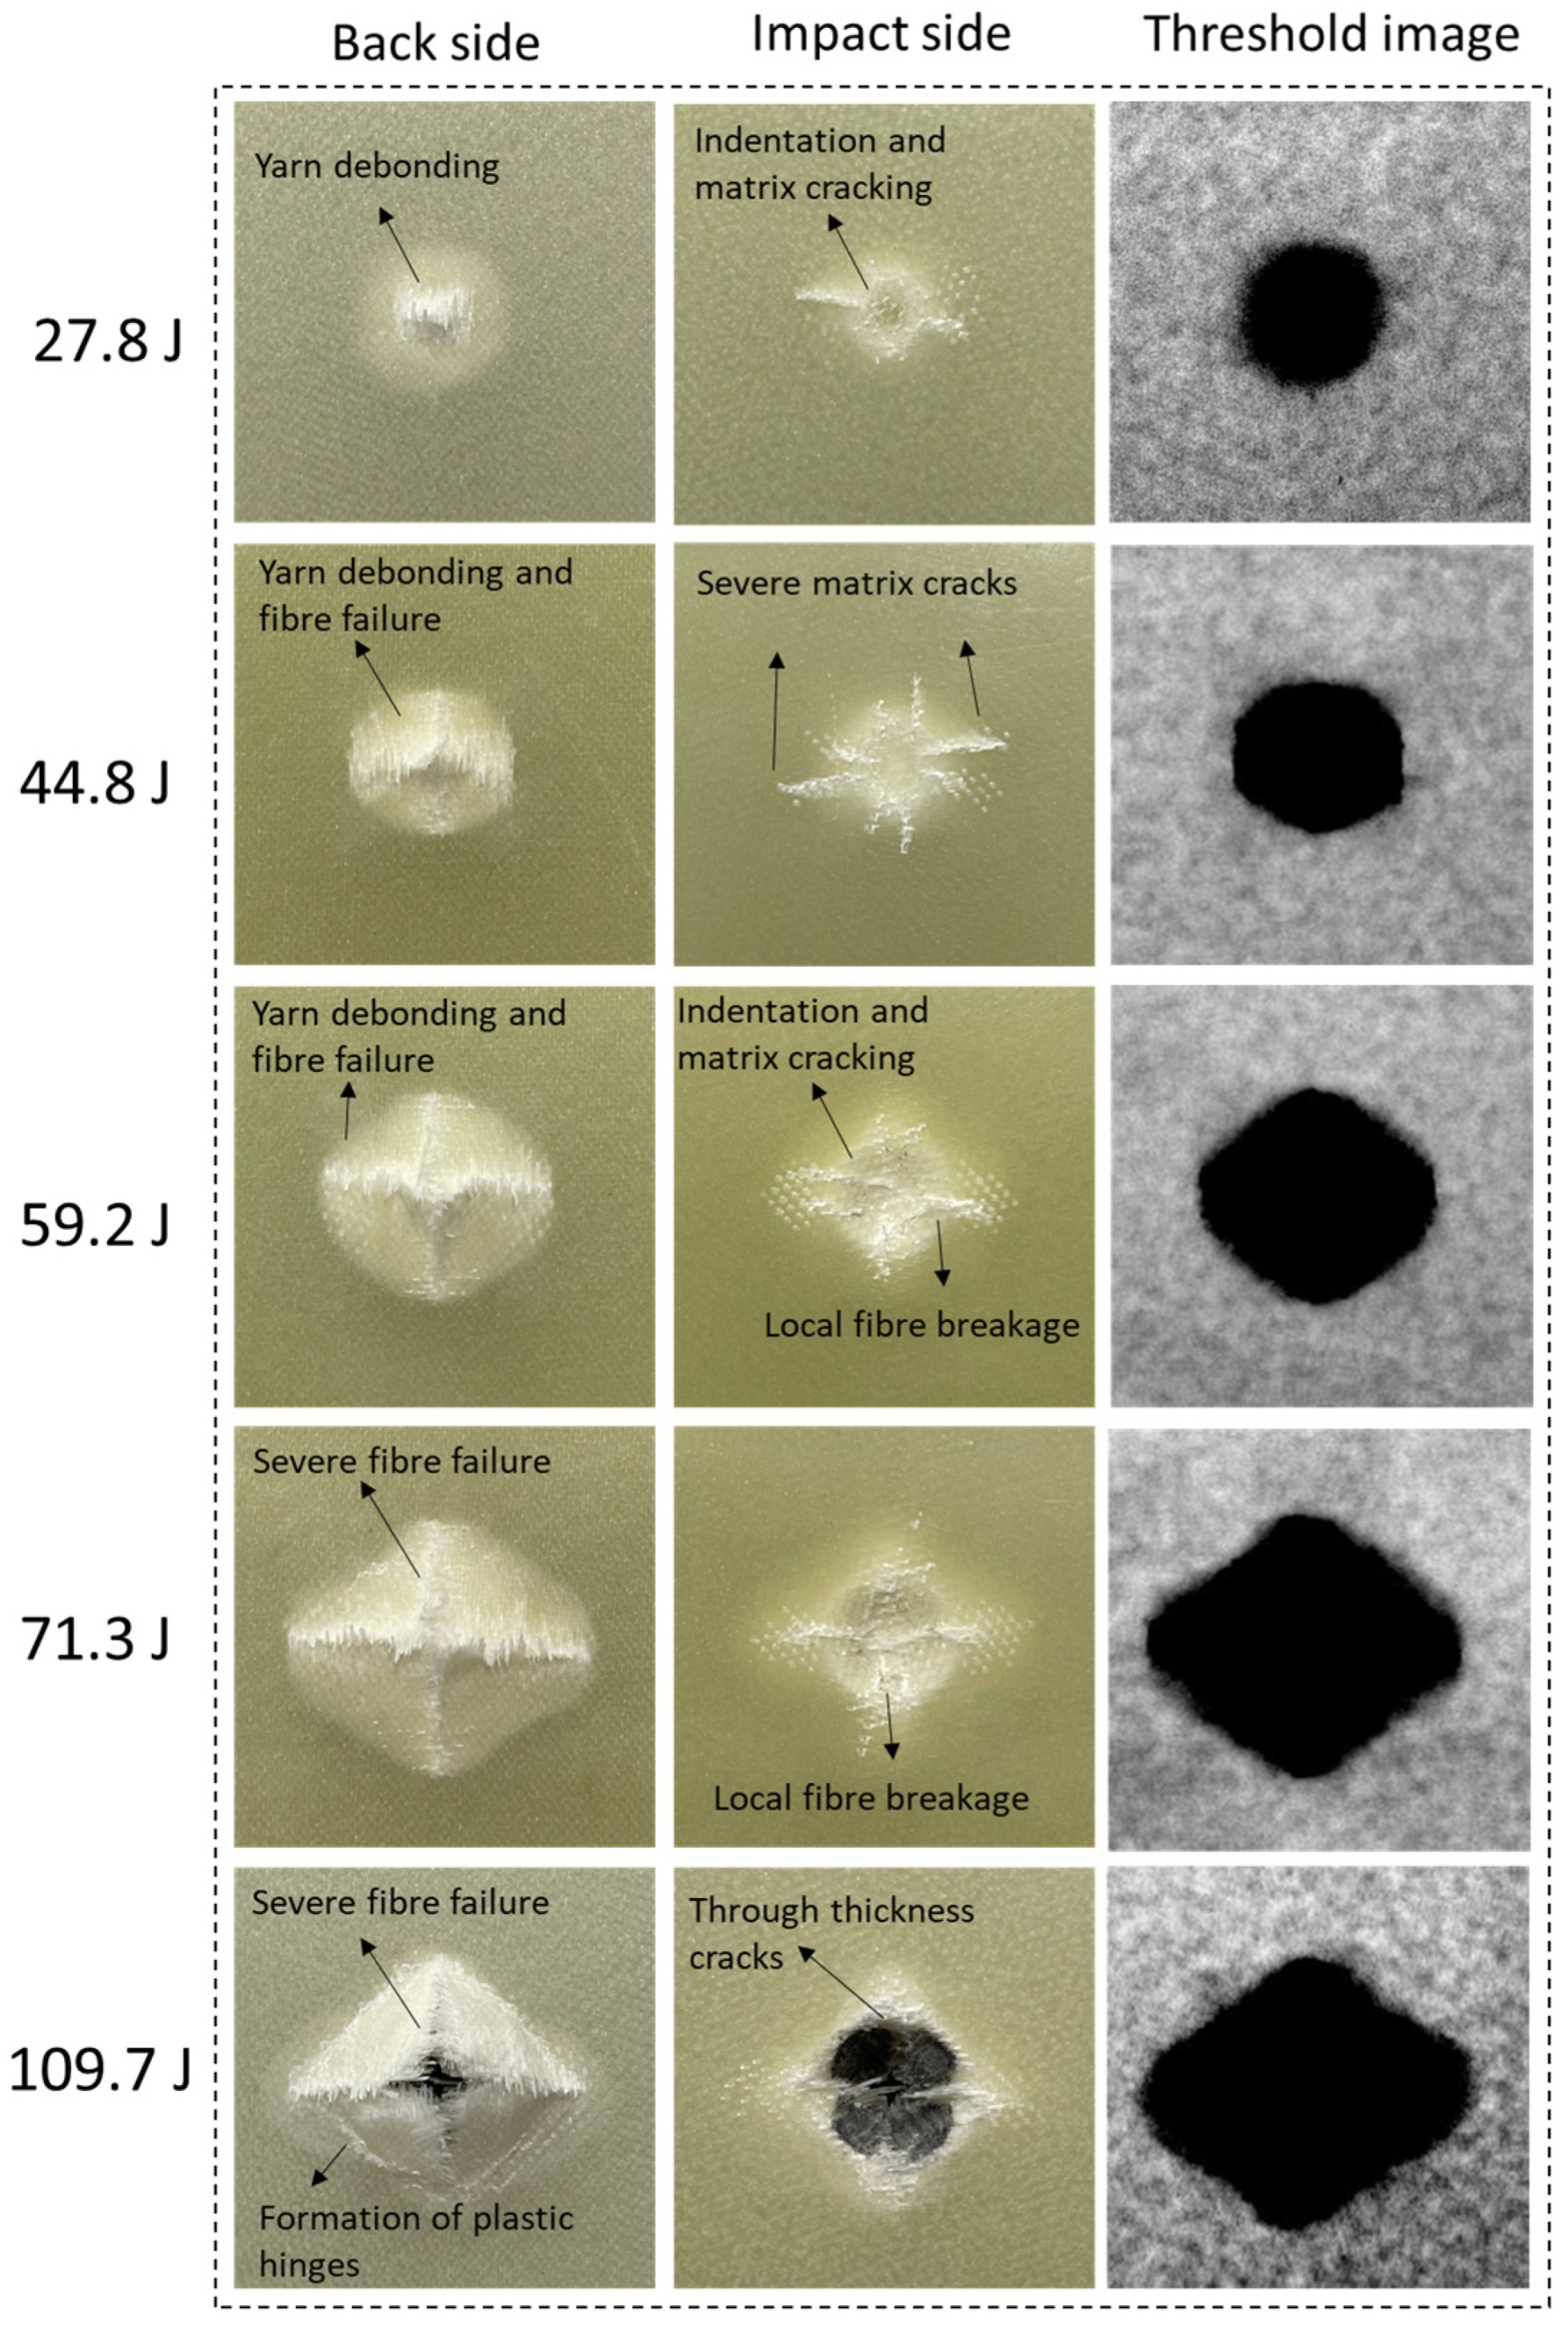
Figure 6 shows the damage at the back and impact sides of the specimens at different energies, as well as the backlighting images to highlight the total damaged area. The observed damage mechanisms included matrix cracking, fibre breakage, delamination, permanent indentation, and yarn debonding [5,97,100]. For impact energies from 18.4 J to 36.7 J, delamination, yarn debonding, and permanent indentation were the dominant failure modes. The delamination area in these cases was limited to the small area under the impactor, which led to the low absorbed energy ratio. For energies higher than 44.8 J, fibre failure became predominant, and the delamination area propagated during impact, resulting in greater energy absorption. Propagation of fibre cracks from the backside through the thickness [101] resulted in rapid load loss for impacts higher than 59.2 J. The delamination area reached its maximum near the penetration threshold, and smaller areas were observed for perforated specimens in comparison to those at the penetration limit.

Figure 6.
Experimentally assessed damaged areas for different impact energies.
Figure 7 illustrates the contribution of each failure mode for different impact energies based on visual inspection and backlighting investigation. The micro-damage was more common at low impact energies while meso-damage such as yarn deboning and fibre failure was dominant at higher energies. The matrix cracking was more severe at 44.8 J and 59.2 J impacts, resulting in several cracks that initiated in the impact zone and propagated towards the boundaries of the laminate, but not necessarily following the fabric orientation. For energies higher than the penetration limit, the damage behaviour changed, with extensive fibre failure and less significant delamination and matrix damage compared to impacts at the perforation limit.
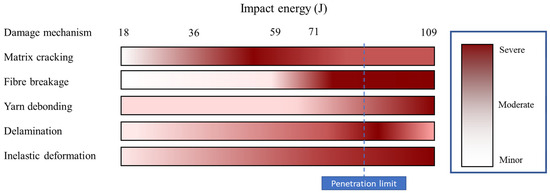
Figure 7.
Assessed contribution of each failure mode to the total damage of the specimen.
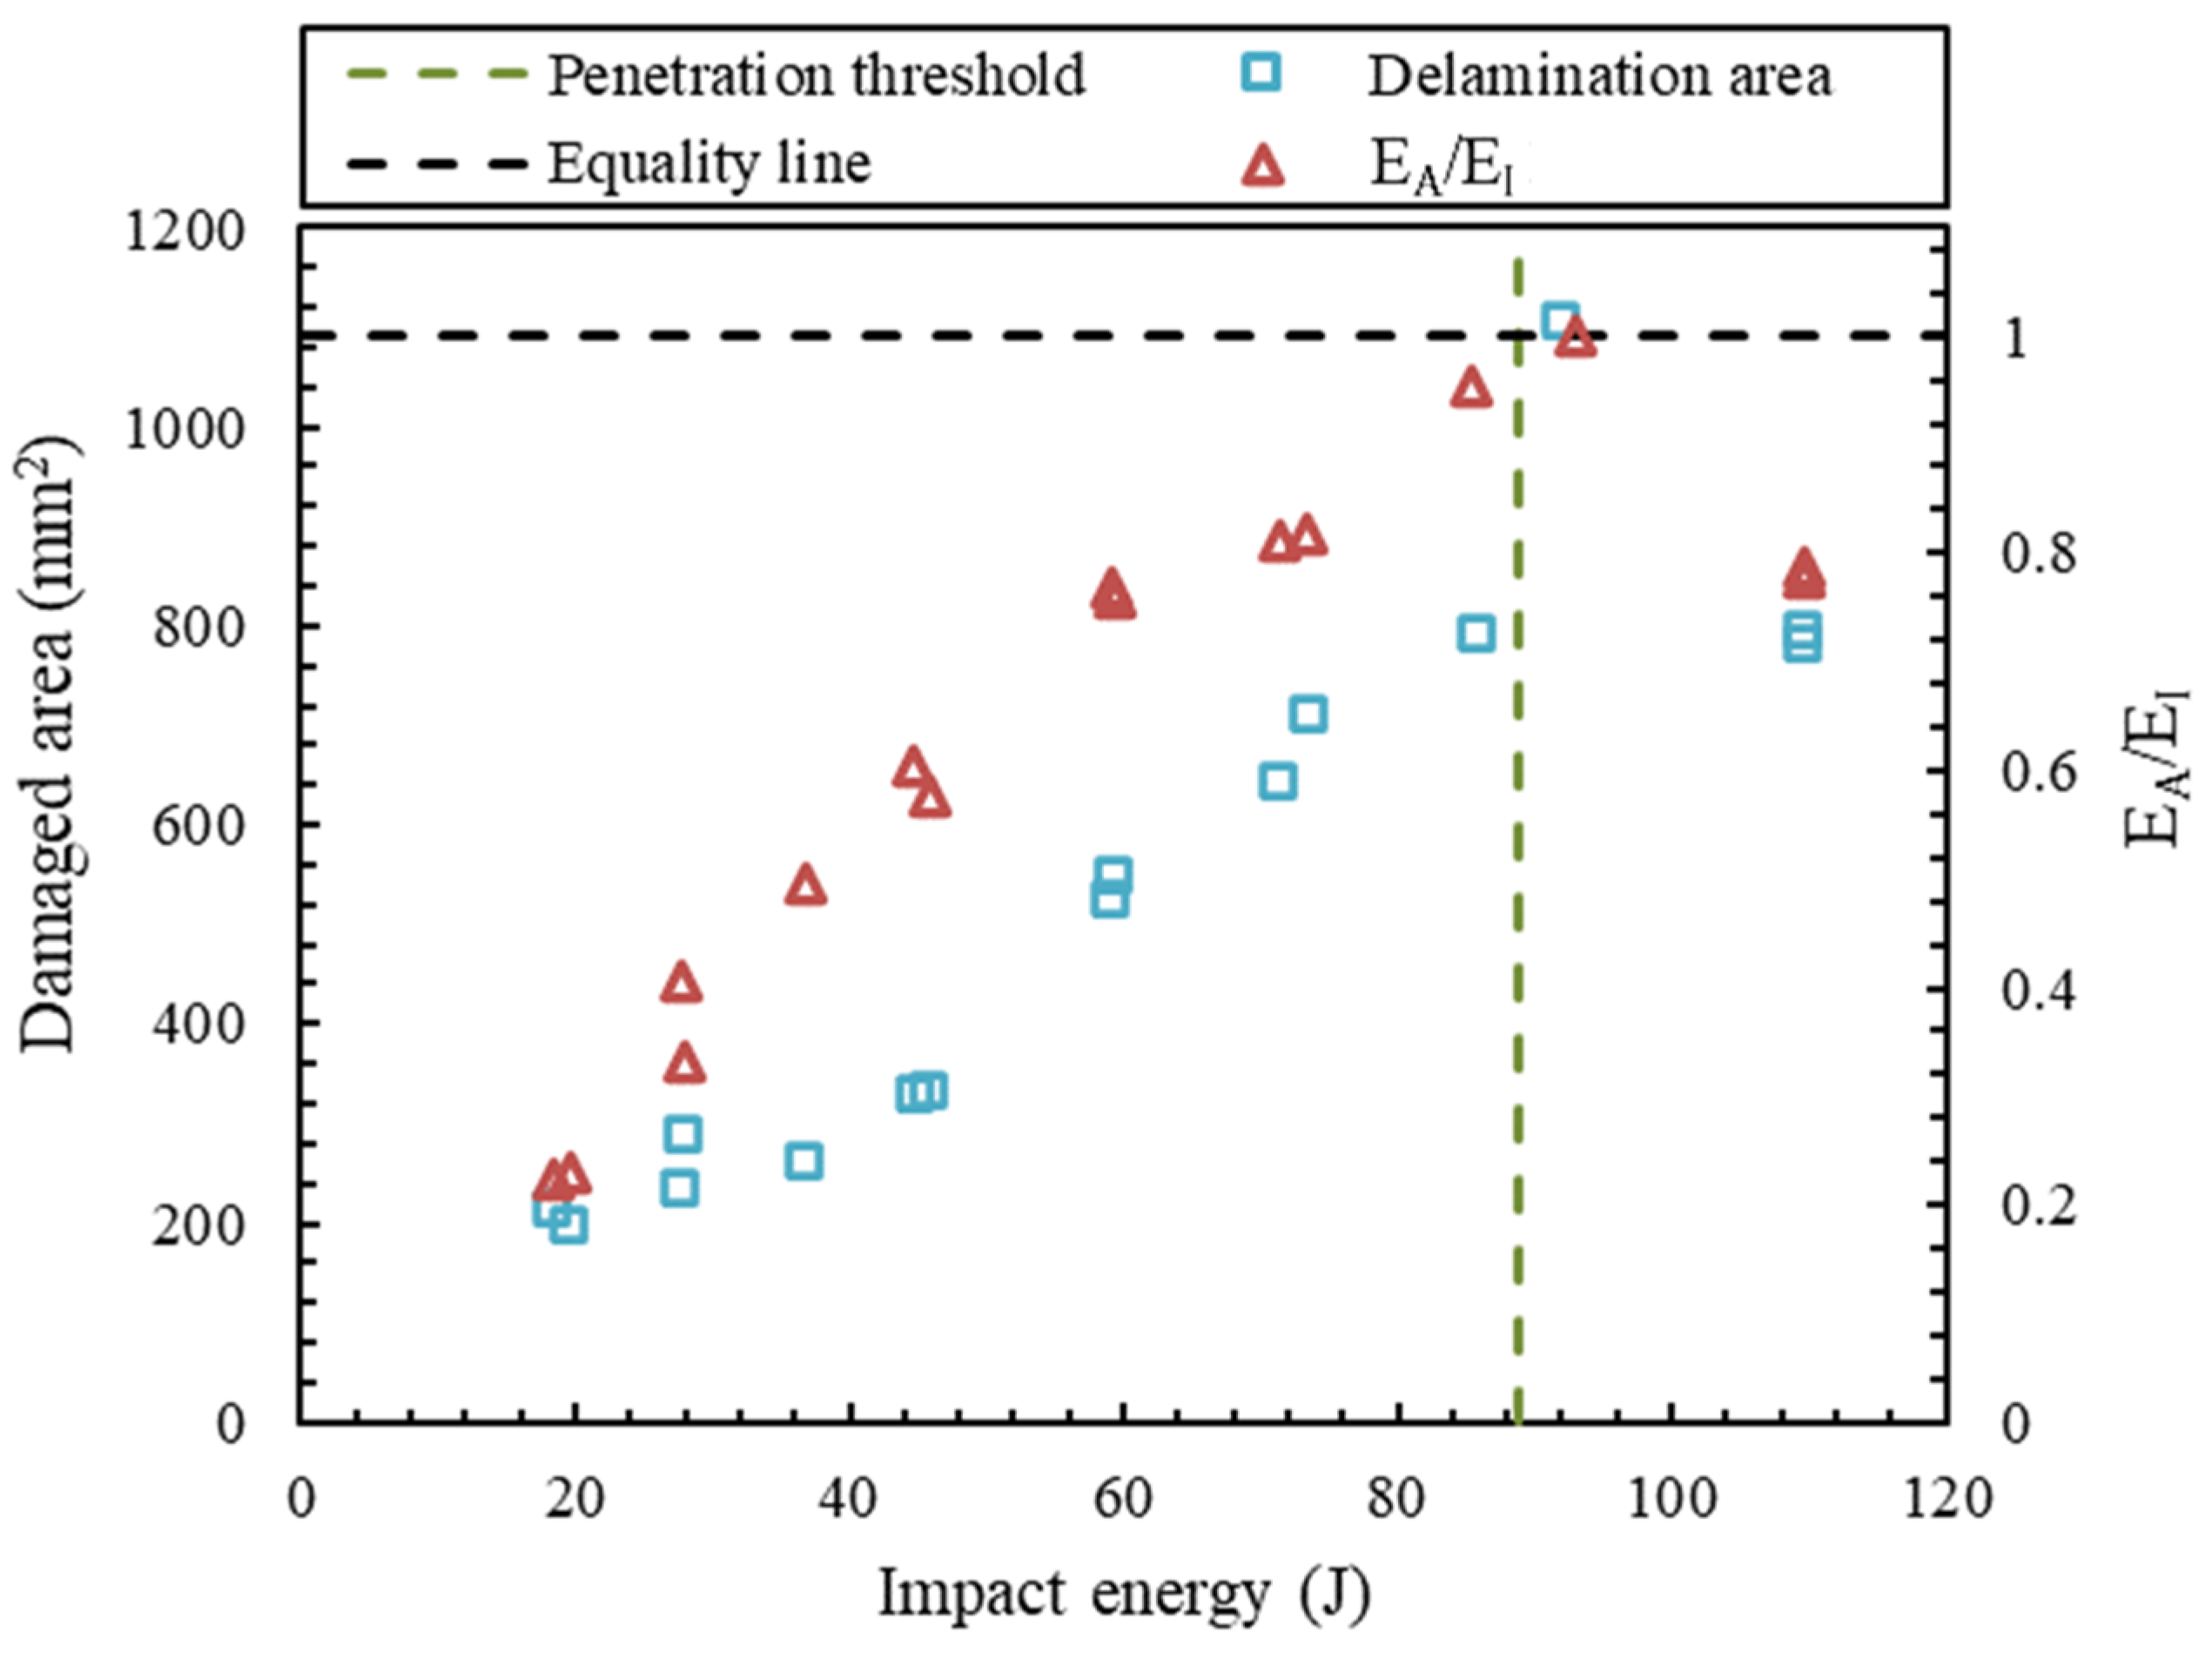
Figure 8 shows the variation in total damaged area and energy absorption to impact energy ratio (EA/EI) with impact energy. The horizontal dashed line indicates the equality between impact energy and absorbed energies (EA = EI), while the vertical dashed line represents the penetration threshold (~89 J), calculated by averaging the energy from the experiments related to the maximum energy resulting in partial penetration and the minimum energy leading to complete perforation. At higher energies, the impactor fully perforated the specimen. Below this threshold, the absorbed energy ratio increased with the impact energies, attributed to a greater fibre breakage and delamination damage as the dominant energy absorption process in the specimen, as observed in Figure 6 and Figure 7.
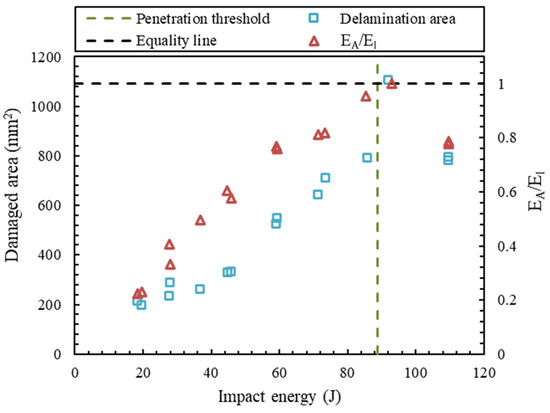
Figure 8.
Variation in experimental ratio of energy and total damaged area with impact energy.
Both parameters, energy ratio and damaged area, reached their peak around the penetration limit (Figure 8). A direct correlation between the damaged area and absorbed energy ratio can be observed. For impacts at 109.7 J, the specimen absorbed only 79% of the impactor energy with a damaged area of 795 mm2, 28% lower than that for the 92.9 J impact, showing a more local damage for the impact of 109.7 J.
3.2. Numerical Results
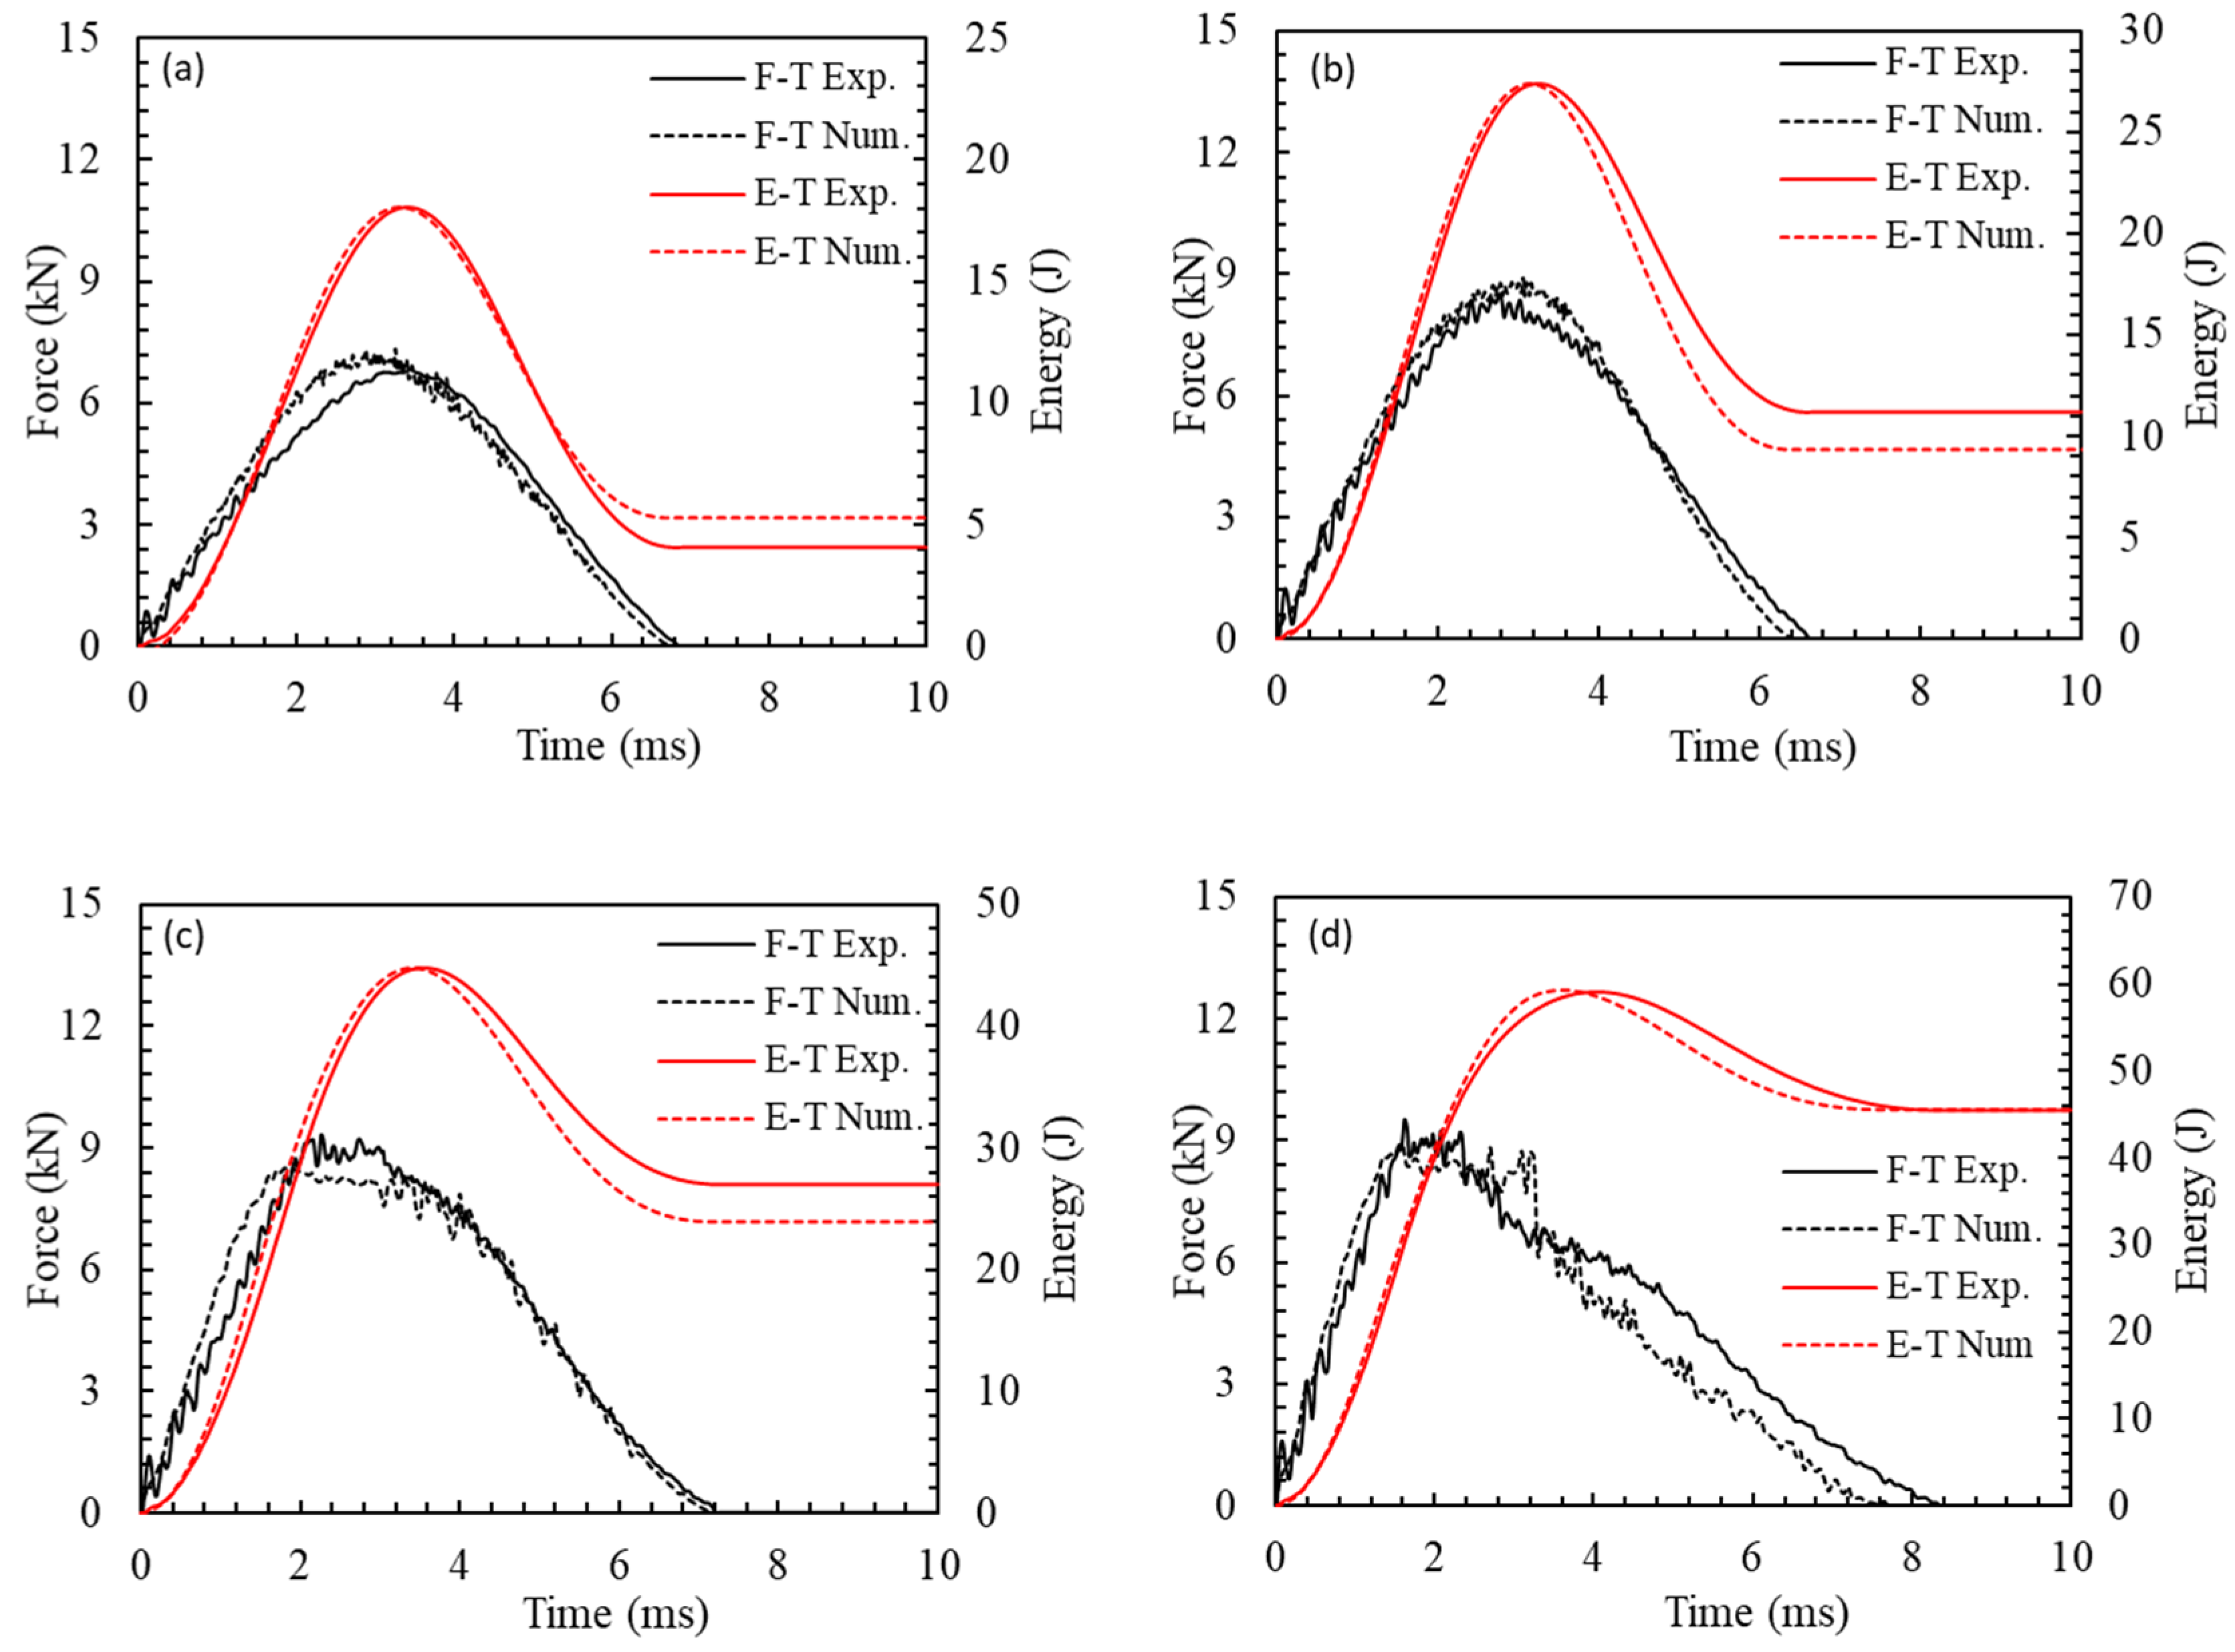
The comparison of force/energy-time curves for impacts at different energies is presented in Figure 9a–d. Good general agreement between numerical and experimental results for force, displacement, and energy responses was achieved for a wide range of impact energies. The model was accurate in predicting the different failure patterns observed experimentally, along with impact duration and peak force in most cases.
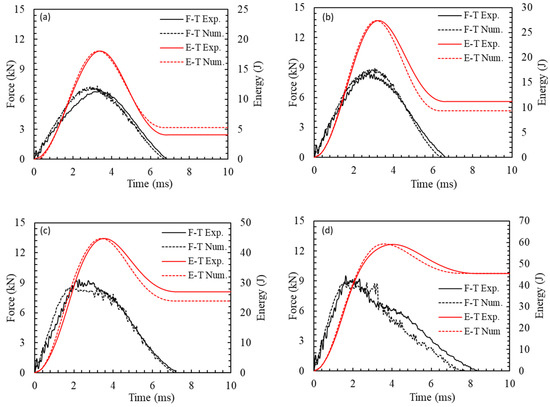
Figure 9.
Experimental and numerical impact force/energy-time curves obtained for impacts at: (a) 18.4 J, (b) 27.8 J, (c) 44.8 J, and (d) 59.2 J.
Furthermore, the FE model successfully captured both minor and major reductions in force, due to its precise prediction of damage progression during impact. The discrepancy in peak impact force at any impact energy was below 9%. However, greater inaccuracies were observed in estimating the dissipated energy, particularly for impacts within 18.4–27.8 J, which were associated with the variation in the dominant mechanisms of energy absorption at various impact energies. Notably, the model exhibited higher accuracy in predicting responses at high energy levels, attributed to a more accurate modelling of fibre breakage and delamination. These factors caused significant drops in the force-time curve and absorbed significant energy. At lower impact energies, however, the macro-heterogeneous model only considered the accumulation of inelastic strain leading to permanent indentation and delamination which contributed to energy dissipation.
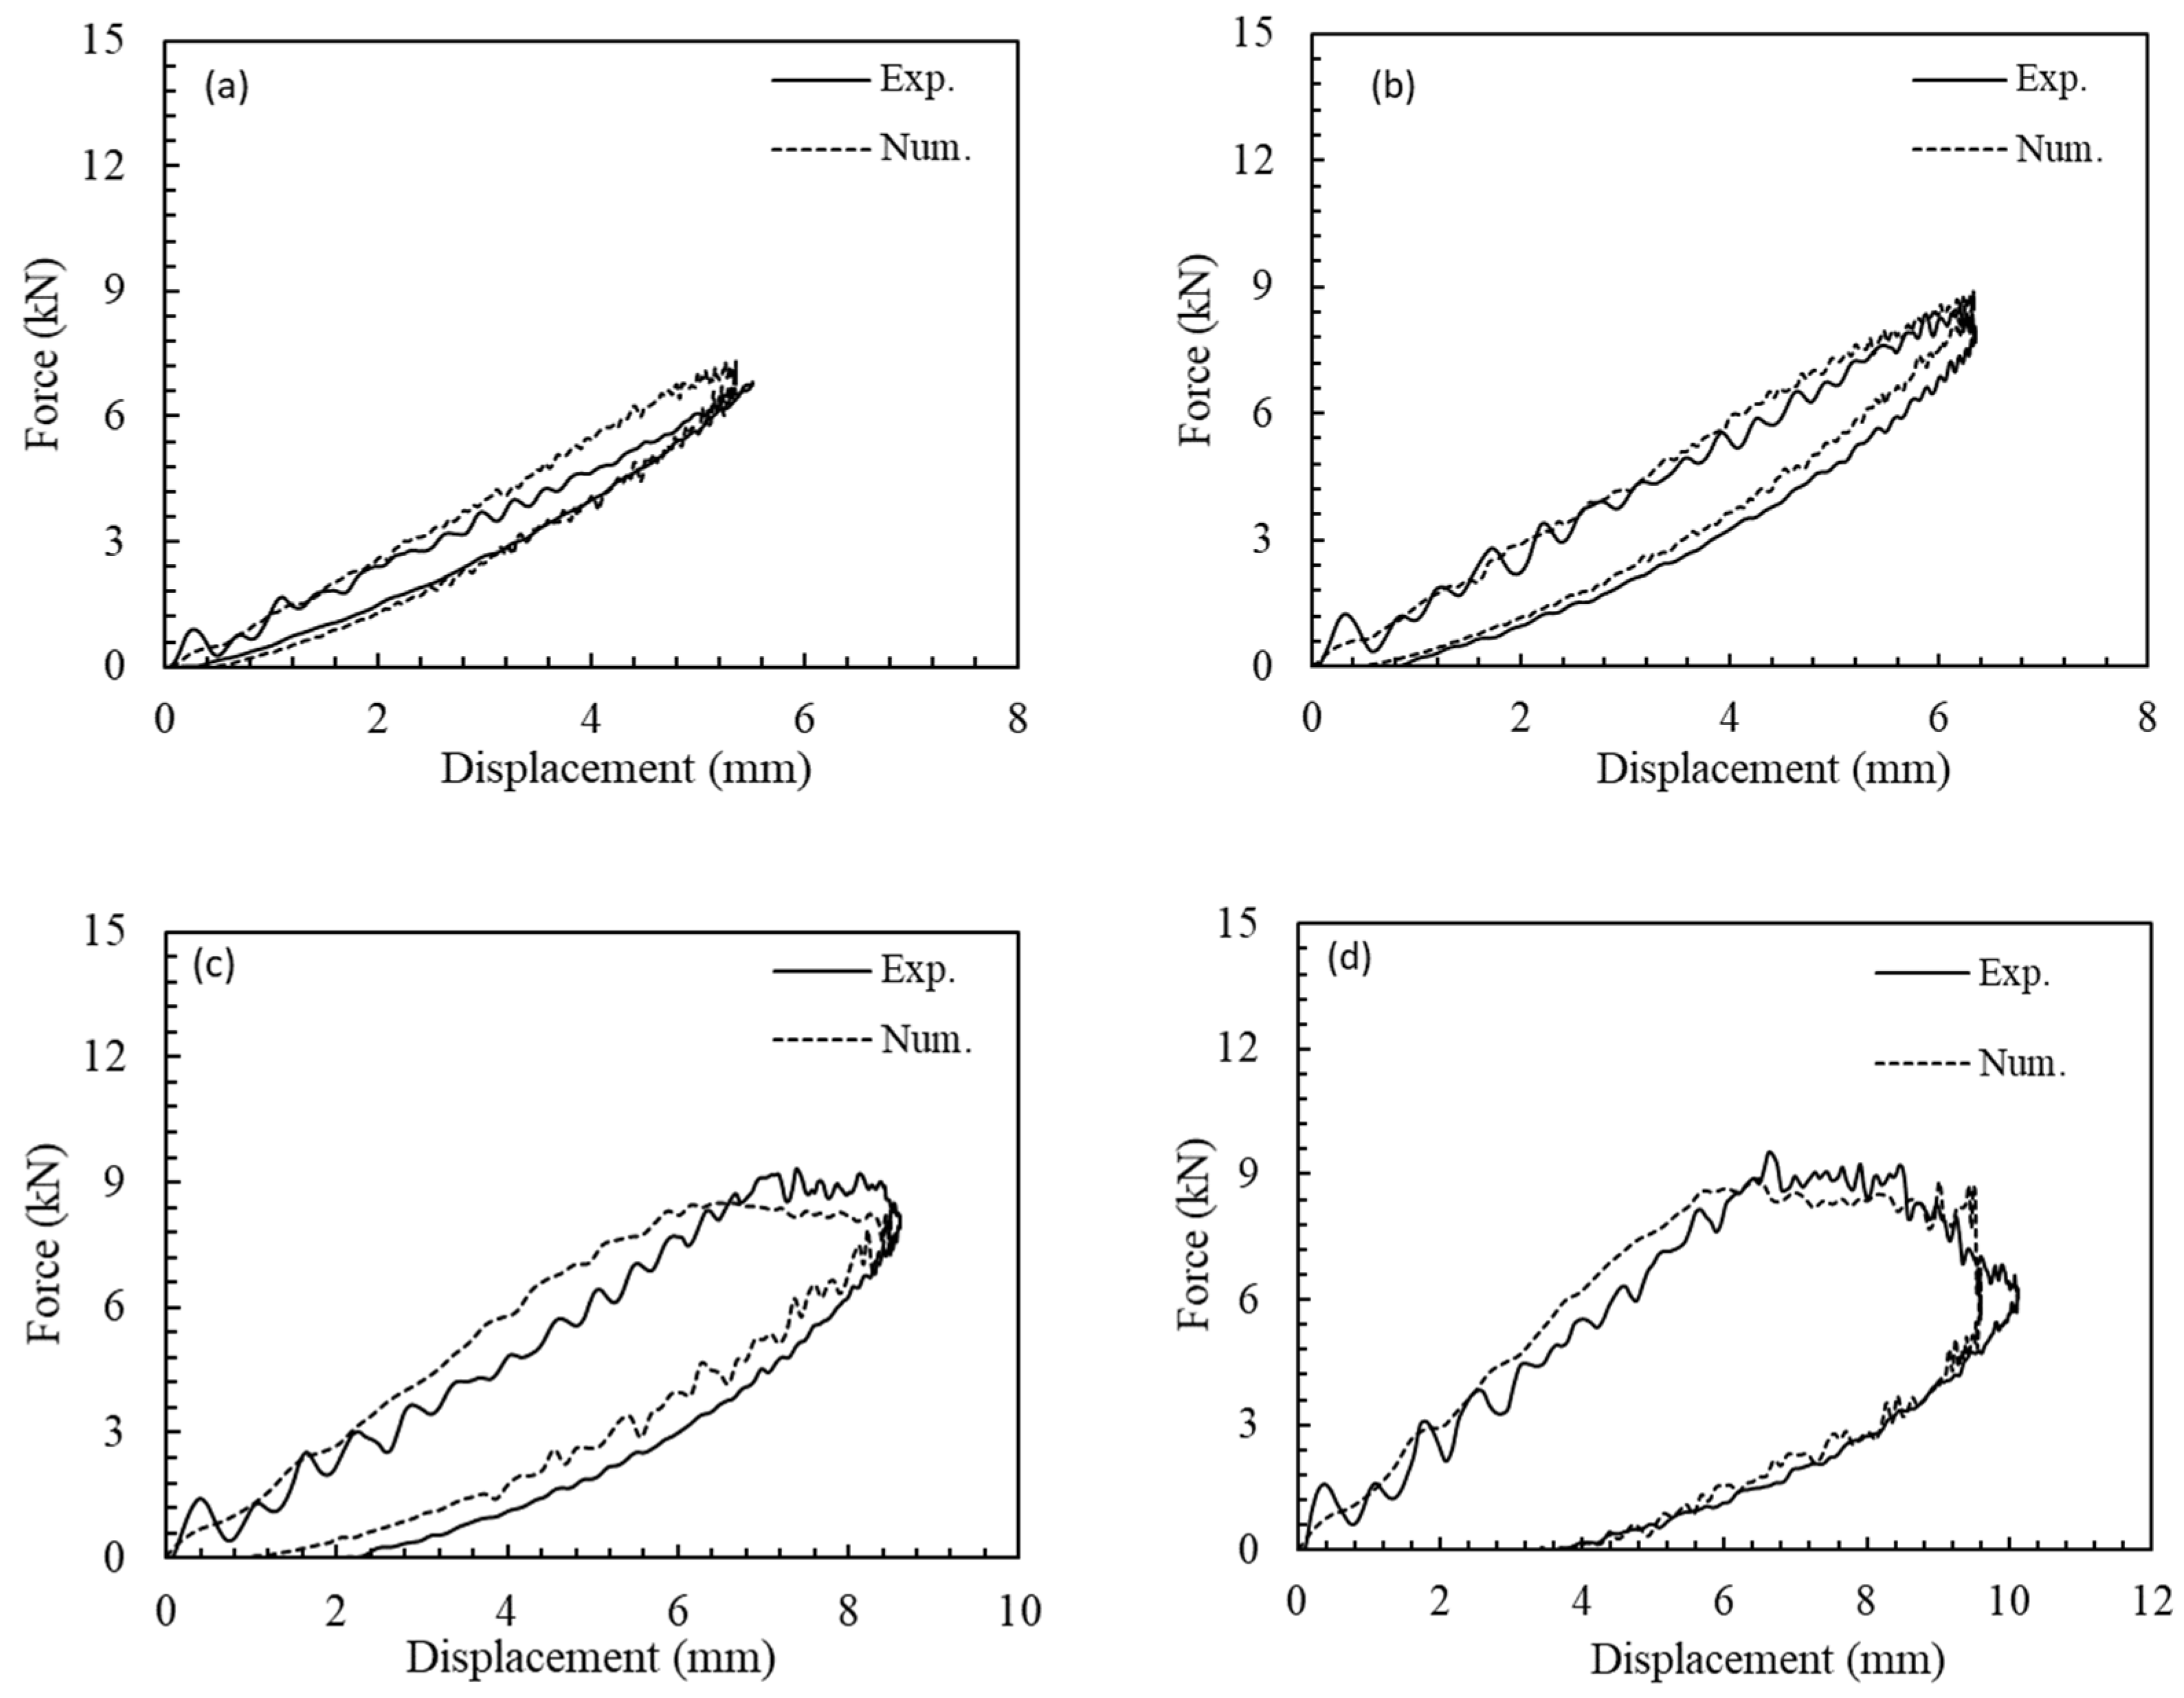
Figure 10a–d compares experimentally and numerically obtained force-displacement curves. The numerical model gave an accurate prediction of peak impact displacement, impact stiffness and damage at different impact energies. Especially for higher impact energies, similarly, closed curves were observed. For instance, the model accurately predicted the close force-displacement curve at 59.2 J impact without the sudden force drop to zero due to element removal. In addition, due to the detailed definition of contact in the model, close agreement was observed during the perforation event, defined here as the period between the first major force drop of the curve, at 3.2 ms, until complete perforation, at 8 ms.
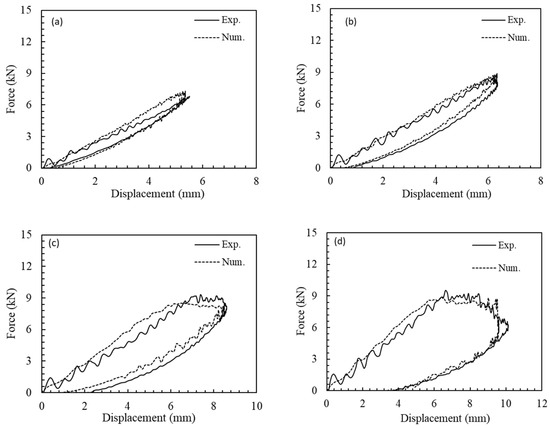
Figure 10.
Experimental and numerical force-displacement curves for impacts at: (a) 18.4 J, (b) 27.8 J, (c) 44.8 J, and (d) 59.2 J.
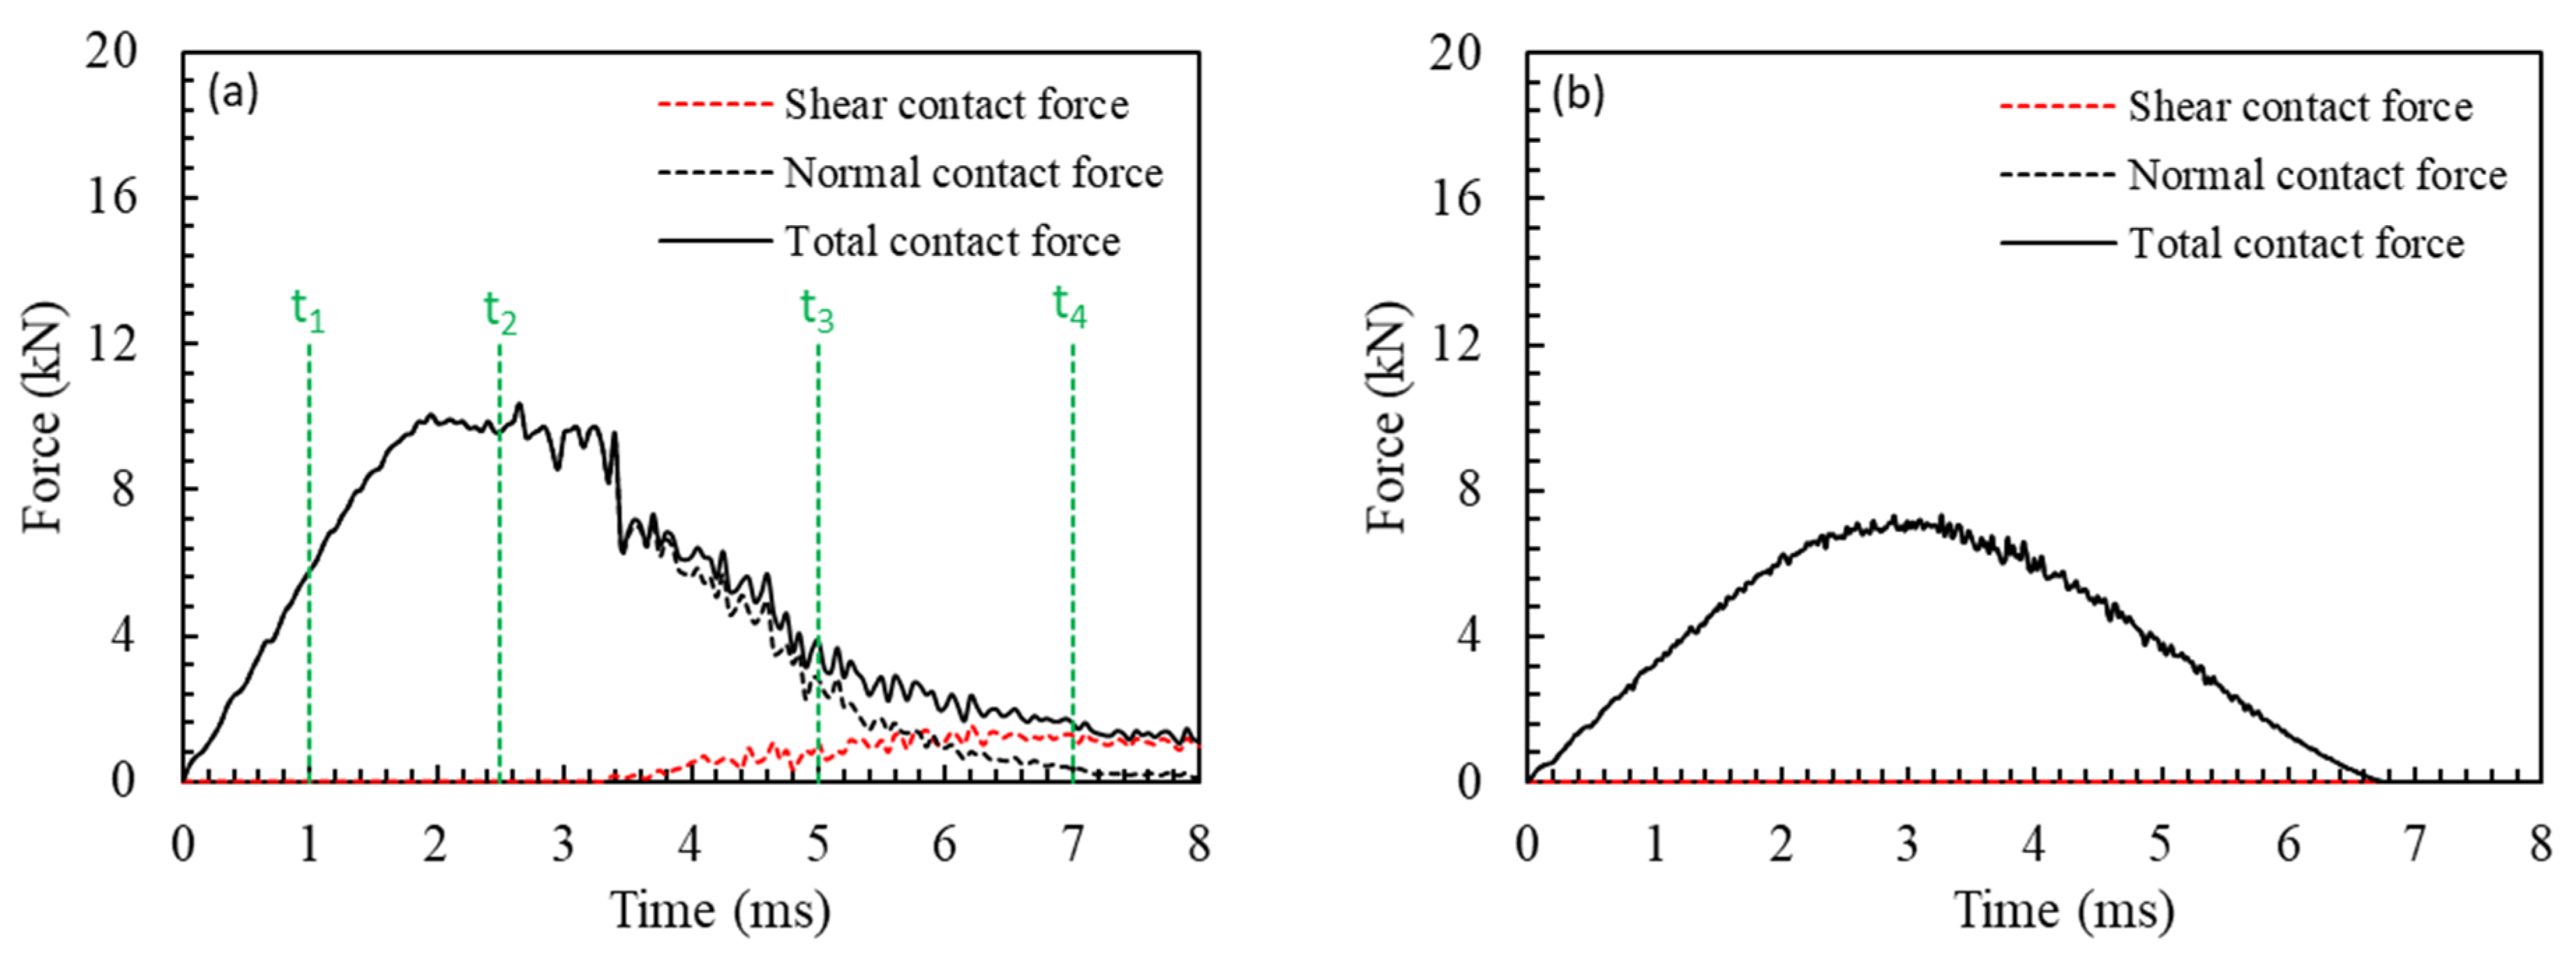
The contribution of normal and shear contact forces for the impacts at 109.7 and 18.4 J is shown in Figure 11a,b. For energies lower than the perforation limit, the total contact force is dominated by the normal contact force, whereas the shear force between the impactor and the laminate plays a significant role above that. Indeed, the shear force is initially zero at the beginning of the perforation event and reaches its maximum by the end of the perforation, at which time the normal force is zero.
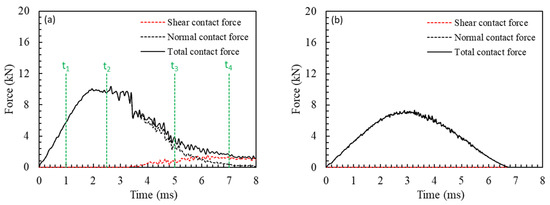
Figure 11.
Normal and shear contact forces contribution for impact energies of: (a) 109.7 J, (b) 18.4 J.
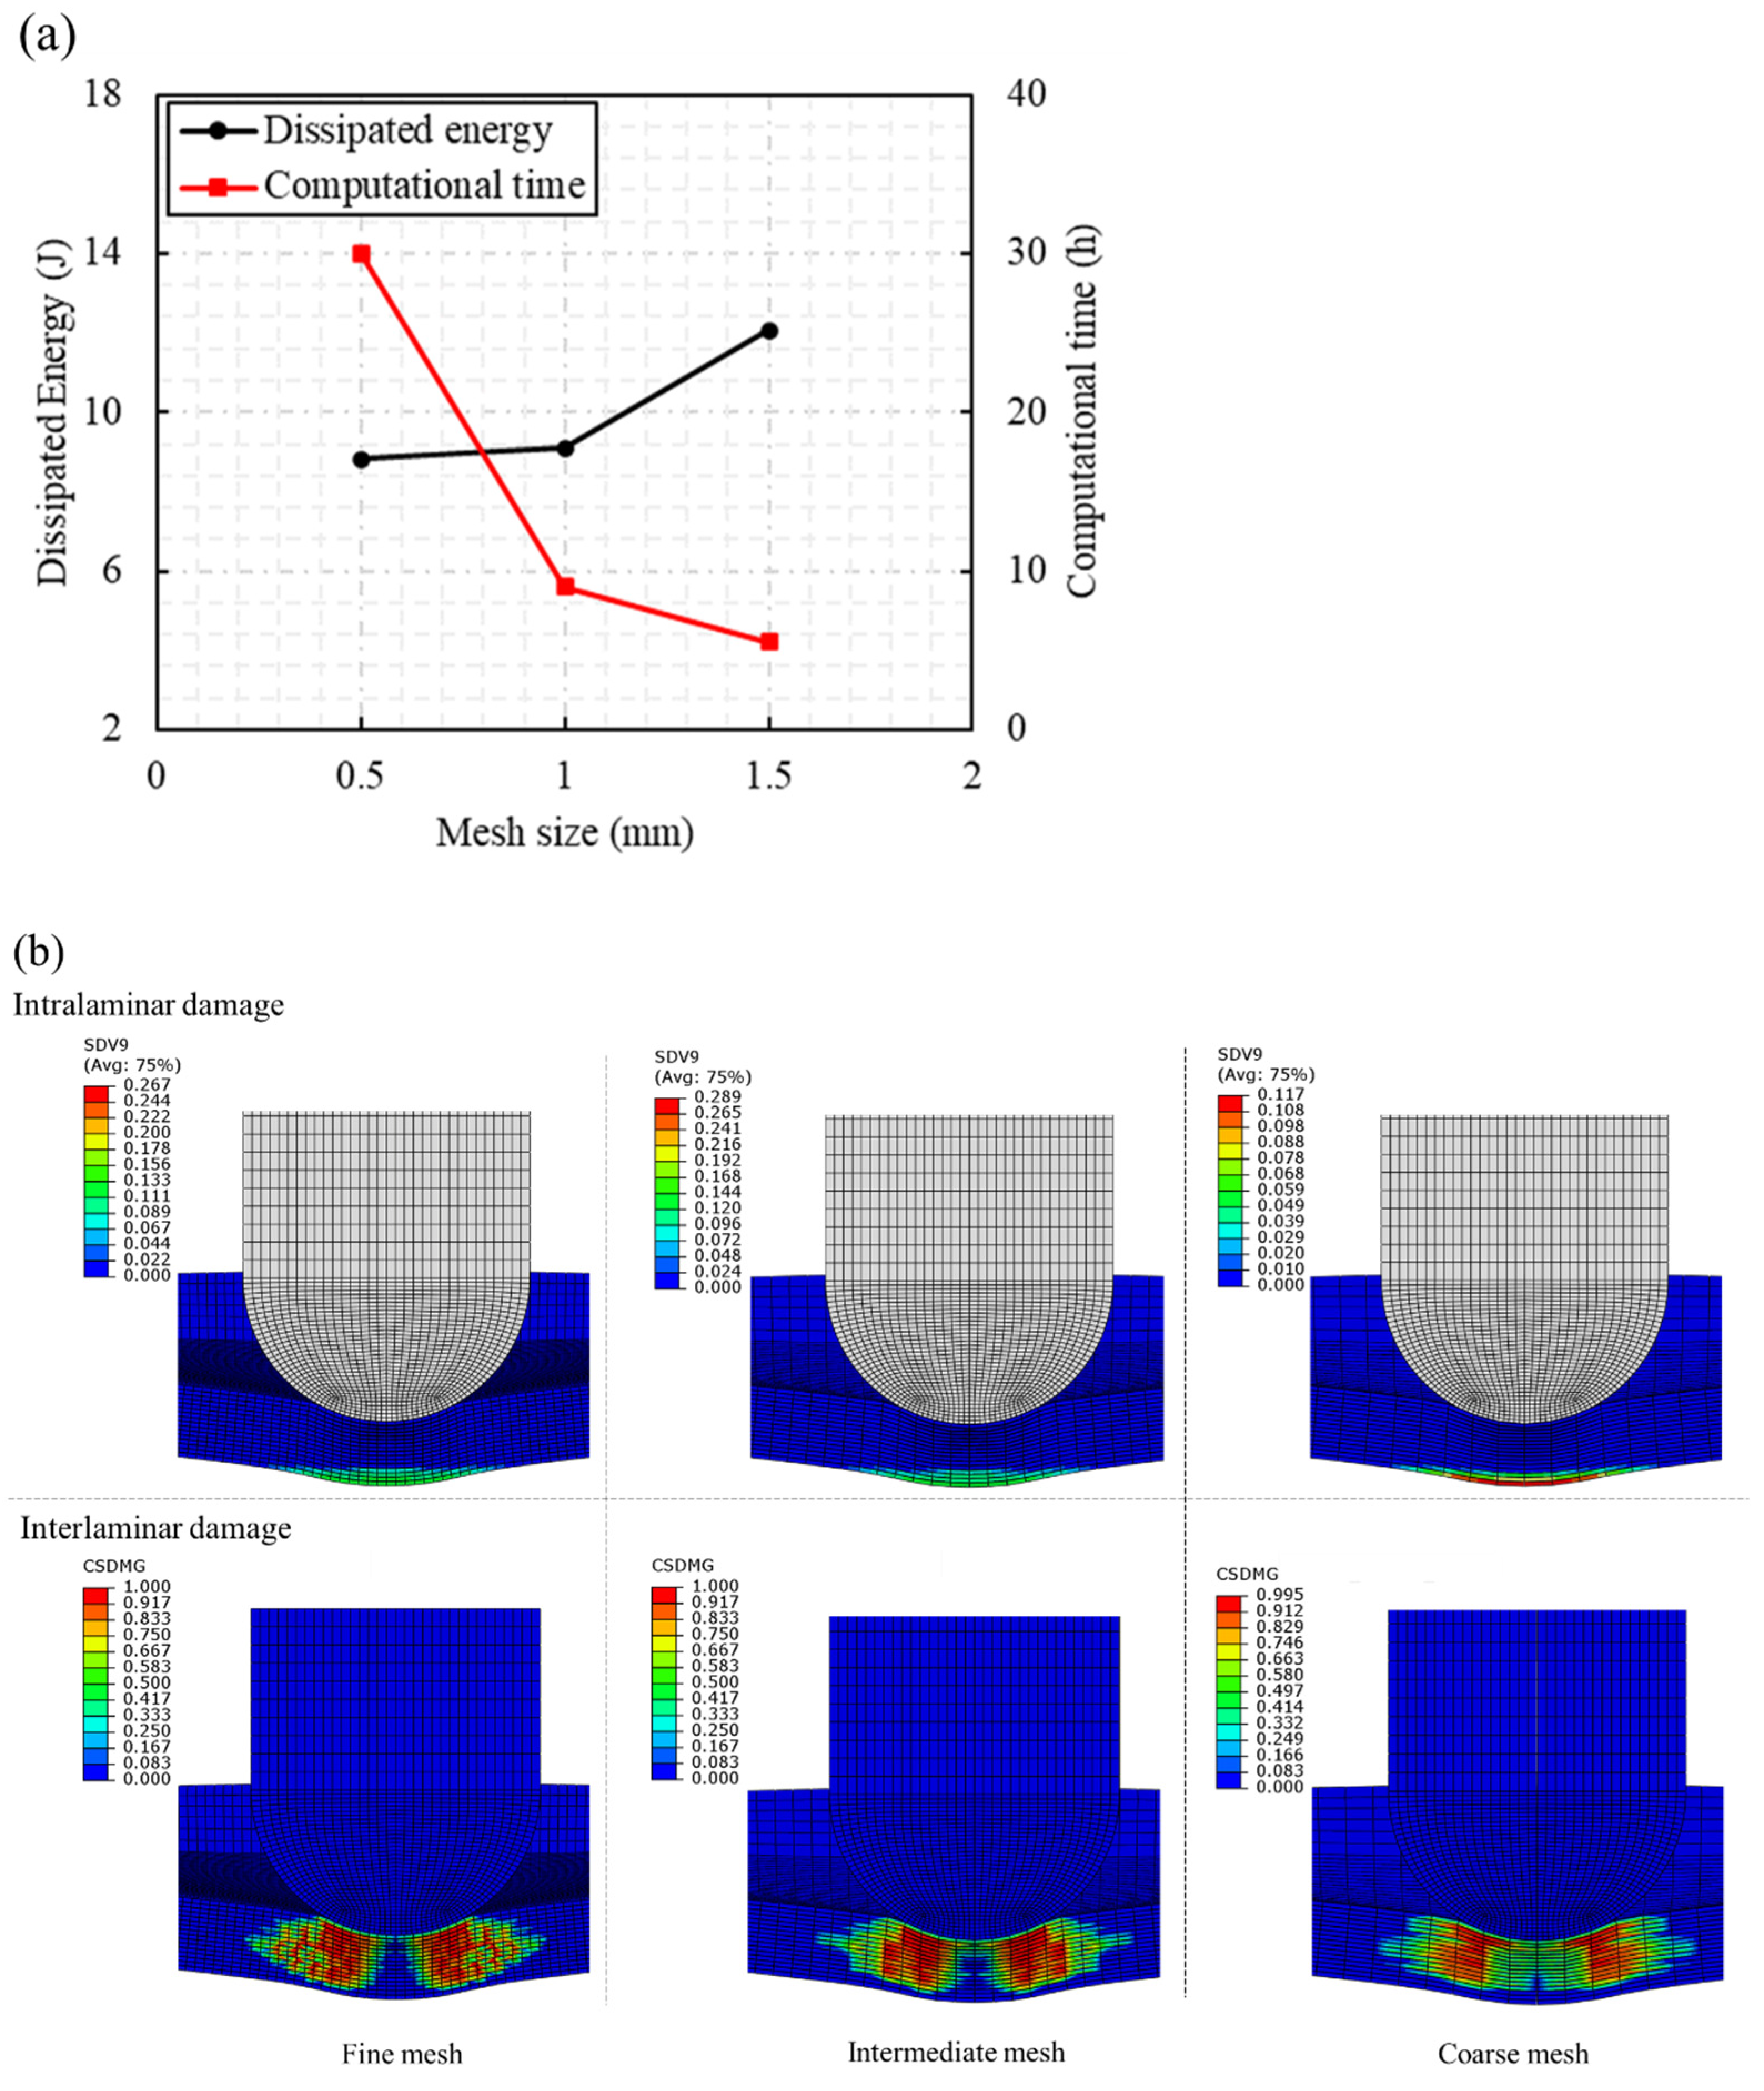
To see if the element size influences the results of the simulations, three different mesh sizes in the impactor/laminate contact region were chosen: 0.5 mm, 1 mm, and 1.5 mm (fine, intermediate, and coarse meshes, respectively). The simulation was performed at 27.8 J energy and general impact response and damage prediction were compared. Figure 12a shows that dissipated energy was overestimated by the simulation with coarse mesh, meanwhile the difference between the intermediate and fine mesh was less than 3%. As for the computational time, also shown in Figure 12a, a significant increase was obtained for the fine mesh. Therefore, to provide a balance between computational time and accuracy, the mesh size of 1 mm (intermediate mesh) was selected for the simulations. Figure 12b shows the intralaminar and interlaminar damage prediction for different models at t = 3.2 ms. Reducing the mesh size from intermediate to fine does not significantly alter the predictions, with both simulations displaying similar damage patterns. However, significant differences can be observed for the model with coarse mesh.
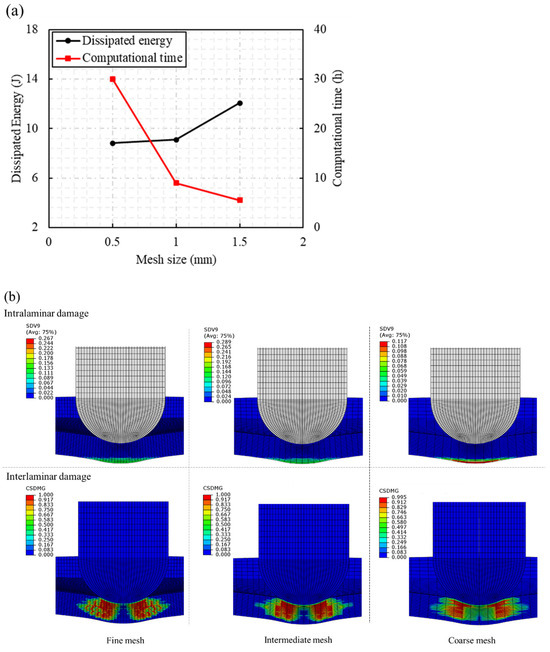
Figure 12.
Mesh sensitivity results for: (a) dissipated energy and computational time, and (b) interlaminar and interlaminar damage predictions.
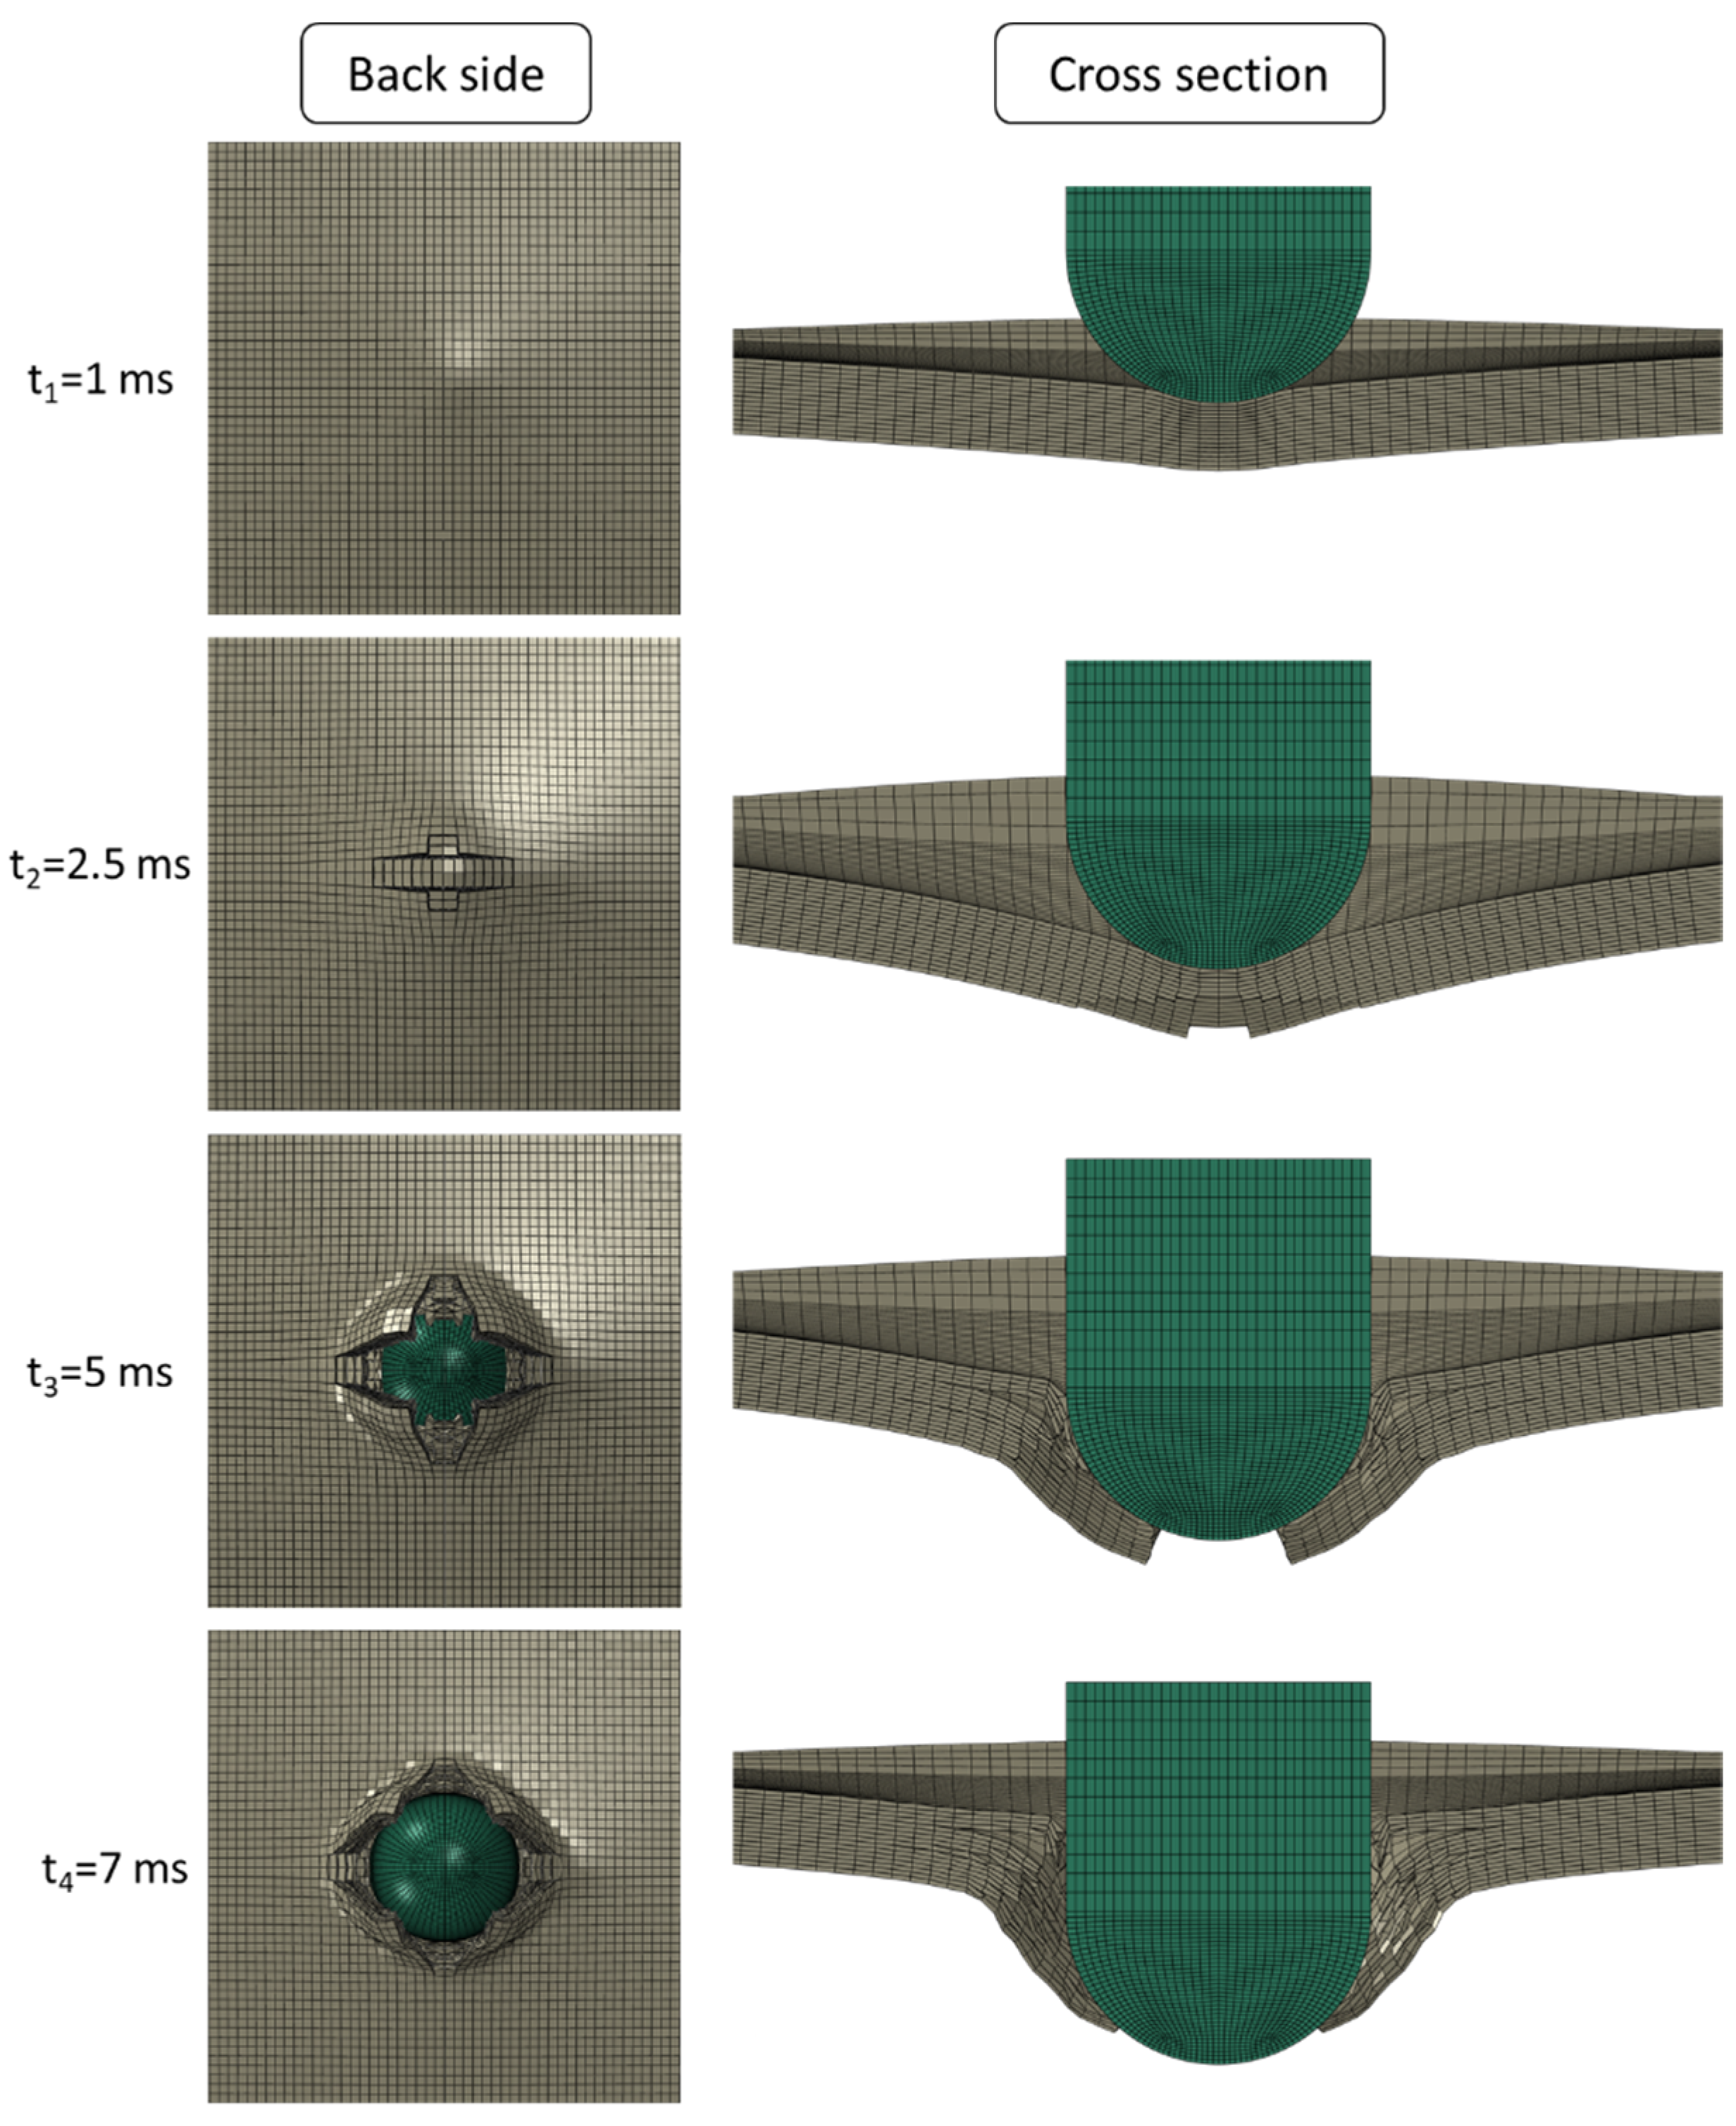
Backside and cross-section contour plots for the four timesteps illustrated in Figure 11a for the impact event at 109.7 J are presented in Figure 13. During the ascending part of the curve, at t1 = 1 ms, no fibre damage occurred. Damage and element deletion started at t2 = 1.9 ms, at the back surface, propagating in two in-plane directions resulting in a cross-damage pattern similar to the experimental observation, and causing a decrease in force response. This damage pattern can be seen in Figure 13 for t2 = 2.5 ms. During the perforation event, further propagation of in-plane damage was observed, and fibre breakage was observed in different plies towards the impact side that formed through-thickness damage in two material directions, shown in Figure 13 at 5 ms and 7 ms. The damage increased in severity, but the cross shape was maintained, and the impactor completely perforated the laminate due to fibre breakage through all the thickness plies.
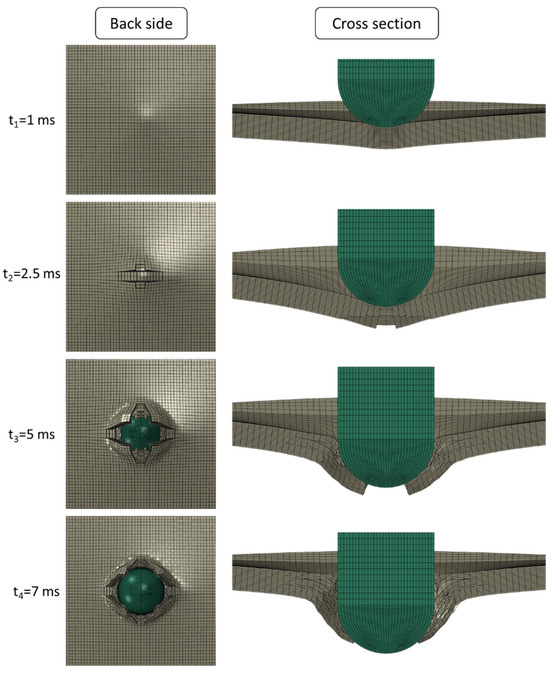
Figure 13.
Contour plots at different simulation times for the 109.7 J impact.
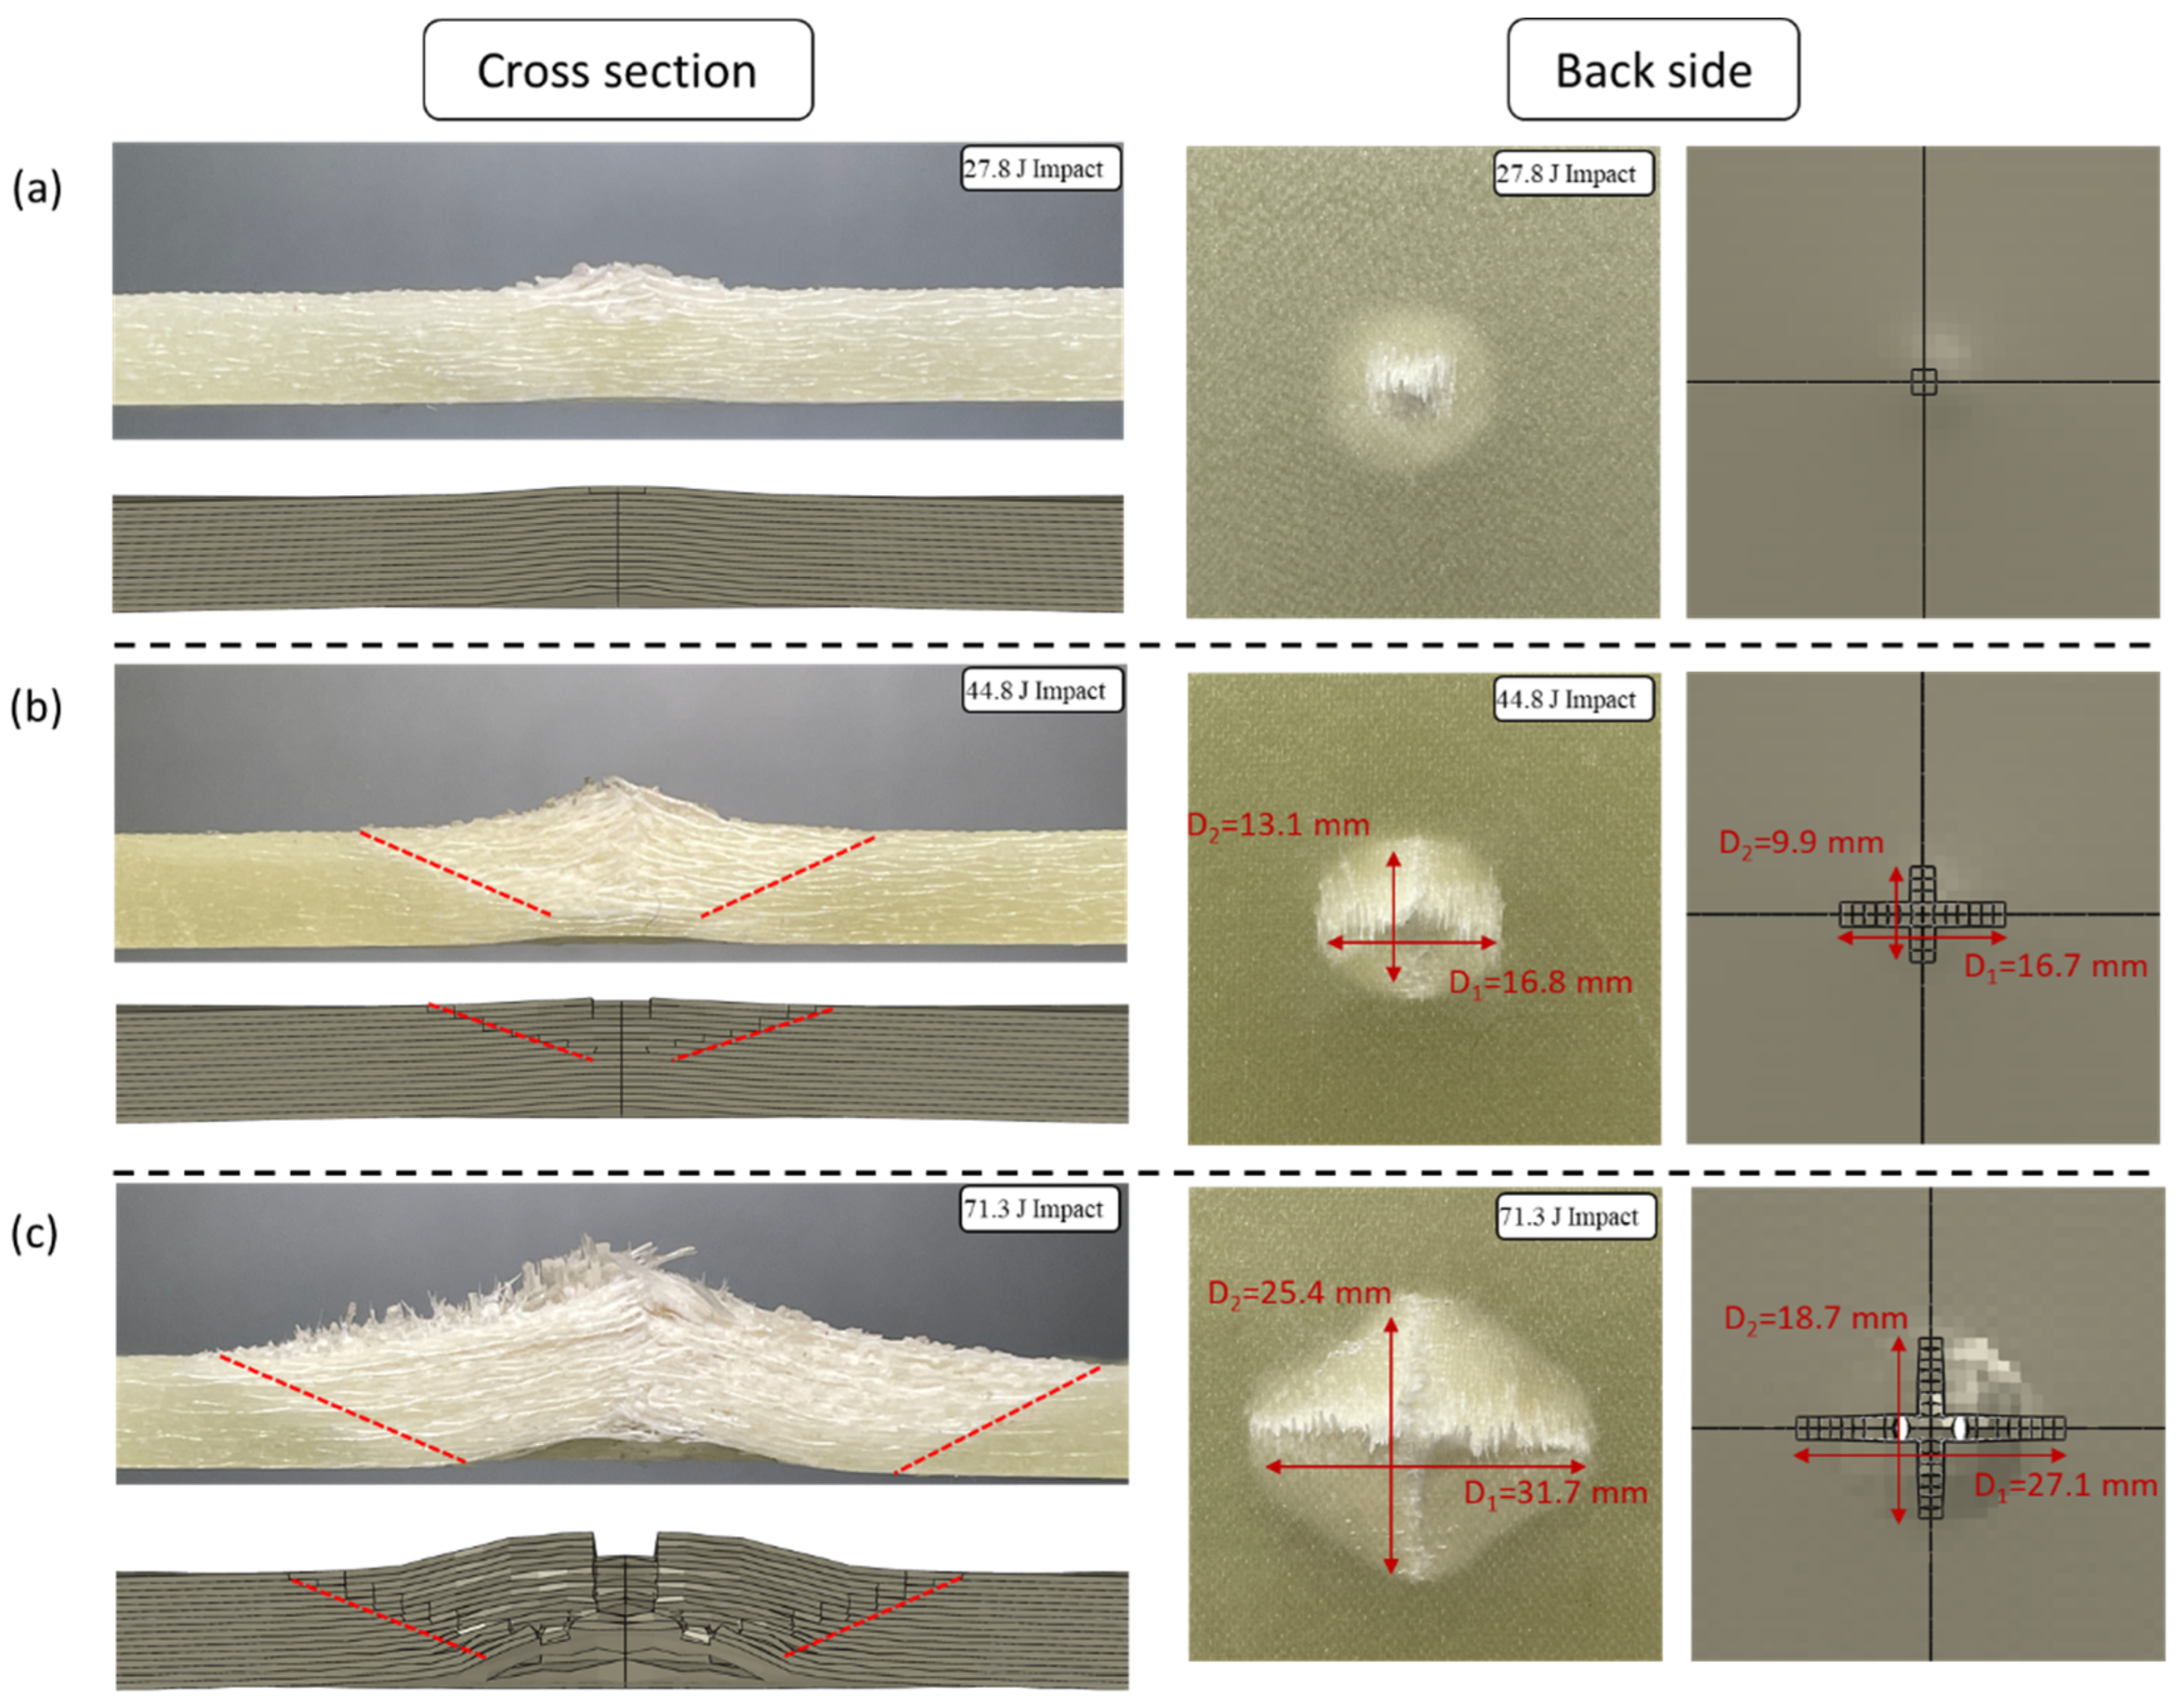
Figure 14a–c compares the damage morphology at the backside and cross-section of the specimens at different impact energies. To obtain the experimental cross-section failure photos presented in Figure 14, the samples were cut in half using water jet cutting technique. Again, the FE model was successful in quantitatively and morphologically estimating the damage mode at different energy levels. Due to the larger deformation of the back face in the models, the specimens showed the same failure pattern as observed in the experimental damage morphologies. That is, fibre failure started at the centre of the laminate (at the back surface) and propagated towards the boundaries following the two main material directions, leading to a cross failure pattern, like the experimental observation. The length of the fibre cracks are also shown in Figure 14, and a slight underprediction of in-plane crack length was observed. The estimated fibre breakage through the cracks, especially for the 71.3 J impact, was more extensive than the experimental observation. The V-shaped through-thickness fibre damage due to both fibre breakage and delamination was also accurately predicted by the model. This damage pattern, indicated by the red dashed lines in Figure 14, was observed at high energy levels, in which the fibre failure was dominant. The permanent deformation and the dent after impact can also be observed in Figure 14.
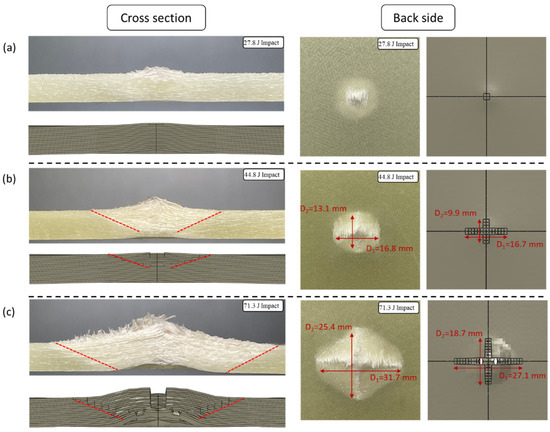
Figure 14.
Comparison of experimental and numerical damage morphology for impact energies of: (a) 27.8 J, (b) 44.8 J, (c) 71.3 J (the dashed red lines indicate the extent of damage through the thickness of the laminate).
The experimental and predicted total damaged area for different impacts correlated well. The model underpredicts the damaged area for the case of perforation as expected based on the differences in the experimental and numerical force-displacement curves shown in Figure 10 where the drop in the force happens sooner in the experiment. This delay in damage propagation in the numerical results leads to a greater energy absorption ratio and a smaller damaged area. Due to the wide energy range studied and the complex failure definition, with different damage mechanisms dominating energy absorption, a similar agreement in absorbed energies was not observed.
4. Discussion
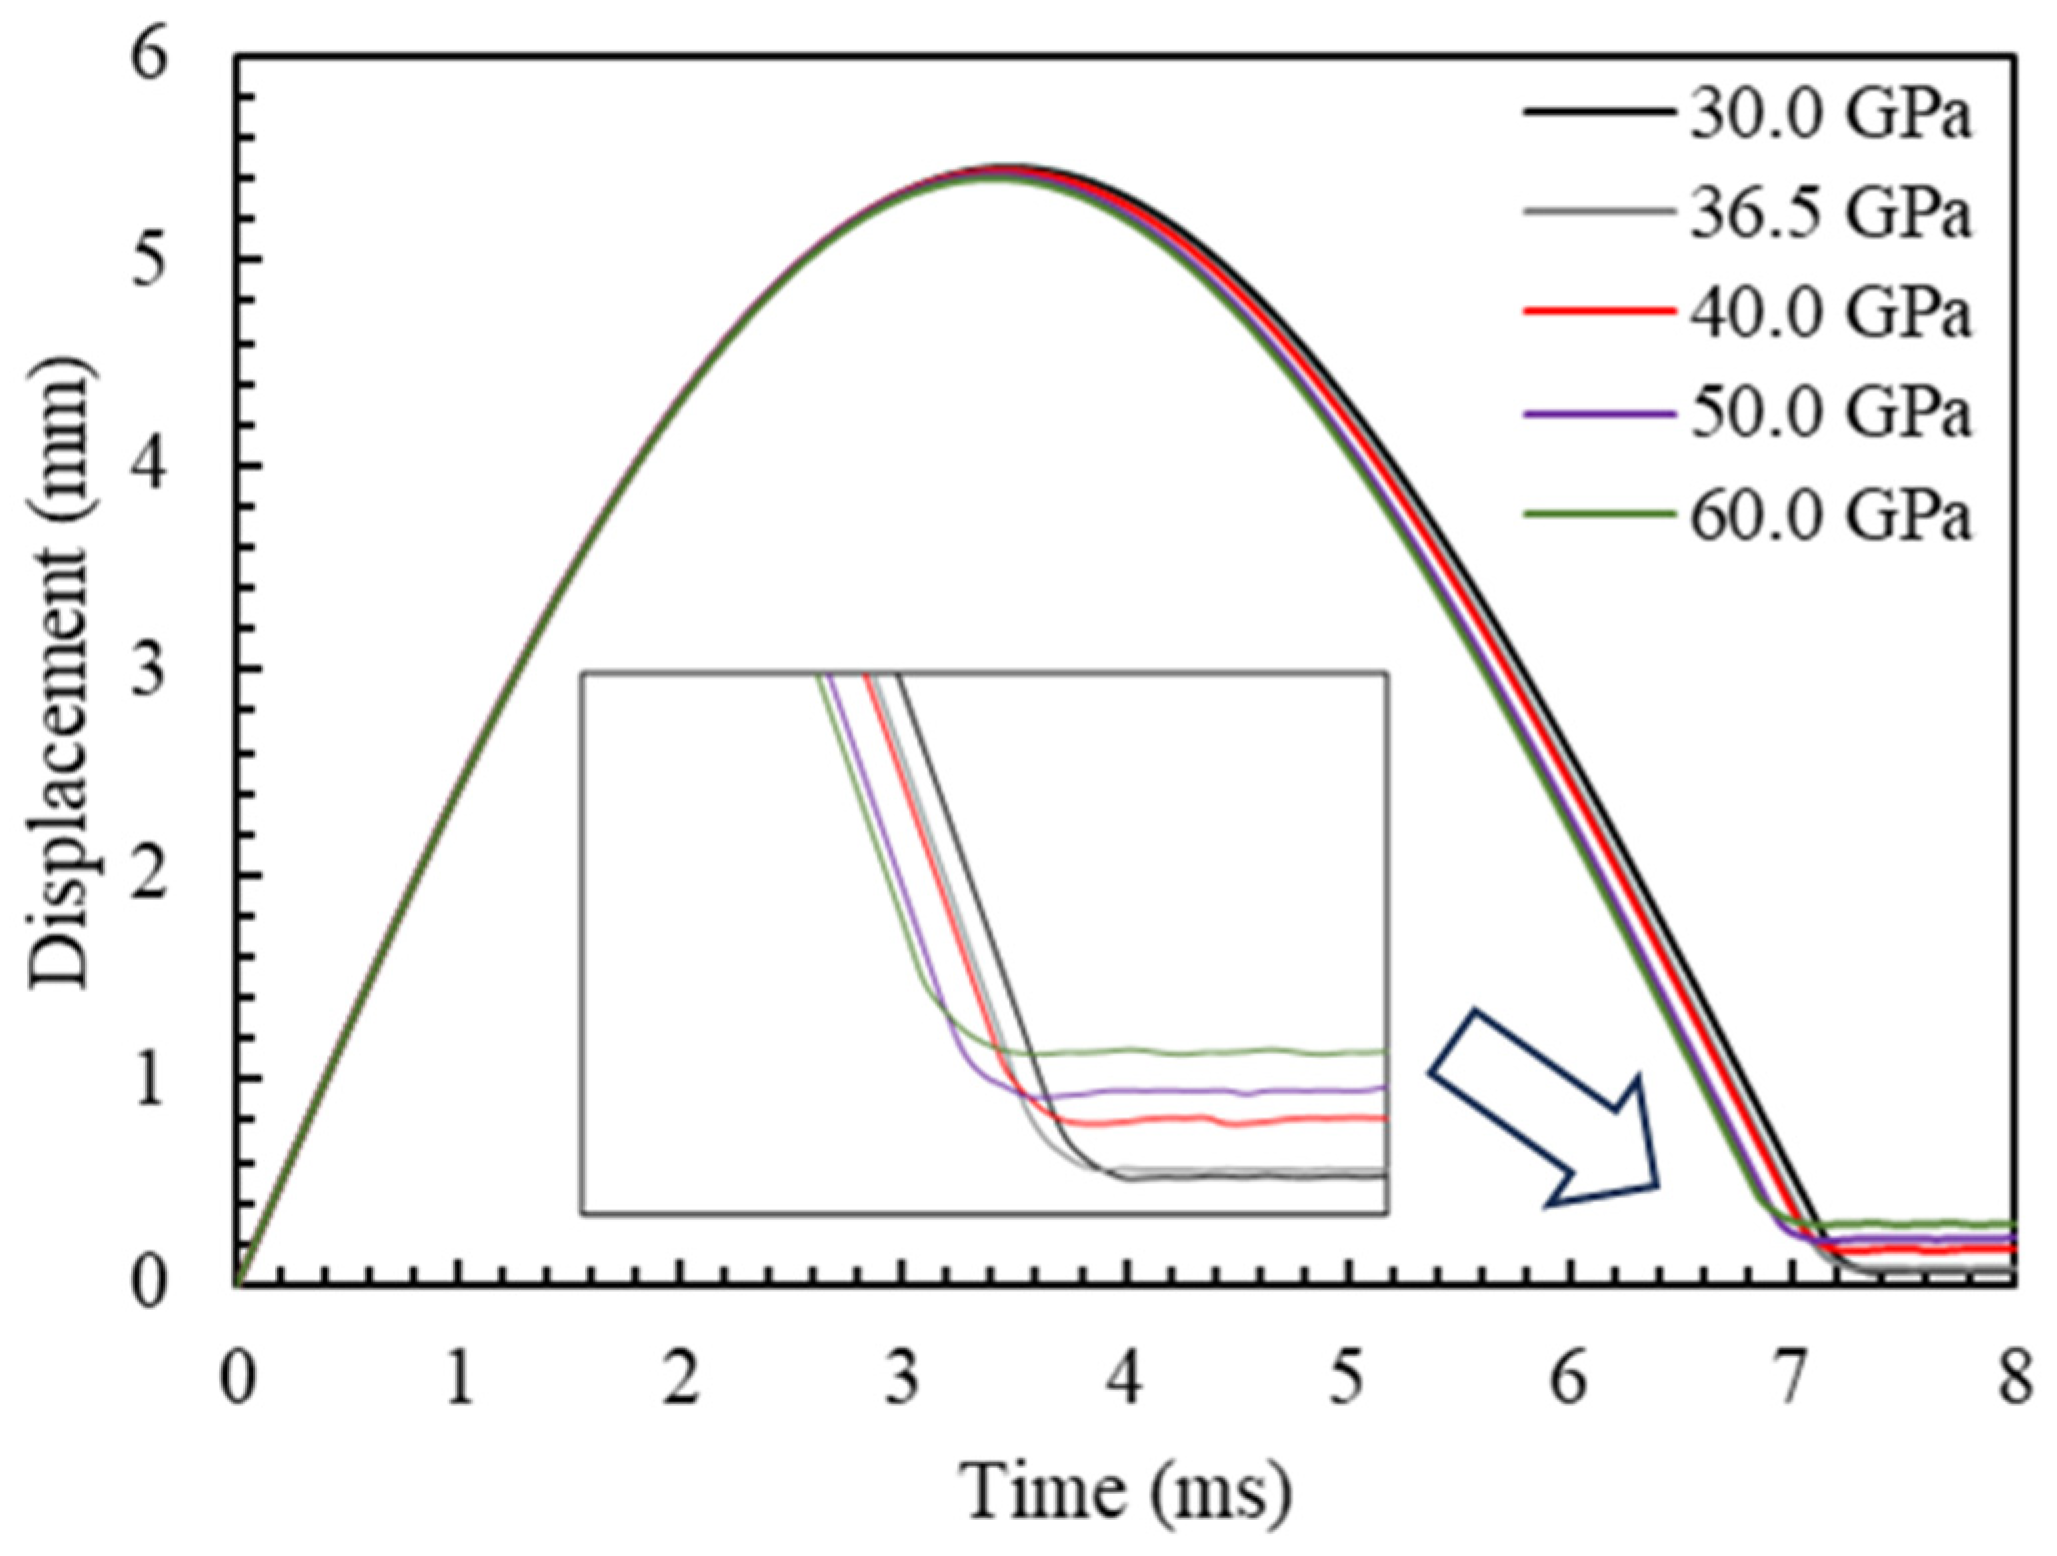
The numerical model can predict permanent indentation in the specimen after impact by considering the accumulation of inelastic strain due to the non-linear definition of the material constitutive law, as mentioned in Section 2.2.2. To further analyse permanent indentation and the effect of the inelastic strain accumulation, five FE models were developed with different initial stiffnesses (30.0, 36.5, 40.0, 50.0, and 60.0 GPa) for the unloading response after impact at 18.4 J.
Figure 15 shows the displacement-time history for the models with different initial stiffnesses. A trend was observed with the increase in initial stiffness, i.e., a decrease in impact time duration and an increase in permanent indentation of the specimen. Higher initial stiffness values promote the accumulation of the inelastic strain, affecting the rebounding of the impactor. Higher inelastic strains for higher initial stiffnesses mitigate the elastic energy release during rebounding, leading to an earlier loss of contact between the laminate and impactor and a deeper permanent indentation.
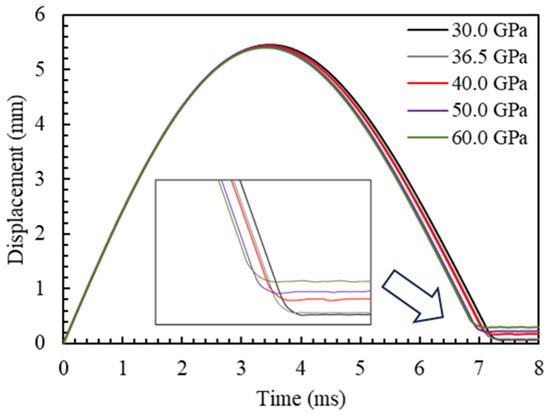
Figure 15.
Prediction of permanent indentation—Displacement-time curves for models with different initial stiffness, with a zoomed view of the curves.
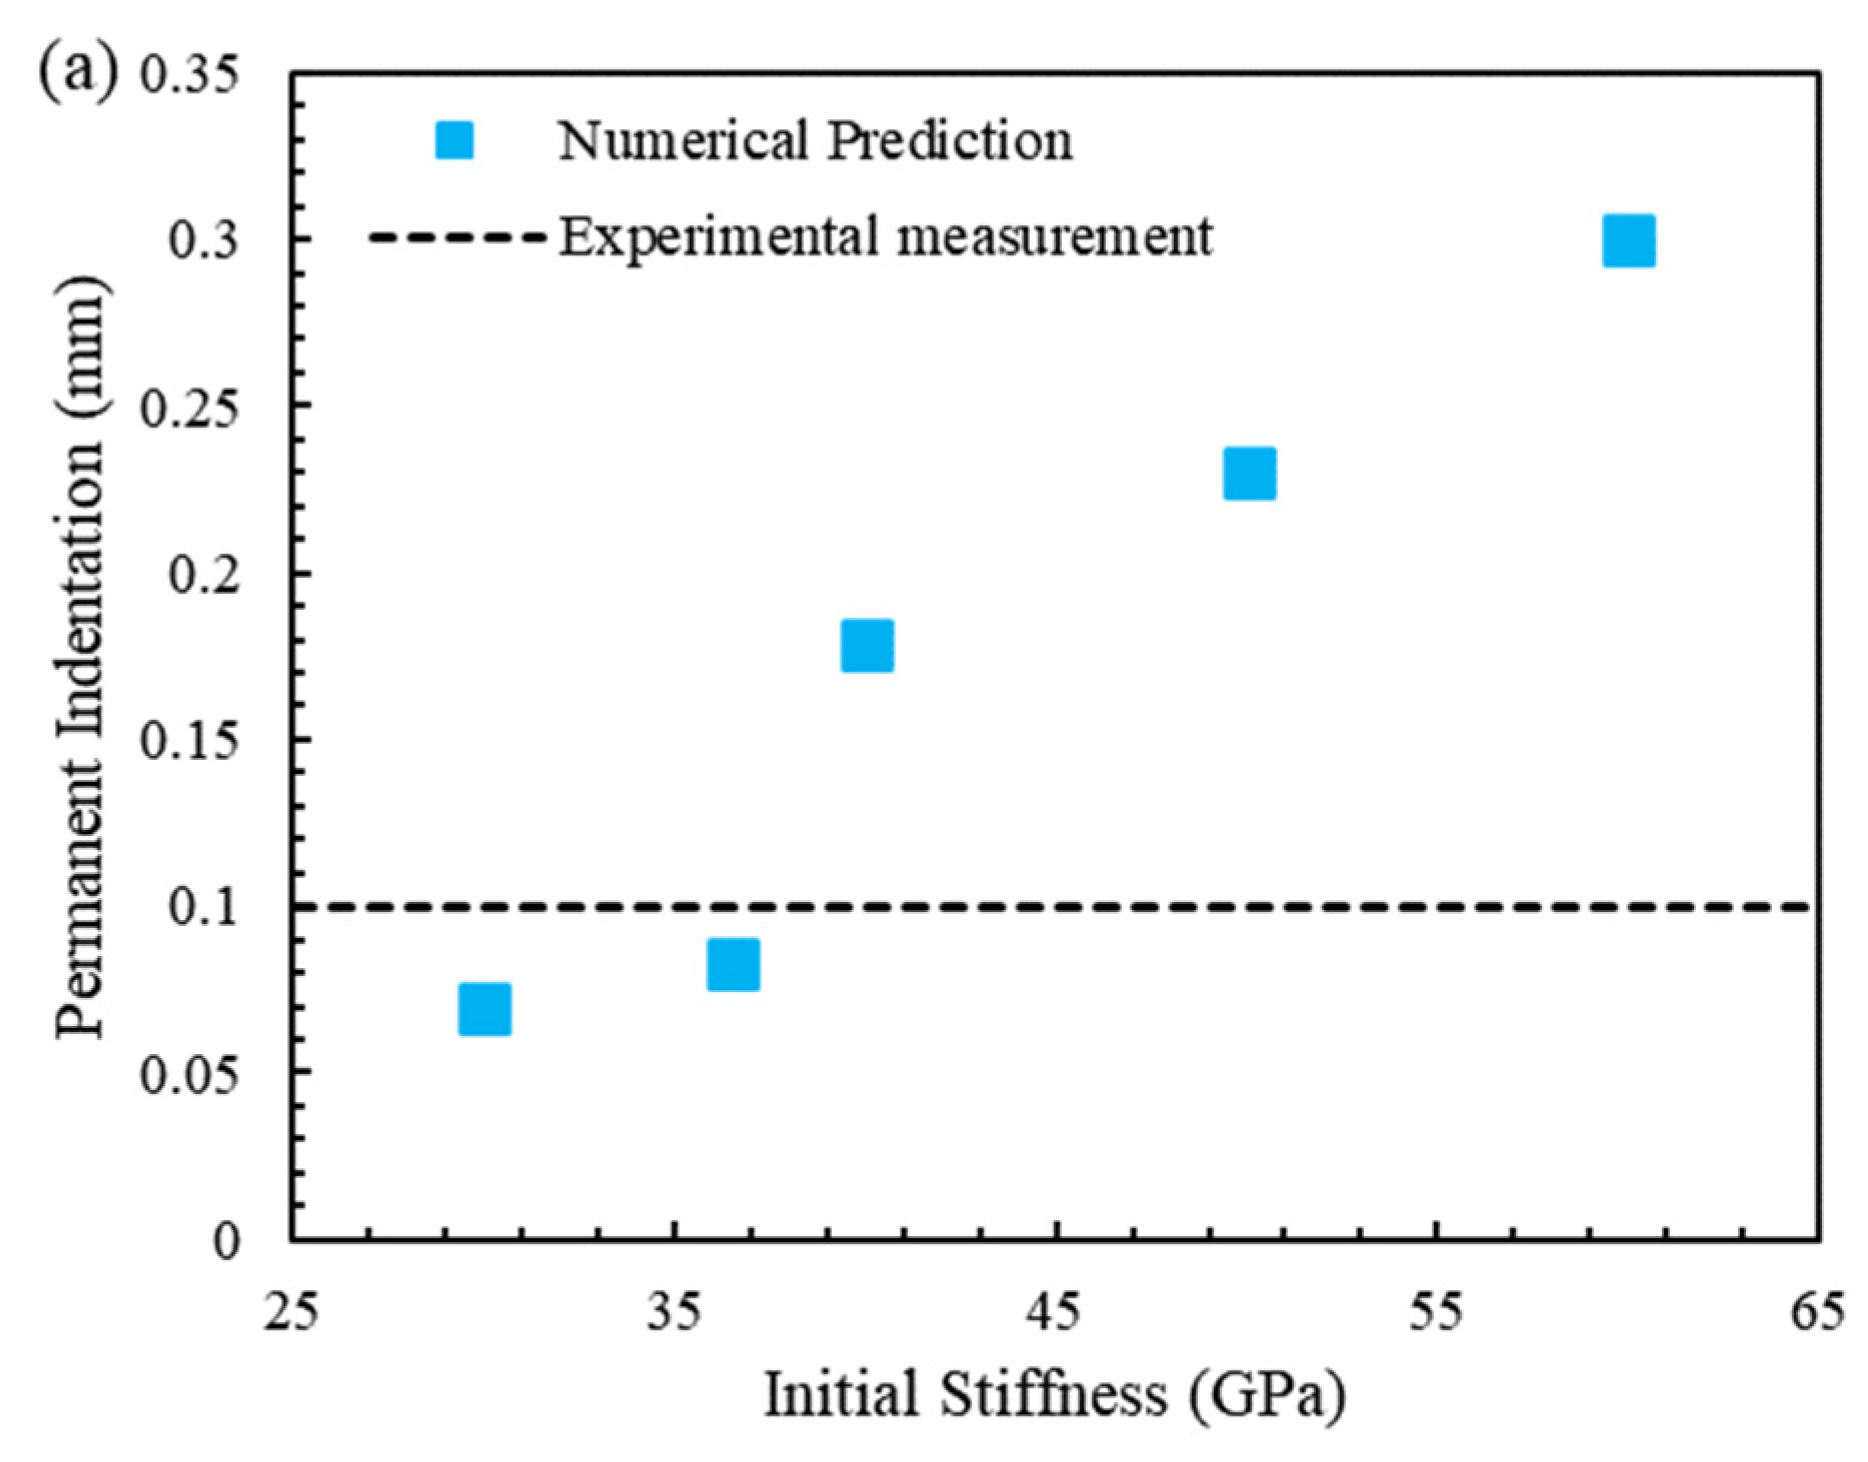
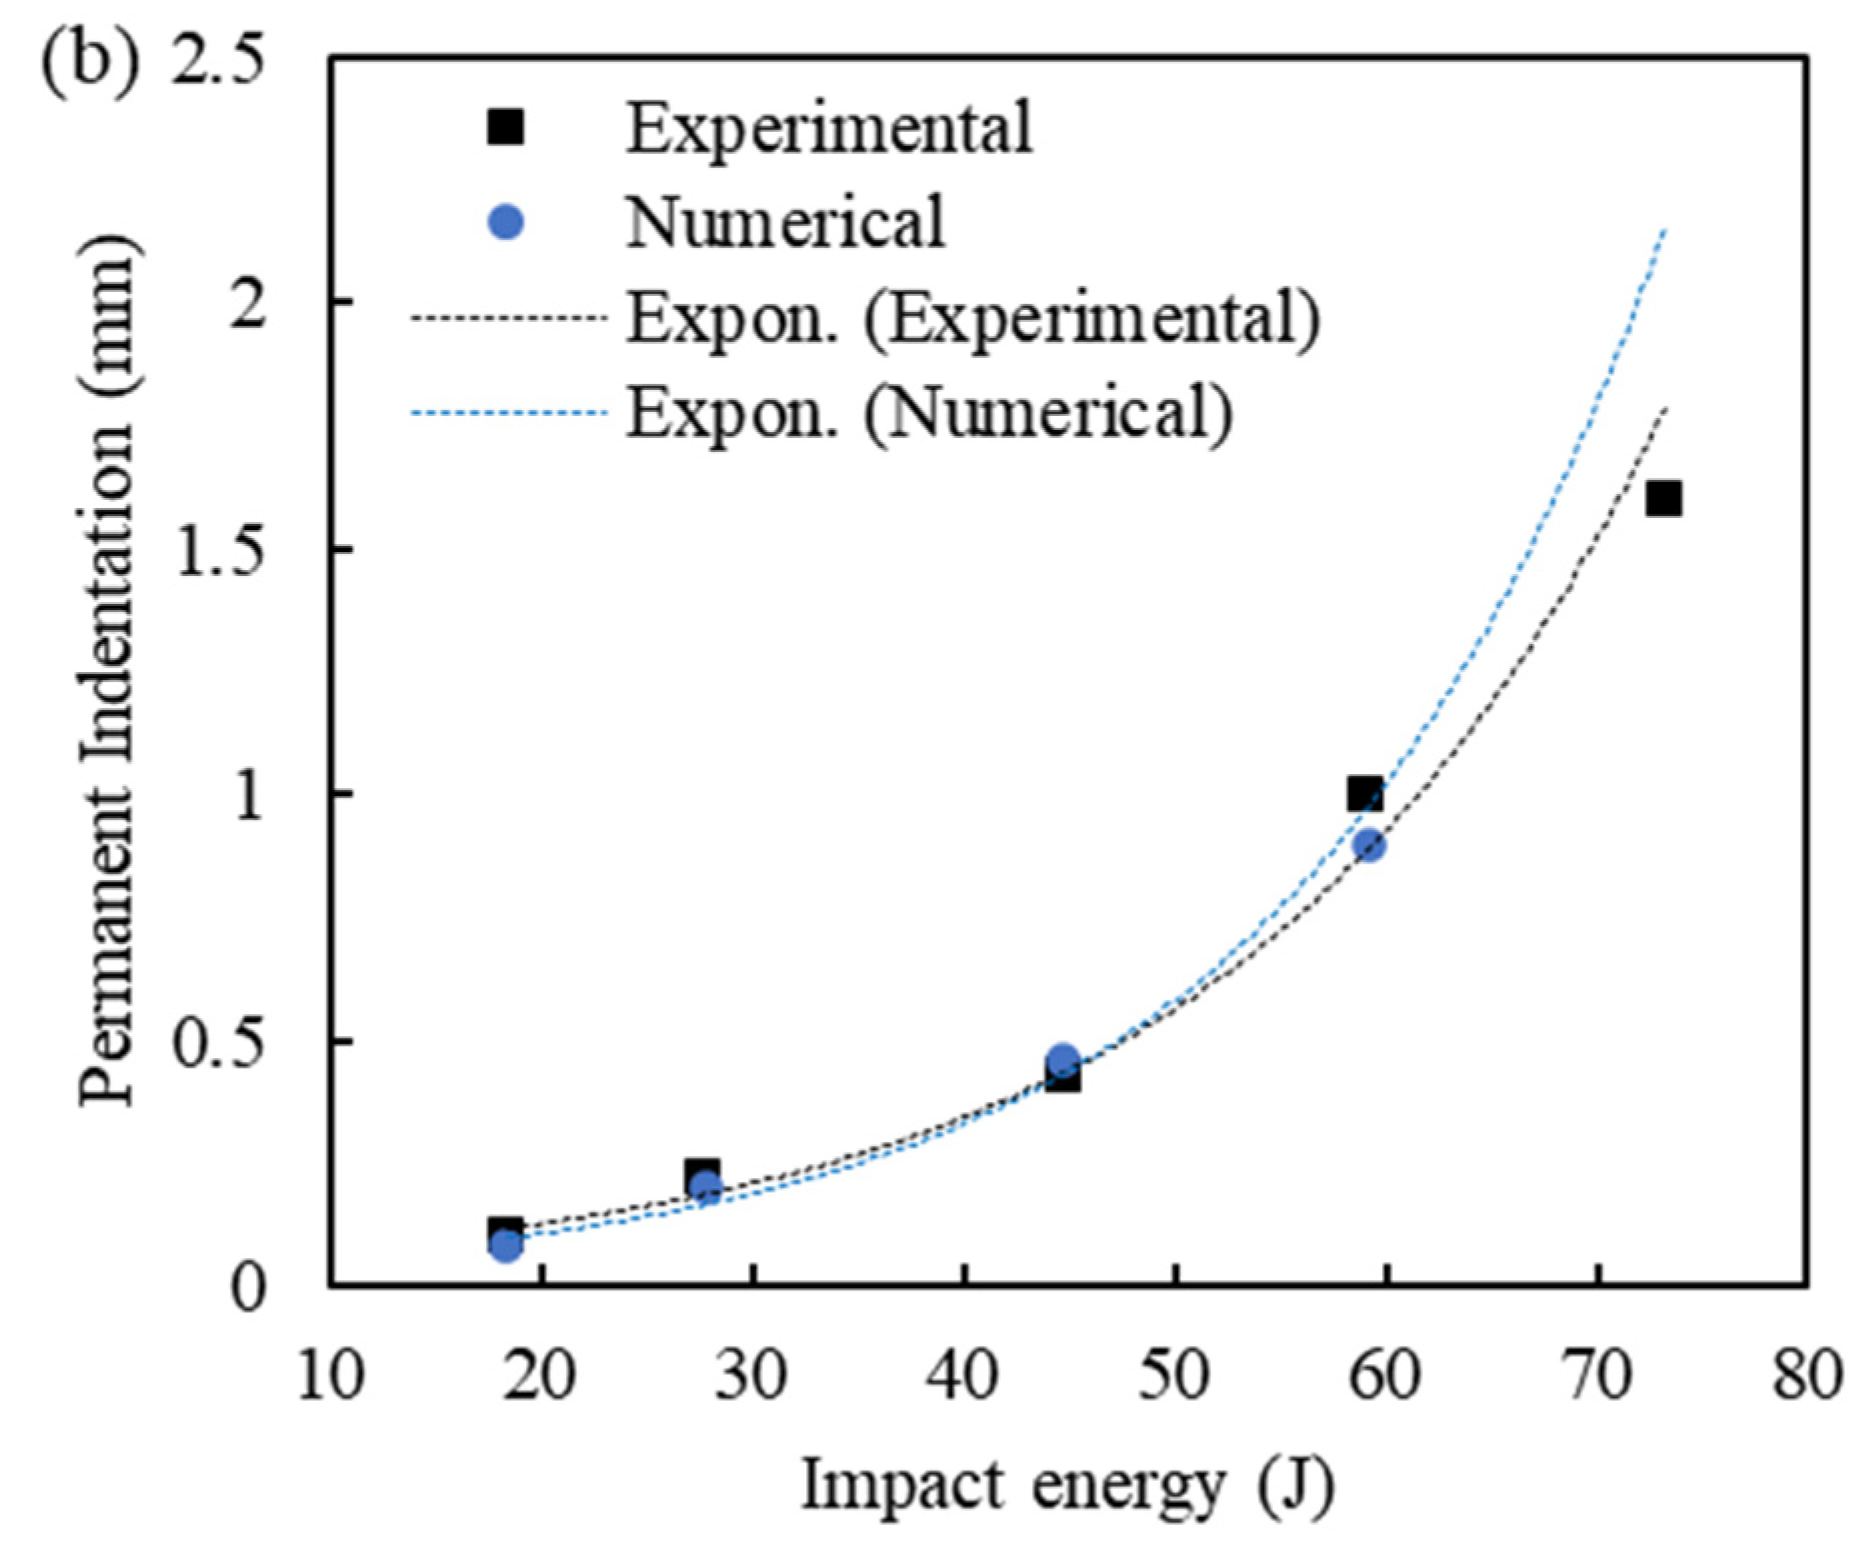
Figure 16a compares experimental permanent indentation and the predicted values from the models with different initial stiffnesses. Better agreement is achieved for an initial stiffness of 36.5 GPa, with a slight underprediction of 20%. The numerical and experimental permanent indentation results for different energies are presented in Figure 16b. The numerical data for 73.2 J was not reported due to the occurrence of through-thickness cracks, as shown in Figure 14c. An exponential increase in permanent indentation with impact energy was observed in both numerical and experimental results, and a generally good agreement is observed, especially at lower impact energies.


Figure 16.
(a) The effect of initial stiffness on permanent indentation (impact energy: 18.4 J), and (b) experimental and numerical permanent indentation data for different impact energies.
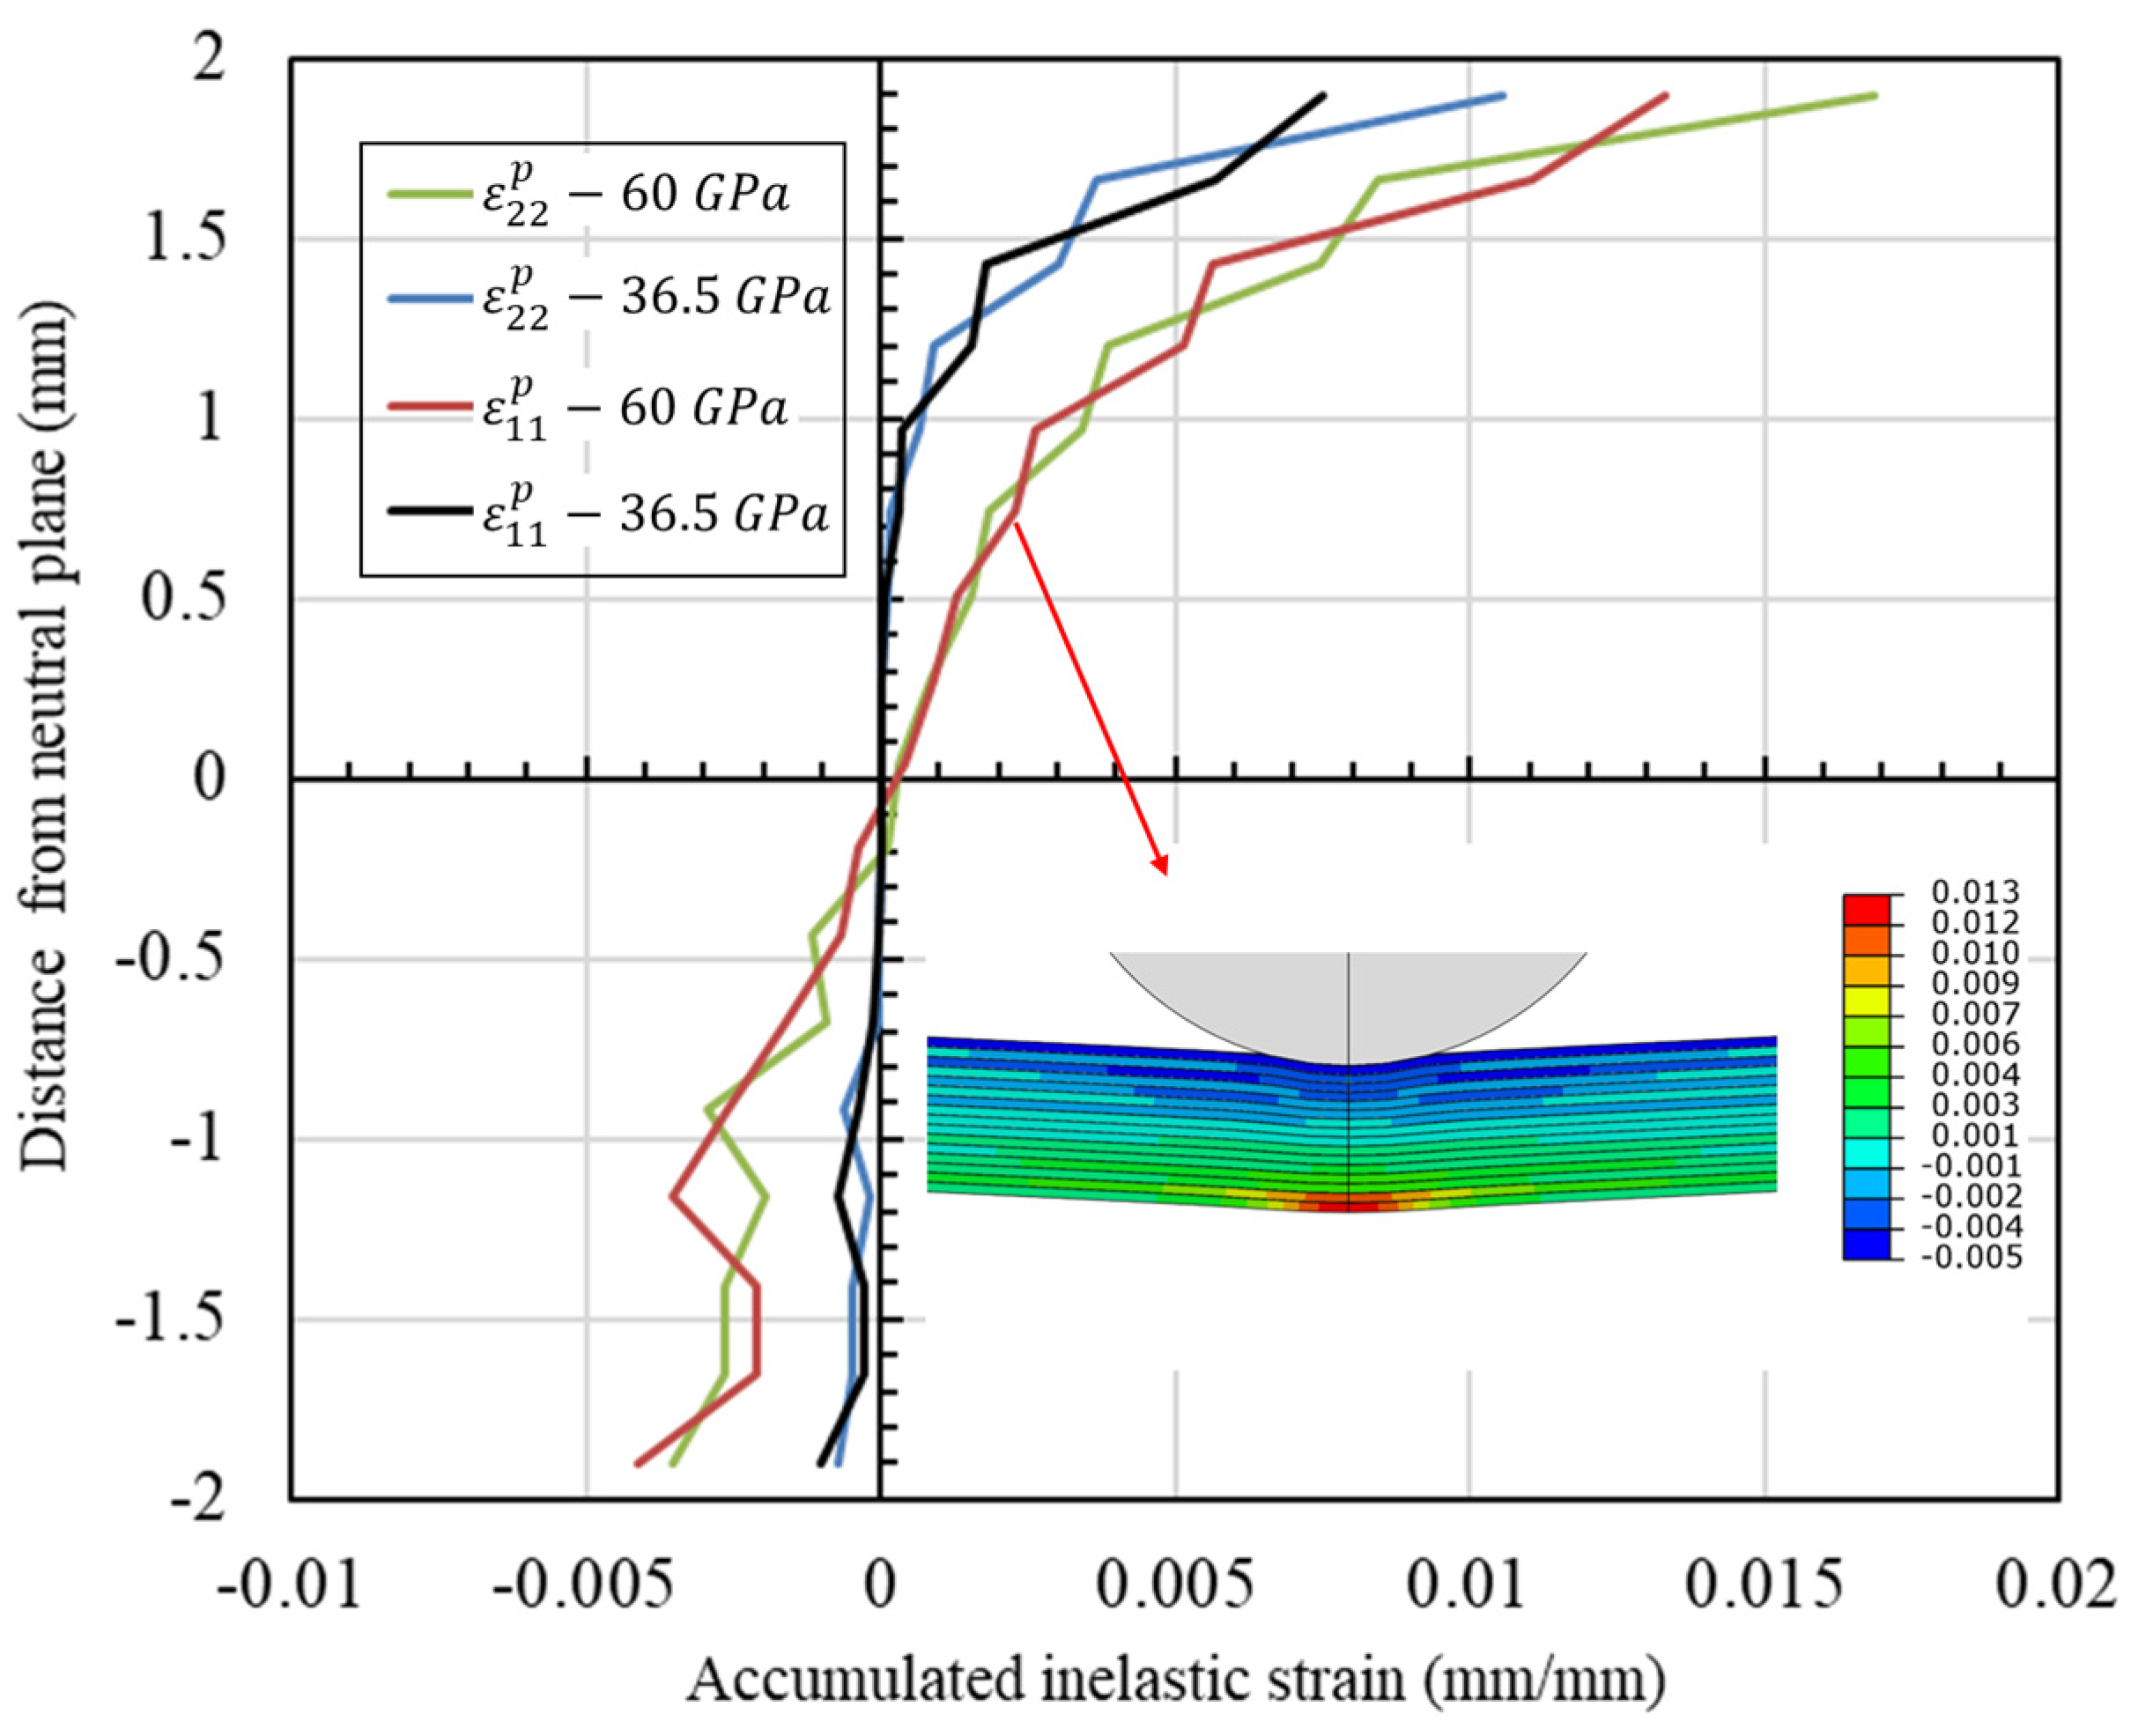
The accumulation of inelastic strain can effectively influence the post-impact behaviour of the composite [46] and should be considered in low-velocity simulations of composites. The effect of the initial stiffness on the accumulated inelastic strain distribution through thickness at the impact point, i.e., the centre of the specimen, is shown in Figure 17 at the onset of tensile damage initiation (t = 1.25 ms). The distribution is not symmetrical in relation to the neutral plane, and the accumulated inelastic strain is greater farther from the neutral plane, reaching a maximum at the outmost layer. The higher initial stiffness leads to an increase in accumulated inelastic strain for all layers through the thickness, which is consistent with the higher permanent indentation observed in Figure 16. The initial stiffness of the Ramberg–Osgood formulation was, therefore, able to predict permanent indentation for LVI with acceptable accuracy. It is worth mentioning that the focus was on the nonlinear material behaviour in normal directions and the capability of the Ramberg–Osgood formulation to capture permanent indentation while the literature usually focuses on the nonlinear shear behaviour [45,46]. Another factor that should be considered in the study of permanent indentation of LVI is the stacking sequence of the composite laminate and the presence of layers with ±45° orientation, especially in the case of woven composites, which require more investigation.
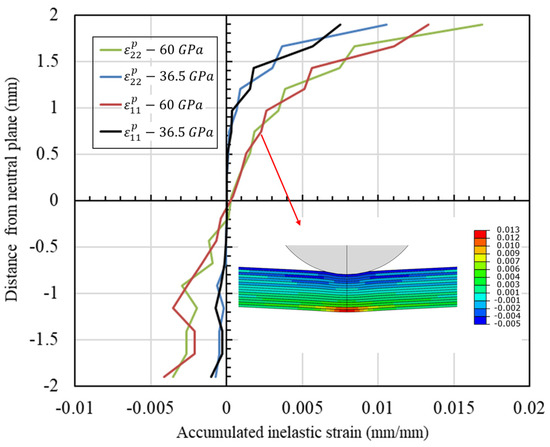
Figure 17.
Contour plots of permanent indentation for different initial modulus values.
5. Conclusions
In this paper, a study on the impact response of GFRP laminates was presented. A numerical model was developed, which incorporated several intralaminar and interlaminar failure modes for a more accurate damage prediction. The numerical model considered the accumulation of inelastic strain in both main material directions due to the nonlinear constitutive behavior of the composite. Permanent indentation due to impact and the effect of the model input parameters on the prediction of permanent indentation was investigated. The predictability of the numerical model was investigated by comparing it with experimental data at a wide energy range (18.4–109.7 J).
The numerical model showed accuracy in estimating the mechanical response and intra- and inter-laminar damage accumulation of the laminates for impacts at different energies, including perforation cases. The numerical model yielded a good prediction of the dominant failure modes at different impact energies, resulting in an accurate prediction of fluctuations in the force-displacement curves during the initiation and propagation damage stages. Within the numerical framework, yarn debonding, permanent deformation and delamination were identified as the major energy absorption features at lower energies, while fiber failure and delamination were dominant at higher energies. The initial stiffness of the Ramberg-Osgood model was used to consider inelastic strain accumulation and led to the accurate prediction of permanent indentation for low-velocity impact. This methodology can be practical in simulation of compression after impact of composite laminate in which the permanent indentation plays an important role. The extent of the influence of the permanent indentation of the simulation of compression after impact can be investigated by using the current simulation methodology.
Author Contributions
Conceptualization, M.R. and A.M.; methodology, M.R., Y.K. and A.A.X.d.S.; software, M.R.; validation, M.R.; investigation, M.R., Y.K. and A.A.X.d.S.; resources, S.C.A., J.D.H. and A.M.; writing—original draft preparation, M.R.; writing—review and editing, Y.K., A.A.X.d.S., S.C.A., J.D.H. and A.M.; visualization, M.R.; supervision, S.C.A., J.D.H. and A.M.; project administration, A.M.; funding acquisition, J.D.H. and A.M. All authors have read and agreed to the published version of the manuscript.
Funding
This research received no external funding.
Data Availability Statement
The data presented in this study are available on request from the corresponding author.
Conflicts of Interest
The authors declare no conflicts of interest.
References
- Sun, X.C.; Hallett, S.R. Barely Visible Impact Damage in Scaled Composite Laminates: Experiments and Numerical Simulations. Int. J. Impact Eng. 2017, 109, 178–195. [Google Scholar] [CrossRef]
- Polimeno, U.; Meo, M. Detecting Barely Visible Impact Damage Detection on Aircraft Composites Structures. Compos. Struct. 2009, 91, 398–402. [Google Scholar] [CrossRef]
- Wu, Z.; Zhang, L.; Ying, Z.; Ke, J.; Hu, X. Low-Velocity Impact Performance of Hybrid 3D Carbon/Glass Woven Orthogonal Composite: Experiment and Simulation. Compos. B Eng. 2020, 196, 108098. [Google Scholar] [CrossRef]
- Shah, S.Z.H.; Karuppanan, S.; Megat-Yusoff, P.S.M.; Sajid, Z. Impact Resistance and Damage Tolerance of Fiber Reinforced Composites: A Review. Compos. Struct. 2019, 217, 100–121. [Google Scholar] [CrossRef]
- de Moura, M.F.S.F.; Marques, A.T. Prediction of low velocity impact damage in carbon–epoxy laminates. Compos. Part A: Appl. Sci. Manuf. 2002, 33, 361–368. [Google Scholar] [CrossRef]
- Rezasefat, M.; Ma, D.; da Silva, A.A.X.; Colombo, C.; Amico, S.C.; Giglio, M.; Manes, A. Multi-Criteria Decision-Making Analysis and Numerical Simulation of the Low-Velocity Impact Response of Inter-Ply S2-Glass/Aramid Woven Fabric Hybrid Laminates. Compos. Struct. 2023, 312, 116867. [Google Scholar] [CrossRef]
- Cao, W.; Zhang, J.; Sun, B.; Gu, B. X-ray Tomography and Numerical Study on Low-Velocity Impact Damages of Three-Dimensional Angle-Interlock Woven Composites. Compos. Struct. 2019, 230, 111525. [Google Scholar] [CrossRef]
- Boukar, A.; Corn, S.; Slangen, P.R.L.; Ienny, P. Finite Element Modelling of Low Velocity Impact Test Applied to Biaxial Glass Fiber Reinforced Laminate Composites. Int. J. Impact Eng. 2022, 165, 104218. [Google Scholar] [CrossRef]
- Hinton, M.J.; Kaddour, A.S.; Soden, P.D. Failure Criteria in Fibre Reinforced Polymer Composites: The World-Wide Failure Exercise; Elsevier: Amsterdam, The Netherlands, 2004; ISBN 0080426999. [Google Scholar]
- Sjoblom, P.O.; Hartness, J.T.; Cordell, T.M. On Low-Velocity Impact Testing of Composite Materials. J. Compos. Mater. 1988, 22, 30–52. [Google Scholar] [CrossRef]
- Naik, N.K.; Chandra Sekher, Y.; Meduri, S. Damage in Woven-Fabric Composites Subjected to Low-Velocity Impact. Compos. Sci. Technol. 2000, 60, 731–744. [Google Scholar] [CrossRef]
- Tita, V.; de Carvalho, J.; Vandepitte, D. Failure Analysis of Low Velocity Impact on Thin Composite Laminates: Experimental and Numerical Approaches. Compos. Struct. 2008, 83, 413–428. [Google Scholar] [CrossRef]
- Schoeppner, G.A.; Abrate, S. Delamination Threshold Loads for Low Velocity Impact on Composite Laminates. Compos. Part A Appl. Sci. Manuf. 2000, 31, 903–915. [Google Scholar] [CrossRef]
- Baucom, J.N.; Zikry, M.A. Low-Velocity Impact Damage Progression in Woven E-Glass Composite Systems. Compos. Part A Appl. Sci. Manuf. 2005, 36, 658–664. [Google Scholar] [CrossRef]
- Aslan, Z.; Karakuzu, R.; Okutan, B. The Response of Laminated Composite Plates under Low-Velocity Impact Loading. Compos. Struct. 2003, 59, 119–127. [Google Scholar] [CrossRef]
- Richardson, M.O.W.; Wisheart, M.J. Review of Low-Velocity Impact Properties of Composite Materials. Compos. Part A Appl. Sci. Manuf. 1996, 27, 1123–1131. [Google Scholar] [CrossRef]
- De Moura, M.F.S.F.; Gonçalves, J.P.M. Modelling the Interaction between Matrix Cracking and Delamination in Carbon–Epoxy Laminates under Low Velocity Impact. Compos. Sci. Technol. 2004, 64, 1021–1027. [Google Scholar] [CrossRef]
- Hou, J.P.; Petrinic, N.; Ruiz, C. A Delamination Criterion for Laminated Composites under Low-Velocity Impact. Compos. Sci. Technol. 2001, 61, 2069–2074. [Google Scholar] [CrossRef]
- Hinton, M.J.; Kaddour, A.S.; Soden, P.D. Failure Criteria in Fibre-Reinforced-Polymer Composites; Elsevier: Amsterdam, The Netherlands, 2004; pp. 1–1255. [Google Scholar] [CrossRef]
- Chen, P.; Shen, Z.; Xiong, J.; Yang, S.; Fu, S.; Ye, L. Failure Mechanisms of Laminated Composites Subjected to Static Indentation. Compos. Struct. 2006, 75, 489–495. [Google Scholar] [CrossRef]
- Zhou, J.; Wen, P.; Wang, S. Finite element analysis of a modified progressive damage model for composite laminates under low-velocity impact. Compos. Struct. 2019, 225, 111113. [Google Scholar] [CrossRef]
- Militello, C.; Epasto, G.; Bongiorno, F.; Zuccarello, B. First Lamina Hybridization of High Performance CFRP with Kevlar Fibers: Effect on Impact Behavior and Nondestructive Evaluation. Mech. Adv. Mater. Struct. 2022, 30, 1207–1222. [Google Scholar] [CrossRef]
- Teng, X.; Xu, Y.; Hui, X.; Zhang, W.; Dai, H.; Liu, W.; Ma, C.; Li, Y. Experimental Study on the Low-Velocity Impact and Post-Impact Flexural Properties of Curved CFRP Laminates Reinforced by Pre-Hole Z-Pinning (PHZ) Technique. Mech. Adv. Mater. Struct. 2022, 30, 3479–3490. [Google Scholar] [CrossRef]
- Kannivel, S.; Subramanian, H.; Arumugam, V.; Dhakal, H.N. Low-Velocity Impact Induced Damage Evaluation and Its Influence on the Residual Flexural Behavior of Glass/Epoxy Laminates Hybridized with Glass Fillers. J. Compos. Sci. 2020, 4, 99. [Google Scholar] [CrossRef]
- Grasso, M.; Xu, Y. Threshold Identification and Damage Characterization of Woven GF/CF Composites under Low-Velocity Impact. J. Compos. Sci. 2022, 6, 305. [Google Scholar] [CrossRef]
- Maier, R.; Mandoc, A.C. Investigation on Layer Hybridization of Glass/Carbon Fibre Woven Reinforced Composites Subjected to Low-Speed Impact. J. Compos. Sci. 2023, 7, 83. [Google Scholar] [CrossRef]
- Rezasefat, M.; da Silva, A.A.X.; Amico, S.C.; Giglio, M.; Manes, A. Repeated Impact Behaviour of Inter-Ply Hybrid Aramid/S2-Glass Epoxy Laminates. Thin-Walled Struct. 2023, 186, 110680. [Google Scholar] [CrossRef]
- Minak, G.; Ghelli, D. Influence of Diameter and Boundary Conditions on Low Velocity Impact Response of CFRP Circular Laminated Plates. Compos. B Eng. 2008, 39, 962–972. [Google Scholar] [CrossRef]
- Sadighi, M.; Alderliesten, R. Impact Fatigue, Multiple and Repeated Low-Velocity Impacts on FRP Composites: A Review. Compos. Struct. 2022, 297, 115962. [Google Scholar] [CrossRef]
- Li, Z.; Ameri, A.A.H.; Hazell, P.J.; Khennane, A.; Escobedo-Diaz, J.P.; Aryal, B.; Wang, H. Effects of Impactor Mass on the Low-Velocity Impact Behaviour of Thick GFRP Pultruded Laminates. Constr. Build. Mater. 2021, 279, 122491. [Google Scholar] [CrossRef]
- Cao, H.; Ma, M.; Jiang, M.; Sun, L.; Zhang, L.; Jia, L.; Tian, A.; Liang, J. Experimental Investigation of Impactor Diameter Effect on Low-Velocity Impact Response of CFRP Laminates in a Drop-Weight Impact Event. Materials 2020, 13, 4131. [Google Scholar] [CrossRef] [PubMed]
- Dogan, A. Single and Repeated Low-Velocity Impact Response of E-Glass Fiber-Reinforced Epoxy and Polypropylene Composites for Different Impactor Shapes. J. Thermoplast. Compos. Mater. 2022, 35, 320–336. [Google Scholar] [CrossRef]
- Kazemianfar, B.; Esmaeeli, M.; Nami, M.R. Response of 3D Woven Composites under Low Velocity Impact with Different Impactor Geometries. Aerosp. Sci. Technol. 2020, 102, 105849. [Google Scholar] [CrossRef]
- Rezasefat, M.; da Silva, A.A.X.; Amico, S.C.; Giglio, M.; Manes, A. Strain-Rate Dependent FDEM Simulation of the Perforation Behaviour of Woven Composites Subjected to Low-Velocity Impact. In International Symposium on Dynamic Response and Failure of Composite Materials; Springer International Publishing: Cham, Switzerland, 2023; pp. 307–315. [Google Scholar] [CrossRef]
- Lopes, C.S.; Sádaba, S.; González, C.; Llorca, J.; Camanho, P.P. Physically-Sound Simulation of Low-Velocity Impact on Fiber Reinforced Laminates. Proc. Int. J. Impact Eng. 2016, 92, 3–17. [Google Scholar] [CrossRef]
- Kinvi-Dossou, G.; Bonfoh, N.; Matadi Boumbimba, R.; Koutsawa, Y.; Lachaud, F.; Nyoungue, A.; Gerard, P. A Mesoscale Modelling Approach of Glass Fibre/Elium Acrylic Woven Laminates for Low Velocity Impact Simulation. Compos. Struct. 2020, 252, 112671. [Google Scholar] [CrossRef]
- Bogenfeld, R.; Kreikemeier, J.; Wille, T. Review and Benchmark Study on the Analysis of Low-Velocity Impact on Composite Laminates. Eng. Fail. Anal. 2018, 86, 72–99. [Google Scholar] [CrossRef]
- Mao, C.; Zhang, C. Numerical Analysis of Influence Factors on Low-Velocity Impact Damage of Stitched Composite Laminates. Mech. Adv. Mater. Struct. 2018, 27, 1019–1028. [Google Scholar] [CrossRef]
- Hoseinlaghab, S.; Farahani, M.; Safarabadi, M.; Jalali, S.S. Comparison and Identification of Efficient Nanoparticles to Improve the Impact Resistance of Glass/Epoxy Laminates: Experimental and Numerical Approaches. Mech. Adv. Mater. Struct. 2022, 20, 694–709. [Google Scholar] [CrossRef]
- Rezasefat, M.; Giglio, M.; Manes, A. Numerical Investigation of the Effect of Open Holes on the Impact Response of CFRP Laminates. Appl. Compos. Mater. 2022, 29, 1555–1578. [Google Scholar] [CrossRef]
- Rezasefat, M.; Amico, S.C.; Giglio, M.; Manes, A. A Numerical Study on the Influence of Strain Rate in Finite-Discrete Element Simulation of the Perforation Behaviour of Woven Composites. Polymers 2022, 14, 4279. [Google Scholar] [CrossRef]
- Rezasefat, M.; Gonzalez-Jimenez, A.; Giglio, M.; Manes, A. Numerical Study on the Dynamic Progressive Failure Due to Low-Velocity Repeated Impacts in Thin CFRP Laminated Composite Plates. Thin-Walled Struct. 2021, 167, 108220. [Google Scholar] [CrossRef]
- Rezasefat, M.; Torres, D.B.; Gonzalez-Jimenez, A.; Giglio, M.; Manes, A. A Fast Fracture Plane Orientation Search Algorithm for Puck’s 3D IFF Criterion for UD Composites. Mater. Today Commun. 2021, 28, 102700. [Google Scholar] [CrossRef]
- Rezasefat, M.; Beligni, A.; Sbarufatti, C.; Amico, S.C.; Manes, A. Experimental and Numerical Study of the Influence of Pre-Existing Impact Damage on the Low-Velocity Impact Response of CFRP Panels. Materials 2023, 16, 914. [Google Scholar] [CrossRef] [PubMed]
- Tan, W.; Falzon, B.G.; Chiu, L.N.S.; Price, M. Predicting Low Velocity Impact Damage and Compression-After-Impact (CAI) Behaviour of Composite Laminates. Compos. Part A Appl. Sci. Manuf. 2015, 71, 212–226. [Google Scholar] [CrossRef]
- Shi, Y.; Swait, T.; Soutis, C. Modelling Damage Evolution in Composite Laminates Subjected to Low Velocity Impact. Compos. Struct. 2012, 94, 2902–2913. [Google Scholar] [CrossRef]
- Singh, H.; Mahajan, P. Modeling Damage Induced Plasticity for Low Velocity Impact Simulation of Three Dimensional Fiber Reinforced Composite. Compos. Struct. 2015, 131, 290–303. [Google Scholar] [CrossRef]
- Bouvet, C.; Rivallant, S.; Barrau, J.J. Low Velocity Impact Modeling in Composite Laminates Capturing Permanent Indentation. Compos. Sci. Technol. 2012, 72, 1977–1988. [Google Scholar] [CrossRef]
- Fanteria, D.; Longo, G.; Panettieri, E. A Non-Linear Shear Damage Model to Reproduce Permanent Indentation Caused by Impacts in Composite Laminates. Compos. Struct. 2014, 111, 111–121. [Google Scholar] [CrossRef]
- Bouvet, C.; Rivallant, S. Damage Tolerance of Composite Structures under Low-Velocity Impact. In Dynamic Deformation, Damage and Fracture in Composite Materials and Structures, 2nd ed.; Woodhead Publishing: Cambridge, UK, 2023; pp. 3–28. [Google Scholar] [CrossRef]
- Jiang, H.; Liu, X.; Jiang, S.; Ren, Y. Hybrid Effects and Interactive Failure Mechanisms of Hybrid Fiber Composites under Flexural Loading: Carbon/Kevlar, Carbon/Glass, Carbon/Glass/Kevlar. Aerosp. Sci. Technol. 2023, 133, 108105. [Google Scholar] [CrossRef]
- Hongkarnjanakul, N.; Rivallant, S.; Bouvet, C.; Miranda, A. Permanent Indentation Characterization for Low-Velocity Impact Modelling Using Three-Point Bending Test. J. Compos. Mater. 2013, 48, 2441–2454. [Google Scholar] [CrossRef]
- Ivañez, I.; Garcia-Castillo, S.K.; Sanchez-Saez, S.; Barbero, E. Experimental Study of the Impact Behavior of Repaired Thin Laminates with Double Composite Patch. Mech. Adv. Mater. Struct. 2018, 27, 1701–1708. [Google Scholar] [CrossRef]
- He, W.; Guan, Z.; Li, X.; Liu, D. Prediction of Permanent Indentation Due to Impact on Laminated Composites Based on an Elasto-Plastic Model Incorporating Fiber Failure. Compos. Struct. 2013, 96, 232–242. [Google Scholar] [CrossRef]
- Wang, Y.; Zhang, J.; Fang, G.; Zhang, J.; Zhou, Z.; Wang, S. Influence of Temperature on the Impact Behavior of Woven-Ply Carbon Fiber Reinforced Thermoplastic Composites. Compos. Struct. 2018, 185, 435–445. [Google Scholar] [CrossRef]
- Ge, X.; Zhang, P.; Zhao, F.; Liu, M.; Liu, J.; Cheng, Y. Experimental and Numerical Investigations on the Dynamic Response of Woven Carbon Fiber Reinforced Thick Composite Laminates under Low-Velocity Impact. Compos. Struct. 2022, 279, 114792. [Google Scholar] [CrossRef]
- Tuo, H.; Lu, Z.; Ma, X.; Xing, J.; Zhang, C. Damage and Failure Mechanism of Thin Composite Laminates under Low-Velocity Impact and Compression-after-Impact Loading Conditions. Compos. B Eng. 2019, 163, 642–654. [Google Scholar] [CrossRef]
- Tuo, H.; Lu, Z.; Ma, X.; Zhang, C.; Chen, S. An Experimental and Numerical Investigation on Low-Velocity Impact Damage and Compression-after-Impact Behavior of Composite Laminates. Compos. B Eng. 2019, 167, 329–341. [Google Scholar] [CrossRef]
- Erdogan, G.; Bilisik, K. Compression after Low-Velocity Impact (CAI) Properties of Multistitched Composites. Mech. Adv. Mater. Struct. 2017, 25, 623–636. [Google Scholar] [CrossRef]
- Li, Z.; Khennane, A.; Hazell, P.J.; Brown, A.D. Impact Behaviour of Pultruded GFRP Composites under Low-Velocity Impact Loading. Compos. Struct. 2017, 168, 360–371. [Google Scholar] [CrossRef]
- Abdallah, E.A.; Bouvet, C.; Rivallant, S.; Broll, B.; Barrau, J.J. Experimental Analysis of Damage Creation and Permanent Indentation on Highly Oriented Plates. Compos. Sci. Technol. 2009, 69, 1238–1245. [Google Scholar] [CrossRef]
- Bouvet, C.; Castanié, B.; Bizeul, M.; Barrau, J.J. Low Velocity Impact Modelling in Laminate Composite Panels with Discrete Interface Elements. Int. J. Solids Struct. 2009, 46, 2809–2821. [Google Scholar] [CrossRef]
- Vieille, B.; Casado, V.M.; Bouvet, C. About the Impact Behavior of Woven-Ply Carbon Fiber-Reinforced Thermoplastic- and Thermosetting-Composites: A Comparative Study. Compos. Struct. 2013, 101, 9–21. [Google Scholar] [CrossRef]
- Elias, A.; Laurin, F.; Kaminski, M.; Gornet, L. Experimental and Numerical Investigations of Low Energy/Velocity Impact Damage Generated in 3D Woven Composite with Polymer Matrix. Compos. Struct. 2017, 159, 228–239. [Google Scholar] [CrossRef]
- Da Silva, A.A.X.; Scazzosi, R.; Manes, A.; Amico, S.C. High-Velocity Impact Behavior of Aramid/S2-Glass Interply Hybrid Laminates. Appl. Compos. Mater. 2021, 28, 1899–1917. [Google Scholar] [CrossRef]
- Kumar, Y.; Rezasefat, M.; Amico, S.C.; Manes, A.; Dolez, P.I.; Hogan, J.D. Comparison of Two Progressive Damage Models for Predicting Low-Velocity Impact Behavior of Woven Composites. Thin-Walled Struct. 2024, 197, 111611. [Google Scholar] [CrossRef]
- ASTM D7136/D7136M-15; Standard Test Method for Measuring the Damage Resistance of a Fiber-Reinforced Polymer Matrix Composite to a Drop-Weight Impact Event. ASTM International: West Conshohocken, PA, USA, 2015.
- Liu, H.; Falzon, B.G.; Tan, W. Experimental and Numerical Studies on the Impact Response of Damage-Tolerant Hybrid Unidirectional/Woven Carbon-Fibre Reinforced Composite Laminates. Compos. B Eng. 2018, 136, 101–118. [Google Scholar] [CrossRef]
- Raghavan, P.; Ghosh, S. A Continuum Damage Mechanics Model for Unidirectional Composites Undergoing Interfacial Debonding. Mech. Mater. 2005, 37, 955–979. [Google Scholar] [CrossRef]
- Kim, E.H.; Rim, M.S.; Lee, I.; Hwang, T.K. Composite Damage Model Based on Continuum Damage Mechanics and Low Velocity Impact Analysis of Composite Plates. Compos. Struct. 2013, 95, 123–134. [Google Scholar] [CrossRef]
- Rezasefat, M.; Mostafavi, Y.; Ma, D.; Manes, A. A Hybrid Micro-Macro Mechanical Damage Model to Consider the Influence of Resin-Rich Zones on the Transverse Tensile Behaviour of Unidirectional Composites. Compos. Struct. 2023, 308, 116714. [Google Scholar] [CrossRef]
- Alonso, L.; Martínez-Hergueta, F.; Garcia-Gonzalez, D.; Navarro, C.; García-Castillo, S.K.; Teixeira-Dias, F. A Finite Element Approach to Model High-Velocity Impact on Thin Woven GFRP Plates. Int. J. Impact Eng. 2020, 142, 103593. [Google Scholar] [CrossRef]
- López-Puente, J.; Zaera, R.; Navarro, C. Experimental and Numerical Analysis of Normal and Oblique Ballistic Impacts on Thin Carbon/Epoxy Woven Laminates. Compos. Part A Appl. Sci. Manuf. 2008, 39, 374–387. [Google Scholar] [CrossRef]
- Shi, Y.; Pinna, C.; Soutis, C. Modelling Impact Damage in Composite Laminates: A Simulation of Intra- and Inter-Laminar Cracking. Compos. Struct. 2014, 114, 10–19. [Google Scholar] [CrossRef]
- Bažant, Z.P.; Oh, B.H. Crack Band Theory for Fracture of Concrete. Matériaux Constr. 1983, 16, 155–177. [Google Scholar] [CrossRef]
- Chen, W.F.; Bazant, Z.P.; Planas, J.; Kim, S.-E.; Lui, E.M.; Mossallam, K.H.; Toma, S.; Toma, S.; Cheung, Y.K.; Tham, L.G.; et al. Fracture and Size Effect in Concrete and Other Quasibrittle Materials; Routledge: New York, NY, USA, 2019. [Google Scholar] [CrossRef]
- Rezasefat, M.; Mostafavi, Y.; Hogan, J.D.; Giglio, A.M. Simple Projection Method: A Novel Algorithm for Estimation of Characteristic Element Length in Finite Element Simulations of Composites. Int. J. Fract. 2024. [Google Scholar]
- ABAQUS, version 6.16; Analysis User’s Manual; Dassault Systemes Simulia, Inc.: Johnston, RI, USA, 2016.
- Liu, P.F.; Liao, B.B.; Jia, L.Y.; Peng, X.Q. Finite Element Analysis of Dynamic Progressive Failure of Carbon Fiber Composite Laminates under Low Velocity Impact. Compos. Struct. 2016, 149, 408–422. [Google Scholar] [CrossRef]
- Lee, C.S.; Kim, J.H.; Kim, S.K.; Ryu, D.M.; Lee, J.M. Initial and Progressive Failure Analyses for Composite Laminates Using Puck Failure Criterion and Damage-Coupled Finite Element Method. Compos. Struct. 2015, 121, 406–419. [Google Scholar] [CrossRef]
- Benzeggagh, M.L.; Kenane, M. Measurement of Mixed-Mode Delamination Fracture Toughness of Unidirectional Glass/Epoxy Composites with Mixed-Mode Bending Apparatus. Compos. Sci. Technol. 1996, 56, 439–449. [Google Scholar] [CrossRef]
- Zhou, J.; Wen, P.; Wang, S. Numerical Investigation on the Repeated Low-Velocity Impact Behavior of Composite Laminates. Compos. B Eng. 2020, 185, 107771. [Google Scholar] [CrossRef]
- Rezasefat, M.; Gonzalez-Jimenez, A.; Giglio, M.; Manes, A. An Evaluation of Cuntze and Puck Inter Fibre Failure Criteria in Simulation of Thin CFRP Plates Subjected to Low Velocity Impact. Compos. Struct. 2021, 278, 114654. [Google Scholar] [CrossRef]
- Vogler, M.; Rolfes, R.; Camanho, P.P. Modeling the Inelastic Deformation and Fracture of Polymer Composites—Part I: Plasticity Model. Mech. Mater. 2013, 59, 50–64. [Google Scholar] [CrossRef]
- Cousigné, O.; Moncayo, D.; Coutellier, D.; Camanho, P.; Naceur, H.; Hampel, S. Development of a New Nonlinear Numerical Material Model for Woven Composite Materials Accounting for Permanent Deformation and Damage. Compos. Struct. 2013, 106, 601–614. [Google Scholar] [CrossRef]
- Bogetti, T.A.; Hoppel, C.P.R.; Harik, V.M.; Newill, J.F.; Burns, B.P. Predicting the Nonlinear Response and Progressive Failure of Composite Laminates. Compos. Sci. Technol. 2004, 64, 329–342. [Google Scholar] [CrossRef]
- Bogetti, T.A.; Hoppel, C.P.R.; Harik, V.M.; Newill, J.F.; Burns, B.P. Predicting the Nonlinear Response and Failure of Composite Laminates: Correlation with Experimental Results. Compos. Sci. Technol. 2004, 64, 477–485. [Google Scholar] [CrossRef]
- Zhong, S.; Guo, L.; Lu, H.; Zeng, T. A continuum damage model for three-dimensional woven composites and finite element implementation. Compos. Struct. 2015, 128, 1–9. [Google Scholar] [CrossRef]
- Xiao, J.R.; Gama, B.A.; Gillespie, J.W. Progressive Damage and Delamination in Plain Weave S-2 Glass/SC-15 Composites under Quasi-Static Punch-Shear Loading. Compos. Struct. 2007, 78, 182–196. [Google Scholar] [CrossRef]
- Gama, B.A.; Gillespie, J.W. Finite Element Modeling of Impact, Damage Evolution and Penetration of Thick-Section Composites. Int. J. Impact Eng. 2011, 38, 181–197. [Google Scholar] [CrossRef]
- Zhang, J.; Zhang, X. Simulating Low-Velocity Impact Induced Delamination in Composites by a Quasi-Static Load Model with Surface-Based Cohesive Contact. Compos. Struct. 2015, 125, 51–57. [Google Scholar] [CrossRef]
- ASTM D3039; Standard Test Methods for Tensile Properties of Polymer Matrix Composite Materials. Annual Book of ASTM Standards. ASTM International: West Conshohocken, PA, USA, 2014.
- Schön, J. Coefficient of Friction of Composite Delamination Surfaces. Wear 2000, 237, 77–89. [Google Scholar] [CrossRef]
- Faggiani, A.; Falzon, B.G. Predicting Low-Velocity Impact Damage on a Stiffened Composite Panel. Compos. Part A Appl. Sci. Manuf. 2010, 41, 737–749. [Google Scholar] [CrossRef]
- Martínez-Hergueta, F.; Ares, D.; Ridruejo, A.; Wiegand, J.; Petrinic, N. Modelling the In-Plane Strain Rate Dependent Behaviour of Woven Composites with Special Emphasis on the Non-Linear Shear Response. Compos. Struct. 2019, 210, 840–857. [Google Scholar] [CrossRef]
- Perillo, G.; Jørgensen, J.K. Numerical/Experimental Study of the Impact and Compression after Impact on GFRP Composite for Wind/Marine Applications. Procedia Eng. 2016, 167, 129–137. [Google Scholar] [CrossRef]
- Shah, S.Z.H.; Megat-Yusoff, P.S.M.; Karuppanan, S.; Choudhry, R.S.; Ahmad, F.; Sajid, Z.; Gerard, P.; Sharp, K. Performance Comparison of Resin-Infused Thermoplastic and Thermoset 3D Fabric Composites under Impact Loading. Int. J. Mech. Sci. 2021, 189, 105984. [Google Scholar] [CrossRef]
- Liu, D.; Raju, B.B.; Dang, X. Impact Perforation Resistance of Laminated and Assembled Composite Plates. Int. J. Impact Eng. 2000, 24, 733–746. [Google Scholar] [CrossRef]
- Hufenbach, W.; Gude, M.; Ebert, C.; Zscheyge, M.; Hornig, A. Strain Rate Dependent Low Velocity Impact Response of Layerwise 3D-Reinforced Composite Structures. Int. J. Impact Eng. 2011, 38, 358–368. [Google Scholar] [CrossRef]
- Choudhry, R.S.; Hassan, S.F.; Li, S.; Day, R. Damage in Single Lap Joints of Woven Fabric Reinforced Polymeric Composites Subjected to Transverse Impact Loading. Int. J. Impact Eng. 2015, 80, 76–93. [Google Scholar] [CrossRef]
- Baucom, J.N.; Zikry, M.A.; Rajendran, A.M. Low-Velocity Impact Damage Accumulation in Woven S2-Glass Composite Systems. Compos. Sci. Technol. 2006, 66, 1229–1238. [Google Scholar] [CrossRef]


Disclaimer/Publisher’s Note: The statements, opinions and data contained in all publications are solely those of the individual author(s) and contributor(s) and not of MDPI and/or the editor(s). MDPI and/or the editor(s) disclaim responsibility for any injury to people or property resulting from any ideas, methods, instructions or products referred to in the content. |
© 2024 by the authors. Licensee MDPI, Basel, Switzerland. This article is an open access article distributed under the terms and conditions of the Creative Commons Attribution (CC BY) license (https://creativecommons.org/licenses/by/4.0/).