Article

Numerical Investigation on the Capability of Modeling Approaches for Composite Cylinders under Low-Velocity Impact Loading

Politecnico di Milano, Department of Mechanical Engineering, Via la Masa, 1, 20156 Milan, Italy
*
Author to whom correspondence should be addressed.
J. Compos. Sci. 2024, 8(4), 141; https://doi.org/10.3390/jcs8040141
Submission received: 20 February 2024 / Revised: 25 March 2024 / Accepted: 8 April 2024 / Published: 10 April 2024
(This article belongs to the Special Issue Characterization and Modelling of Composites, Volume III)

Abstract

:
Composite pressure vessels can be exposed to extreme loadings, for instance, impact loading, during manufacturing, maintenance, or their service lifetime. These kinds of loadings may provoke both visible and invisible levels of damage, e.g., fiber breakage matrix cracks and delamination and eventually may lead to catastrophic failures. Thus, the quantification and evaluation of such damages are of great importance. Considering the cost of relevant full-scale experiments, a numerical model can be a powerful tool for such a kind of study. This paper aims to provide a numerical study to investigate the capability of different modeling methods to predict delamination in composite vessels. In this study, various numerical modeling aspects, such as element types (solid and shell elements) and material parameters (such as interface properties), were considered to investigate delamination in a composite pressure vessel under low-velocity impact loading. Specifically, solid elements were used to model each layer of the composite pressure vessel, while, in another model, shell elements with composite layup were considered. Compared with the available experimental data from low-velocity impact tests described in the literature, the capability of these two models to predict both mechanical responses and failure phenomena is shown.

1. Introduction

In recent years, hydrogen gas has been taken into consideration as a clean energy resource in the automotive, aviation, and aerospace industries. There are many physical and chemical hydrogen storage methods such as high-pressure hydrogen storage, metal solid hydrogen storage, and complex hydride hydrogen storage. Currently high-pressure hydrogen storage is the most common method because of its low cost, maturity, and ease of operation. The composite high-pressure hydrogen storage tank is classified into type III and type IV tanks. It is composed of a liner and a carbon fiber wound layer. The liner of a type III tank is made of aluminum alloy, and the liner of a type IV is made of polymer. The potential of composite pressure vessels has been recognized due to their light weight but high strength. Composite pressure vessels can be exposed to extreme loading conditions, for instance, impact loading, during their manufacturing, maintenance, or service lifetime. These kinds of loadings may lead to both visible and invisible levels of damage (e.g., delamination, matrix cracks, and fiber breakage) and eventually catastrophic failures. Considering the cost of relevant experiments, numerical models can be a powerful tool for such a study [1,2,3].
Composite pressure vessels are very susceptible to impact events prior to their operational services and during transportation, mounting, maintenance, and their entire service life due to collision with external objects or because of vessel dropping on the ground. Impact loading can cause various failures in composite pressure vessels (e.g., delamination, matrix cracks, and fiber breakage). Since the majority of impact-induced defects are not visually detectable, they can lead to catastrophic failures during operation [4].
Considering the widespread applications of composite pressure vessels, the safety concerns in various operational conditions play a crucial role in their prospective applications. Consequently, detecting and evaluating damage arisen from impact loading in composite pressure vessels can not only provide some essential insight into the early stages of their design process, but it is also of great importance from a safety viewpoint. Furthermore, considering the cost of relevant experiments, numerical models can be a powerful tool for such a study and the development of a reliable modeling approach will be useful in the design phase.
As is stated in the literature, studies on the mechanical behavior of filament wound composite vessels under low-velocity impact have received a lot of attention in recent years [5,6,7,8,9,10,11,12,13,14,15,16,17,18,19,20,21,22,23,24,25]. Liao et al., implemented a numerical model to investigate low-velocity-impact-induced damage in composite pressure vessels. They used sub-laminate theory to predict delamination failure, Puck’s failure criteria for fiber breakage failure, and the strain base damage evolution laws for matrix failure [10]. Han and Chang studied the structural behavior of Type III hydrogen vessels subjected to low-velocity impact. They used a ply-based modeling approach in the numerical model in which all failure modes were predicted by applying Hashin criteria [11]. Perillo et al. presented both a numerical and experimental study to investigate low-velocity impact damage mechanisms in filament wound composite pressure vessels. They applied impact loading in different energies on both central and dome sections on the pressure vessels. Additionally, they used Puck and Hashin failure criteria to predict the matrix and fiber failures, and the cohesive zone for the prediction of delamination [13]. Allen et al. carried out an experimental study to compare the structural behavior of composite pressure vessels under quasi-static indentation and low velocity impact. According to their study, the damage occurring differs in terms of matrix failure, but the quasi-static indentation test can be considered an analogue for a low-velocity impact test on composite vessels [17]. Farhood et al. investigated the impact behavior of carbon/basalt hybrid composite pipes in an experimental study. They applied low-velocity impact loadings in two various energy levels to the composite pipes with different stacking sequences. They found that the impact response of composite pipes is highly dependent on the stacking sequence of the layers [18]. Wu et al. conducted a numerical and experimental investigation to study the impact damage mechanism in carbon fiber-reinforced composite cylinders. They explored the effect of impactor shape on the impact-induced damage. For this purpose, they developed a numerical model using thick-shell elements for the composite structure [21]. Long et al. compared the low-velocity impact behavior of filament wound composite pressure vessels with filament wound composite plates and laminated composite structures, in an experimental study. The three structures showed different behaviors under impact loading, but the composite cylinders had higher impact resistance compared to the other structures [22]. In research conducted on impact loading on composite structures, the investigation of the material models, which can predict the impact behavior of the composite structures and the damage occurred on them, is one of the most significant parts [26,27,28]. For example, Shao et al. compared the application of Hashin and Chang-Chang criteria in the prediction of inter-laminar damage in composite laminates under impact loading [26]. Hou et al. described an improved Chang-Chang criteria to predict the impact-induced damages that occurred in composite laminates. This material model is also implemented in Ls-DYNA 3D as a material model for damage prediction in composite materials [28].
Interface modeling for composites by means of numerical methods is of great interest to the scientific community, leading to much research on it. Geubelle and Baylor simulated delamination in thin composite plates under impact loading with a 2D cohesive/volumetric finite element scheme to model the initiation and propagation of interface failure among composite plates [29]. A theoretical model was presented by Borg et al. to analyze delamination phenomena in a composite beam, while a discrete cohesive zone model was also developed in their work to predict delamination under simple and complex loading conditions [30]. For the same application under quasi-static loading, Camanho et al. used zero-thickness decohesion elements at the interface between solid finite elements [31]. Changliang et al. employed a theoretical method to investigate the delamination in a composite cylinder under low-velocity impact. They demonstrated the damage evolution in two cases of the vessel varying internal pressure [32]. Turon et al., developed a methodology to analyze the delamination area by using cohesive zone elements, which was used to investigate the effects of the length and stiffness of the cohesive zone on the evolution of delamination [33]. Fleming et al. investigated delamination failure in composite structures by using cohesive zone models based on native contact and spotweld procedures. According to their results, the spot weld-based method can predict the initiation and propagation of delamination with more accuracy. For cohesive models, a different cohesive model can be used, which may lead to the different performances of numerical models [34]. Elmarakbi et al. developed a new adoptive cohesive element to overcome numerical instability while using the bilinear cohesive model. They carried out both quasi-static and dynamic analysis in their numerical model. Moreover, different element types for the applications of the cohesive model should also be considered [35]. Dogan et al. utilized three different models, thick-shell elements with a cohesive interface, solid elements with a cohesive interface and thin shell elements with tie break contact to predict delamination in composite structures under impact. They found that thin shell elements with tie break contact resulted in more accurate results [36]. Both experimental and numerical works were carried out to investigate the onset and growth of delamination failure in composite structures by Caprio et.al.; for this purpose, they compared the results of the defining contact surface with cohesive behavior in interface layers using cohesive elements [37]. Roberts et al. investigated the predictive capability of the cohesive zone model to predict delamination initiation and evolution in various composite structures such as a double cantilevered beam, end notch flexure, and single leg bend, indicating the possibility of applying such a method to complex structures [38]. In one of the more recent works, Weerts et al. investigated the mechanical behavior of a composite pressure vessel subjected to impact loading. They implemented cohesive elements in-between composite layers to predict delamination failure. In this case, a bilinear traction–separation law was used to express the response of the cohesive elements [39]. Skaar et al. conducted experimental and numerical research on low-velocity-impact-induced damages in glass epoxy composite pipes. They modeled interlaminar damage by defining cohesive elements in-between composite layers [40].
On the other hand, the generation of a numerical model which is able to predict the impact behavior of composite cylinders and impact-induced damage (e.g., delamination) is significant. There are several studies that investigated the various modeling approaches for this impact behavior prediction in composite structures. One of the important concerns regarding the research conducted in this field is selecting the appropriate element types to create an accurate numerical model in impact delamination prediction [41,42,43,44,45,46,47]. McElroy et al. compared the ability of two different element types to predict the impact damage in composite plates. They used enriched shell elements and solid elements to model delamination in composite plates. According to their investigation, enriched shell elements are incapable of providing accurate results in delamination modeling compared to solid elements. However, enriched shell elements can be applicable in general damage predictions with lower computational costs [41]. Tawk et al. implemented solid hexahedron elements to model delamination damage in composite laminates. In their model with solid elements, they used eight nodes of each solid element as the integration points for the calculation. They also generated a model with double four-node shell elements to model the delamination [42]. J.C. Remmers et al. presented a finite element approach for the simulation of delamination damage in thin-layered composite structures. They investigated the capability of solid-like shell elements in the numerical model in modeling the delamination [43].
As discussed in the works listed above, delamination in composite structures has been considered as a significant failure level in composite structures because when it appears in a composite structure, it can eventually lead to catastrophic failure. Thus, in order to avoid any potential catastrophic failures in composite structures, the highly accurate prediction of delamination is quite significant. In most of the research in this field, researchers considered geometrically simple structures such as a composite beam or plate, and only a few studies conducted delamination analysis in more complex structures such as curved structures and composite vessels. This is because, considering their wide application, composite pressure vessels are the objective of the current work, it is of interest to investigate the capability of different numerical models to accurately and efficiently predict delamination, which may occur in such structures.
Due to the fact that composite pressure vessels are manufactured based on the filament-winding technique, creating a numerical model able to predict damage in such a complex structure is rather complicated. As discussed in the literature review and according to the research performed, most research is focused on the modeling approaches related to composite plates and geometrically simple structures, and there is a need to investigate numerical approaches to model the impact damage to more complex structures such as composite cylinders.
In this paper, initially, a simplified numerical model has been generated to predict delamination failure in composite pressure vessels under low-velocity impact loading. The accuracy of the model has been validated based on experimental results obtained from the literature [40]. In the next step, the prediction accuracy of three different approaches used to define interlaminar properties while analyzing delamination in a glass fiber composite cylinder subjected to low-velocity impact has been compared. Furthermore, a mesh convergency analysis has also been carried out to investigate the influence of the mesh size in the delamination area. The structure has been modeled by implementing three kinds of elements, namely, solid, thick-shell, and shell elements to compare the delamination results in each model.

2. Materials and Methods

A numerical model has been implemented to investigate the mechanical behavior of a glass fiber (GF)-reinforced composite cylinder under low-velocity impact loading. The filament winding composite cylinder was manufactured with GF from 3B E-CR glass and a matrix from EPIKOTE resin named MGS RIMR 135 [40].
Impact loading has been applied on the cylinder by dropping the impactor from a specific height (1 m in this case), and, after the first impact, the impactor was blocked to avoid the rebounding impacts. The strain was measured at the impact point of the cylinder by a strain gauge installed within the cylinder, and the data were recorded at 9600 KHz by utilizing a Spider-8 data acquisition device [40].
The model framework and material model used in this study are introduced in the following sections.

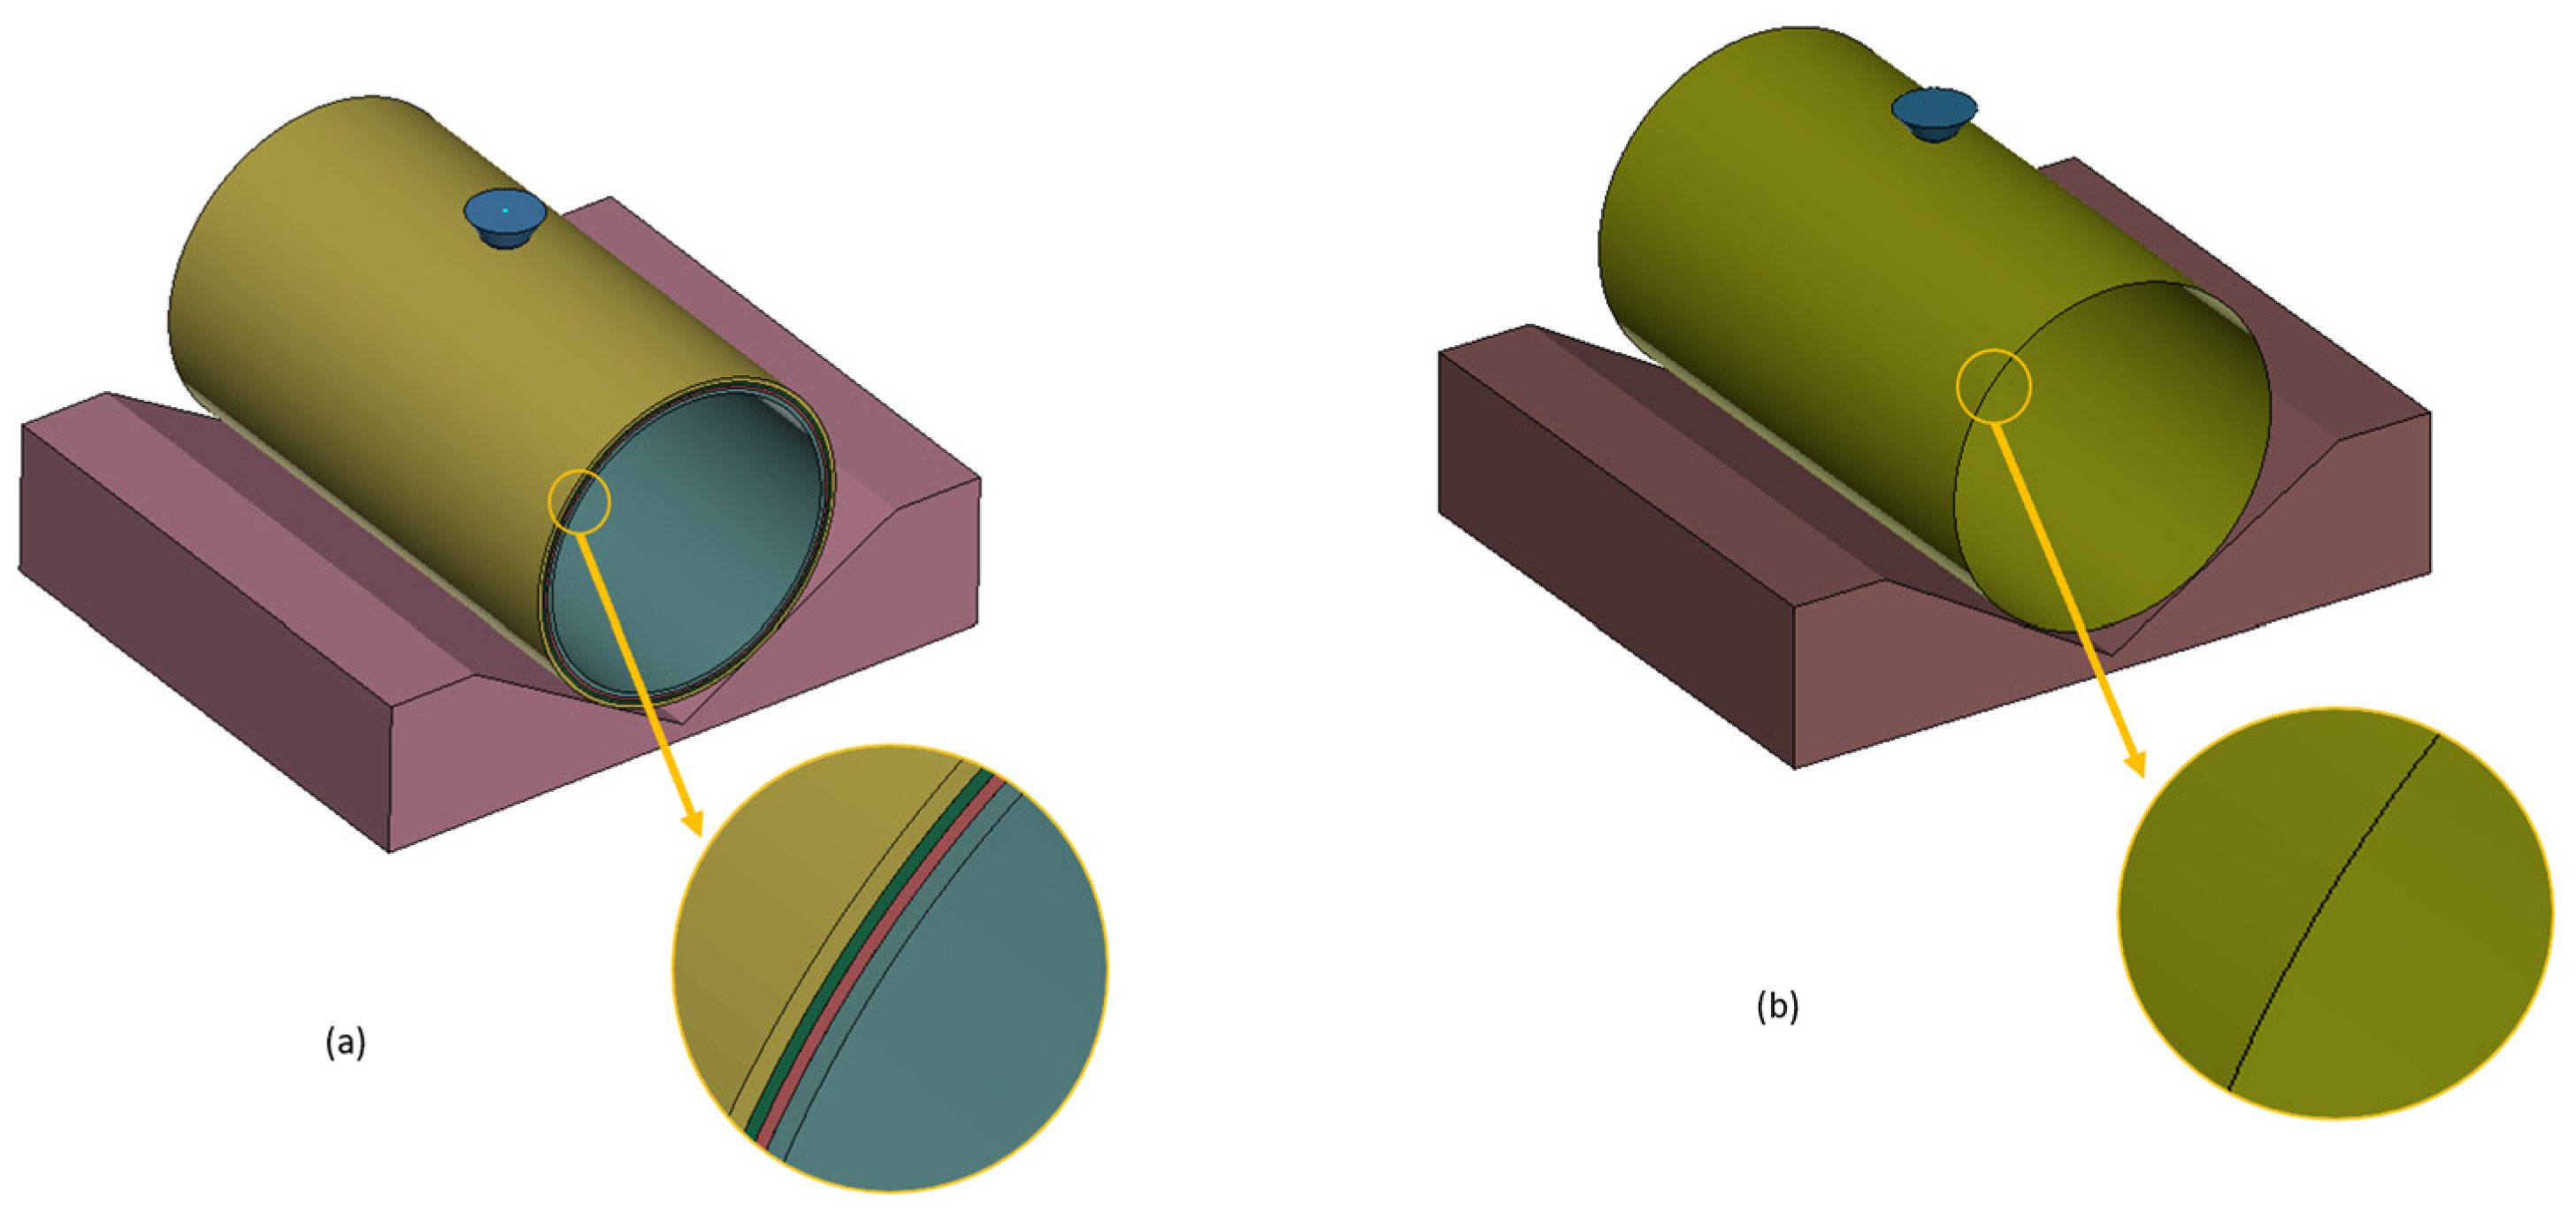
2.1. Model Description

In order to investigate the delamination of a composite cylinder under low-velocity impact, a numerical model was built in LS-dyna software (LS 4.9). A fiber glass composite vessel with a 100 mm inner diameter and 180 mm length was produced using the filament winding method, which has a layup of [ 90 ° 2 / ± 15 ° ] s and the thickness of the layers is defined in Table 1 [40].
In recent research, a composite cylinder has been simulated by defining the composite layers as unidirectional layers. Three different kinds of elements have been used to model the composite part, resulting in three models. In the first model, presented in Figure 1a, solid elements have been used and composite layers have been defined separately. In the second model, the element type has been changed to thick-shell elements with the same configuration of the layers used with solid elements, shown in Figure 1a. In the third model, presented in Figure 1b, the cylinder has been modeled as one part cylinder with elements defined as shell elements (a single element through the thickness).
Three different mesh sizes have been investigated to explore the effects of mesh size in the delamination area. The elements have been created in three different mesh sizes of 3 × 3   m m 2 , 2 × 2   m m 2 , and 1 × 1   m m 2 , shown in Figure 2. In each layer, one single element along the thickness is created.
In order to investigate the effects of interface properties in the prediction of the delamination area, three different types of cohesive properties have been defined: the tiebreak model, linear cohesive model, and non-linear cohesive model. Each model behavior results in different traction–separation curves, presented in Figure 3. In tiebreak damage, evolution is not considered; thus, complete failure is achieved when traction reaches the point of separation, as shown in Figure 3a. In linear cohesive behavior, after the initiation of separation, traction decreases linearly during damage evolution, while in non-linear cohesive behavior, traction decreases non-linearly during damage evolution. The linear and non-linear cohesive behaviors are shown in Figure 3b and 3c, respectively. Here, d 0 is the point at which separation starts and d f is the point for maximum separation. Different cohesive models have been applied to the models with solid elements to investigate the effect of different cohesive models.

2.2. Boundary Conditions and Numerical Setup

The model reproduces the cylinder, the cradle, and the impactor. The cylinder is supported by a cradle during impact. Both the impactor and the cradle are modeled as rigid bodies. The impactor has a tip diameter of 16 mm and a point mass of 2.9 kg. The cylinder has a length of 180 mm with an inner diameter of 100 mm at a total thickness of 5.062 mm [40].
The steel impactor is restricted except for vertical movement. Impact loading is simulated by defining an initial velocity for the impactor, corresponding to the drop height, according to the experimental data, where the drop height is considered 1 m and the velocity of the impactor before impact is 4.4   m / s [40]. In this model, automatic surface-to-surface contact has been used for the contact between the composite cylinder and the rigid bodies. More details about the material properties are shown in Table 1 and cohesive parameters used in the numerical model are found in Table 2.

2.3. Material Model

The material model of MAT 054 was utilized to define the composite material. This material model refers to the Chang-Chang failure criterion, and an orthotropic material (e.g., unidirectional composites) can be defined by using this card in LS-dyna software (LS 4.9). The Chang-Chang criterion is a stress-based criterion and considers four modes of failure which are defined as below [48].
For the tensile fiber mode,
σ a a > 0   t h e n   e f 2 = ( σ a a X t ) 2 + β ( σ a b S c ) 1 { 0   f a i l e d 0   e l a s t i c
in which σ a a is the effective stress tensor in the fiber direction, and σ a b corresponds to the shear stress. X t and S c refer to fiber tensile and shear strength, respectively. For the compressive fiber mode,
σ a a < 0   t h e n   e c 2 = ( σ a a X c ) 2 1 { 0   f a i l e d 0   e l a s t i c
in which X c is the fiber compressive strength.
For the tensile matrix mode,
σ b b > 0   t h e n   e m 2 = ( σ b b Y t ) 2 + β ( σ a b S c ) 2 1 { 0   f a i l e d 0   e l a s t i c
in which σ b b is the effective stress tensor in the direction perpendicular to the fiber, and Y t is matrix tensile strength.
And, for the compressive matrix mode,
σ b b < 0   t h e n   e d 2 = ( σ b b 2 S c ) 2 + [ ( Y c 2 S c ) 2 1 ] σ b b Y c + ( σ a b S c ) 2 1 { 0   f a i l e d 0   e l a s t i c
in which Y c is the matrix compressive strength.

3. Results

This section presents the results of finite element investigation on the delamination failure of a glass fiber composite cylinder subjected to a low-velocity impact. In the first part, a numerical analysis was performed to investigate the influence of mesh size on the delamination prediction results; this process determines the proper mesh size for further investigations. In the second part, the effects of different interlaminar cohesive behavior in the prediction of delamination were exposed. Then, the delamination areas obtained by implementing different kinds of elements were compared. The results from finite element investigation, in this paper, were validated by the experimental data obtained in [40].

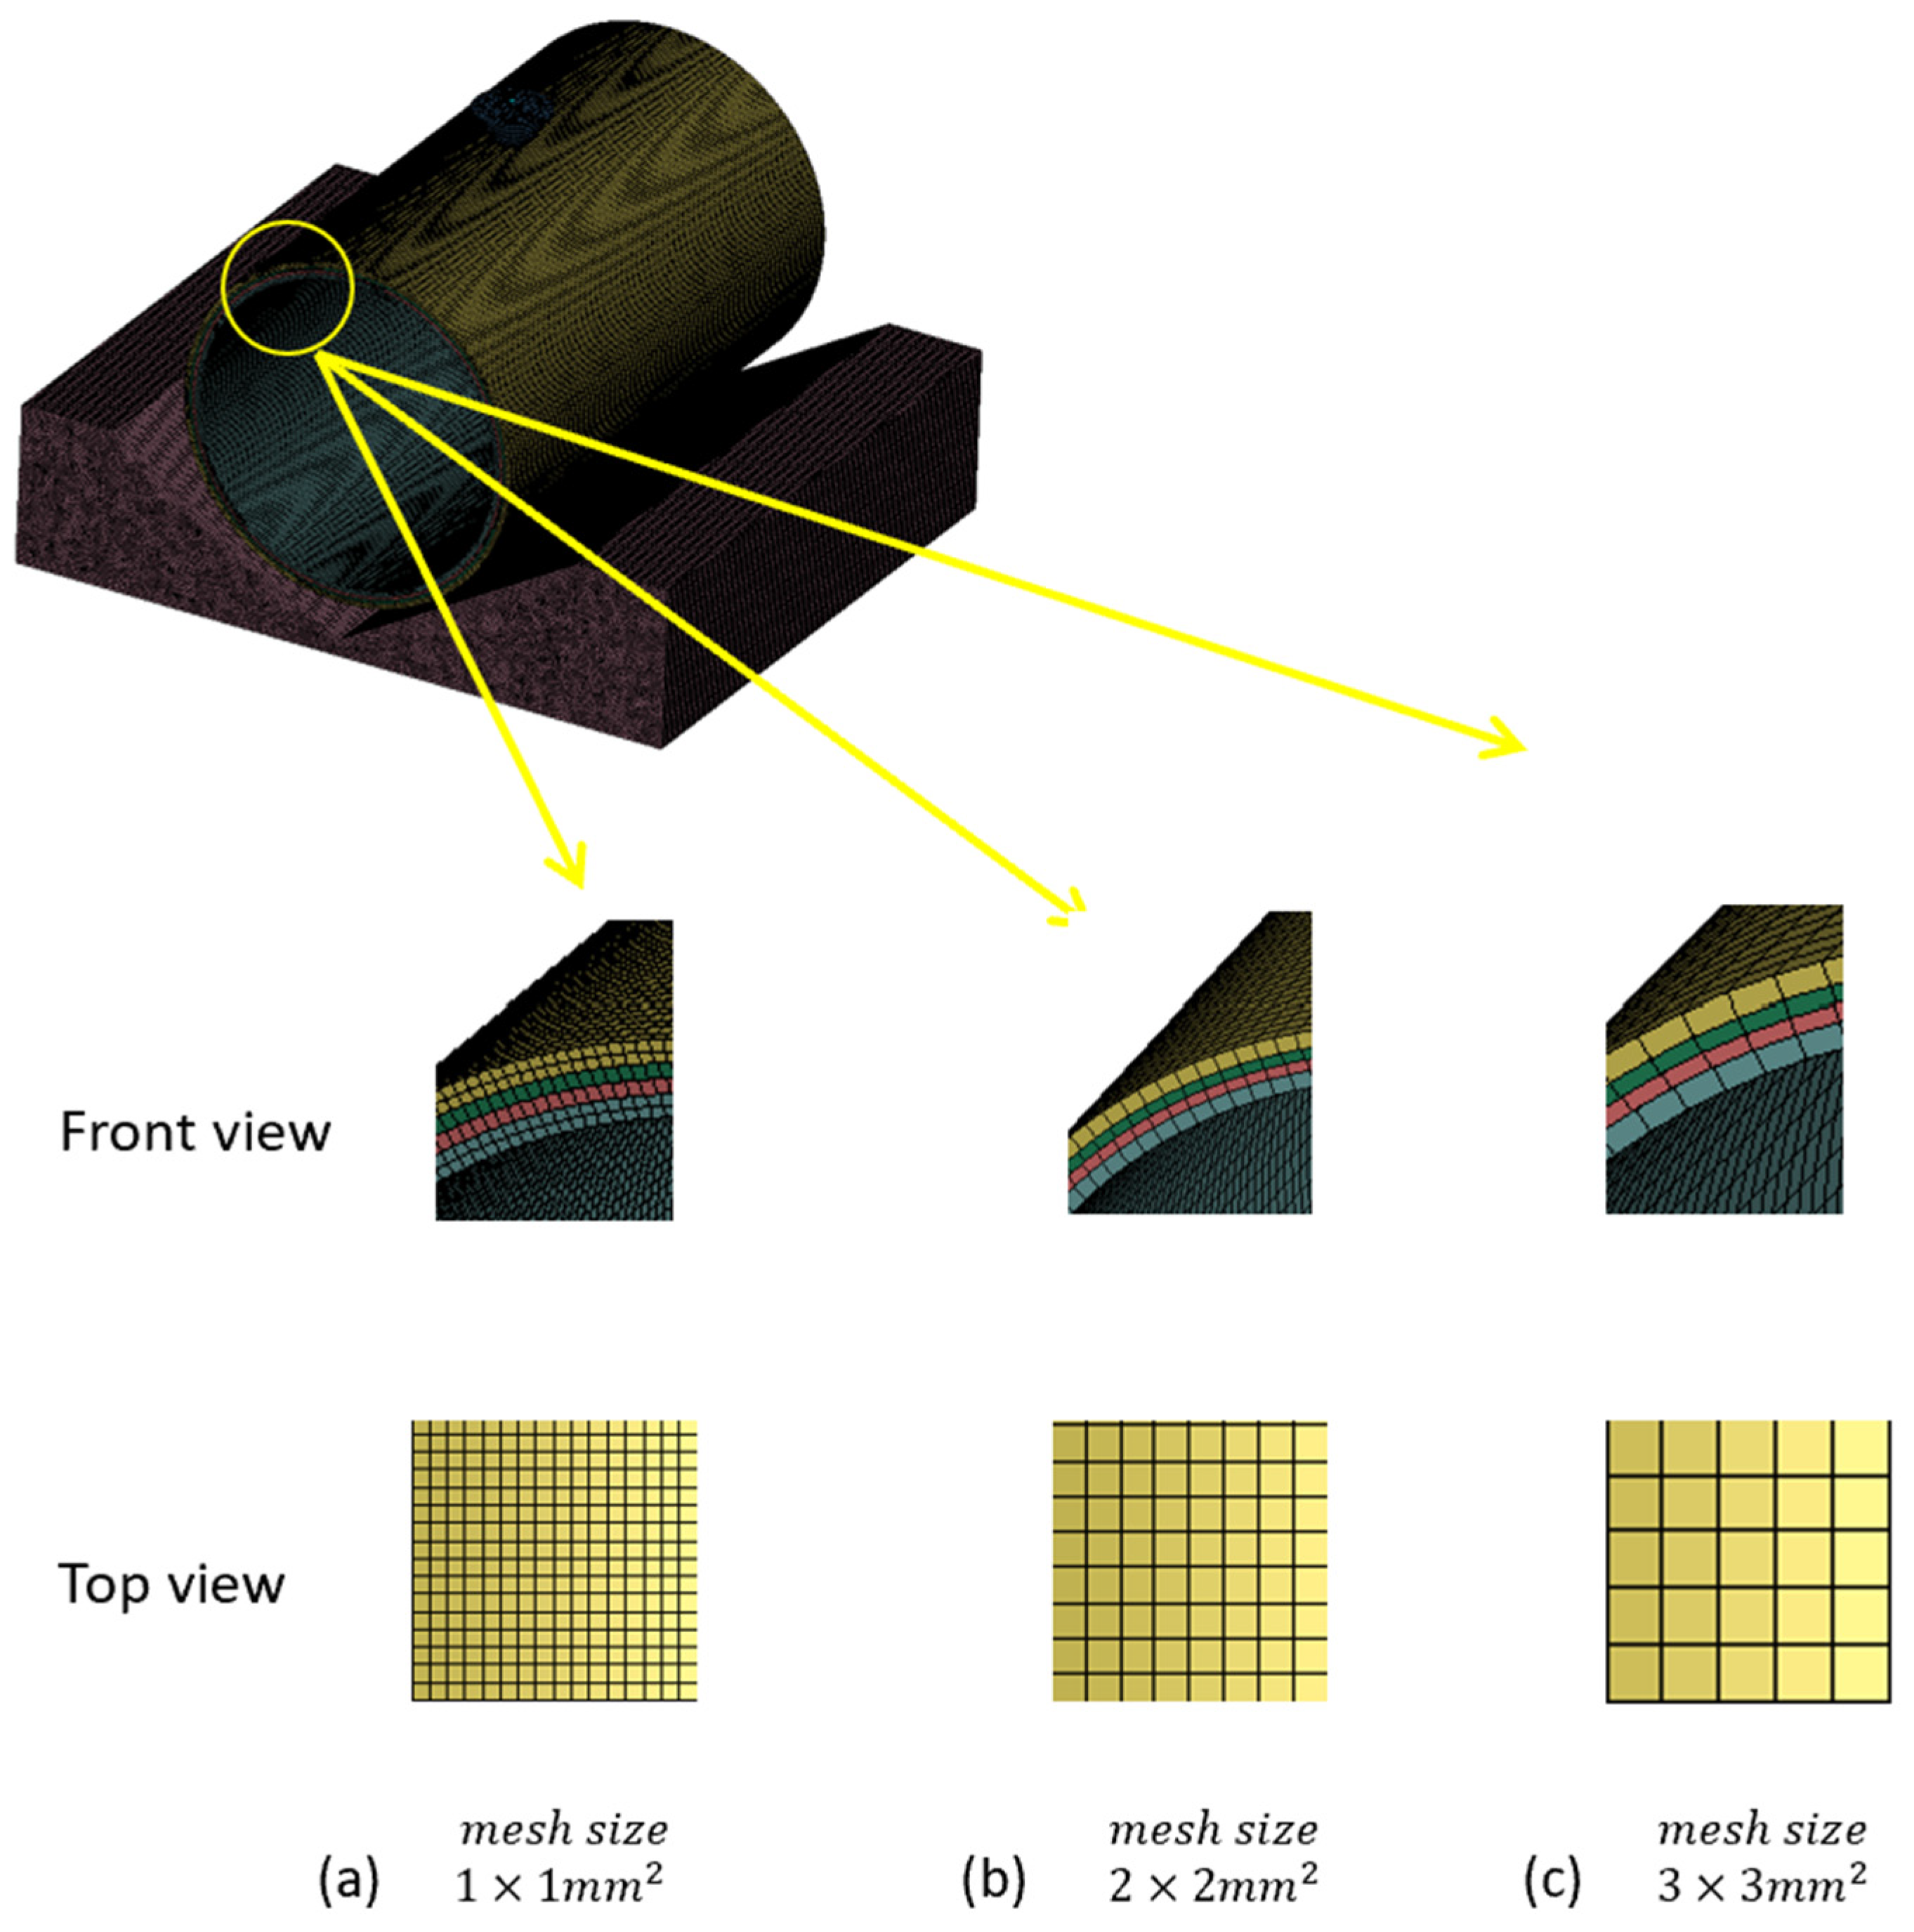
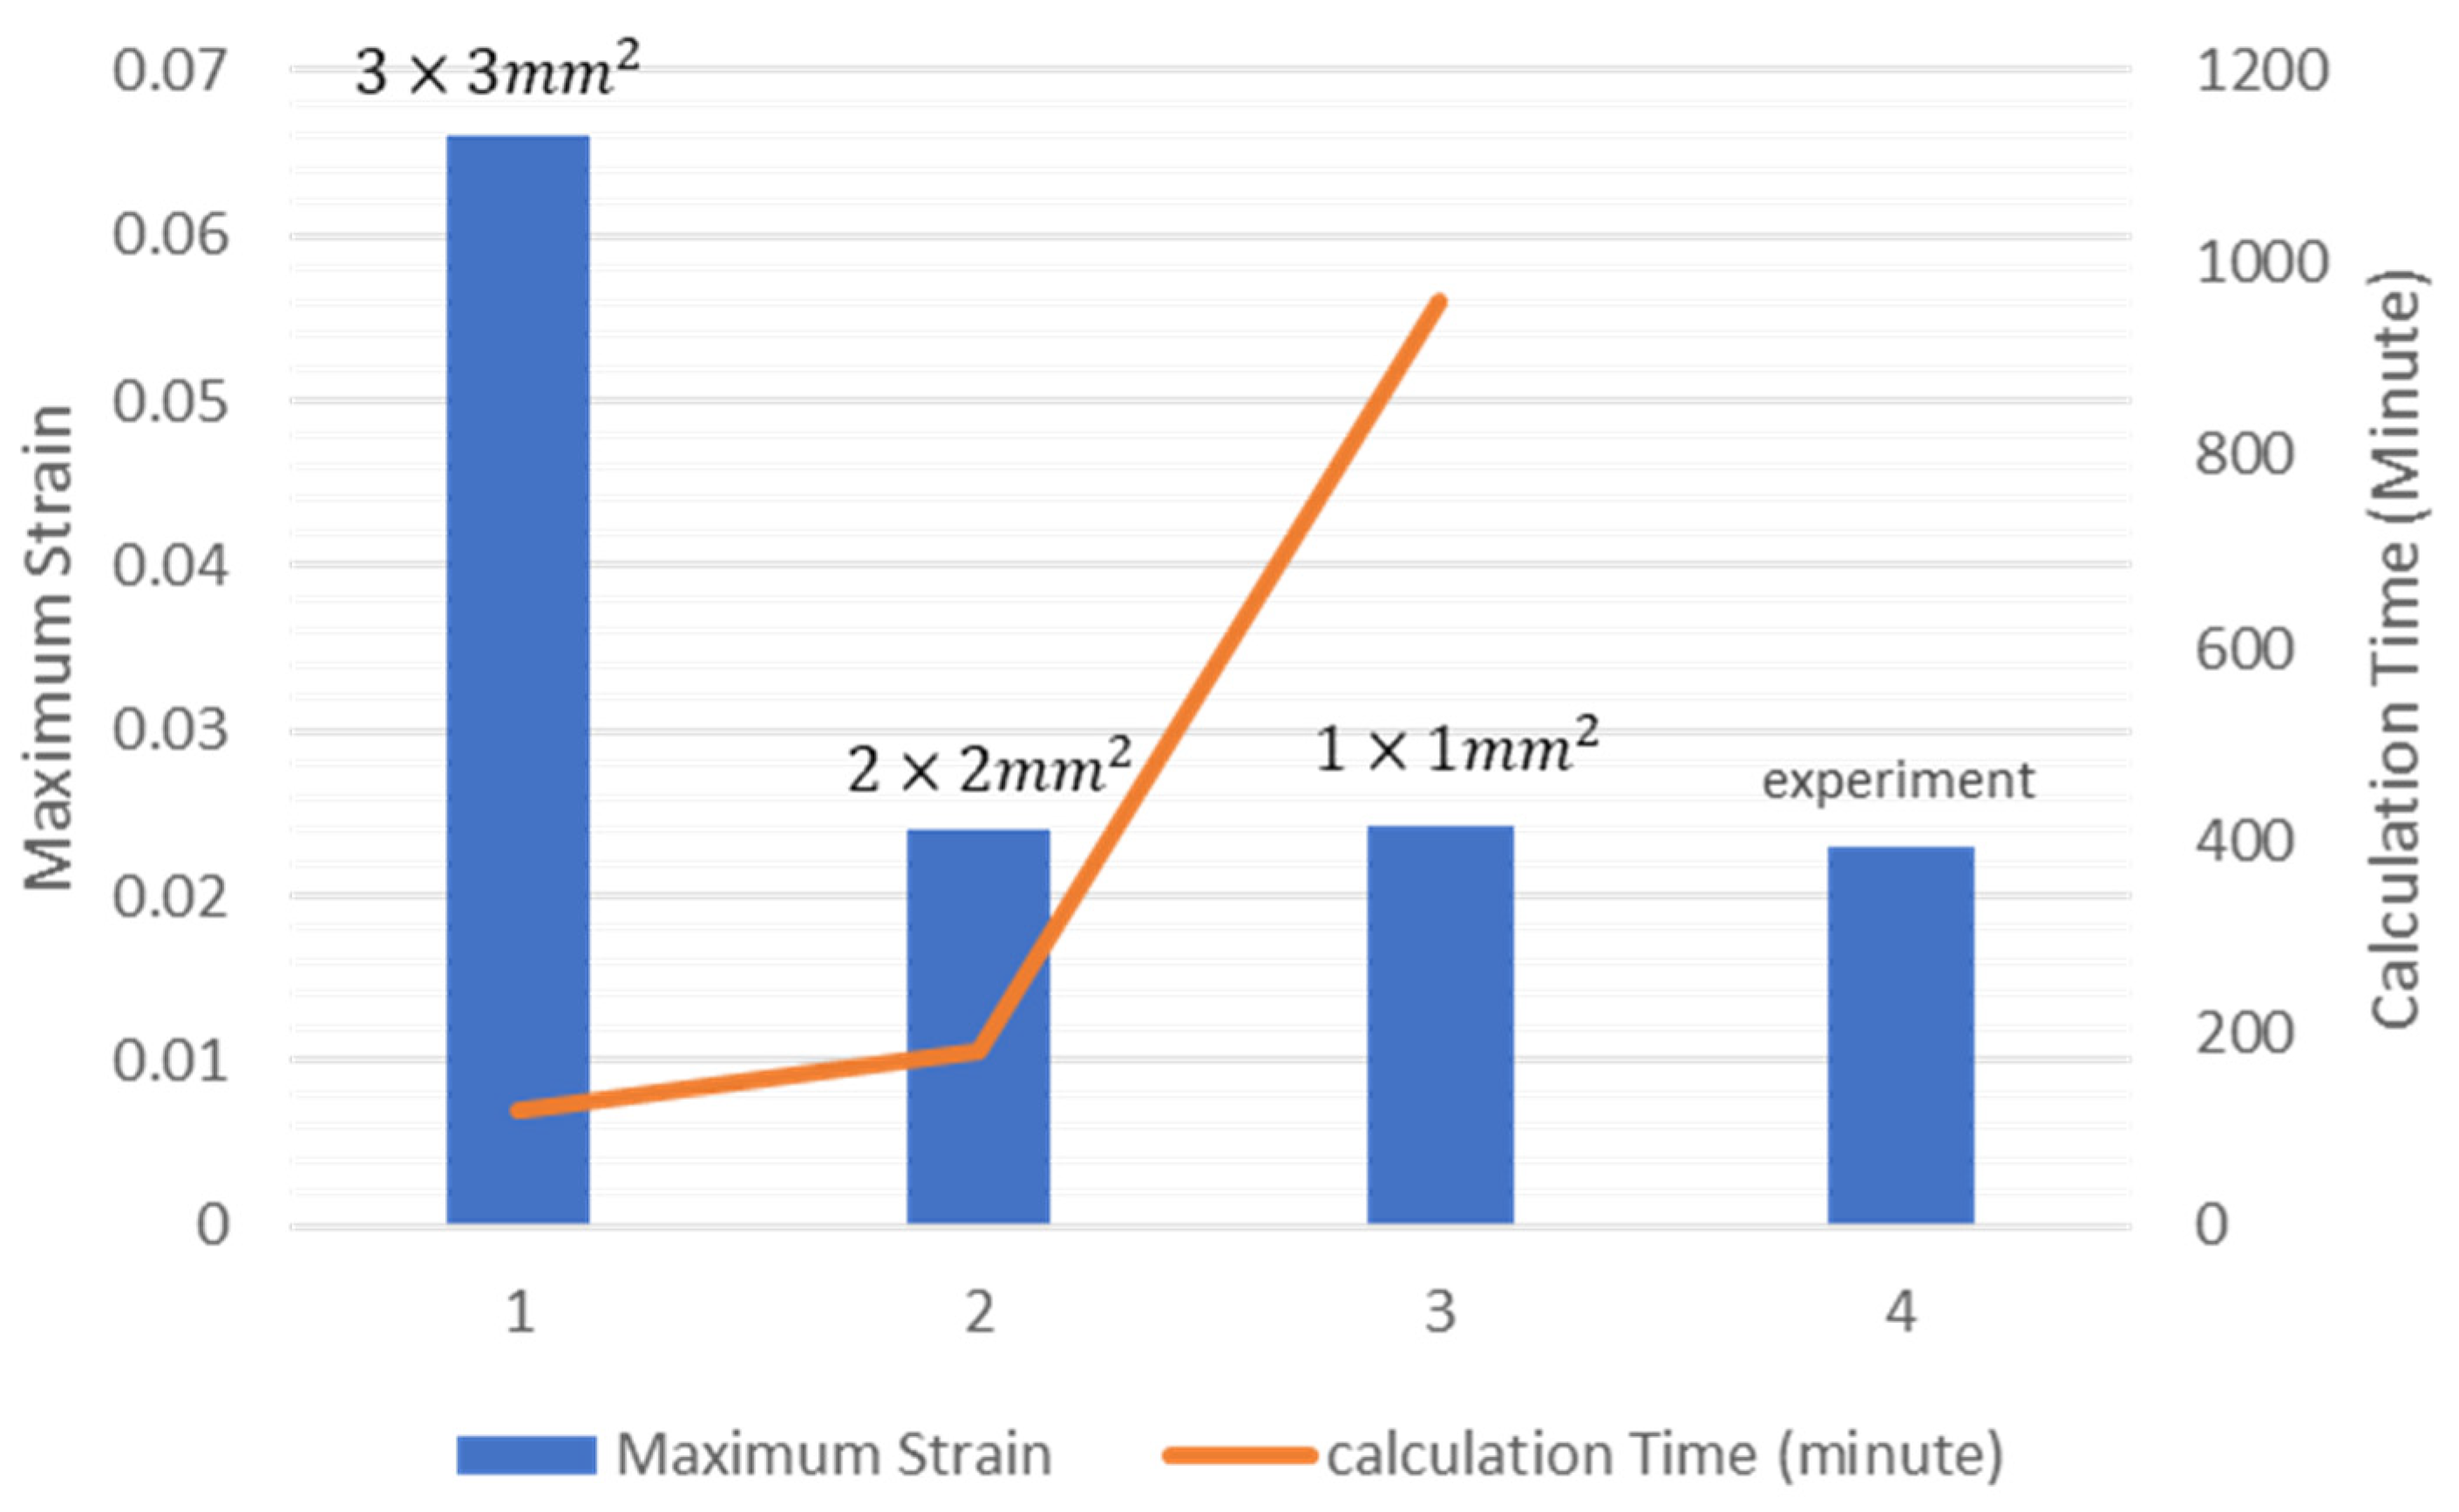
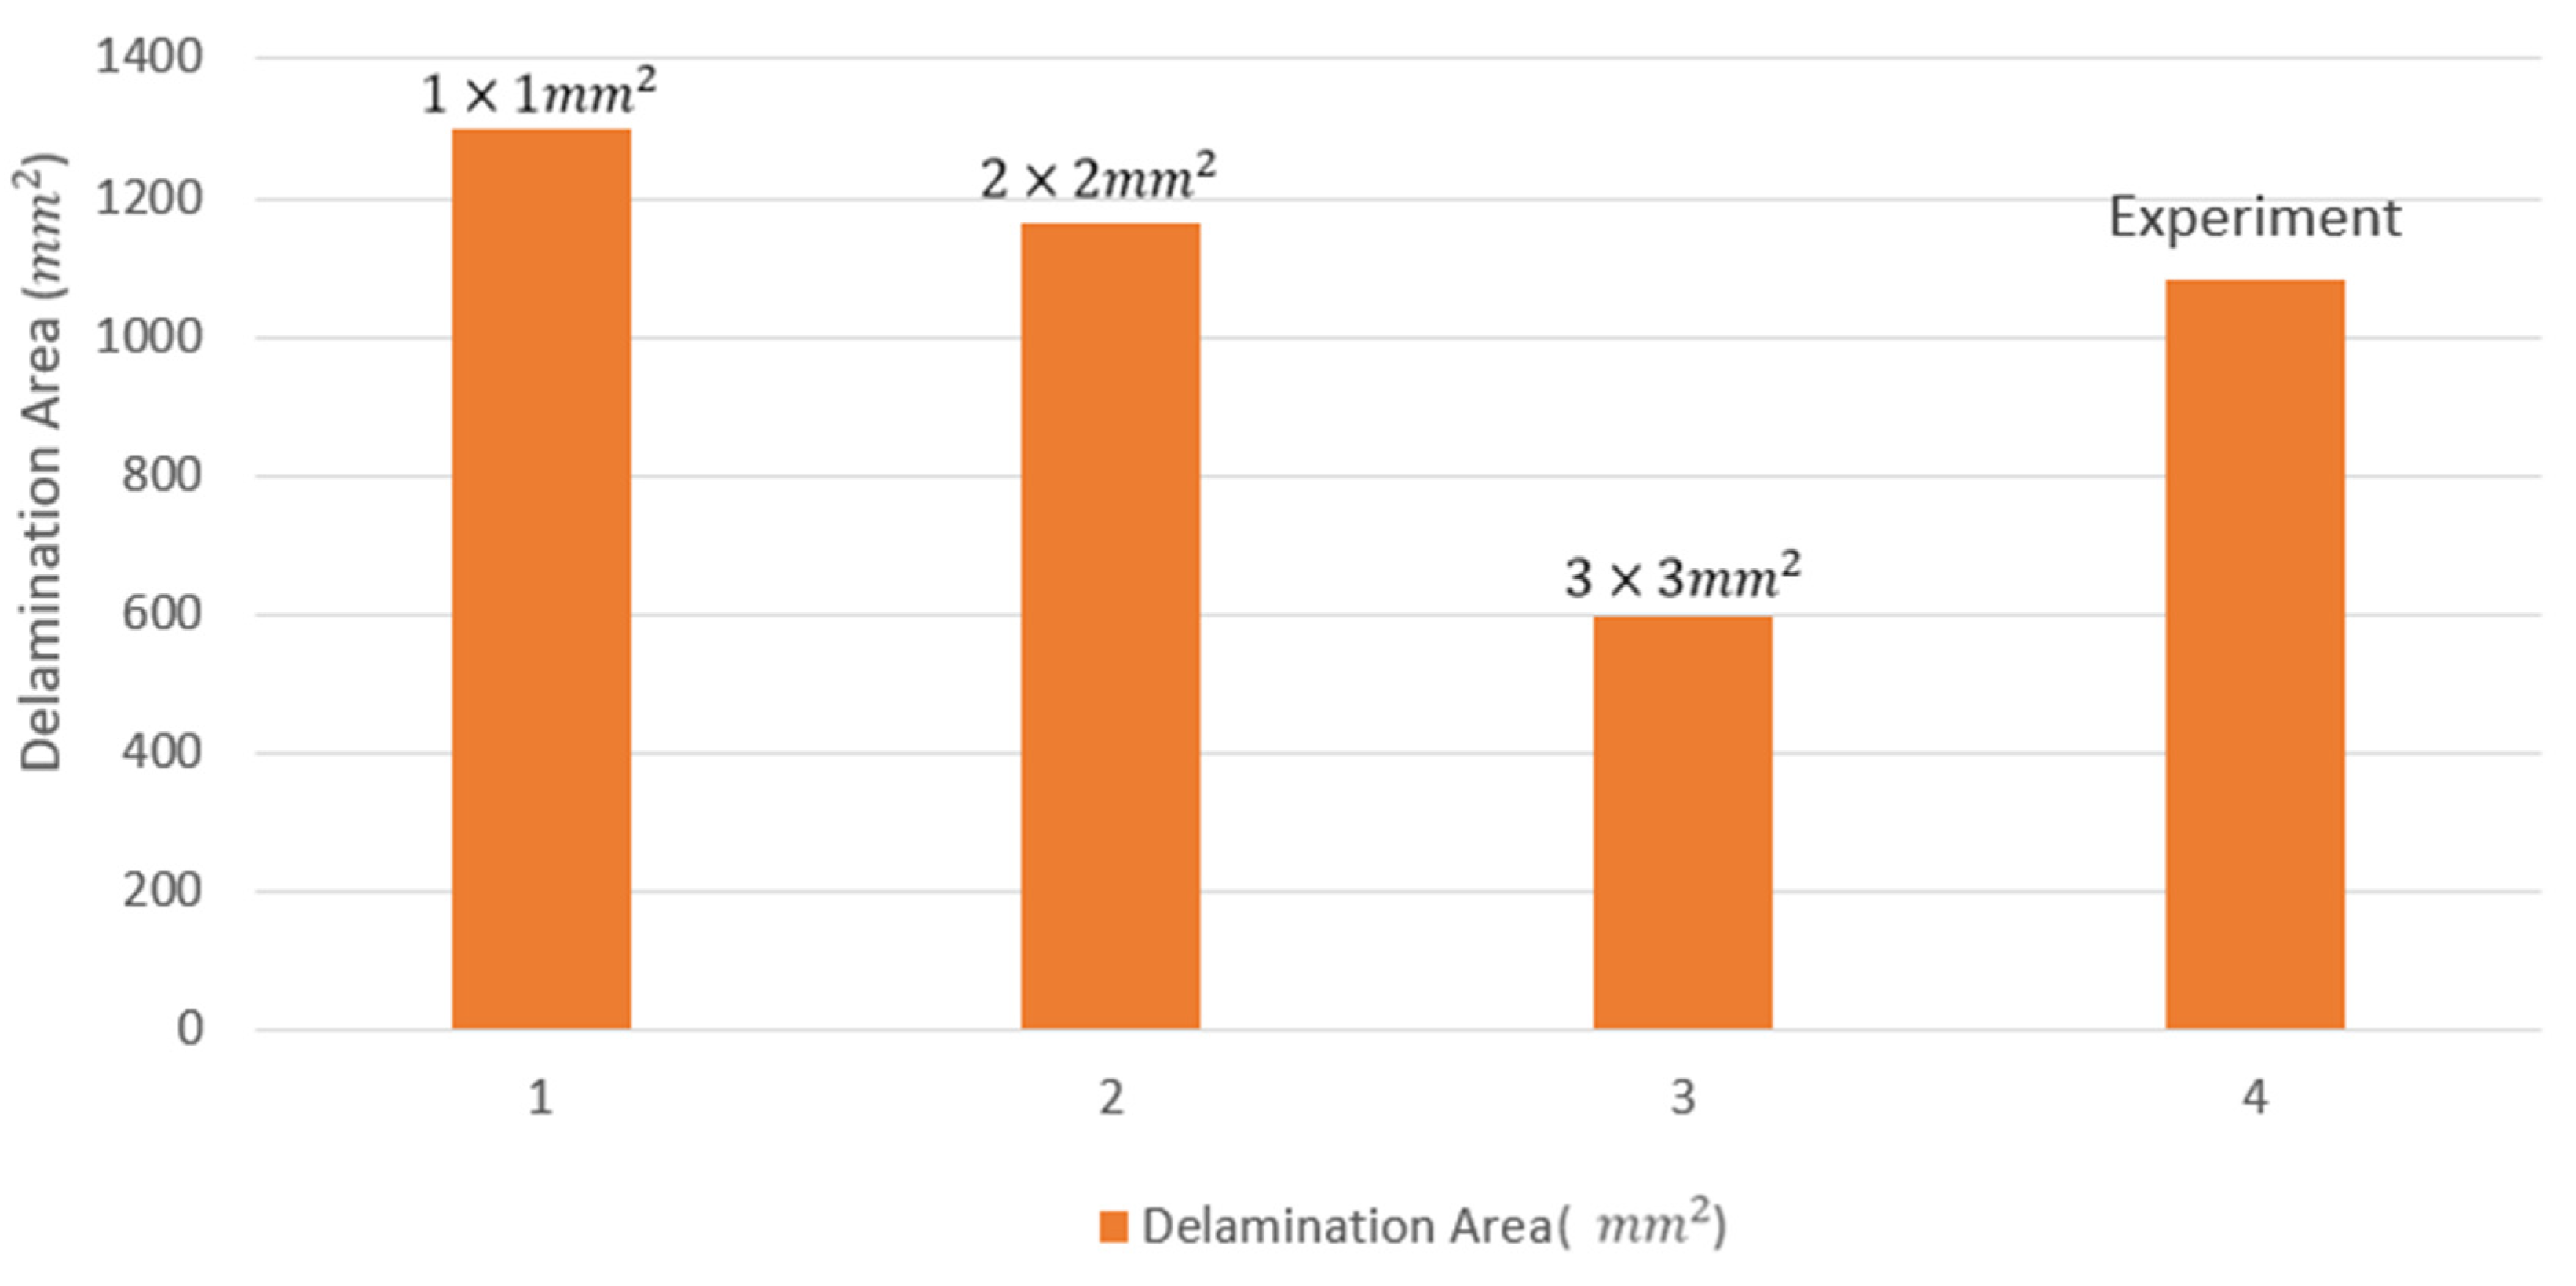
3.1. Mesh Convergency

In this section, three different mesh sizes are studied in the solid model. The selected dimensions for the mesh used in this study are 3 × 3   m m 2 ,   2 × 2   m m 2 and 1 × 1   m m 2 . Figure 4 shows the maximum strains determined by (or obtained from) numerical modeling by applying different mesh sizes to the model. In this analysis, the maximum strain obtained from the composite cylinders with the mesh size of 3 × 3   m m 2 is equal to 0.066 and the maximum strain for the models with 2 × 2   m m 2   a n d   1 × 1   m m 2 mesh size is 0.0242 and 0.0240, respectively. According to the experimental results, the maximum strain obtained during the low-velocity impact loading is 0.023 [40]; therefore, it can be concluded that the models with 2 × 2   m m 2   a n d   1 × 1   m m 2 mesh size reach both convergency and reasonable accuracy. Additionally, in numerical modeling, the difference between the calculation time of the model with 2 × 2   m m 2   a n d   1 × 1   m m 2 mesh size is significant. As shown in Figure 4, the calculation time for the model with 2 × 2   m m 2 mesh is 3 h, whereas the calculation time for the model with 1 × 1   m m 2 mesh is almost 16 h.
Figure 5 shows the results for the delamination area, based on the projection of all delaminated layers, obtained from both numerical modeling and experiments. According to the results shown in Figure 5, the model with a mesh size of 2 × 2   m m 2 is in good agreement with the experimental data, and considering the mesh convergency according to the strain results, while the model with 1 × 1   m m 2 could provide similar results. Considering both efficiency and accuracy, further investigations into other sections were performed by implementing the 2 × 2   m m 2 meshes in the numerical model. All delamination results were obtained at the last step of the numerical analysis, after the ending of the impact loading.
As shown in Figure 6, the predicted delamination area with mesh sizes selected as 1 × 1   m m 2 and 2 × 2   m m 2 is more accurate in comparison to the experimental results. On the other hand, it was previously observed that the model with the 1 × 1   m m 2 mesh size has an extremely high calculation time. The mesh size is acceptable for the current work considering both accuracy and efficiency [49]. By considering the mesh convergency, the further investigations presented in the other sections below were performed considering the 2 × 2   m m 2 mesh in the numerical model as a reference.

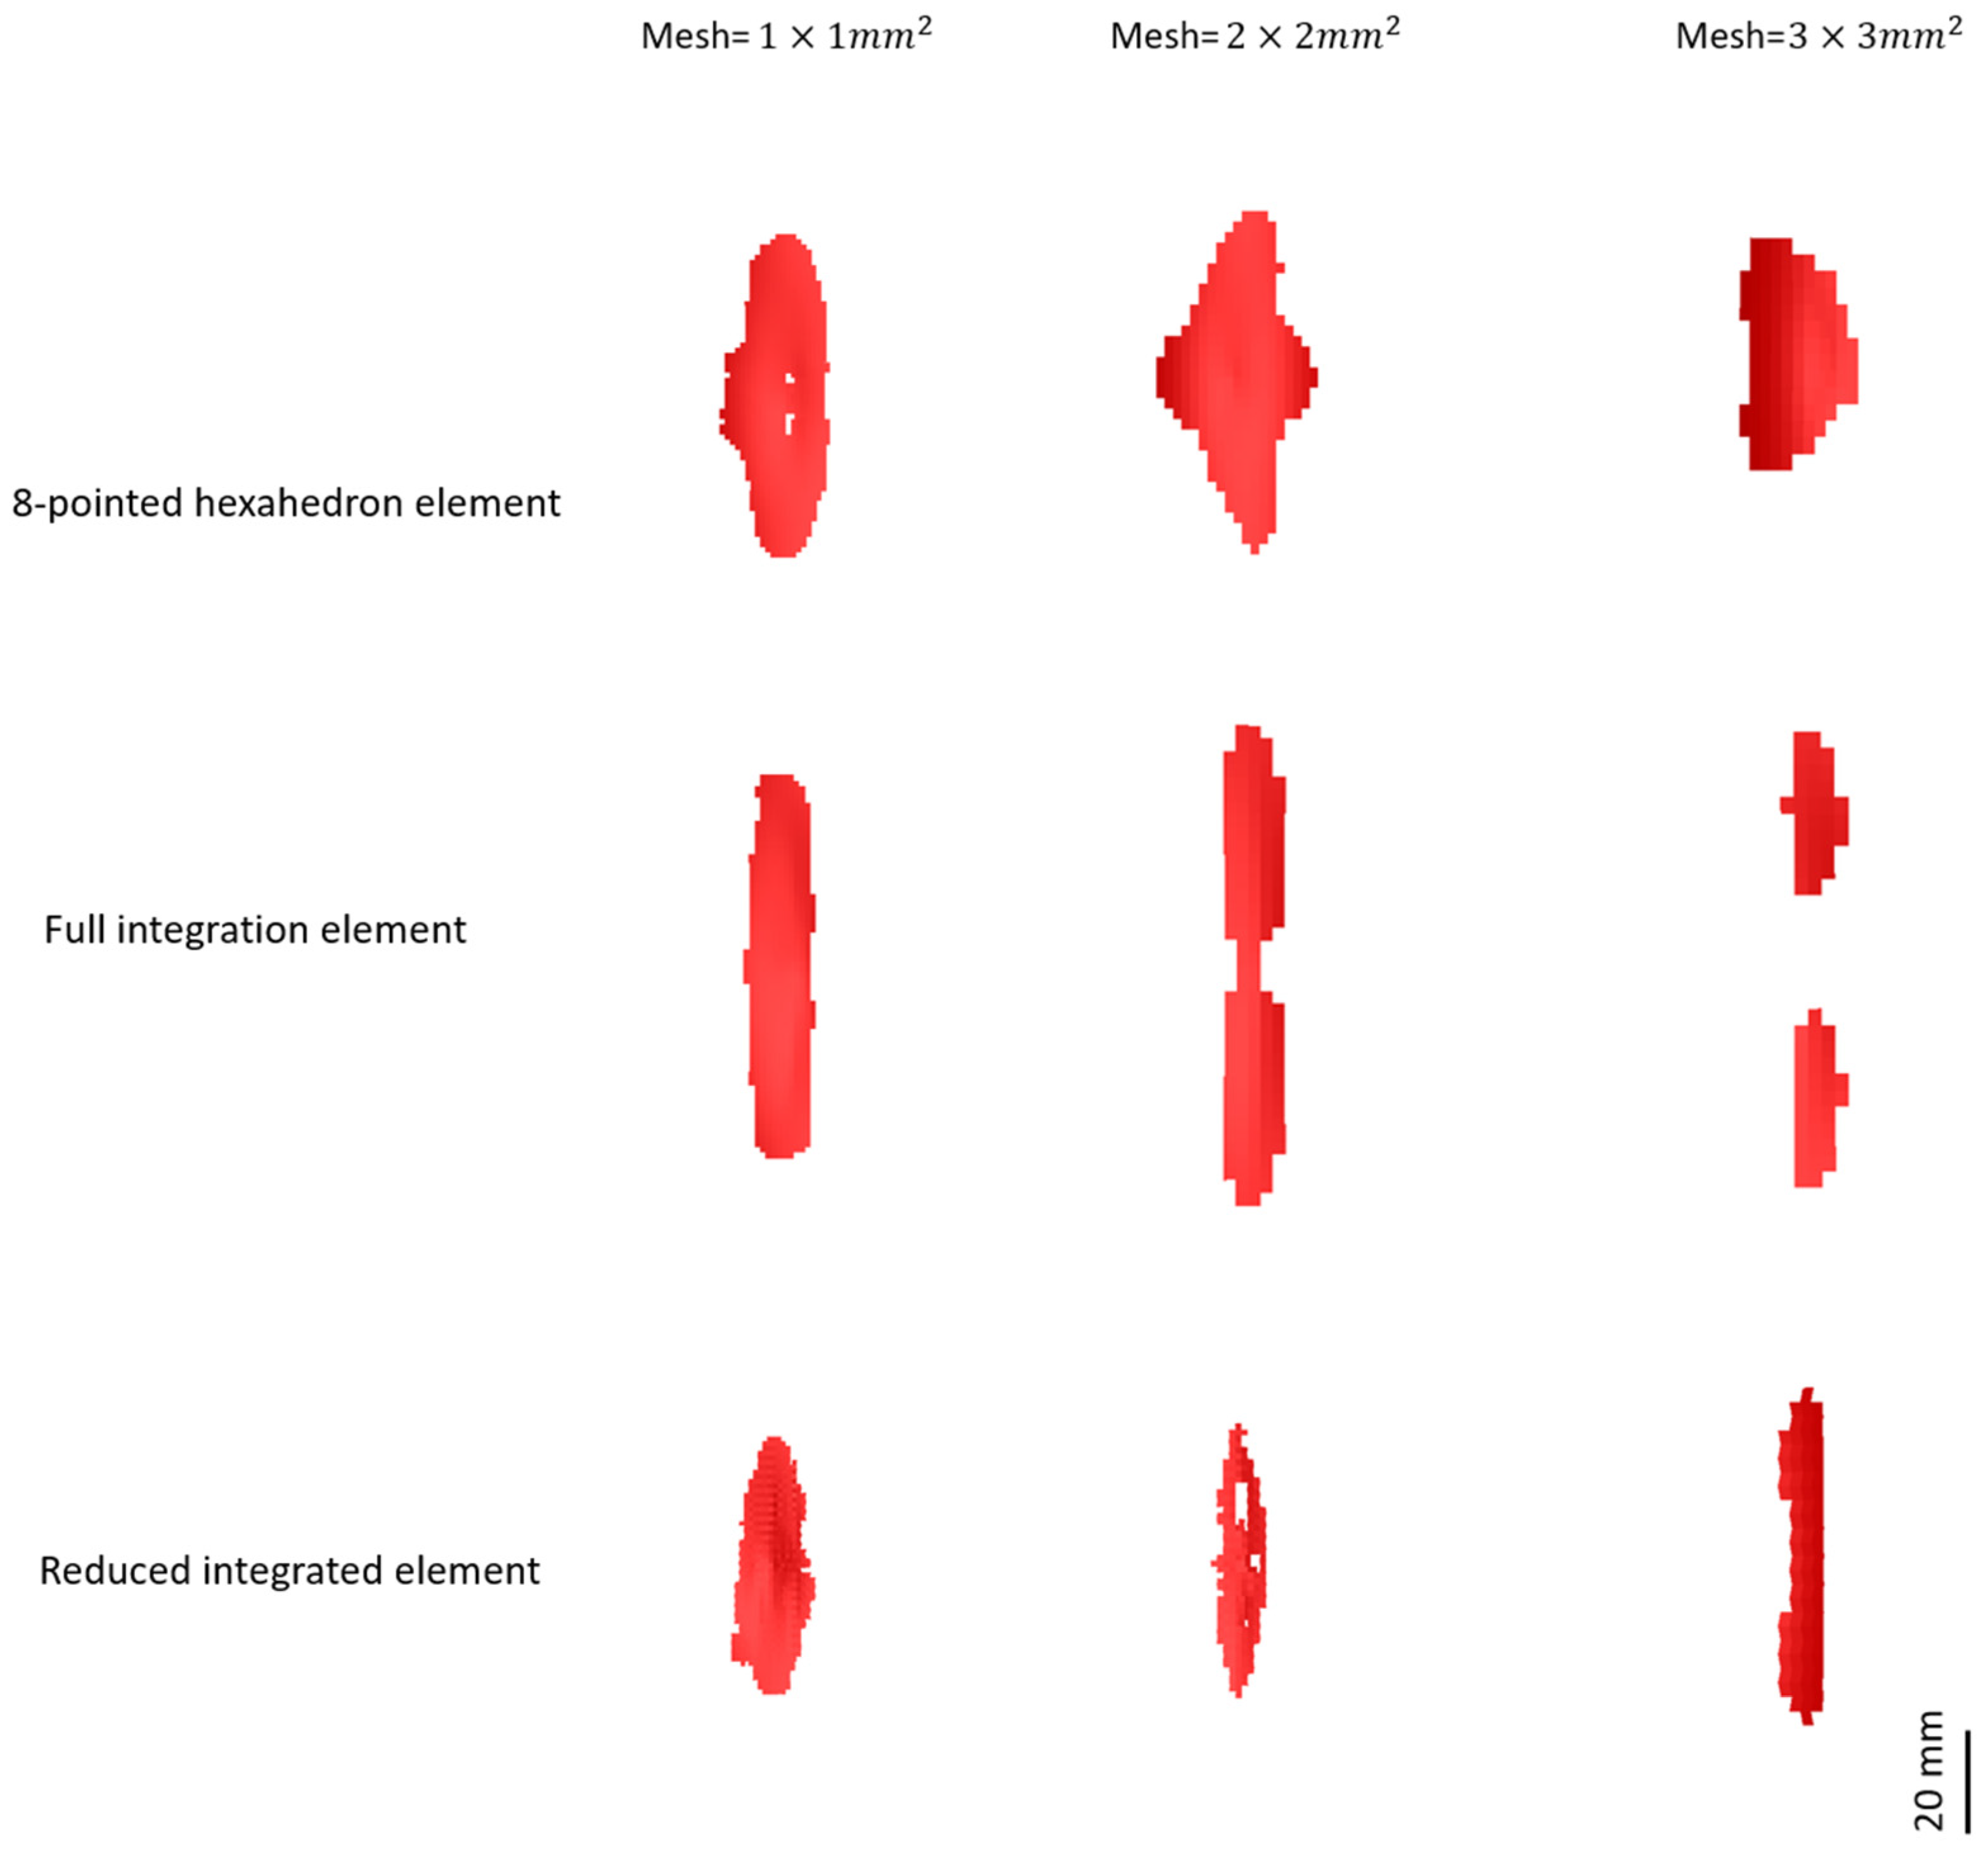
3.2. Mesh Size Effect on Different Element Types

In this section, different element types have been utilized in the model to investigate the impact of mesh size on the prediction of delamination. The element types incorporated in the model include fully integrated elements, reduced integration elements, and 8-point hexahedron elements. The different mesh sizes selected are as follows and as mentioned in the section above: 3 × 3   m m 2 ,   2 × 2   m m 2 , and 1 × 1   m m 2 .
The 8-point hexahedron solid element possesses a specific geometry and comprises eight integration points [50]. The fully integrated quadratic 8-node solid element features nodal rotation and includes six degrees of freedom at each node, with 14 integration points [51]. On the other hand, the reduced integrated solid element is an 8-node hexahedron solid element that incorporates tri-linear shape functions and utilizes one integration point located in the middle of each element [51].
Figure 7 shows the effect of mesh size in different element types for the prediction of the delamination area after impact loading.
Based on the data presented in Table 3, it is evident that the model utilizing 8-point hexahedron solid elements with a mesh size of 2 × 2 mm2 yields more precise results compared to the models employing reduced integration and fully integrated solid elements. Although the computational time of the model utilizing reduced integration solid elements is shorter than that of the other two element types, this particular element type fails to deliver accurate results for the delamination area.

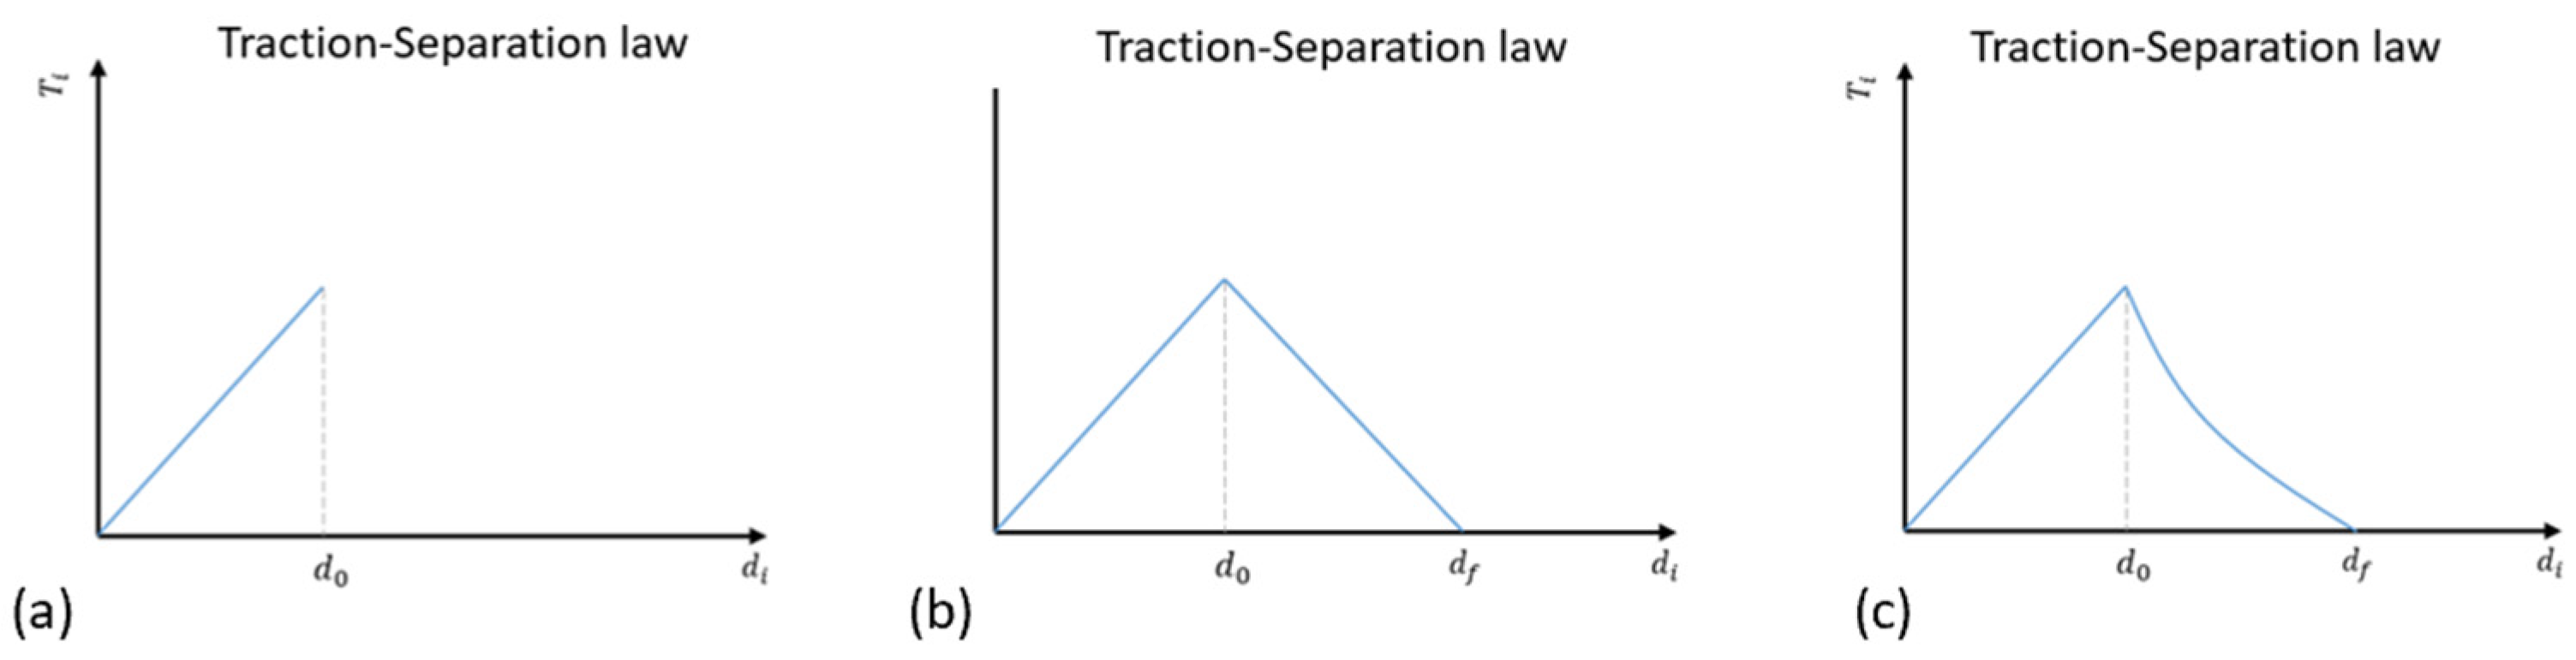
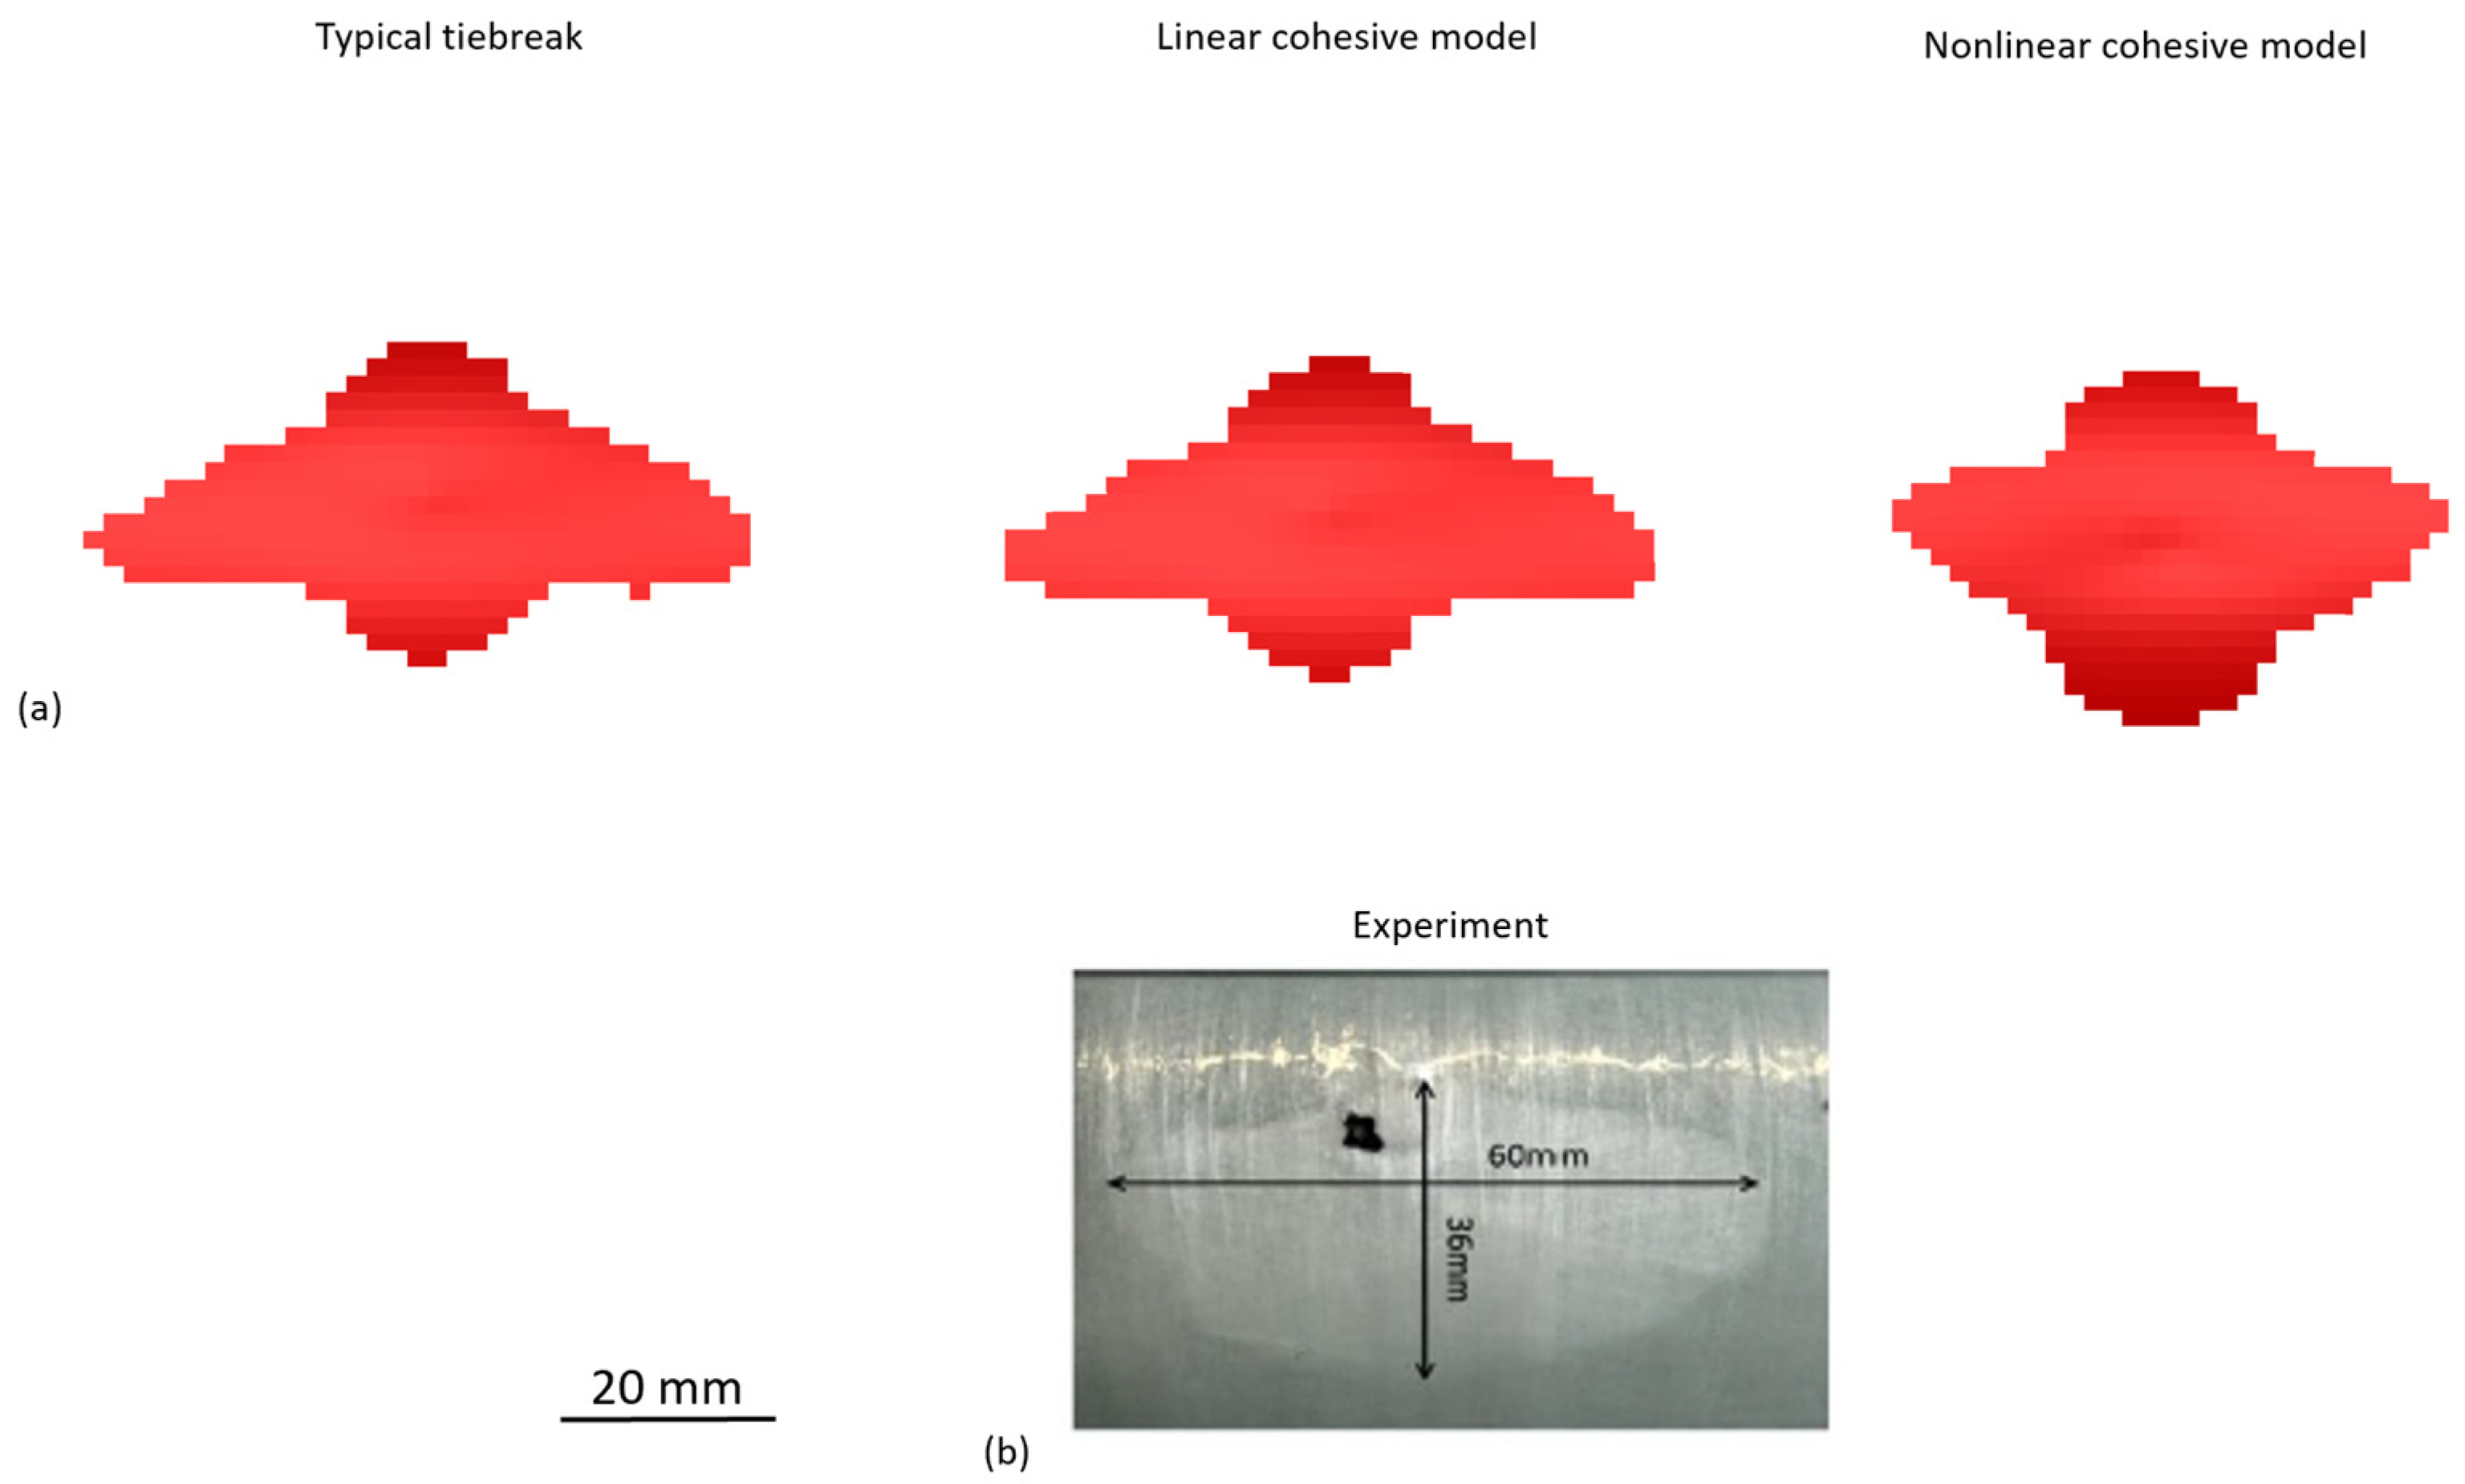
3.3. Interface Parameters

In the structural model employing solid elements, the composite cylinder is represented by four distinct layers, with the first and fourth layers denoting the inner and outer hoop layers, respectively. The second and third layers are characterized by rotational layups at angles of +15° and −15°, respectively. In order to establish connectivity between these layers, automatic surface-to-surface tiebreak contact conditions are imposed. In order to meticulously investigate delamination phenomena within the composite cylinder, the precise delineation of interface properties becomes imperative. To this end, three distinct types of cohesive behaviors are employed to govern interlaminar interactions, namely tiebreak, linear-cohesive, and non-linear-cohesive models. In tiebreak contact, failure occurs abruptly upon the satisfaction of specific conditions. Conversely, in the linear cohesive model, tiebreak contact is initially established between nodes; however, upon the initiation of failure, damage propagation follows a linear relationship with the initial contact distance. Accordingly, a parameter encompassing the critical distance at which interface failure culminates must be defined. This parameter (PARAM), in the context of linear cohesive behavior, is bounded within the range 0 ≤ PARAM ≤ 1, whereas in non-linear cohesive behavior, PARAM assumes a fixed value of 1. Notably, in non-linear cohesive behavior, the evolution of damage follows a non-linear function of the initial contact distance, necessitating the definition of normal and shear energy release rates to ascertain damage progression, as outlined in Table 2.
Given the absence of a defined damage evolution mechanism in tiebreak interface behavior, the outcomes of this model are limited to the instance of delamination initiation. As delineated in Table 4, the delamination area predicted by numerical simulations exceeds that observed experimentally. Conversely, upon employing linear cohesive behavior, depicted in Figure 3b, this analysis encompasses the evolution of damage subsequent to delamination initiation. Within this cohesive framework, delamination propagation follows a linear degradation pattern. Notably, the initiation of delamination in the linear cohesive model necessitates a higher energy input, thereby resulting in a smaller predicted delamination area compared to that derived from the tiebreak model.
The utilization of non-linear cohesive behavior in interface analysis, illustrated in Figure 3c, facilitates the examination of delamination growth. Given the reduced fracture energy release inherent to non-linear cohesive behavior, the resulting delamination area is correspondingly smaller compared to the linear analysis, as depicted in Figure 8.

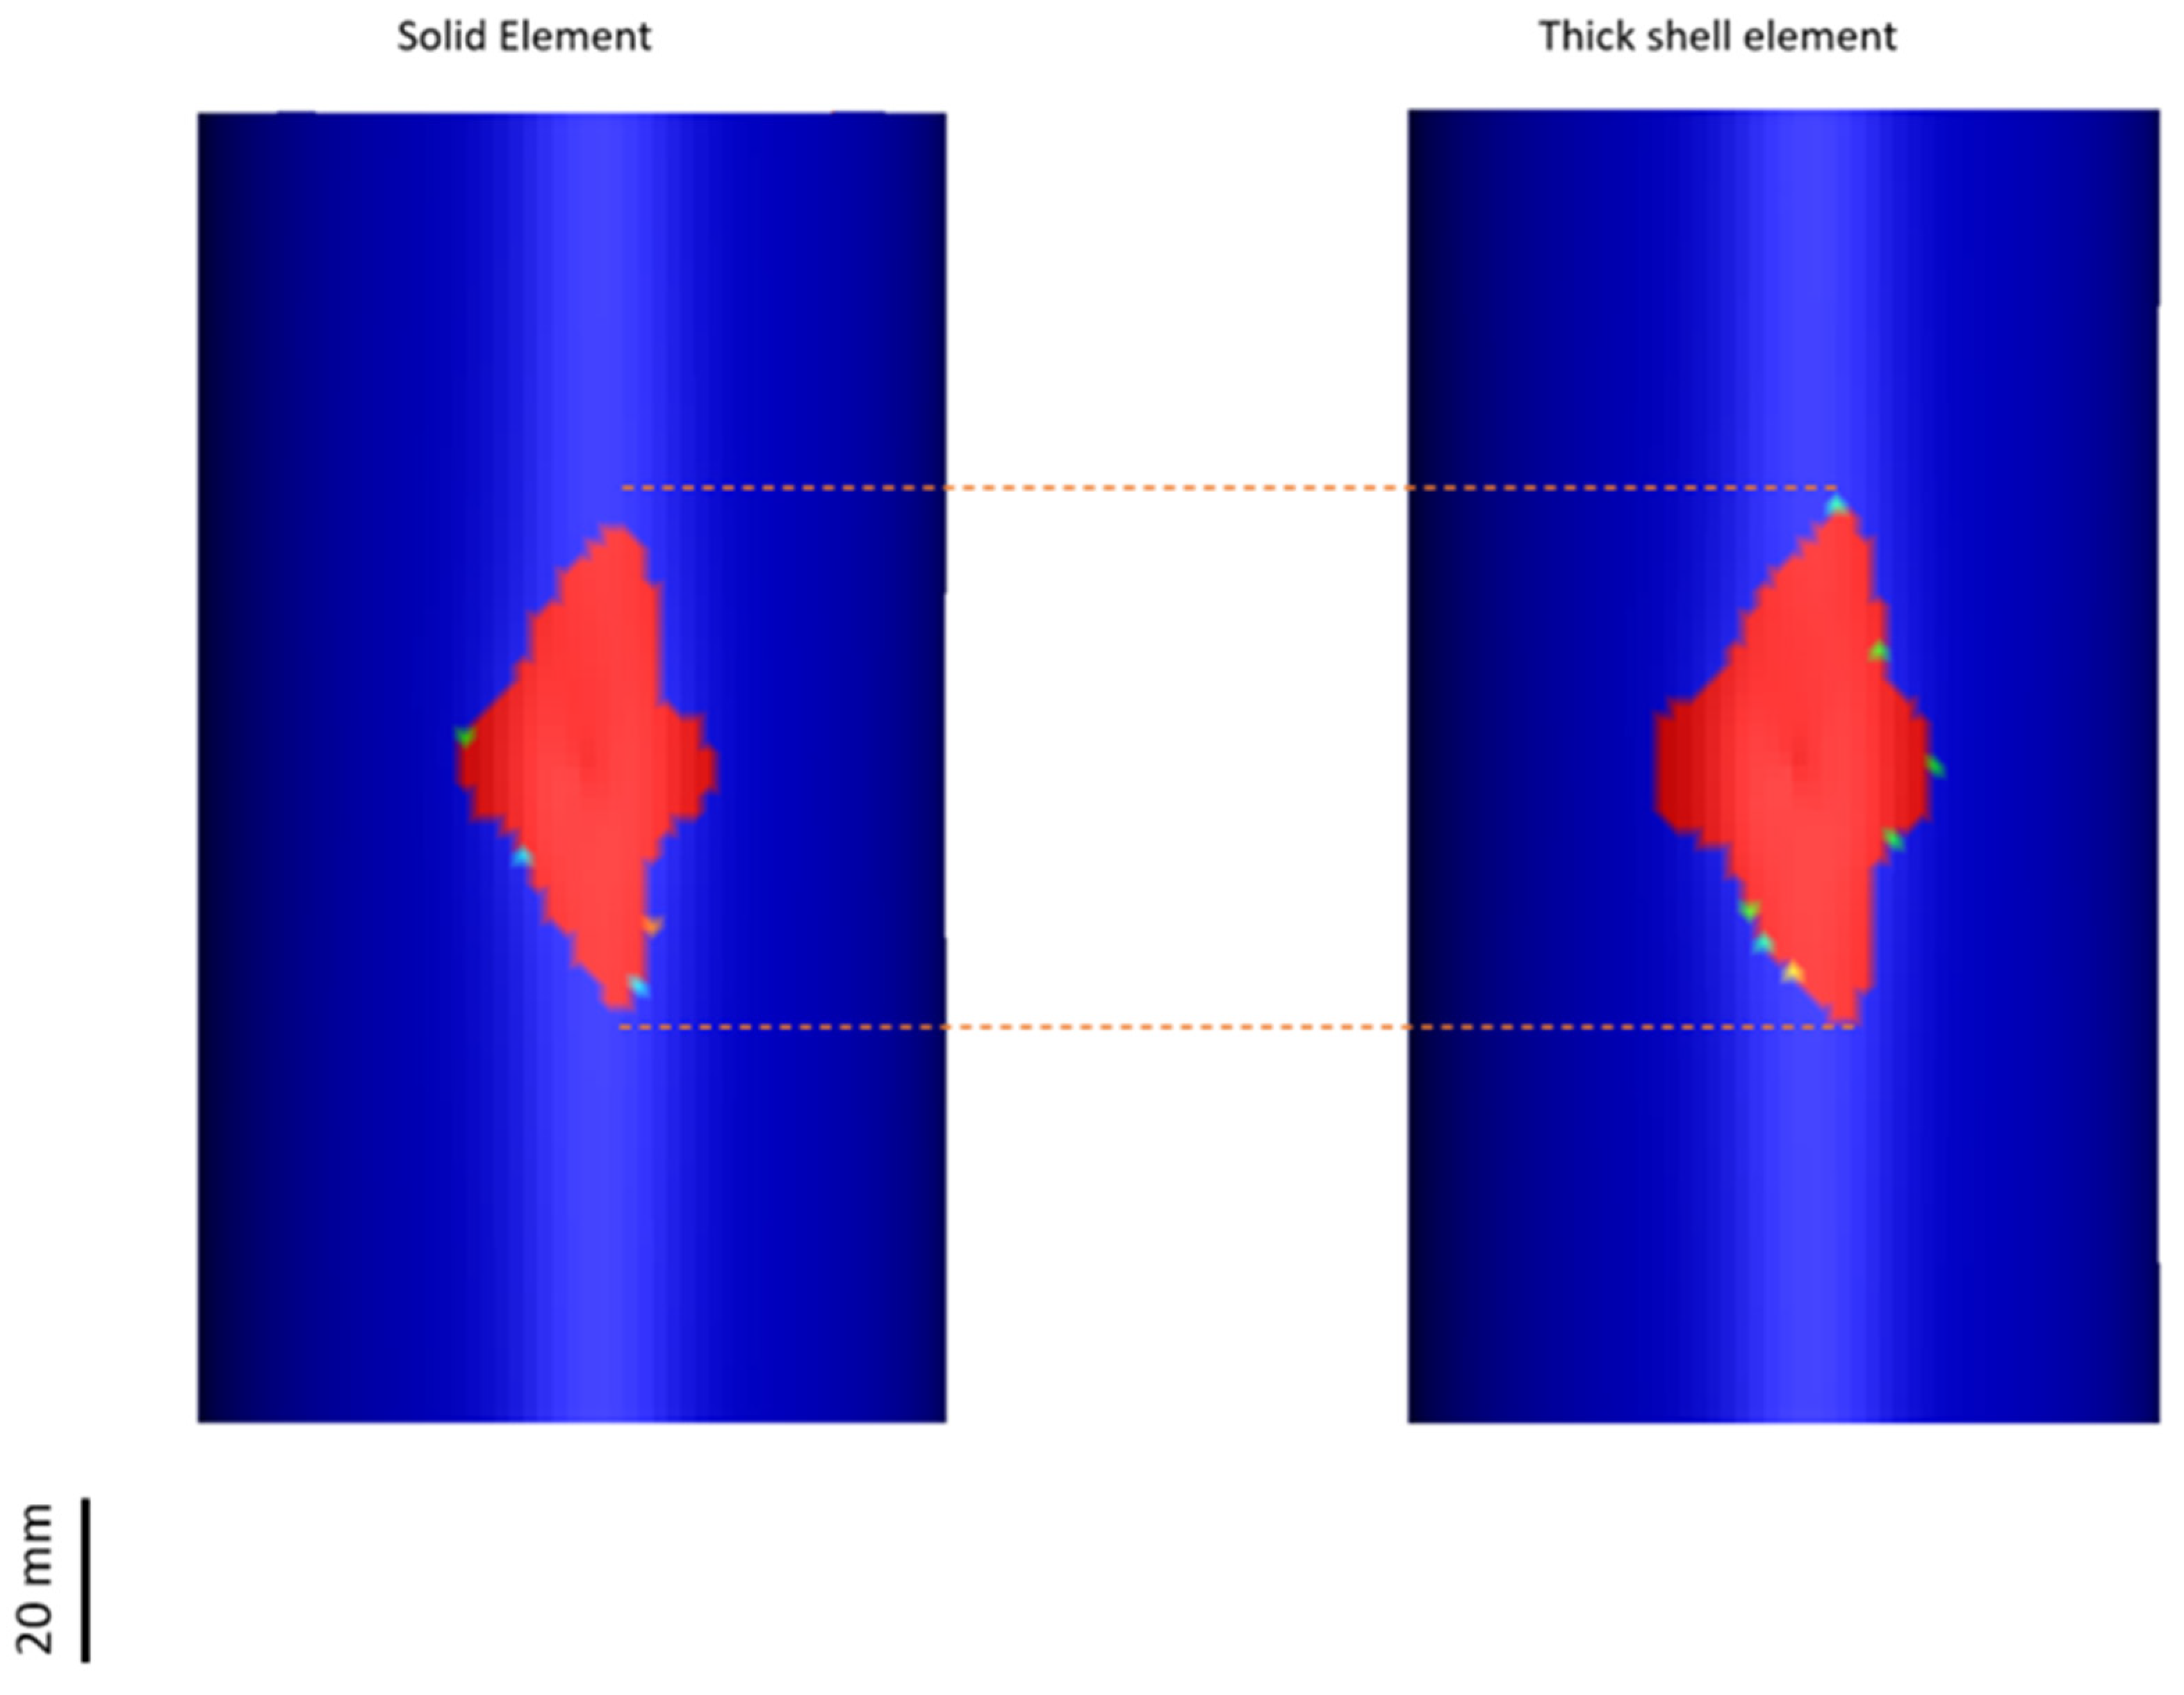
3.4. Different Element Types

In this section, the delamination results for the model with solid elements and the model with thick-shell elements have been compared. In the solid model, each layer has been generated separately and the model includes 2 × 2   m m 2 solid elements and the interface model is based on tiebreak behavior. In the model with thick-shell elements, the composite layers have been made separately including 2 × 2   m m 2 thick-shell elements. With solid elements, the analysis is performed by considering all integrated points in an element; with thick-shell elements, only middle integrated points are considered. Therefore, the model with solid elements is supposed to replicate complicated mechanical behaviors in comparison to the model with thick-shell elements.
The obtained results for the size of the delamination area are shown in Figure 9. As is already clearly visible in the data in Table 5, the model with thick-shell elements predicts a larger delamination area than the experimentally obtained area, and the model with solid elements predicts the area with a higher accuracy than the model with thick-shell elements.

3.5. Numerical Model with Shell Elements

In the current work, shell elements have been employed to model the composite cylinder. In this model, the composite cylinder has been modeled as one part shell structure and the composite layup has been defined as one part composite. The material model of MAT 054 has been utilized to define the composite material. Since the focus of the shell element is not along the thickness direction, the numerical analysis is performed based on the middle node and interpolation in each shell element, which may lead to non-smoothed and sudden failure in the results, while in solid elements, the failure process of all the nodes that generated the element can be considered in the calculation. On the other hand, considering the efficiency of the shell model, the calculation time is lower: 1 h for the shell model and 3 h for solid model. Hence, the shell model could save time in structures with geometry or material complexities.
The strain–time curves obtained from both experimental and numerical data are shown in Figure 10. For the measurement of the strain during the impact, a strain gauge was implemented inside the cylinder at the impact point, as seen in [40]. The maximum strain obtained from experimental results is equal to 0.023, the maximum strain obtained from the model with a solid element is 0.0242, and from the model with a shell element, it is 0.0293. The model with shell elements, therefore, overestimates the strain results while the solid model is in good agreement with the experimental data.

4. Conclusions

In this paper, a numerical model has been developed to analyze delamination failure in a fiber glass-reinforced composite cylinder subjected to low-velocity impact loading. A mesh convergency analysis was carried out as the first step to investigate the influence of mesh size on the prediction of the delamination area in the composite cylinder. By comparing the maximum strain for three different mesh sizes of 3 × 3   m m 2 ,   2 × 2   m m 2 , and 1 × 1   m m 2 , with experimental results as well as the computation time, the numerical model was able to achieve mesh convergency in the models with 2 × 2   m m 2 and 1 × 1   m m 2 elements. Additionally, it was determined that the model with 2 × 2   m m 2 mesh has a high accuracy in the prediction of the delamination area, and this mesh type was hence utilized in the subsequent studies.
  • Three types of interface properties have been applied in the model: tiebreak, linear, and non-linear cohesive behavior. The model with a tiebreak interface property shows a larger delamination area in comparison to the experimentally obtained area, while the model with linear cohesive properties predicts the damage area with high accuracy compared to the experiment. Regarding the model with non-linear cohesive behavior, a higher delamination area was found.
  • The capability of the two element types of a solid element and thick-shell element in the prediction of delamination have been studied, leading to the conclusion that the model with solid elements predicts the delamination area with higher accuracy.
A single-shell model has been created using a single-shell element along the thickness, which can detect non-smoothed and sudden failures in the results. However, the calculation time required by the single-shell model is lower than for the solid model, which could be advantageous in structures with a complex geometry or material complexities.

Author Contributions

Conceptualization, S.R.A., A.M., C.S. and D.M.; methodology, S.R.A. and D.M.; software, S.R.A.; validation, S.R.A.; formal analysis, S.R.A.; investigation, S.R.A.; resources, S.R.A.; data curation, S.R.A. and D.M.; writing—original draft preparation, S.R.A.; writing—review and editing, D.M., A.M., C.S.; visualization, S.R.A., D.M., A.M., C.S.; supervision, A.M., C.S.; project administration, A.M., C.S.; funding acquisition, A.M. All authors have read and agreed to the published version of the manuscript.

Funding

This research received no external funding.

Data Availability Statement

Data will be available upon request.

Conflicts of Interest

The authors declare no conflict of interest.

References

  1. Zheng, J.; Liu, X.; Xu, P.; Liu, P.; Zhao, Y.; Yang, J. Development of high pressure gaseous hydrogen storage technologies. Int. J. Hydrogen Energy 2012, 37, 1048–1057. [Google Scholar] [CrossRef]
  2. Azeem, M.; Ya, H.H.; Kumar, M.; Stabla, P.; Smolnicki, M.; Gemi, L.; Khan, R.; Ahmed, T.; Ma, Q.; Sadique, M.R.; et al. Application of filament winding technology in composite pressure vessels and challenges: A review. J. Energy Storage 2022, 49, 103468. [Google Scholar] [CrossRef]
  3. Rivard, E.; Trudeau, M.; Zaghib, K. Hydrogen storage for mobility: A review. Materials 2019, 12, 1973. [Google Scholar] [CrossRef]
  4. Xu, P.; Zheng, J.; Chen, H.; Liu, P. Optimal design of high pressure hydrogen storage vessel using an adaptive genetic algorithm. Int. J. Hydrogen Energy 2010, 35, 2840–2846. [Google Scholar] [CrossRef]
  5. Choi, I.H. Low-velocity impact response analysis of composite pressure vessel considering stiffness change due to cylinder stress. Compos. Struct. 2017, 160, 491–502. [Google Scholar] [CrossRef]
  6. Liao, B.; Jia, L.; Zhou, J.; Lei, H.; Gao, R.; Lin, Y.; Fang, D. An explicit–implicit combined model for predicting residual strength of composite cylinders subjected to low velocity impact. Compos. Struct. 2020, 247, 112450. [Google Scholar] [CrossRef]
  7. Gemi, D.S.; Şahin, S.; Gemi, L. Experimental investigation of the effect of diameter upon low velocity impact response of glass fiber reinforced composite pipes. Compos. Struct. 2021, 275, 114428. [Google Scholar] [CrossRef]
  8. Kim, S.-W.; Kim, E.-H.; Jeong, M.-S.; Lee, I. Damage evaluation and strain monitoring for composite cylinders using tin-coated FBG sensors under low-velocity impacts. Compos. Part B Eng. 2015, 74, 13–22. [Google Scholar] [CrossRef]
  9. Maziz, A.; Tarfaoui, M.; Gemi, L.; Rechak, S.; Nachtane, M. A progressive damage model for pressurized filament-wound hybrid composite pipe under low-velocity impact. Compos. Struct. 2021, 276, 114520. [Google Scholar] [CrossRef]
  10. Liao, B.; Jia, L. Finite element analysis of dynamic responses of composite pressure vessels under low velocity impact by using a three-dimensional laminated media model. Thin-Walled Struct. 2018, 129, 488–501. [Google Scholar] [CrossRef]
  11. Han, M.-G.; Chang, S.-H. Failure analysis of a Type III hydrogen pressure vessel under impact loading induced by free fall. Compos. Struct. 2015, 127, 288–297. [Google Scholar] [CrossRef]
  12. Weerts, R.A.J.; Cousigné, O.; Kunze, K.; Geers, M.G.D.; Remmers, J.J.C. A methodological approach to model composite overwrapped pressure vessels under impact conditions. Compos. Struct. 2021, 276, 114482. [Google Scholar] [CrossRef]
  13. Perillo, G.; Grytten, F.; Sørbø, S.; Delhaye, V. Numerical/experimental impact events on filament wound composite pressure vessel. Compos. Part B Eng. 2015, 69, 406–417. [Google Scholar] [CrossRef]
  14. Gemi, L.; Kayrıcı, M.; Uludağ, M.; Gemi, D.S.; Şahin, S. Experimental and statistical analysis of low velocity impact response of filament wound composite pipes. Compos. Part B Eng. 2018, 149, 38–48. [Google Scholar] [CrossRef]
  15. Zhao, X.; Liang, J.; Zhao, C.; Liu, J.; Li, Y.; Jiang, L.; Feng, J.; Xue, Y. Experimental and numerical analysis of low-velocity impact behavior of wound products using multi-filament winding technique. J. Mater. Res. Technol. 2023, 25, 7292–7306. [Google Scholar] [CrossRef]
  16. Farhood, N.H. Low velocity impact simulation of cylindrical section for type IV composite pressure vessels. AIP Conf. Proc. 2021, 2372, 150001. [Google Scholar]
  17. Allen, T.; Ahmed, S.; Hepples, W.; A Reed, P.; Sinclair, I.; Spearing, M. A comparison of quasi-static indentation and low-velocity impact on composite overwrapped pressure vessels. J. Compos. Mater. 2018, 52, 4051–4060. [Google Scholar] [CrossRef]
  18. Farhood, N.H.; Karuppanan, S.; Ya, H.H.; Ovinis, M. Experimental study of low velocity impact response of carbon/basalt hybrid filament wound composite pipes. Int. J. Struct. Stab. Dyn. 2018, 18, 1850089. [Google Scholar] [CrossRef]
  19. Farhood, N.H.; Karuppanan, S.; Ya, H.H.; Sultan, M. Experimental investigation on the effects of glass fiber hybridization on the low-velocity impact response of filament-wound carbon-based composite pipes. Polym. Polym. Compos. 2021, 29, 829–841. [Google Scholar] [CrossRef]
  20. Allen, T.M. Damage Development and Post-Impact Performance of Composite Overwrapped Pressure Vessels Subjected to Low Velocity Impact. Ph.D. Thesis, University of Southampton, Southampton, UK, 2017. [Google Scholar]
  21. Wu, Q.; Chen, X.; Fan, Z.; Jiang, Y.; Nie, D. Experimental and numerical studies of impact on filament-wound composite cylinder. Acta Mech. Solida Sin. 2017, 30, 540–549. [Google Scholar] [CrossRef]
  22. Long, B.; Yang, N.; Cao, X. Low-velocity impact damages of filament-wound composite overwrapped pressure vessel (COPV). J. Eng. Fibers Fabr. 2022, 17, 15589250221088895. [Google Scholar] [CrossRef]
  23. Xiao, J.; Shi, H.; Tao, L.; Qi, L.; Min, W.; Zhang, H.; Yu, M.; Sun, Z. Effect of fibres on the failure mechanism of composite tubes under low-velocity impact. Materials 2020, 13, 4143. [Google Scholar] [CrossRef] [PubMed]
  24. Sepetcioglu, H. Experimental study on the effect of graphene nanoplatelets on the low-velocity impact response of prestressed filament wound basalt-based composite pressure vessels. Polym. Compos. 2021, 42, 5527–5540. [Google Scholar] [CrossRef]
  25. Sepetcioglu, H.; Tarakcioglu, N. Fatigue behavior of graphene nanoplatelets reinforced and unreinforced basalt/epoxy composite pressure vessels subjected to low-velocity impact under internal pressure. J. Compos. Mater. 2021, 55, 4361–4373. [Google Scholar] [CrossRef]
  26. Shao, J.R.; Liu, N.; Zheng, Z.J. Numerical comparison between Hashin and Chang-Chang failure criteria in terms of inter-laminar damage behavior of laminated composite. Mater. Res. Express 2021, 8, 085602. [Google Scholar] [CrossRef]
  27. Chandekar, G.S.; Thatte, B.S.; Kelkar, A.D. On the behavior of fiberglass epoxy composites under low velocity impact loading. Adv. Mech. Eng. 2010, 2, 621406. [Google Scholar] [CrossRef]
  28. Hou, J.P.; Petrinic, N.; Ruiz, C. A delamination criterion for laminated composites under low-velocity impact. Compos. Sci. Technol. 2001, 61, 2069–2074. [Google Scholar] [CrossRef]
  29. Geubelle, P.H.; Baylor, J.S. Impact-induced delamination of composites: A 2D simulation. Compos. Part B Eng. 1998, 29, 589–602. [Google Scholar] [CrossRef]
  30. Borg, R.; Nilsson, L.; Simonsson, K. Simulation of delamination in fiber composites with a discrete cohesive failure model. Compos. Sci. Technol. 2001, 61, 667–677. [Google Scholar] [CrossRef]
  31. Camanho, P.P.; Davila, C.G.; de Moura, M.F. Numerical simulation of mixed-mode progressive delamination in composite materials. J. Compos. Mater. 2003, 37, 1415–1438. [Google Scholar] [CrossRef]
  32. Zheng, C.; Ren, M.; Zhao, W.; Chen, H. Delamination prediction of composite filament wound vessel with metal liner under low velocity impact. Compos. Struct. 2006, 75, 387–392. [Google Scholar]
  33. Turon, A.; Dávila, C.; Camanho, P.; Costa, J. An engineering solution for mesh size effects in the simulation of delamination using cohesive zone models. Eng. Fract. Mech. 2007, 74, 1665–1682. [Google Scholar] [CrossRef]
  34. Fleming, D.C.; Morrow, C.; Clarke, C.W.; Bird, C.E. Finite element simulation of delamination with application to crashworthy design. J. Am. Helicopter Soc. 2008, 53, 267–281. [Google Scholar] [CrossRef]
  35. Elmarakbi, A.M.; Hu, N.; Fukunaga, H. Finite element simulation of delamination growth in composite materials using LS-DYNA. Compos. Sci. Technol. 2009, 69, 2383–2391. [Google Scholar] [CrossRef]
  36. Dogan, F.; Hadavinia, H.; Donchev, T.; Bhonge, P. Delamination of impacted composite structures by cohesive zone interface elements and tiebreak contact. Cent. Eur. J. Eng. 2012, 2, 612–626. [Google Scholar] [CrossRef]
  37. Di Caprio, F.; Saputo, S.; Sellitto, A. Numerical-experimental correlation of interlaminar damage growth in composite structures: Setting cohesive zone model parameters. Adv. Mater. Sci. Eng. 2019, 2019, 1–16. [Google Scholar] [CrossRef]
  38. Roberts, E.M.; Justusson, B.; Schaefer, J.; Wanthal, S.P. Improved benchmarking of cohesive elements in abaqus standard for predicting disbond and delamination in composite structures. In Proceedings of the AIAA Scitech 2021 Forum, Online, 11–15 & 19–21 January 2021. [Google Scholar]
  39. Weerts, R.; Cousigné, O.; Kunze, K.; Geers, M.; Remmers, J. Novel material model to predict the residual strength of a composite overwrapped pressure vessel after impact. Int. J. Impact Eng. 2022, 160, 104055. [Google Scholar] [CrossRef]
  40. Skaar, M.W. Modeling and Testing of Impact Damage in Composite Pressure Vessels. Master’s Thesis, Norwegian University of Science and Technology, Trondheim, Norway, 2015. [Google Scholar]
  41. McElroy, M.; Andre, A.; Goode n, T.; Costa, S.; Olsson, R. Use of enriched shell elements compared to solid elements for modelling delamination growth during impact on composites. Compos. Struct. 2021, 269, 113945. [Google Scholar] [CrossRef]
  42. Tawk, I.; Navarro, P.; Ferrero, J.-F.; Barrau, J.-J.; Abdullah, E. Composite delamination modelling using a multi-layered solid element. Compos. Sci. Technol. 2010, 70, 207–214. [Google Scholar] [CrossRef]
  43. Remmers, J.J.C.; Wells, G.N.; de Borst, R. A solid-like shell element allowing for arbitrary delaminations. Int. J. Numer. Methods Eng. 2003, 58, 2013–2040. [Google Scholar] [CrossRef]
  44. Zhi, J.; Tay, T.-E. Explicit modeling of matrix cracking and delamination in laminated composites with discontinuous solid-shell elements. Comput. Methods Appl. Mech. Eng. 2019, 351, 60–84. [Google Scholar] [CrossRef]
  45. de Borst, R.; Remmers, J.J. Computational modelling of delamination. Compos. Sci. Technol. 2006, 66, 713–722. [Google Scholar] [CrossRef]
  46. Khalili, S.; Soroush, M.; Davar, A.; Rahmani, O. Finite element modeling of low-velocity impact on laminated composite plates and cylindrical shells. Compos. Struct. 2011, 93, 1363–1375. [Google Scholar] [CrossRef]
  47. Her, S.-C.; Liang, Y.-C. The finite element analysis of composite laminates and shell structures subjected to low velocity impact. Compos. Struct. 2004, 66, 277–285. [Google Scholar] [CrossRef]
  48. LSTC. LS-DYNA Keywords User Manual; Livermore Software Technology Corporation: Livermore, CA, USA, 2007. [Google Scholar]
  49. Kivity, Y.; Ben-Dor, G.; Anteby, I.; Sadot, O. The blast wave resulting from an accidental explosion in an ammunition magazine. In Proceedings of the International Symposium on Military Aspects of Blast and Shock Conference, Calgary, AB, Canada, 2–6 October 2006. [Google Scholar]
  50. Ko, Y.; Bathe, K.-J. A new 8-node element for analysis of three-dimensional solids. Comput. Struct. 2018, 202, 85–104. [Google Scholar] [CrossRef]
  51. Kim, D.; Ng, W.; Hwang, O.; Sohn, J.; Lee, E. Recommended finite element formulations for the analysis of offshore blast walls in an explosion. Lat. Am. J. Solids Struct. 2018, 15, e115. [Google Scholar] [CrossRef]
Figure 1. Numerical model generated for the impact loading on the composite cylinder: (a) the model with solid elements; (b) the model with shell elements.
Jcs 08 00141 g001
Figure 2. The numerical model for the composite cylinder with various mesh sizes defined in the numerical model: (a) 1 × 1   m m 2 ; (b) 2 × 2   m m 2 ; (c) 3 × 3   m m 2 .
Jcs 08 00141 g002
Figure 3. Traction–separation curves of (a) tiebreak behavior; (b) linear cohesive behavior; (c) non-linear cohesive behavior.
Jcs 08 00141 g003
Figure 4. Maximum strain and calculation time for the model with three different mesh sizes (columns 1–3). Data from experiments are shown in column 4.
Jcs 08 00141 g004
Figure 5. (a) The delamination area marked in red obtained in the numerical model with three different mesh sizes; (b) the delamination area obtained from experiment [40].
Jcs 08 00141 g005
Figure 6. Delamination area in different mesh size.
Jcs 08 00141 g006
Figure 7. Effect of three different mesh sizes in different element types on the size of the predicted delamination area marked in red. Scale bar as indicated.
Jcs 08 00141 g007
Figure 8. The delamination area after impact loading. (a) The delamination area (marked in red) obtained in the numerical model with the three different interface properties: typical tiebreak, linear cohesive model, and non-linear cohesive model. (b) The experimentally obtained delamination area [40].
Jcs 08 00141 g008
Figure 9. The delamination area marked in red obtained from the numerical model with two different element types: solid element and thick-shell element.
Jcs 08 00141 g009
Figure 10. Strain–time curves for numerical analysis using two different elements (solid elements with mesh size of 2 × 2 mm2 and tiebreak model for the interface) marked in blue and shell elements (marked in green) and experimental results (marked in orange).
Jcs 08 00141 g010
Table 1. Material properties for glass fiber composite showing the stacking sequence for the studied vessel [40].
Layer No.OrientationThickness (mm)
1 90 ° 0.759
2 + 15 ° 1.013
3 15 ° 1.013
4 90 ° 0.759
Table 2. Cohesive parameters and material properties used in the numerical FE-model [40].
Material PropertiesValue
Glass fiber composite
Elastic modulus E 1 = 44.8   G P a ,   E 2 = E 3 = 12.1   G P a
Shear modulus G 12 = G 13 = G 23 = 3.4   G P a
Poisson’s ratio υ 12 = υ 13 = 0.3 ,   υ 23 = 0.5
Density 1230   K g m 3
Failure initiation stress X t = 1006   M P a ,   X c = 487   M P a ,
Y t = 46   M P a ,   Y c = 132   M P a
S 12 = S 13 = S 23 = 42   M P a
Cohesive parameters
Elastic modulus of cohesive elements E n n = 12.1   G P a ,   E s s = E t t = 3.4   G P a
Failure initiation stress t n c = 46   M P a ,   t s c = t t c = 49.5   M P a
Critical strain energy release rates G I c = 0.83   N m m 1 ,   G Ι Ι c = 1.80   N m m 1
Steel
Elastic modulus E = 200   G P a
Density 7800   K g m 3
Table 3. Effect of mesh size in different element types on delamination area prediction.
Dimensions8-Point HexahedronFully Integrated
Quadratic 8-Node
Reduced IntegrationExperiment
Mesh size ( m m 2 )1 × 12 × 23 × 31 × 12 × 23 × 31 × 12 × 23 × 3
Length (mm)62634167756054536260
Wide (mm)213729111081211836
Area (mm2)130211655957376804806485834961080
difference compared to experimental results in %207.84531.73755404654
Table 4. Delamination area dimensions obtained from numerical model and experiment.
DimensionsTiebreakLinear Cohesive ModelNonlinear Cohesive ModelExperiment
Length (mm)63595660
Width (mm)37353736
Area (mm2)1165103210361080
Size difference compared to experimental results in %7.84.44.0
Table 5. The delamination area dimensions obtained from the numerical model for solid and thick-shell elements and experimental results.
DimensionsModel with Solid ElementsModel with Thick Shell ElementsExperiment
Length (mm)596960
Width (mm)353836
Area (mm2)103213111080
Size difference compared experimental results in %4.421.4
Disclaimer/Publisher’s Note: The statements, opinions and data contained in all publications are solely those of the individual author(s) and contributor(s) and not of MDPI and/or the editor(s). MDPI and/or the editor(s) disclaim responsibility for any injury to people or property resulting from any ideas, methods, instructions or products referred to in the content.

