1. Introduction
The use of composite materials in aerospace engineering has revolutionized aircraft design, offering significant advantages in terms of weight reduction, structural efficiency, and performance. Composite stiffened structures, made of a combination of composite skin and stiffening elements, are commonly employed in fuselage and wing assemblies to withstand aerodynamic loads while minimizing weight. The buckling load of these structures can be considerably lower than their ultimate failure load.
However, the post-buckling behavior of composite stiffened panels represents a complex and challenging phenomenon. The cyclic loads may induce significant out-of-plane displacements, which in turn may trigger the initiation and propagation of fatigue cracks, compromising the structural integrity and potentially leading to failure. Without accurate predictive models, the full potential of composite materials in aerospace applications is hindered, as designers are compelled to rely on conservative design approaches that compromise the weight-saving benefits of composite materials.
Numerous studies can be found in the literature addressing the problem of numerically simulating fatigue delamination growth in composite materials, but often these works are limited to small specimens at the coupon level. The fatigue analysis of composite structures in post-buckling loading conditions remains an unresolved challenge.
The heterogeneous nature of composite materials, coupled with strain localization, presents a considerable challenge in accurately predicting and understanding failure mechanisms in composite laminates [
1]. Delamination growth is often addressed as a crack propagation phenomenon, adapting approaches initially devised for metallic materials. For example, Paris’ law [
2] is frequently employed to establish a relationship between the crack growth rate and the energy release rate or stress intensity factor during the loading cycle. Numerous numerical methods have emerged with the goal of incorporating Paris’ law into Finite Element (FE) analyses. Several researchers [
3,
4,
5,
6,
7] have utilized the Virtual Crack Closure Technique (VCCT) to determine the energy release rate and subsequently the crack growth rate according to Paris’ law. This methodology was recently integrated into the FE software ABAQUS [
8] and has proven effective in analyzing fatigue-induced delamination at the coupon level [
9]. On the other hand, Cohesive Zone Model (CZM) approaches represent a widely used alternative that offers some advantages over VCCT. Despite requiring a more detailed discretization compared to VCCT, this technique has the capability to simulate both damage initiation and growth, while the VCCT is limited to only damage propagation. CZM methodologies, originally developed for quasi-static loading conditions [
10,
11,
12,
13], have been later extended to incorporate degradation resulting from cyclic loading by integrating Paris’ law into the constitutive model [
14,
15,
16,
17,
18,
19,
20].
Regardless of the approach (VCCT or CZM), to simulate constant amplitude fatigue loading conditions in a FE analysis, the “envelope load method” [
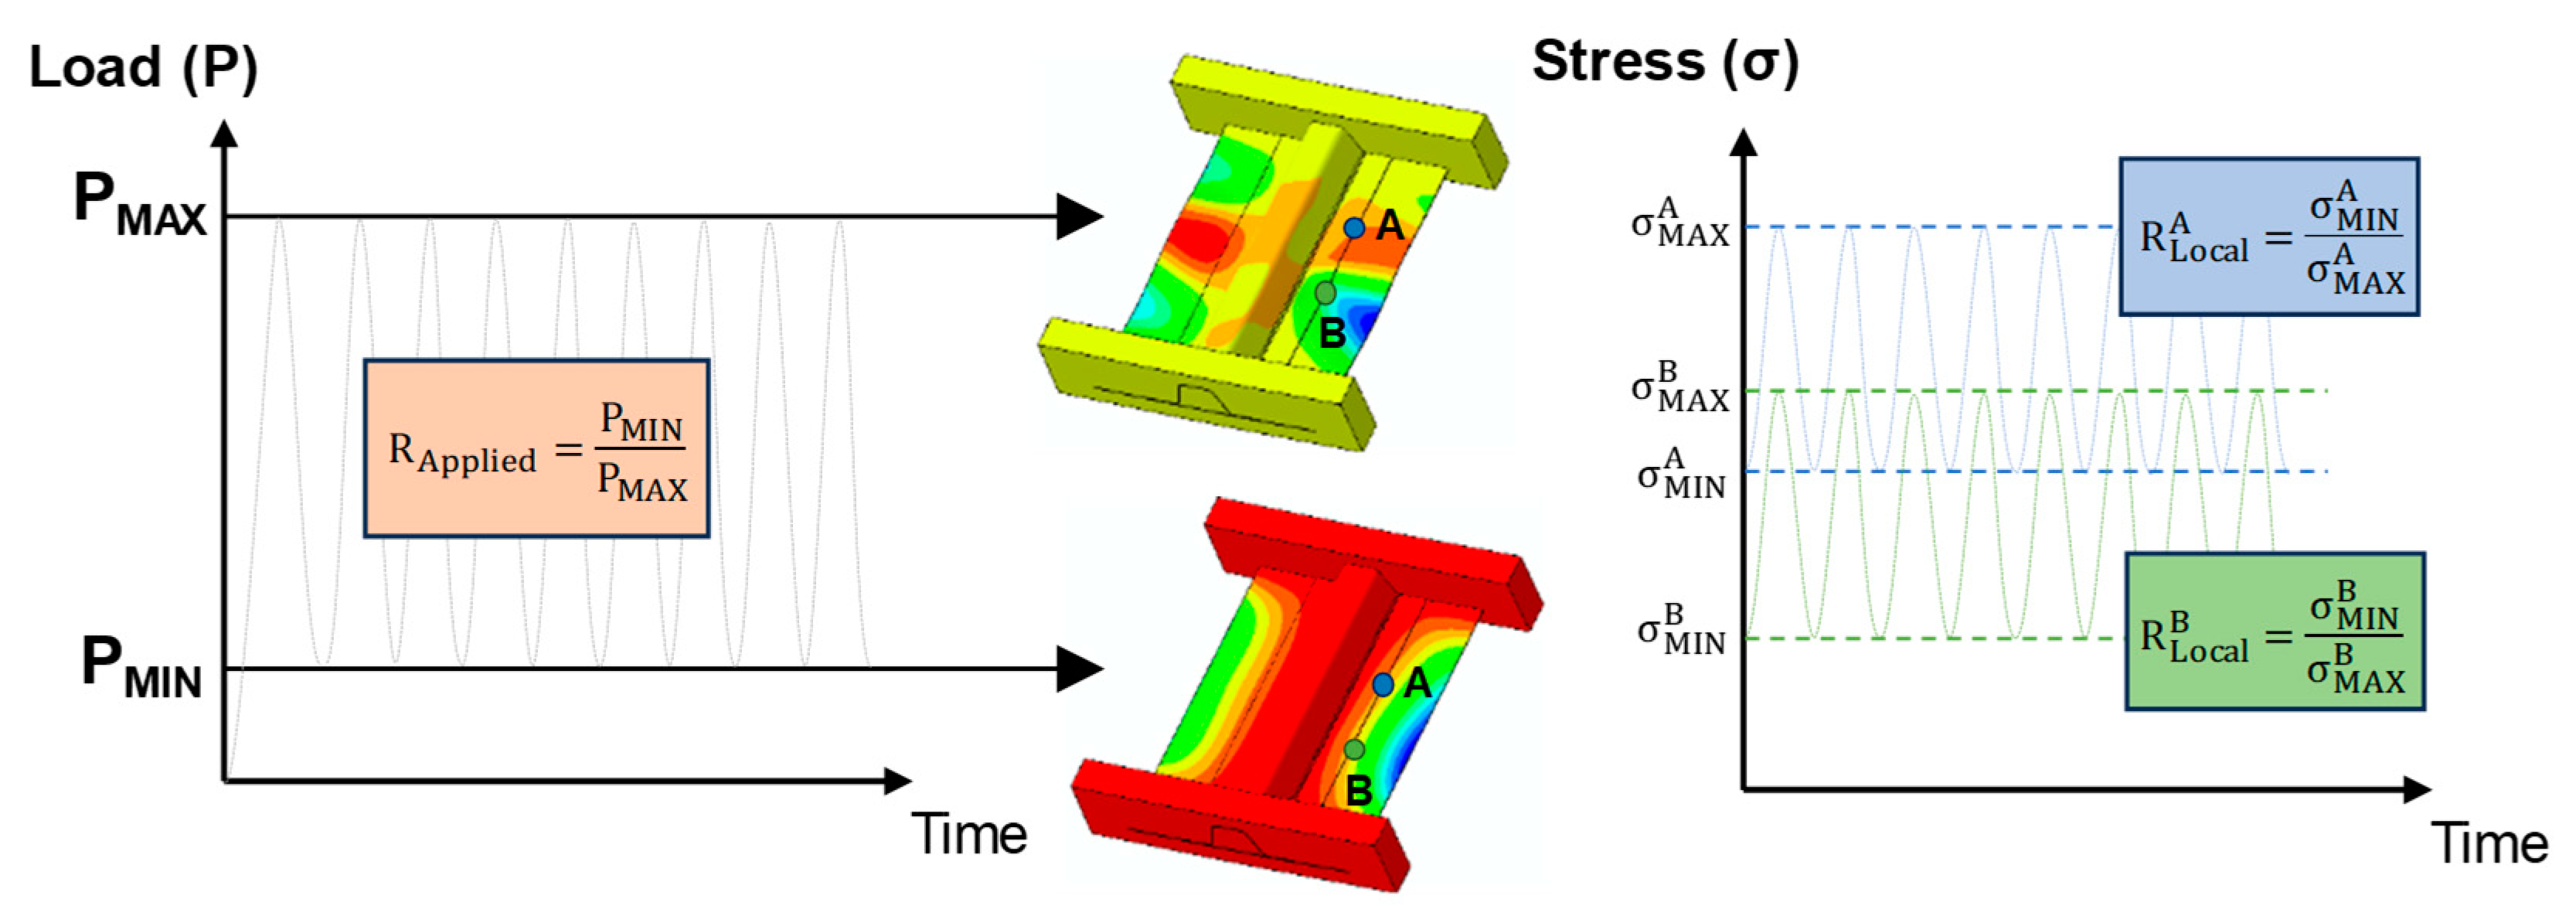
21] is usually adopted. To save computational times, instead of numerically simulating the entire load variation during a fatigue cycle, the structure is subjected to a constant load equal to the maximum load, with information regarding the minimum load embedded in the damage model using the applied load ratio, the ratio between the minimum and maximum applied load during the fatigue cycle (
RApplied =
Pmin/
Pmax). However, the crack propagation rate does not depend on the variation of the applied (external) load, but rather on the change of the stress state at the crack tip resulting from the applied load. It is possible to define the local stress ratio as the ratio between the minimum and maximum stress value at the crack tip or, alternatively, as the square root of the ratio between the minimum and the maximum energy release rate values (
RLocal =
σmin/
σmax = (
Gmin/
Gmax)
0.5). The assumption that
RApplied is equal to
RLocal represents a major drawback of the approaches based on the “envelope load method”.
To address this limitation, a numerical technique, named the “Min–Max Load Approach”, has been introduced to assess the local stress ratio during fatigue analysis [
22,
23]. The methodology has been validated using the literature’s experimental data from coupon tests, such as Double Cantilever Beam (DCB) and Mixed-Mode Bending (MMB) specimens, and a modified version of the MMB specimen where the loading conditions were modified to produce a variable local stress ratio. The approach has been then applied to simulate the propagation of a skin–stringer separation in a composite stiffened panel subjected to compressive loads, with the results compared against experimental data taken from the literature.
In this paper, a numerical study on fatigue delamination growth in a Single-Stringer Compression (SSC) specimen subjected to post-buckling fatigue load is performed using the “Min–Max Load Approach”. Compared to previous research activities, in this paper, the developed numerical methodology is validated with results obtained from an extensive in-house experimental testing campaign, which provided access to unique data not available in the literature [
24]. Few works of research can be found in the literature where the buckling and post-buckling behavior of composite stiffened structures under fatigue compressive loads is experimentally investigated for different type of stringer [
25,
26]. The SSC specimen was conceived to emulate the performance of large multi-stringer panels commonly found in fuselage structures [
27]. While compact in size and computationally manageable, this specimen enables the creation of detailed numerical models capable of encompassing all damage modes observed in corresponding multi-stringer panels. Several experimental test campaigns were conducted on SSC specimens with a focus on examining the damage tolerance and fatigue life of specimens with initial delamination or indentation damage [
28,
29]. However, the experimental studies in the literature focus solely on a particular combination of load level and loading ratio, whereas various combinations of these parameters are analyzed in [
24].
In
Section 2, the importance of calculating the local stress ratio for fatigue damage propagation analysis is discussed in detail.
Section 3 outlines the developed “Min–Max Load Approach”, and briefly summarizes the cohesive fatigue damage formulation used in this work.
Section 4 describes the geometry and FE model of the SSC specimen, while
Section 5 presents the numerical results of a quasi-static analysis conducted to validate the FE model of the SSC specimen.
Section 6 reports the outcomes of the fatigue analysis and compares them with the experimental data. Finally, in
Section 7 the results in terms of local stress ratio are discussed.
2. Local Stress Ratio
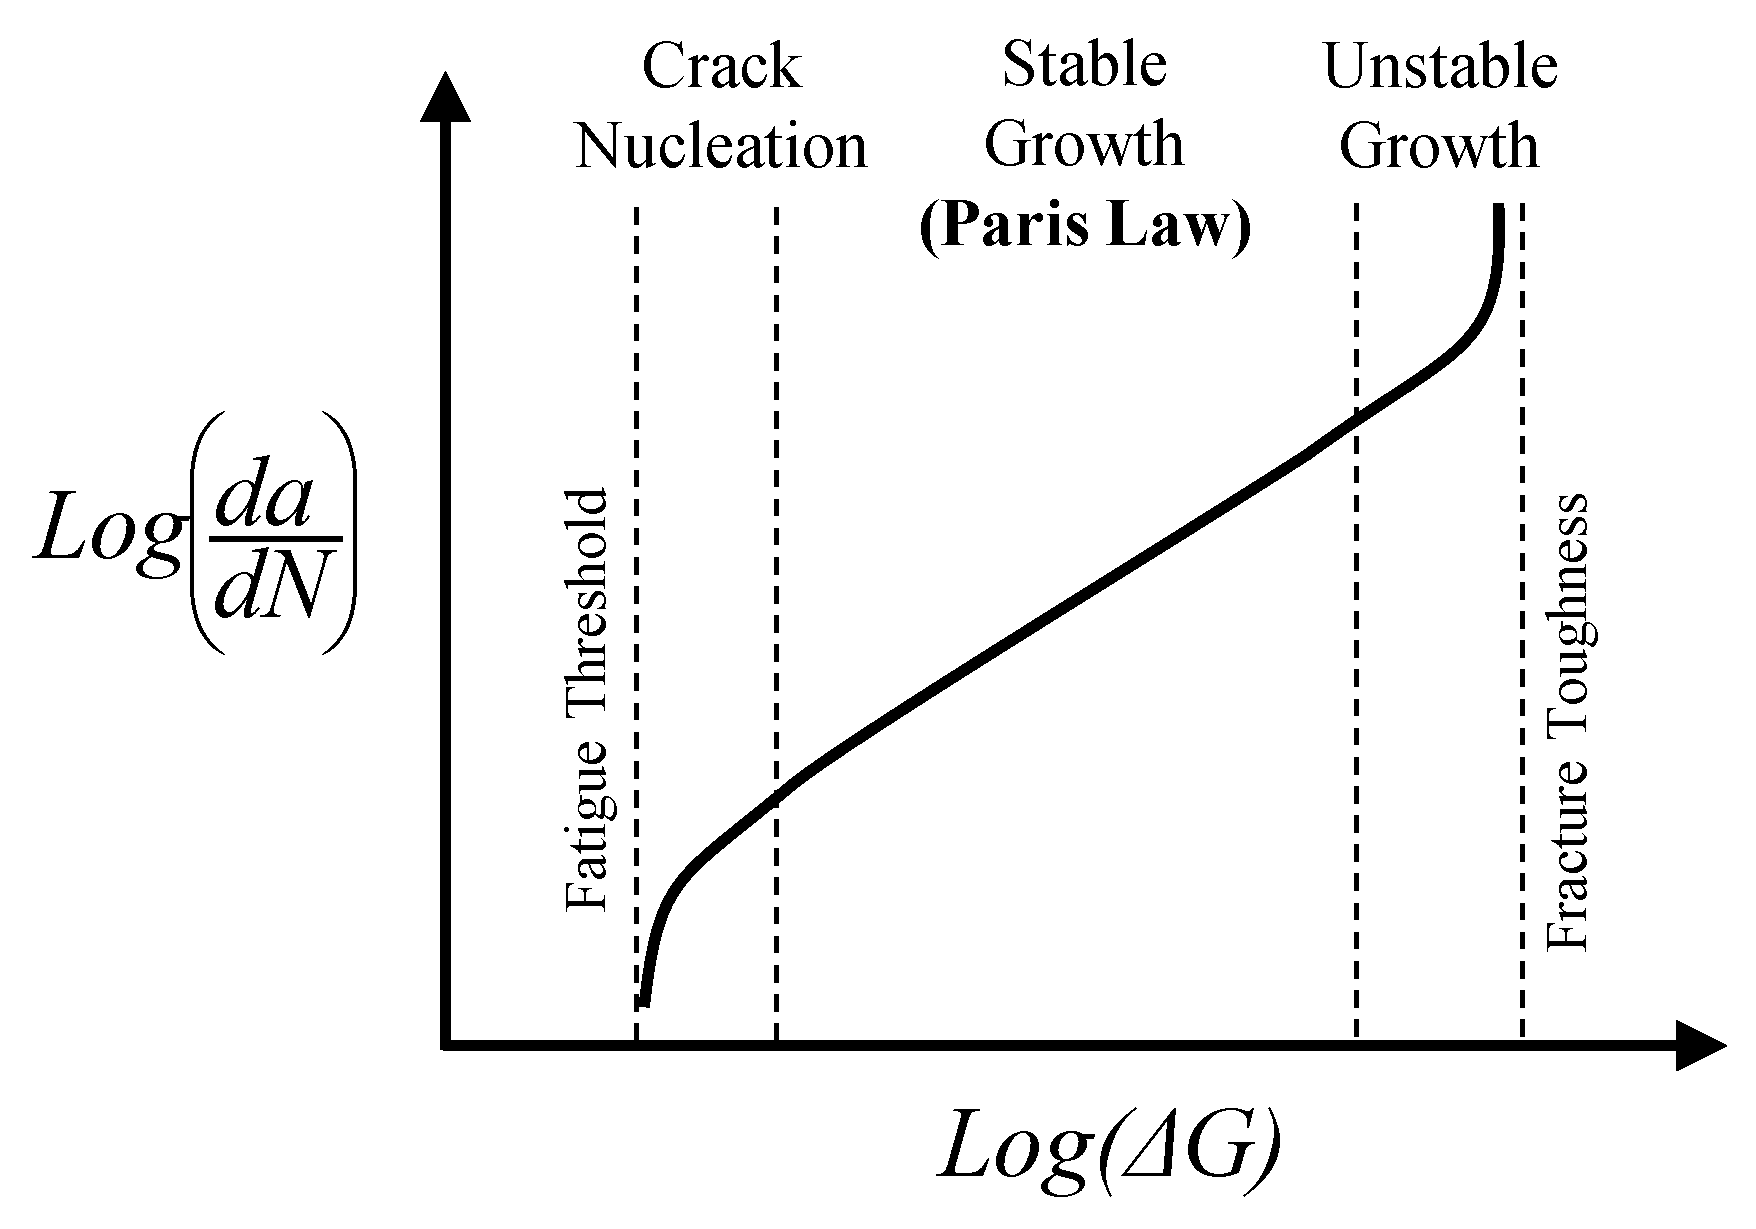
Fatigue delamination growth is typically analyzed using fracture mechanics approaches where the delamination growth rate (
da/
dN) is related to the Energy Release Rate (
ΔG) as shown in
Figure 1, where a typical fatigue crack growth curve is reported.
The behavior shown in
Figure 1 can be divided into three distinct regions. In the first region, characterized by a sharp drop in the growth rate, the crack starts to nucleate. In the second region, the log-linear behavior indicates a stable growth of the delamination, while in the third region, the crack propagation becomes unstable. The stable crack propagation observed in the second region is governed by Paris’ law [
2], which in its most basic form is represented by the following equation:
where
a is the crack length,
N is the number of cycles,
f(
ΔG) is a function of the variation of the Energy Release Rate during the load cycle (
ΔG =
Gmax −
Gmin), and
C and
m are experimentally determined parameters that depend on the material and load conditions. Paris’ law, initially developed for fatigue crack evolution in metallic materials, is now commonly used in numerical methodologies for predicting delamination growth in composite materials.
In fatigue analysis, numerical methodologies are often implemented together with the “envelope load method” [
21]. To save computational resources, rather than simulating the full load variation for every cycle, only the maximum load is modeled. The load variation is accounted for, within the adopted damage model, through a predefined parameter, known as the applied (external) load ratio, which is the ratio between the minimum and maximum applied load during a single fatigue cycle, represented by the following equation:
Indeed, by simulating the structure only in the maximum load configuration, it is not possible to retrieve information on the state of stress at the crack tip when the structure is subjected to the minimum load of a fatigue cycle. It is therefore assumed that the deformed shape remains consistent between the minimum and maximum load, with the stresses scaled by a factor equal to the applied load ratio. To address these uncertainties, including variations in strength and life data, environmental effects, and uncertainties in load application, safety factors are employed at every stage of composite structure design, mirroring traditional practices for metal structures. These safety factors typically ensure a high level of reliability, although not quantifiable.
As shown in Equation (1), the crack propagation rate is highly dependent on the variation of the state of stress at the crack tip, namely the “local stress ratio”, the ratio between the minimum and the maximum value of the stress at the crack tip or, alternatively, the square root of the ratio between the minimum and the maximum value of the energy release rate, as represented by the following equation:
In the “envelope load method”, it is assumed that the local stress ratio is equal to the applied (external) load ratio and remains constant during crack propagation.
This assumption is generally verified for simple structures at the coupon level; however, for more complex specimens and loading conditions, where the stresses are not proportional to the external load, it is not fulfilled. When the structure is subjected to two or more non-synchronized loads, or when stiffened structures are loaded in post-buckling fatigue conditions, resulting in changes to the buckling mode shape between the maximum and the minimum load of the fatigue cycle [
29,
30,
31], the applied (external) load ratio is different from the local stress ratio which changes along the delamination front and during the propagation of the delamination.
In
Figure 2, a graphical representation illustrates why evaluating the local stress ratio in stiffened structures subjected to post-buckling fatigue is necessary.
As the deformed shape changes in the post-buckling regime, points A and B along the delamination front of the skin–stringer separation locally undergo two different load oscillations. Therefore, the two points are subjected to two distinct local stress ratios, both different from the applied load ratio. It is evident that employing the applied load ratio to calculate the crack growth rate would result in an inaccurate prediction of damage propagation. Indeed, the local stress ratio varies not only across different points along the crack front but also changes as the delamination propagates, altering the post-buckling shape of the specimen. In contrast, the applied load ratio remains constant and does not correspond to the local stress ratio at any point.
3. Min–Max Load Approach
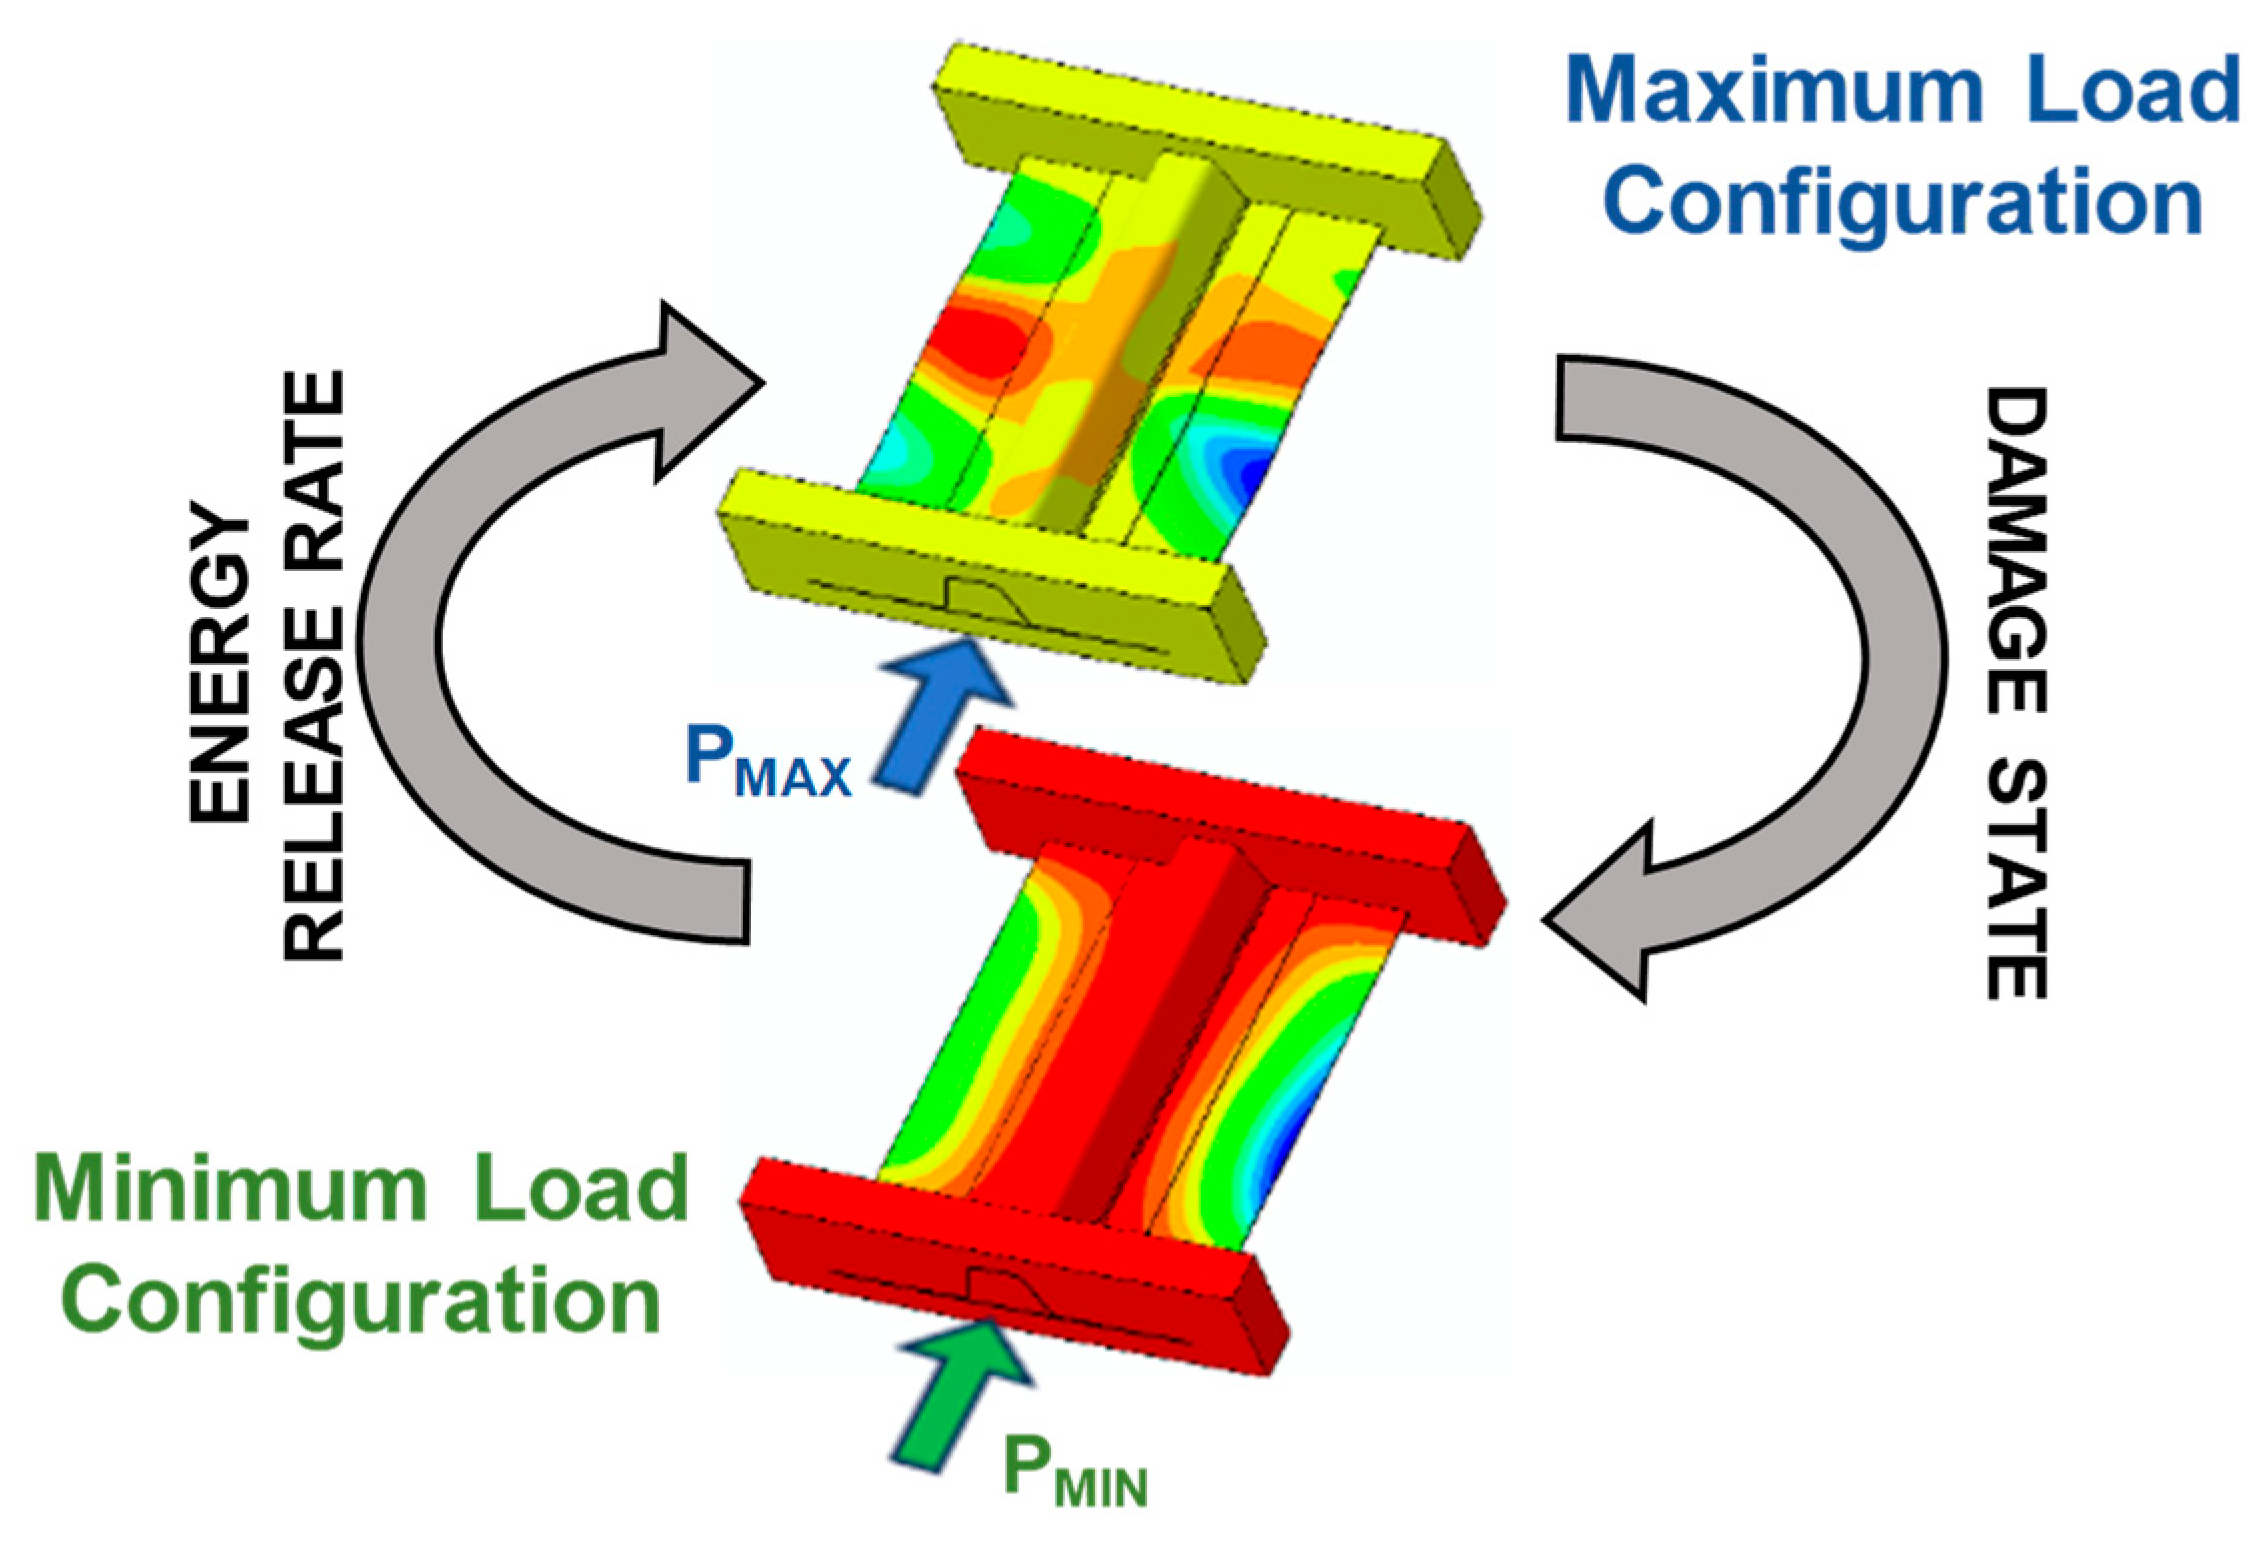
The proposed methodology, named the “Min–Max Load Approach”, enables the assessment of the local stress ratio during fatigue crack propagation analysis. Indeed, fatigue delamination growth rate is significantly affected by variations in the local stress ratio. Specifically, as the local stress ratio increases, the growth rate decreases. While the local stress ratio may be considered constant for coupon specimens, in larger structures subjected to post-buckling loading conditions, the local stress ratio varies along the delamination front and as the delamination propagates. Therefore, implementing a numerical approach that dynamically tracks the evolution of the local stress ratio as the damage propagates becomes essential for accurately predicting fatigue delamination growth. The methodology relies on the FE method in conjunction with the Cohesive Zone Model (CZM) to simulate damage propagation.
To compute the local stress ratio, it is essential to know the stress distribution of the structure under both maximum and minimum loads during the fatigue cycle. The idea of the methodology is to perform a single FE analysis with two identical models representing the same structure but subjected to different constant applied loads, the minimum and the maximum loads during the fatigue cycle. The general approach of the proposed methodology is graphically represented in
Figure 3.
During the analysis, the two models interact to assess the local stress ratio and conduct fatigue calculations. Specifically, the minimum energy release rate value at the crack tip is obtained from the model under the minimum load and transferred to the model representing the structure subjected to the maximum load. This information about the minimum and maximum energy release rate values allows for the calculation of the local stress ratio for each element along the delamination front, enabling the evaluation of the crack growth rate. After completing the fatigue calculations, the increase in the damage state of the cohesive elements is transferred to the elements of the minimum load configuration to ensure consistency in representing the crack between both models.
One of the advantages of the proposed methodology is that it can be used in conjunction with any fatigue cohesive constitutive model. In this work, an existing model taken from the literature is employed [
16], introducing some modifications required to implement the “Min–Max Load Approach”.
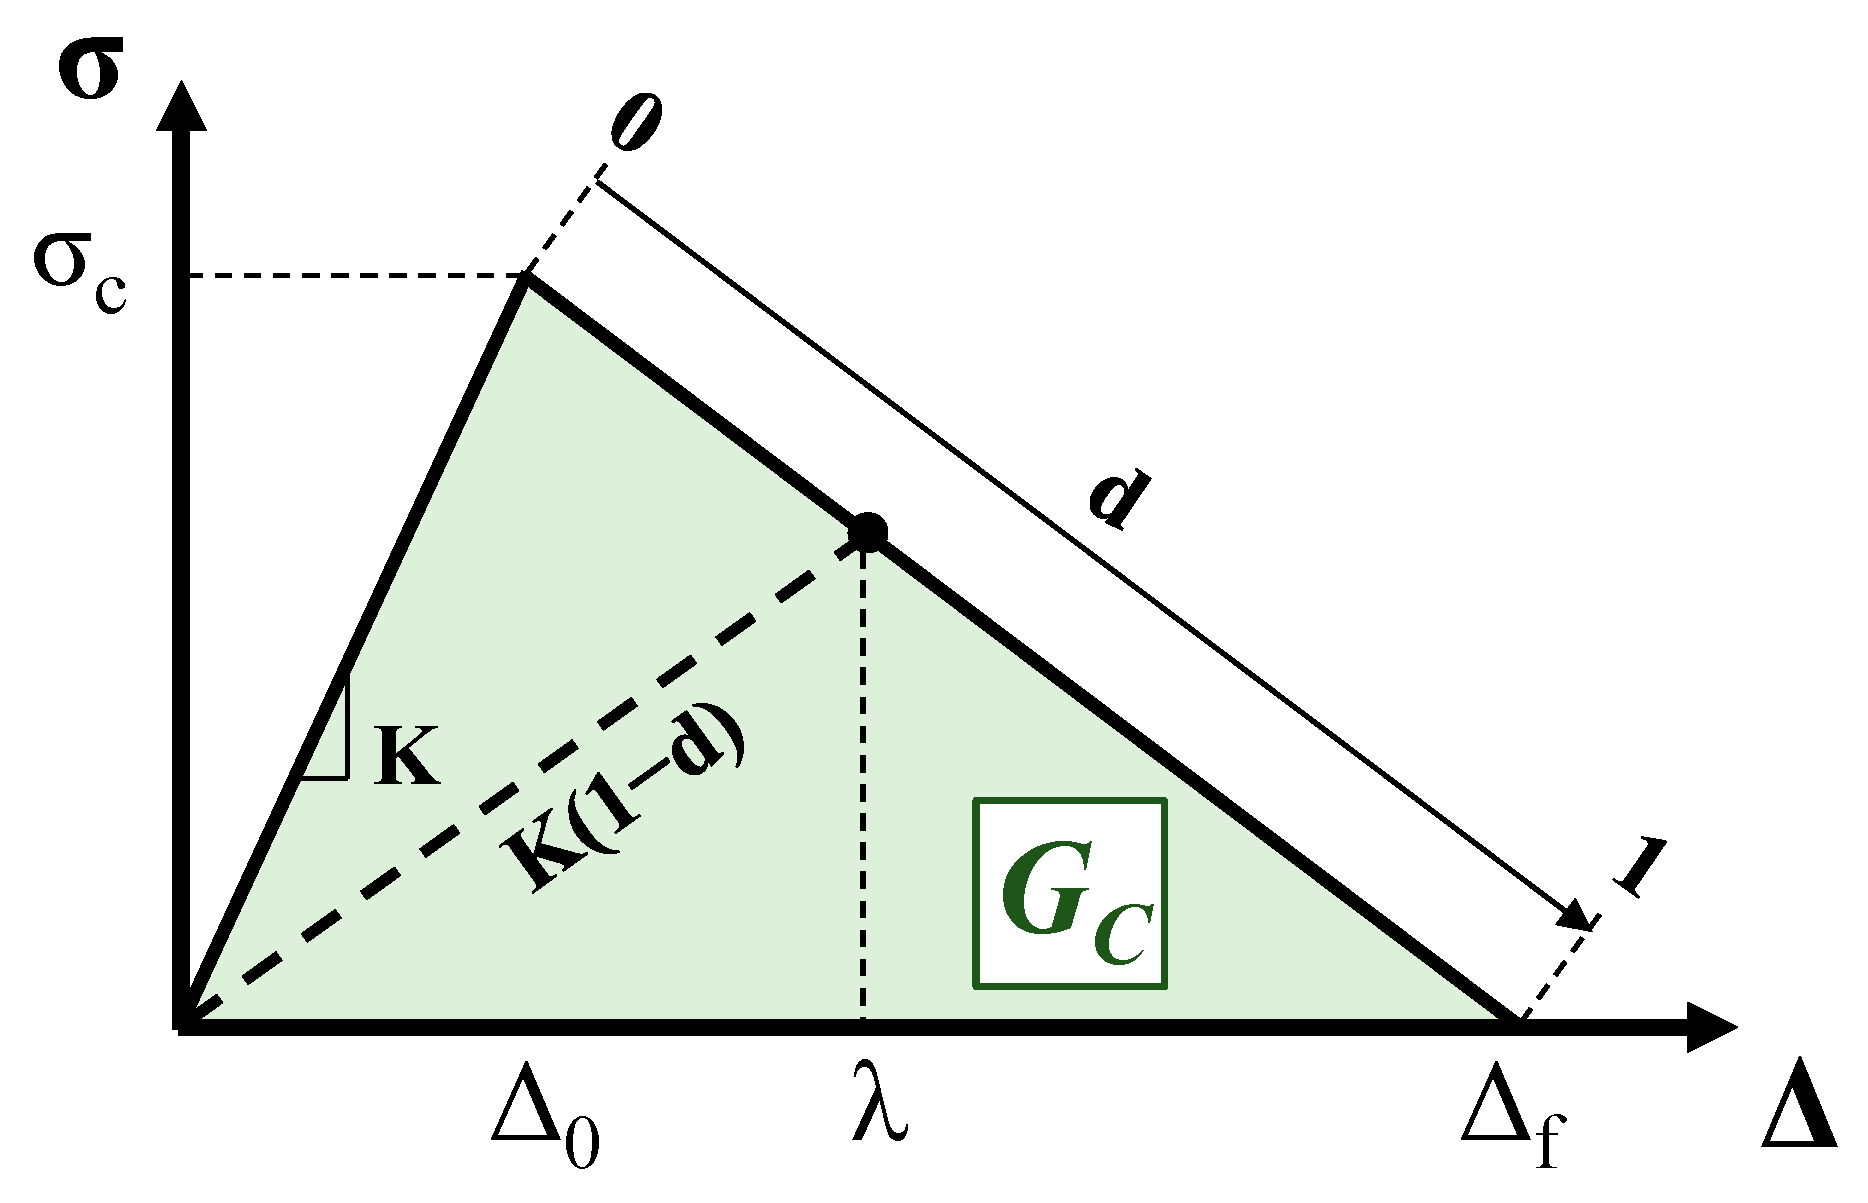
Cohesive elements have been developed and extensively used to numerically simulate the initiation and propagation of delamination under quasi-static or impact loading conditions. The cohesive formulation frequently adopted involves the use of a bilinear traction–separation law, as shown in
Figure 4 [
10,
11].
The stress linearly increases up to the interface strength of the material (
σc), related to the damage initiation displacement (
Δ0). Beyond this point, the stress starts to decrease until the final displacement (
Δf) and the complete failure of the element. The integral of the traction–separation law represents the Critical Energy Release Rate (
GC) of the material. The interface degradation of the cohesive element is directly related to the evolution of a damage variable (
d), which can be calculated with the following equation [
16]:
The constitutive model can be extended to simulate fatigue damage propagation by considering the evolution of the damage variable with the number of fatigue cycles.
The model adopted in this work is based on the assumption that the evolution of the cohesive damage can be expressed as the sum of a quasi-static damage rate (
∂ds/
∂N) and a fatigue damage rate (
∂df/
∂N), as represented by the following equation:
The part related to the quasi-static damage (
∂ds/
∂N) is evaluated according to Equation (4), while the fatigue damage rate (
∂df/
∂N) is formulated as follows:
where
lCZ is the length of the cohesive zone and
da/
dN is the crack growth rate. The implementation of the quasi-static damage rate and the fatigue damage rate are described in detail in [
21,
22]. In this model, the crack growth rate is assessed using a semi-empirical fatigue delamination growth law. The model is based on the assumption that the local stress ratio and the mode mixity only influence the slope of the crack growth rate curve (
da/
dN) as a function of the normalized energy release rate (
Gmax/
Gc). This law, governed by a single formula and three independent material parameters, enables the calculation of the crack growth rate, taking into account variations in mode mixity and local stress ratio [
32,
33].
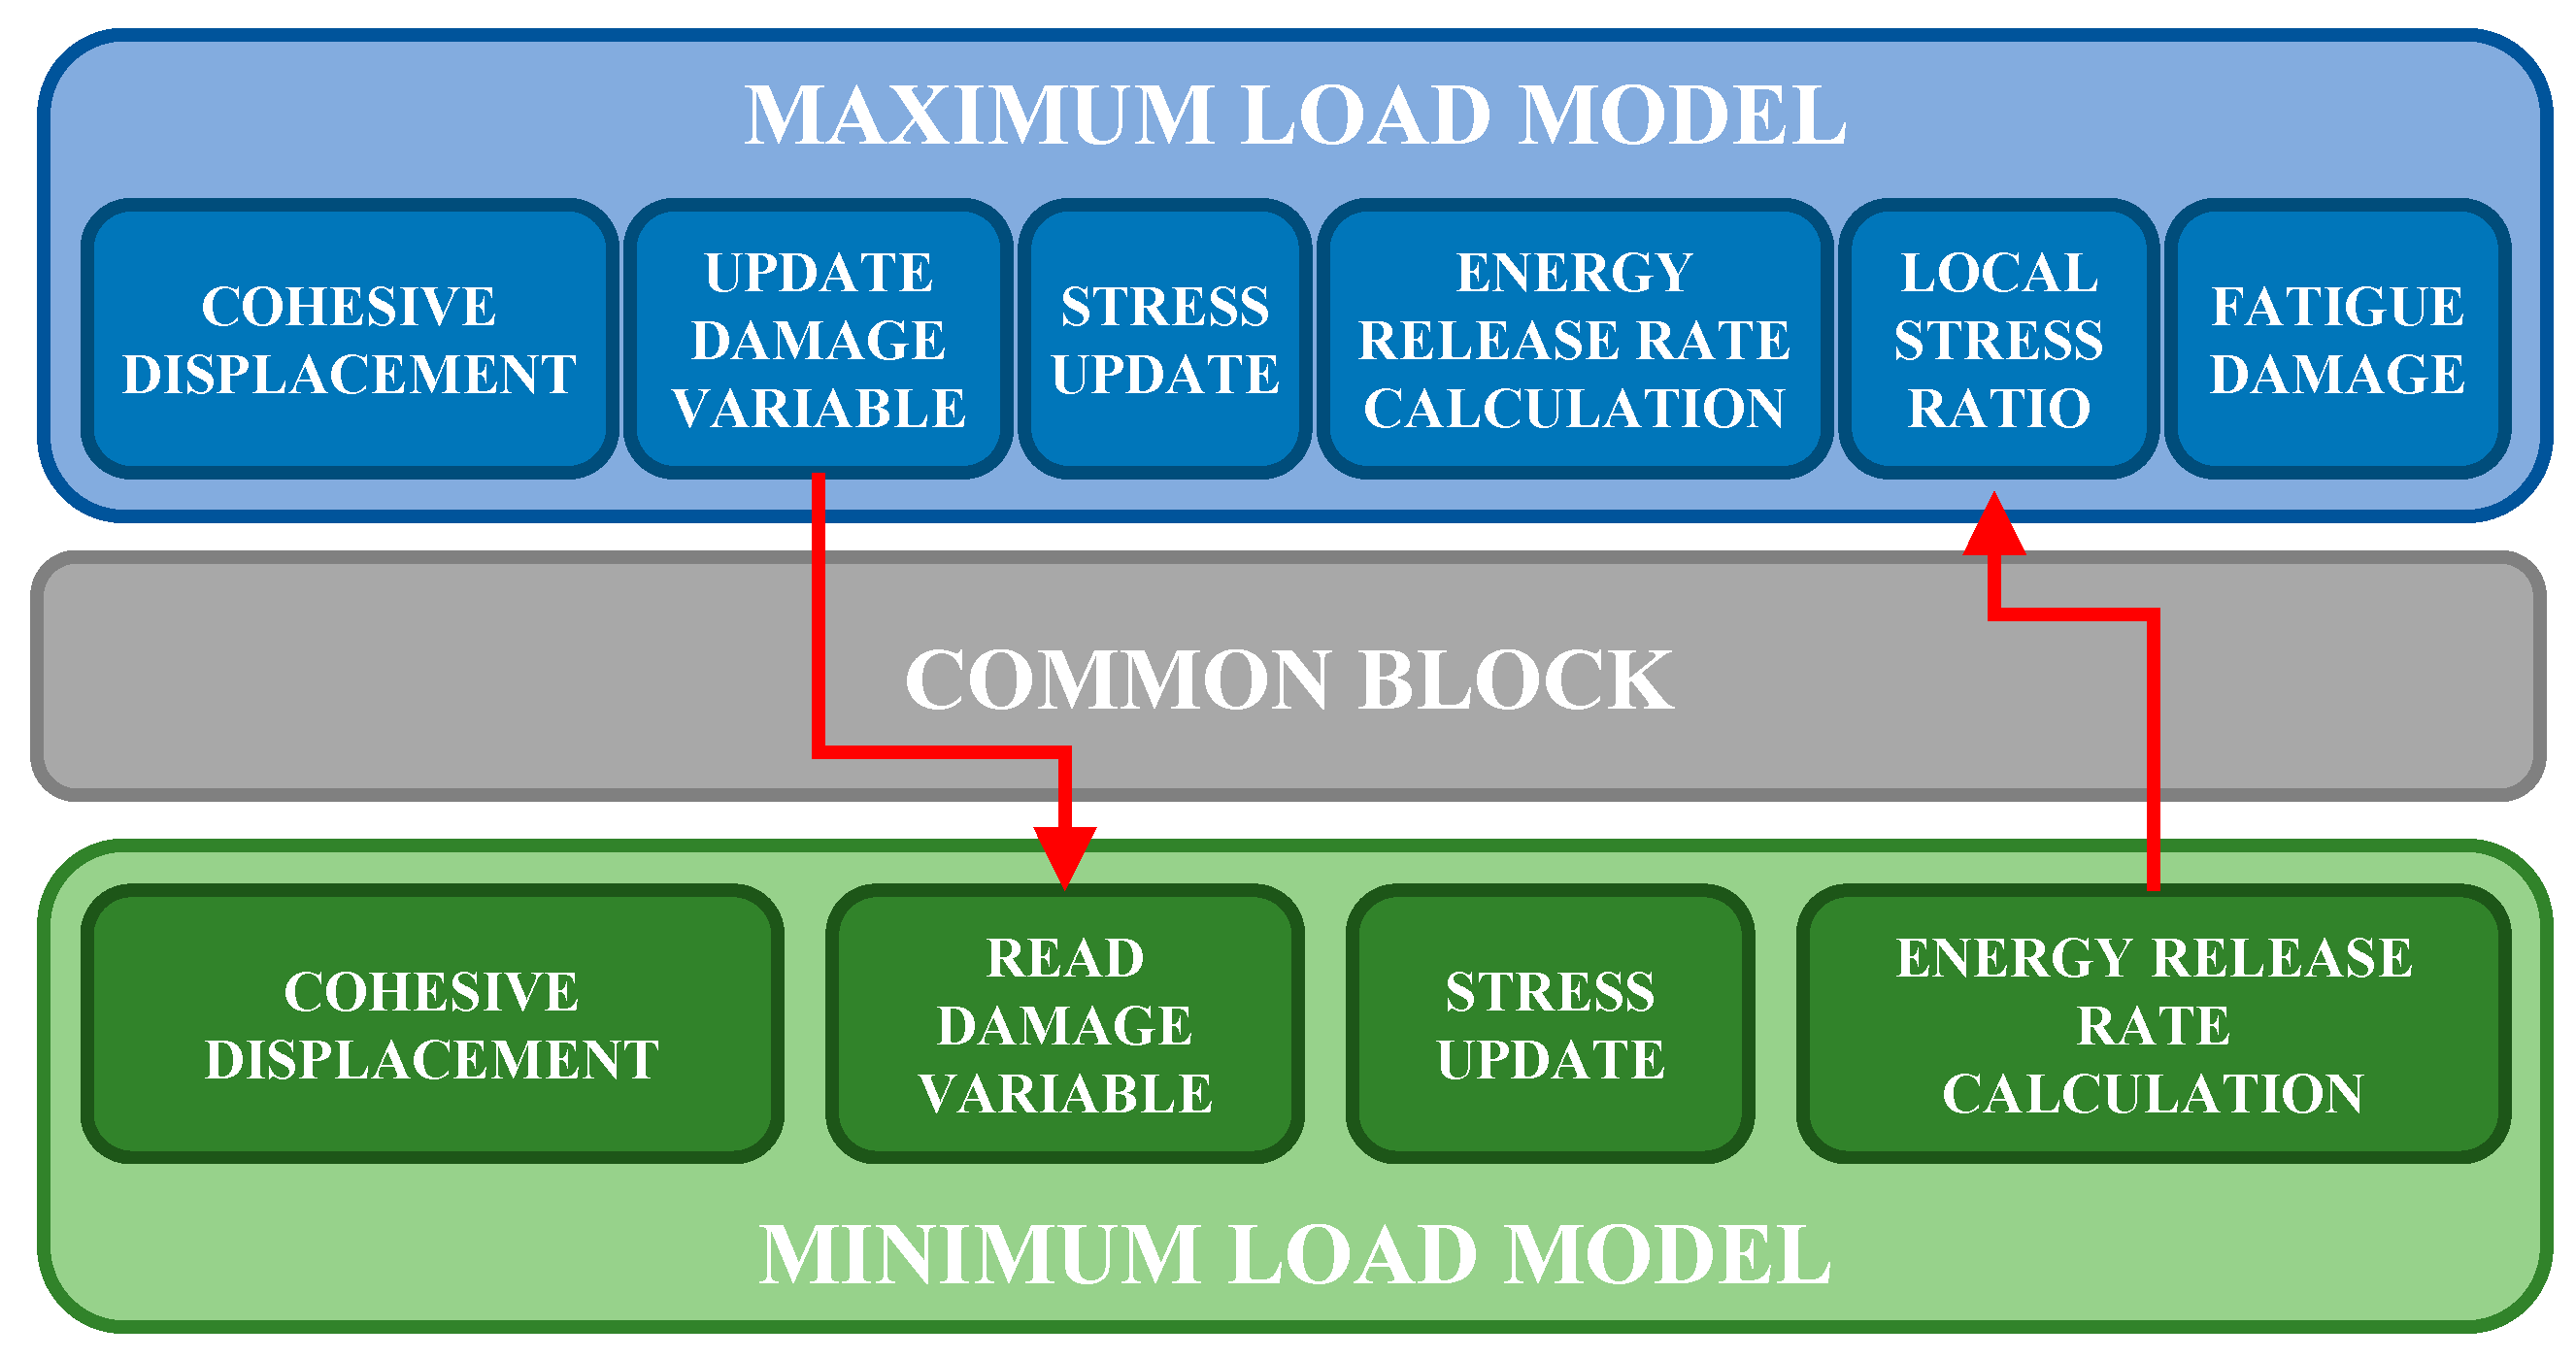
A flowchart illustrating the sequence of operations carried out within a User Material Subroutine (UMAT), developed to take into account the “Min–Max Load Approach” and the cohesive delamination formulation in the FE code ABAQUS [
8], is depicted in
Figure 5.
During the analysis, for each time increment of the non-linear analysis, the subroutine processes all the integration points of each cohesive element.
To differentiate between the two configurations (minimum and maximum load), each element in one configuration is assigned the same number as its corresponding element in the other configuration, with a known constant offset. If the integration point belongs to an element that is part of the minimum load configuration, the damage variable and stresses are updated by extracting the value from the corresponding integration point on the model representing the maximum load configuration, and then the energy release rate is calculated. On the other hand, if the element belongs to the maximum load configuration, first the nodal displacements provided by the FE solver are adopted to update the damage variable and stresses, and then, by using the minimum energy release rate value obtained from the corresponding element in the other configuration, the local stress ratio is determined and employed to calculate fatigue damage. The interchange of variables between the two models is enabled through a COMMON BLOCK, a Fortran-specific feature that enables the transfer of information between subroutines.
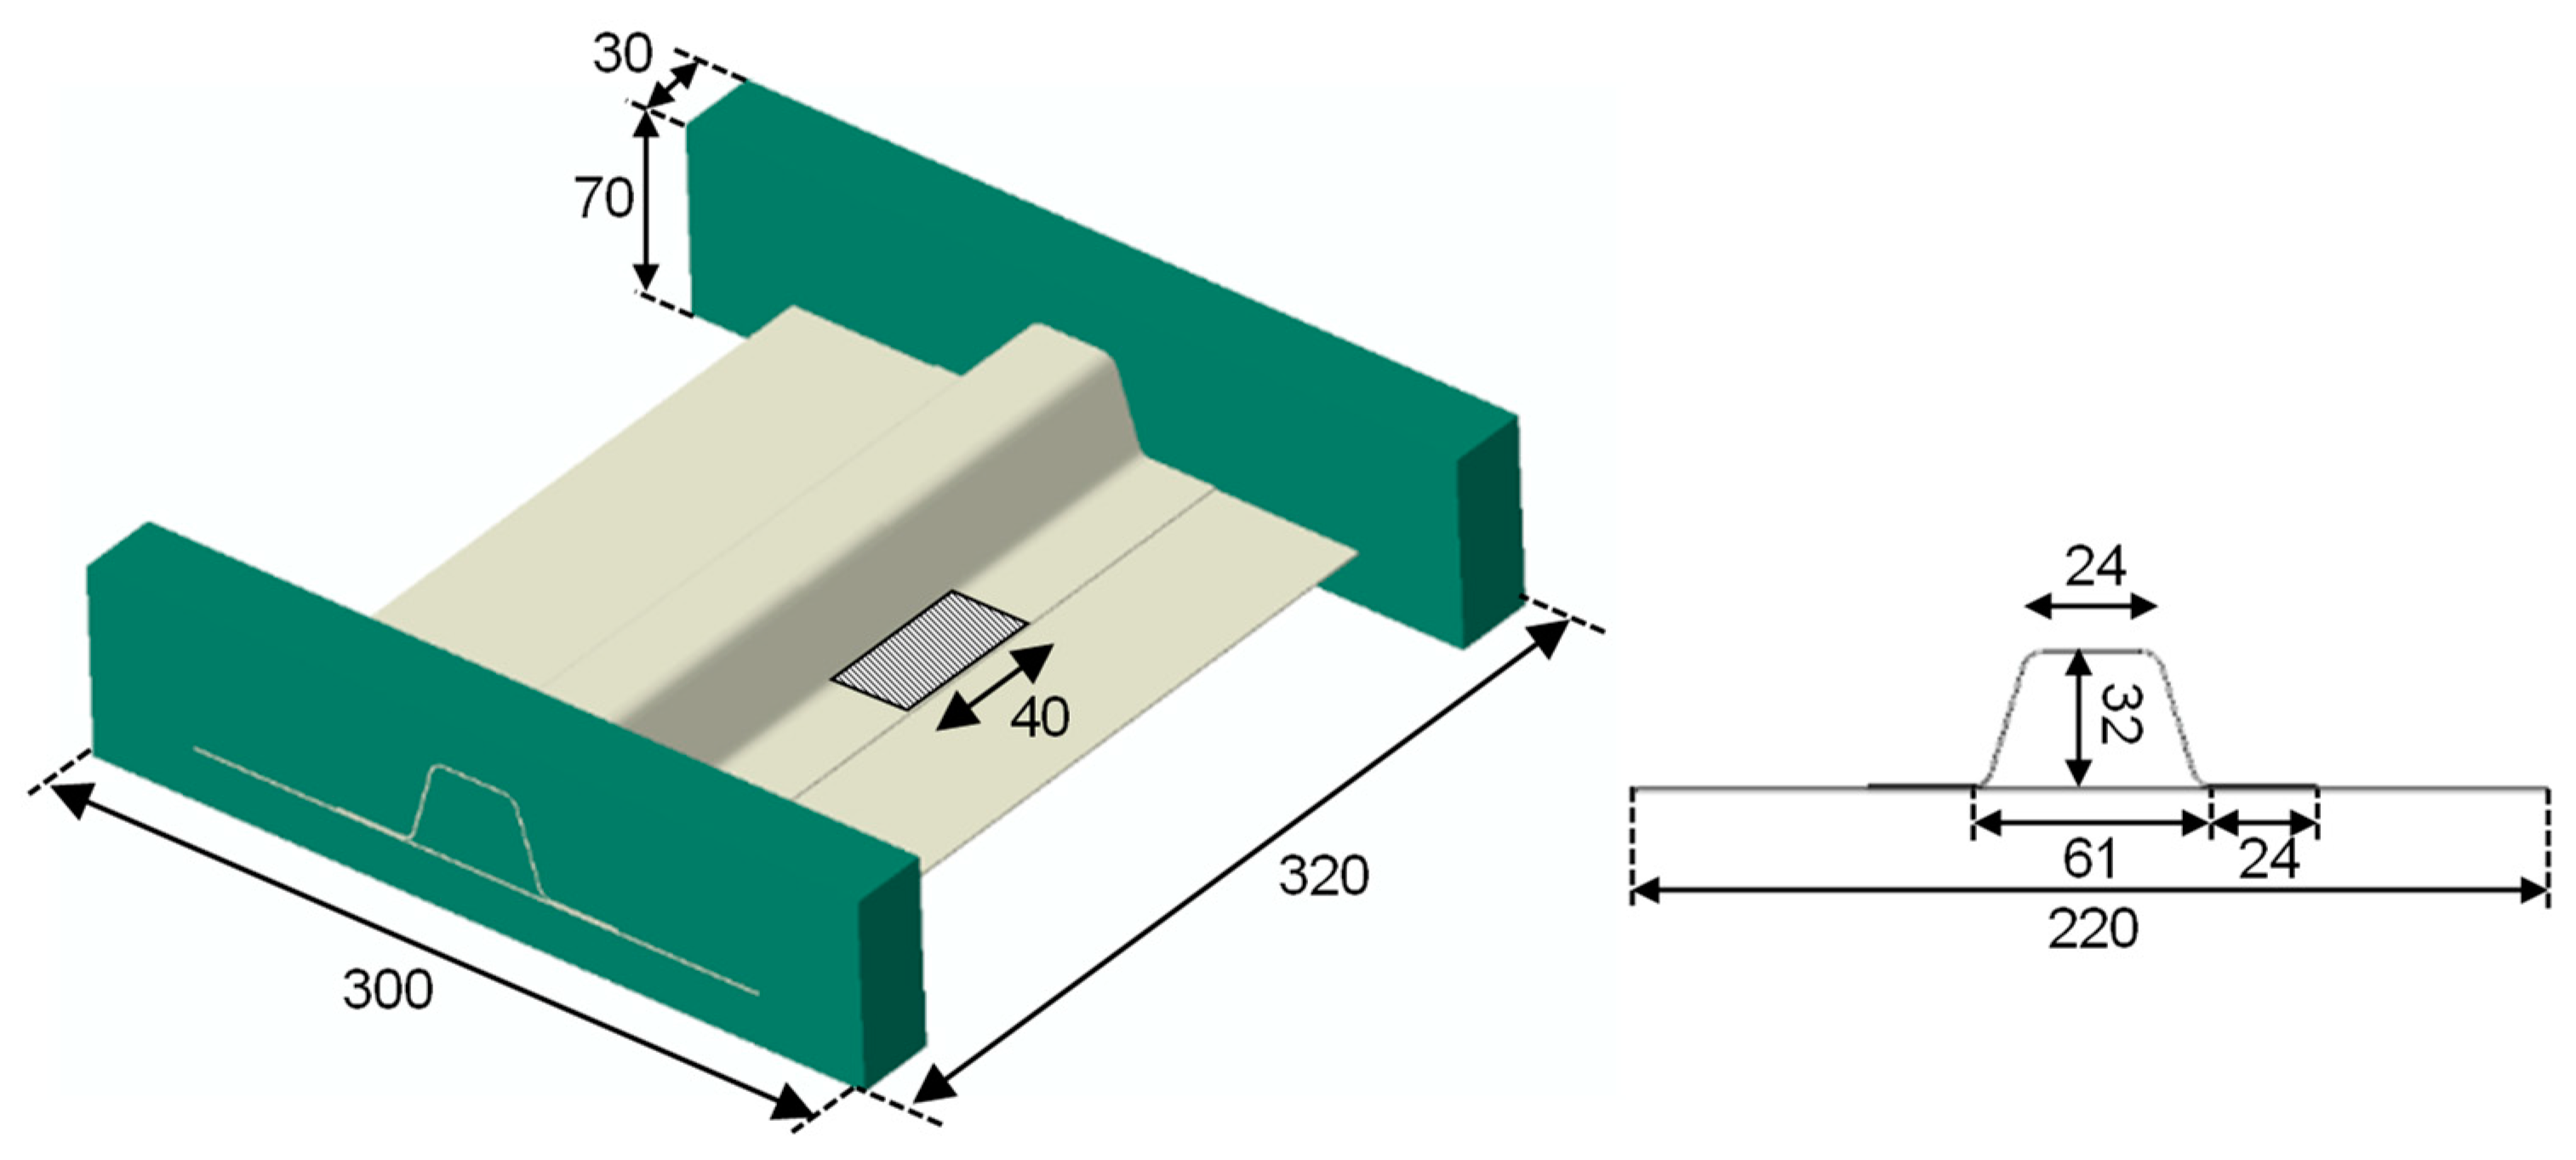
4. Single-Stringer Composite (SSC) Specimen
A Single-Stringer Composite (SSC) specimen is analyzed. The SSC specimen is designed to replicate the behavior of large multi-stringer panels commonly found in fuselage structures. The specimen is 320 mm long with a free length of 260 mm, taking into account tabs of 30 mm at each end. An initial delamination of 40 mm is positioned at the center of the specimen between one of the stringer flanges and the skin (
Figure 6). The skin consists of eight plies of carbon-epoxy IM7/8552 with the stacking sequence [45/90/−45/0]
s, while the stringer has seven plies with the layup [−45/0/45/0/45/0/−45]. The ply thickness is 0.125 mm.
The elastic material properties were determined through a previous experimental campaign of material characterization [
34], while the interface material properties and fatigue properties were taken from the literature [
27]. The values adopted for the numerical analyses are reported in
Table 1.
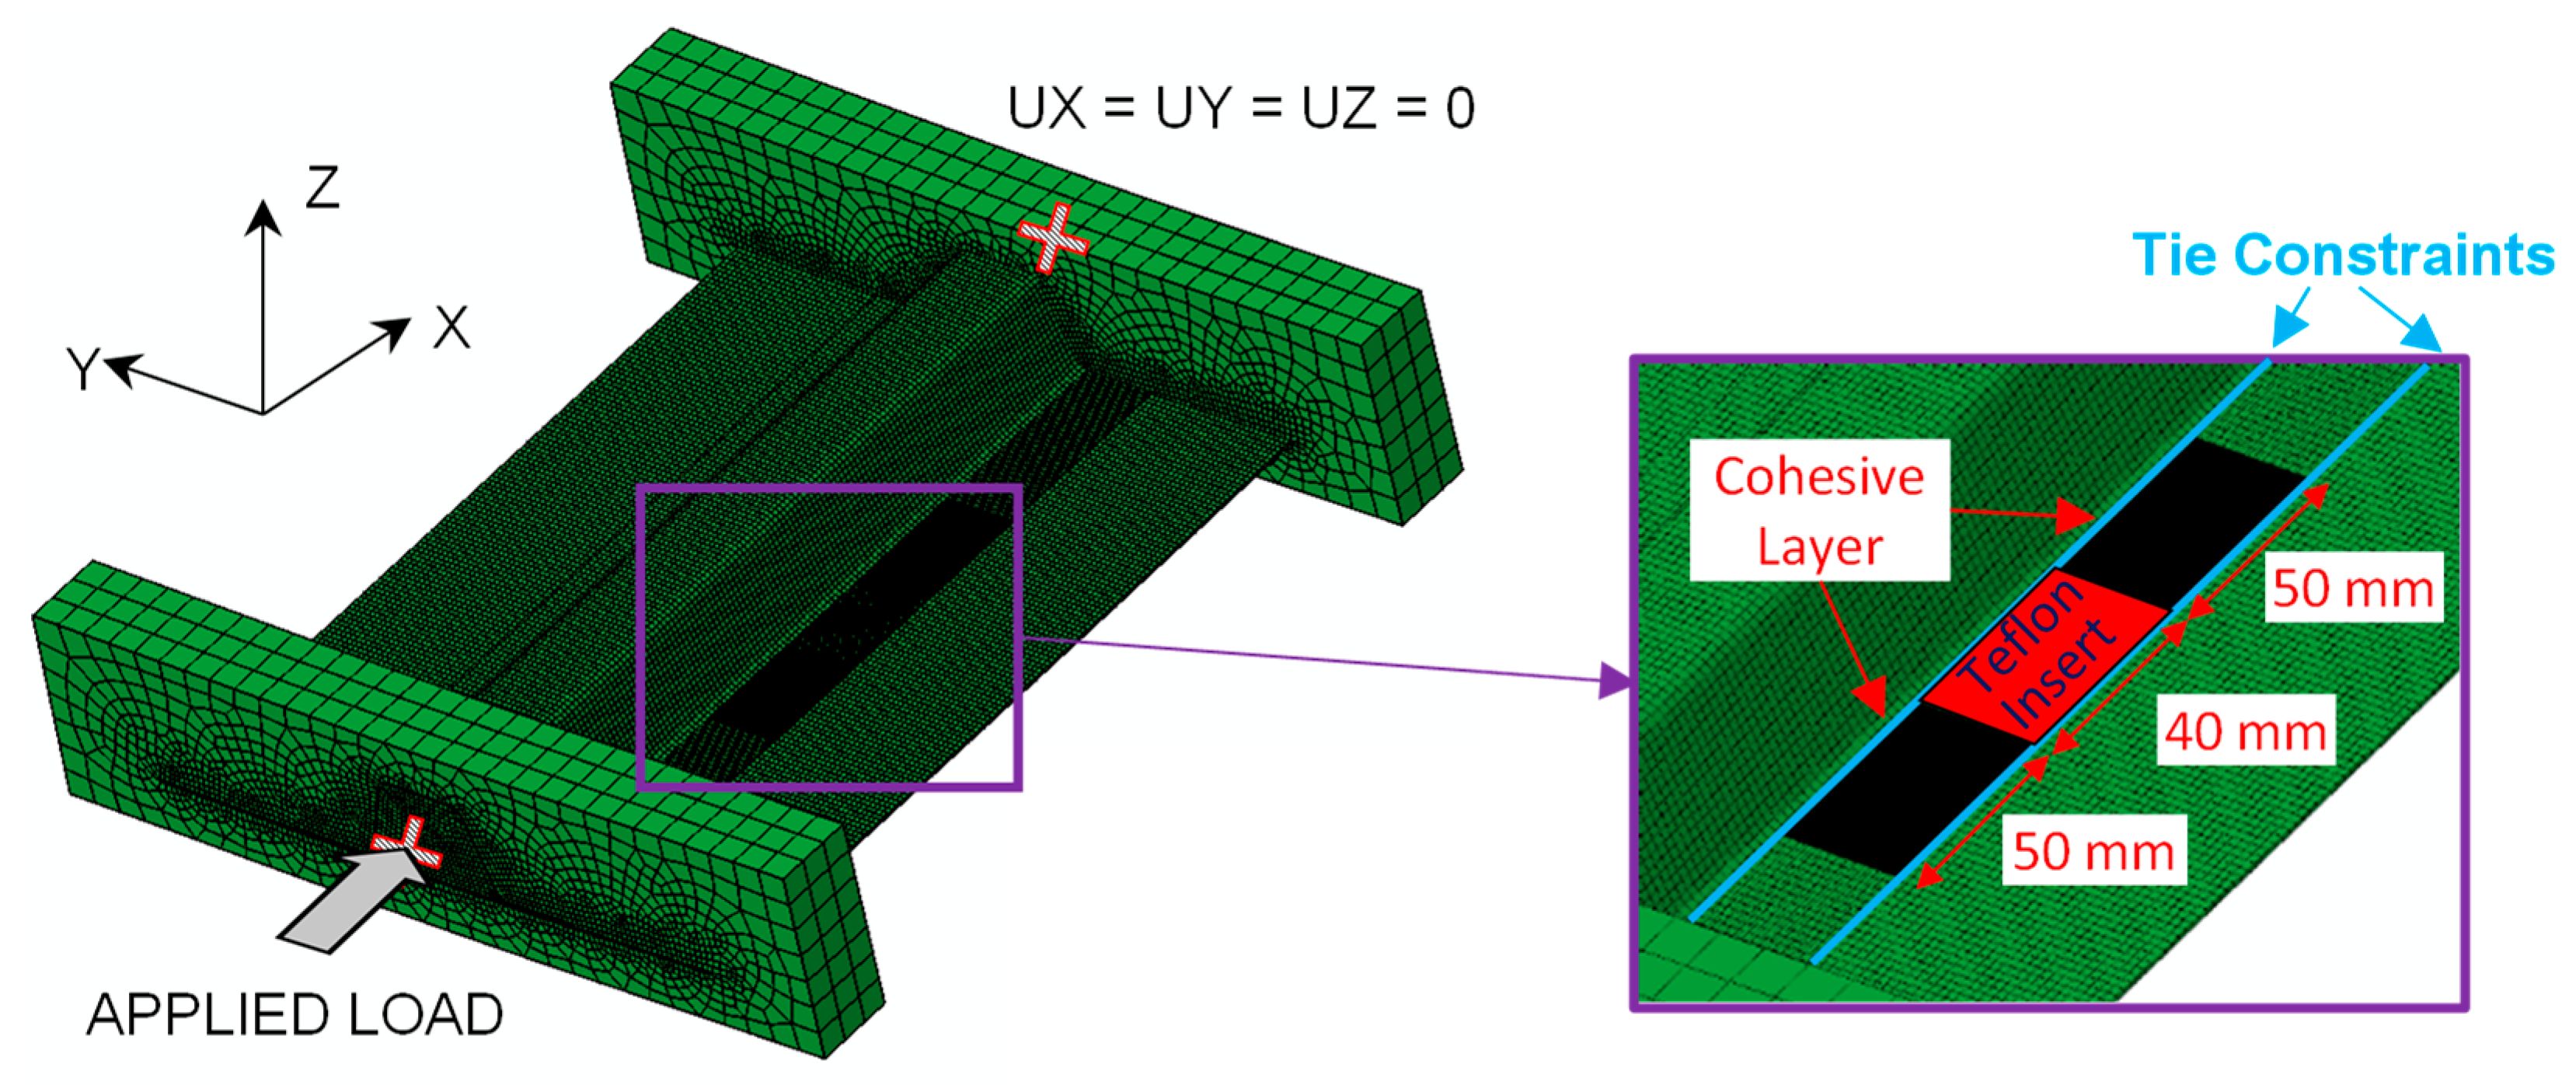
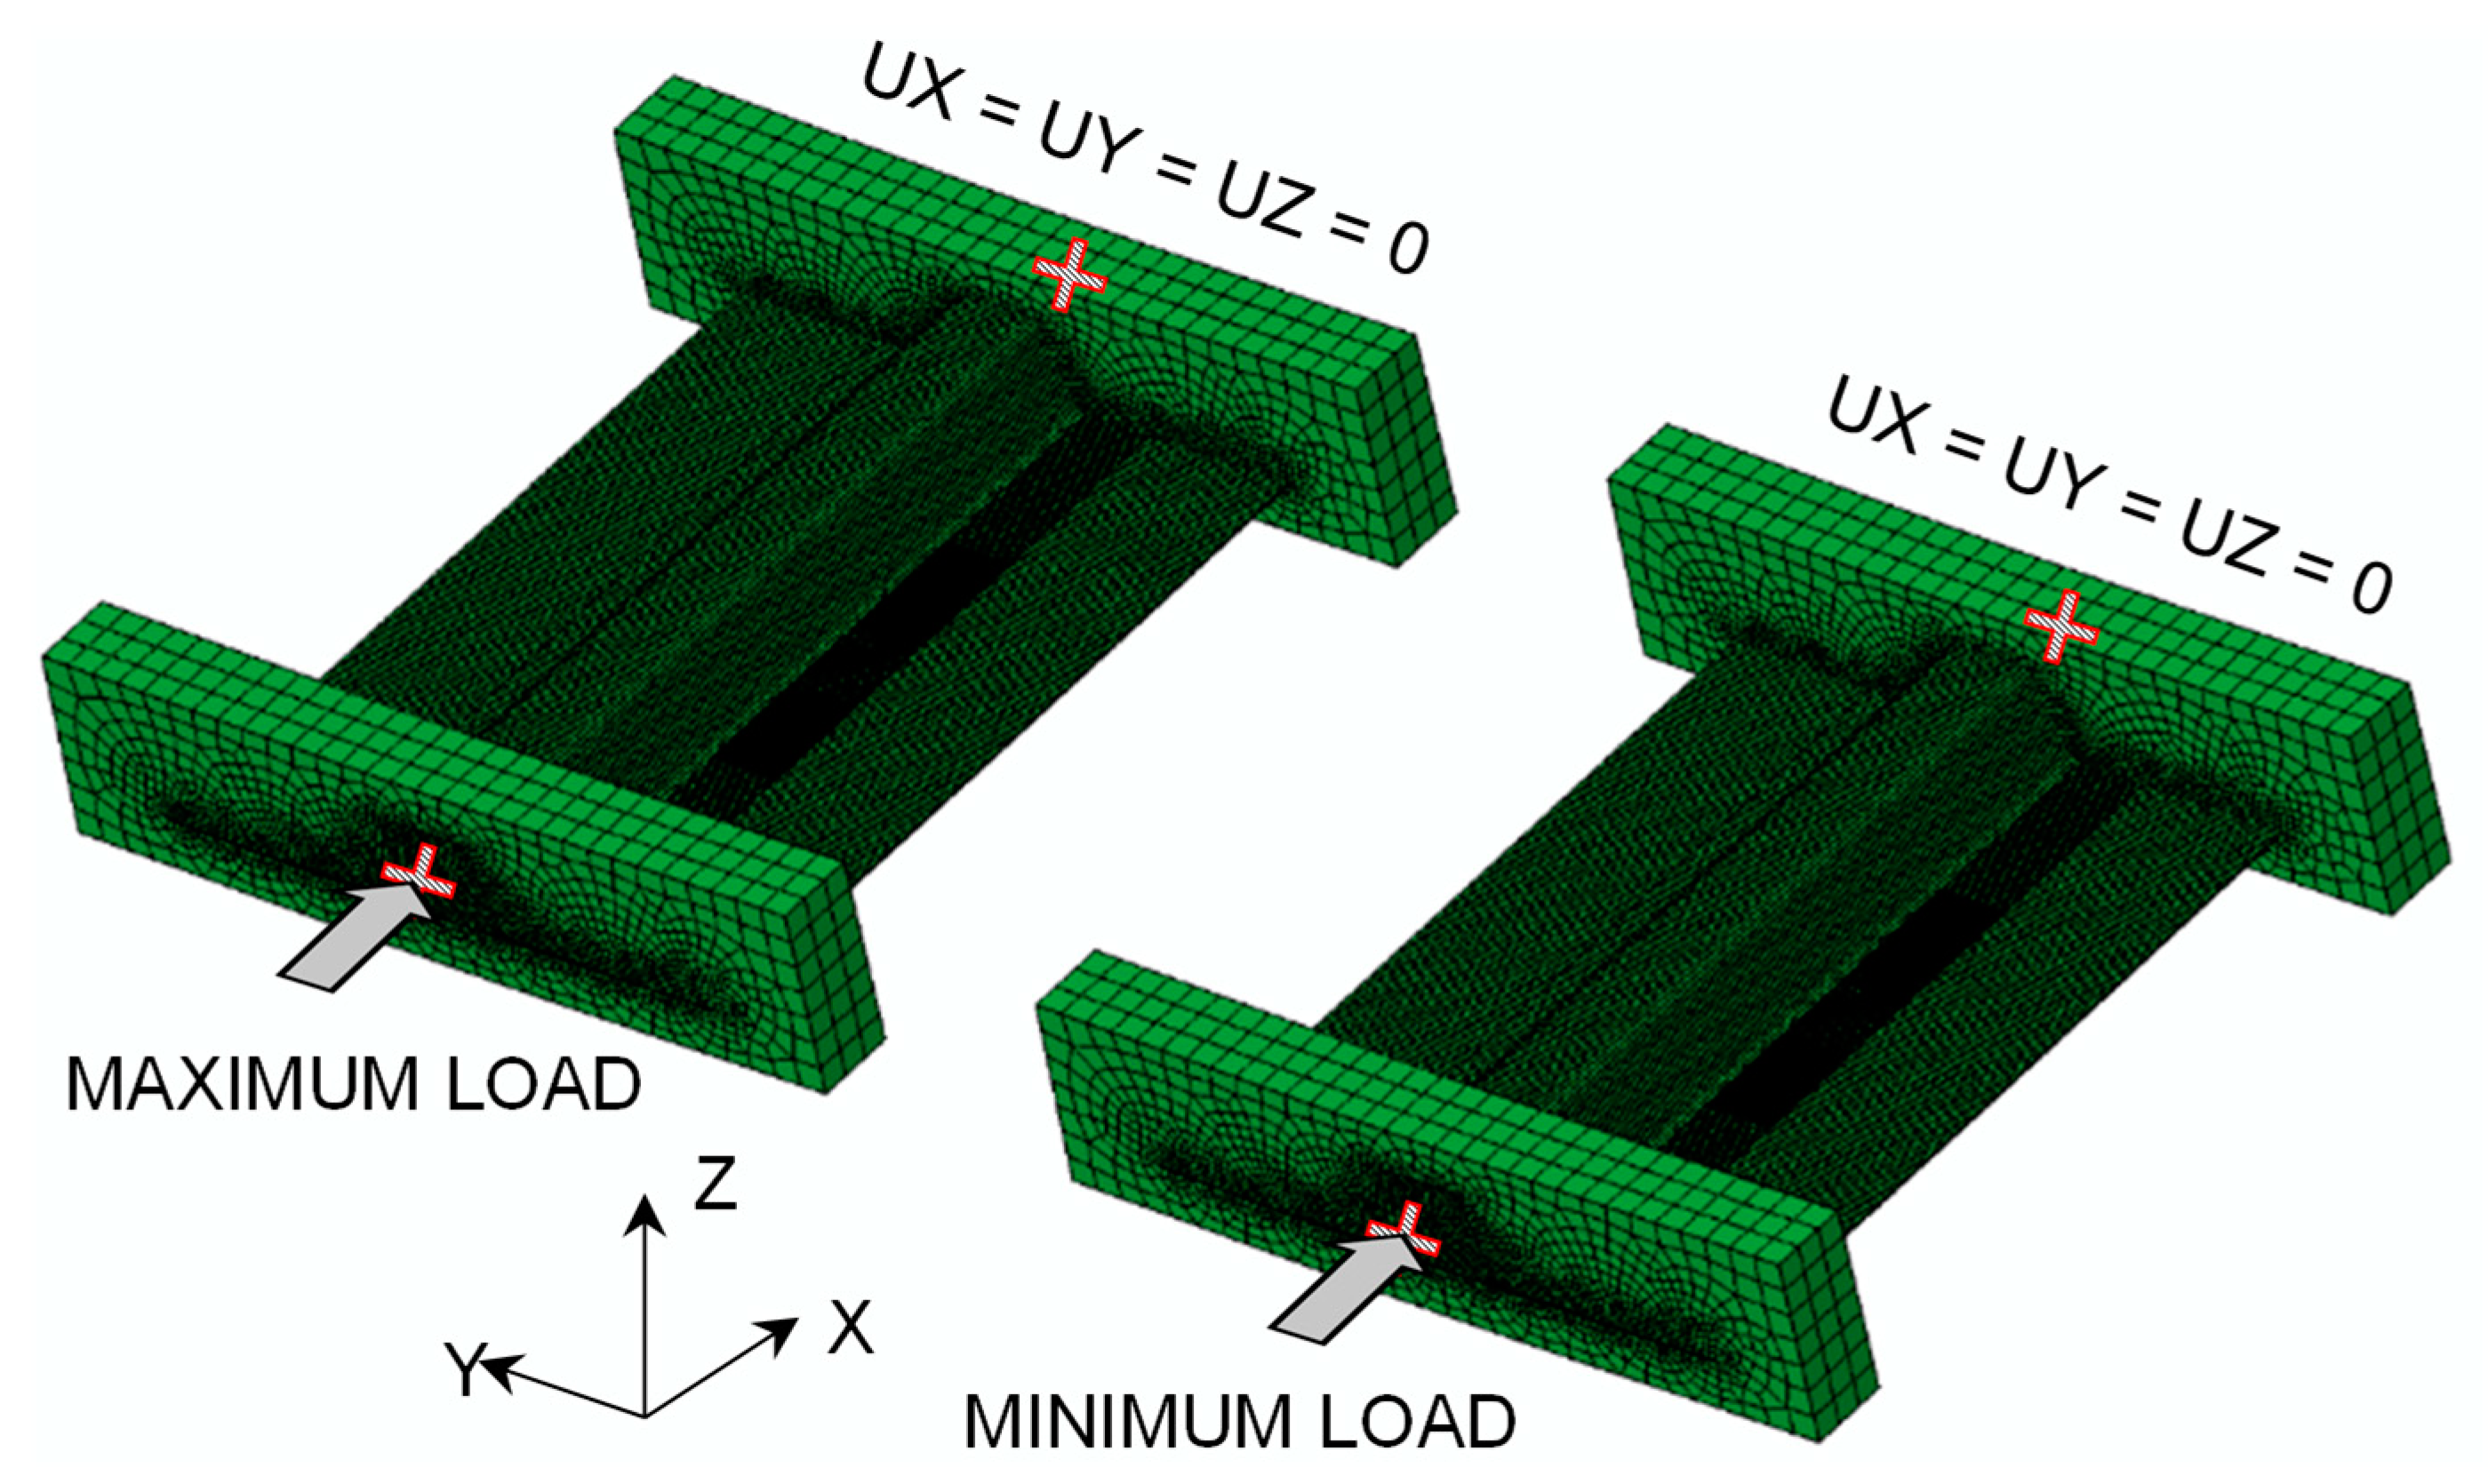
The numerical model is discretized in ABAQUS using a combination of continuum shell elements (SC8R) for the skin and the stringer, solid elements (C3D8R) for the potting material and zero-thickness cohesive elements (COH3D8) to simulate the growth of the skin-stringer separation. The model reflects conditions on a 1:1 geometric scale. The average size of the elements is approximately 2 mm for the composite laminates and 10 mm for the potting regions. The initial delamination is incorporated into the numerical model by excluding cohesive elements from the center of the specimen, thereby creating an initial separation between the skin and the stringer. A finer discretization is adopted in the area potentially interested by the propagation. In particular, close to the position of the initial delamination fronts, a 50 mm region is discretized with an element length of 0.05 mm. To reduce computational times, tie constraints are used to connect the stringer flange with a finer mesh to the surrounding part of the structure where the element size is larger. The total number of elements is around 165,000. To simulate the load application, the nodes belonging to the external faces of the potting are rigidly connected to two reference points where the boundary conditions are applied. For one reference point, all the degrees of freedom are blocked, while the other can only move in the longitudinal direction. The FE model and boundary conditions are shown in
Figure 7.
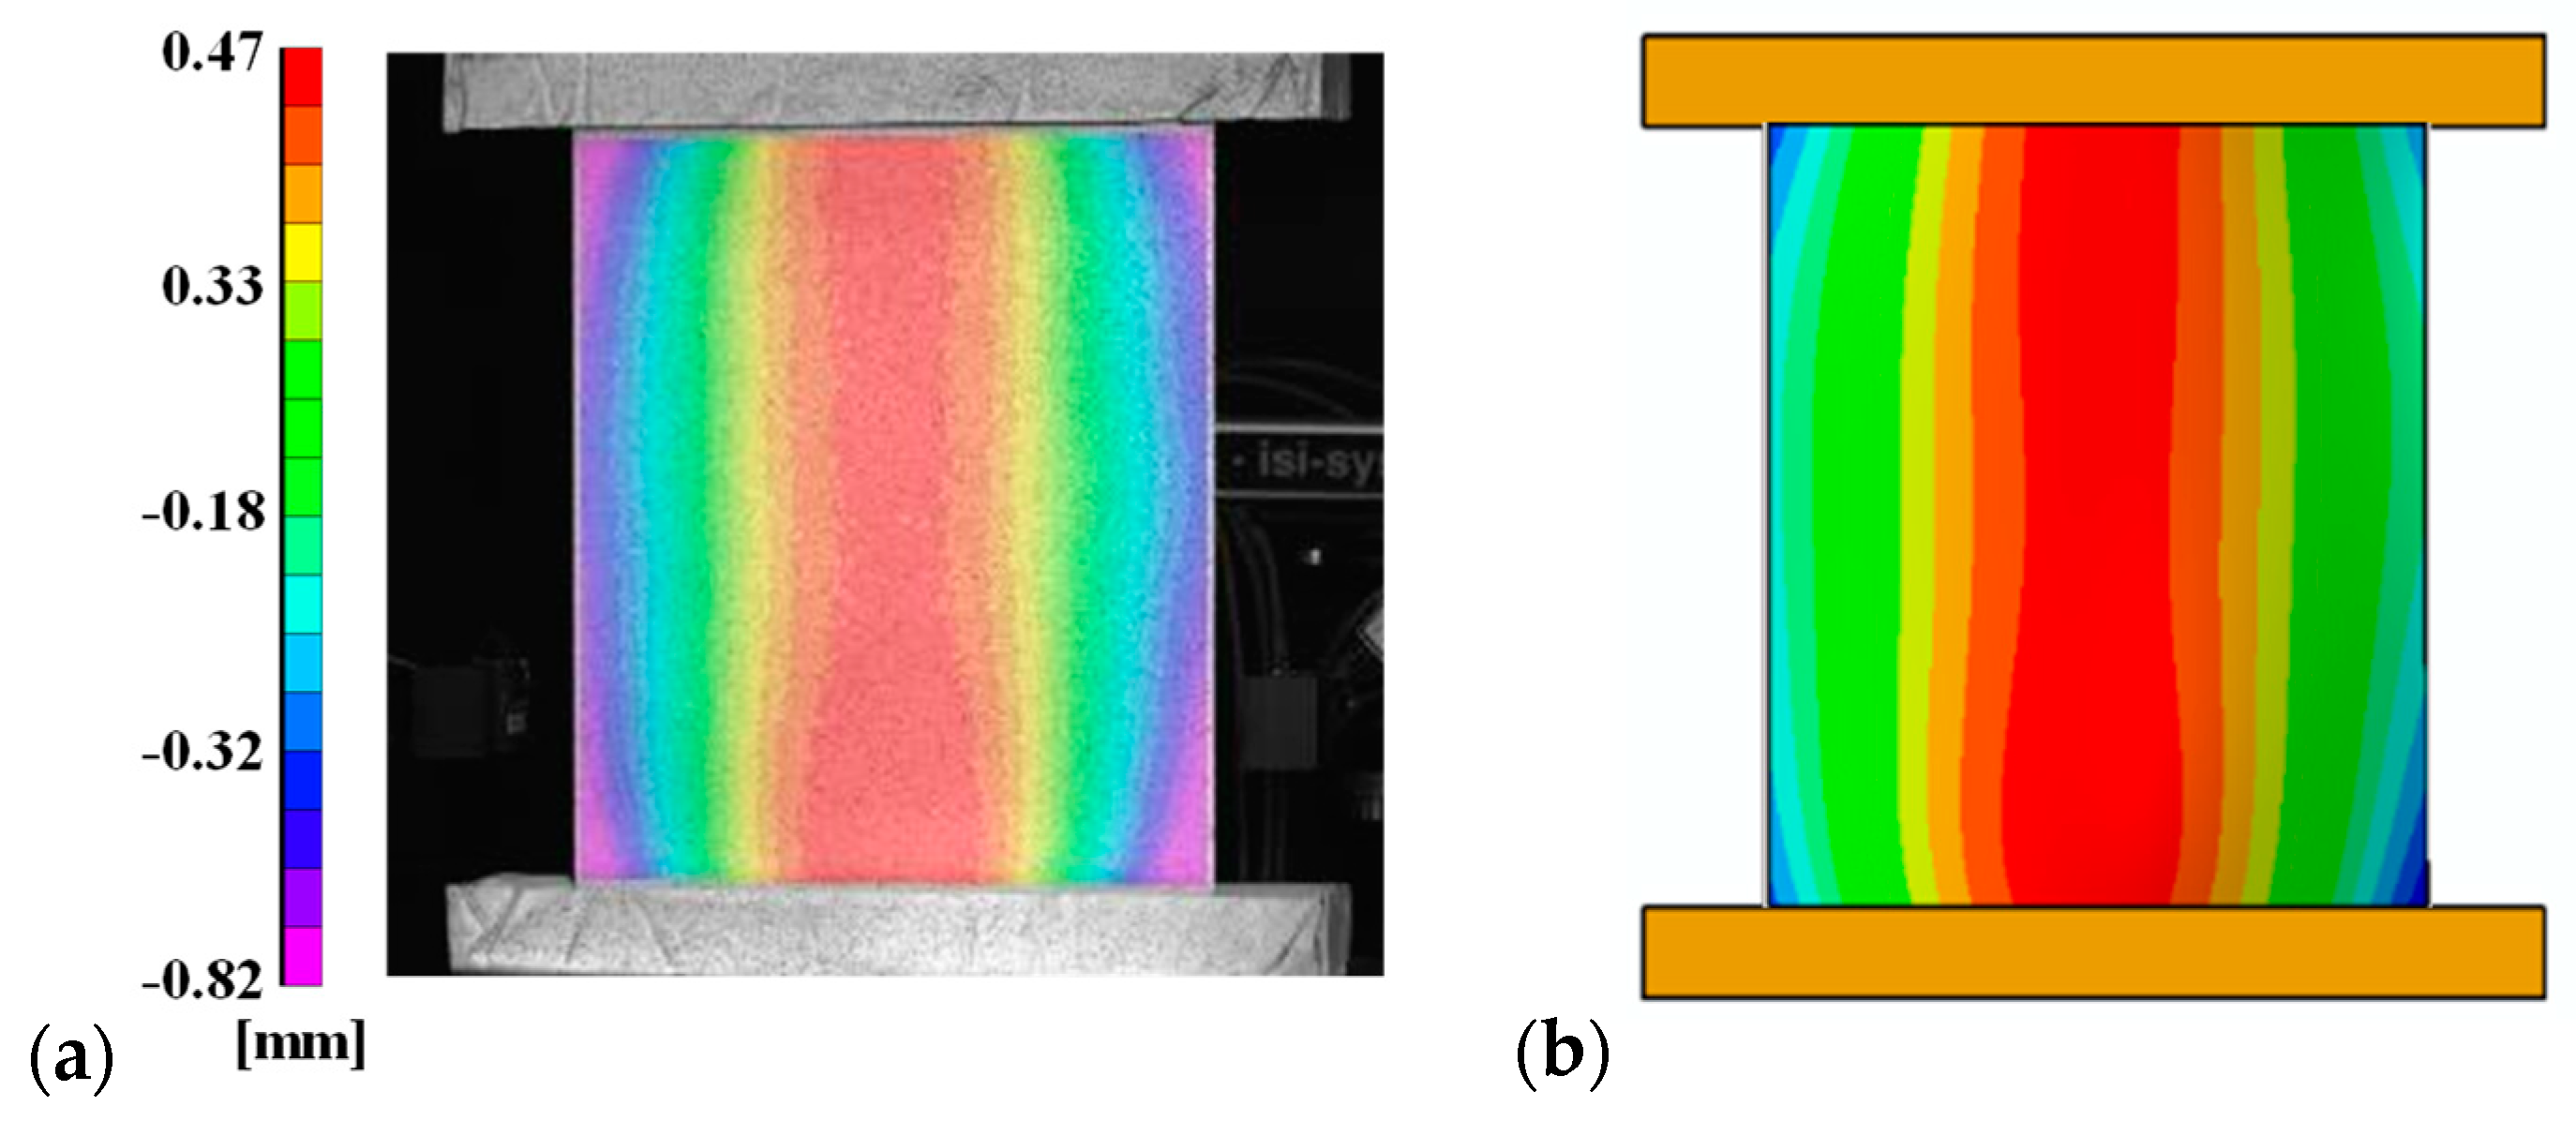
To predict the post-buckling shape of the specimen, geometrical imperfections that occur during the manufacturing process must be considered in the numerical model. These imperfections cause a deviation of the actual geometrical dimensions of the specimen from the design. During the experimental tests, a single Digital Image Correlation (DIC) system, VIC-3D 8, positioned to observe the specimen from the skin side, was used to detect both in-plane and out-of-plane displacements and to monitor buckling and post-buckling shapes during skin–stringer propagation. To enable DIC measurements, before the tests, the specimens were painted with white color and then with black speckles of approximately 1.5 mm. The geometrical imperfections were measured using DIC before the experimental test. Both the shape and size of the imperfections were consistent among the different specimens with a slightly curved shape in the transversal direction, most likely caused by the internal stresses during the curing process, as shown in
Figure 8a. The geometrical imperfections are introduced in the numerical model by performing a preliminary linear step analysis where the imperfections are imposed on the nodes as applied displacements. The resulting deformed shape of the specimen is shown in
Figure 8b.
5. Quasi-Static Analysis and Experimental Comparison
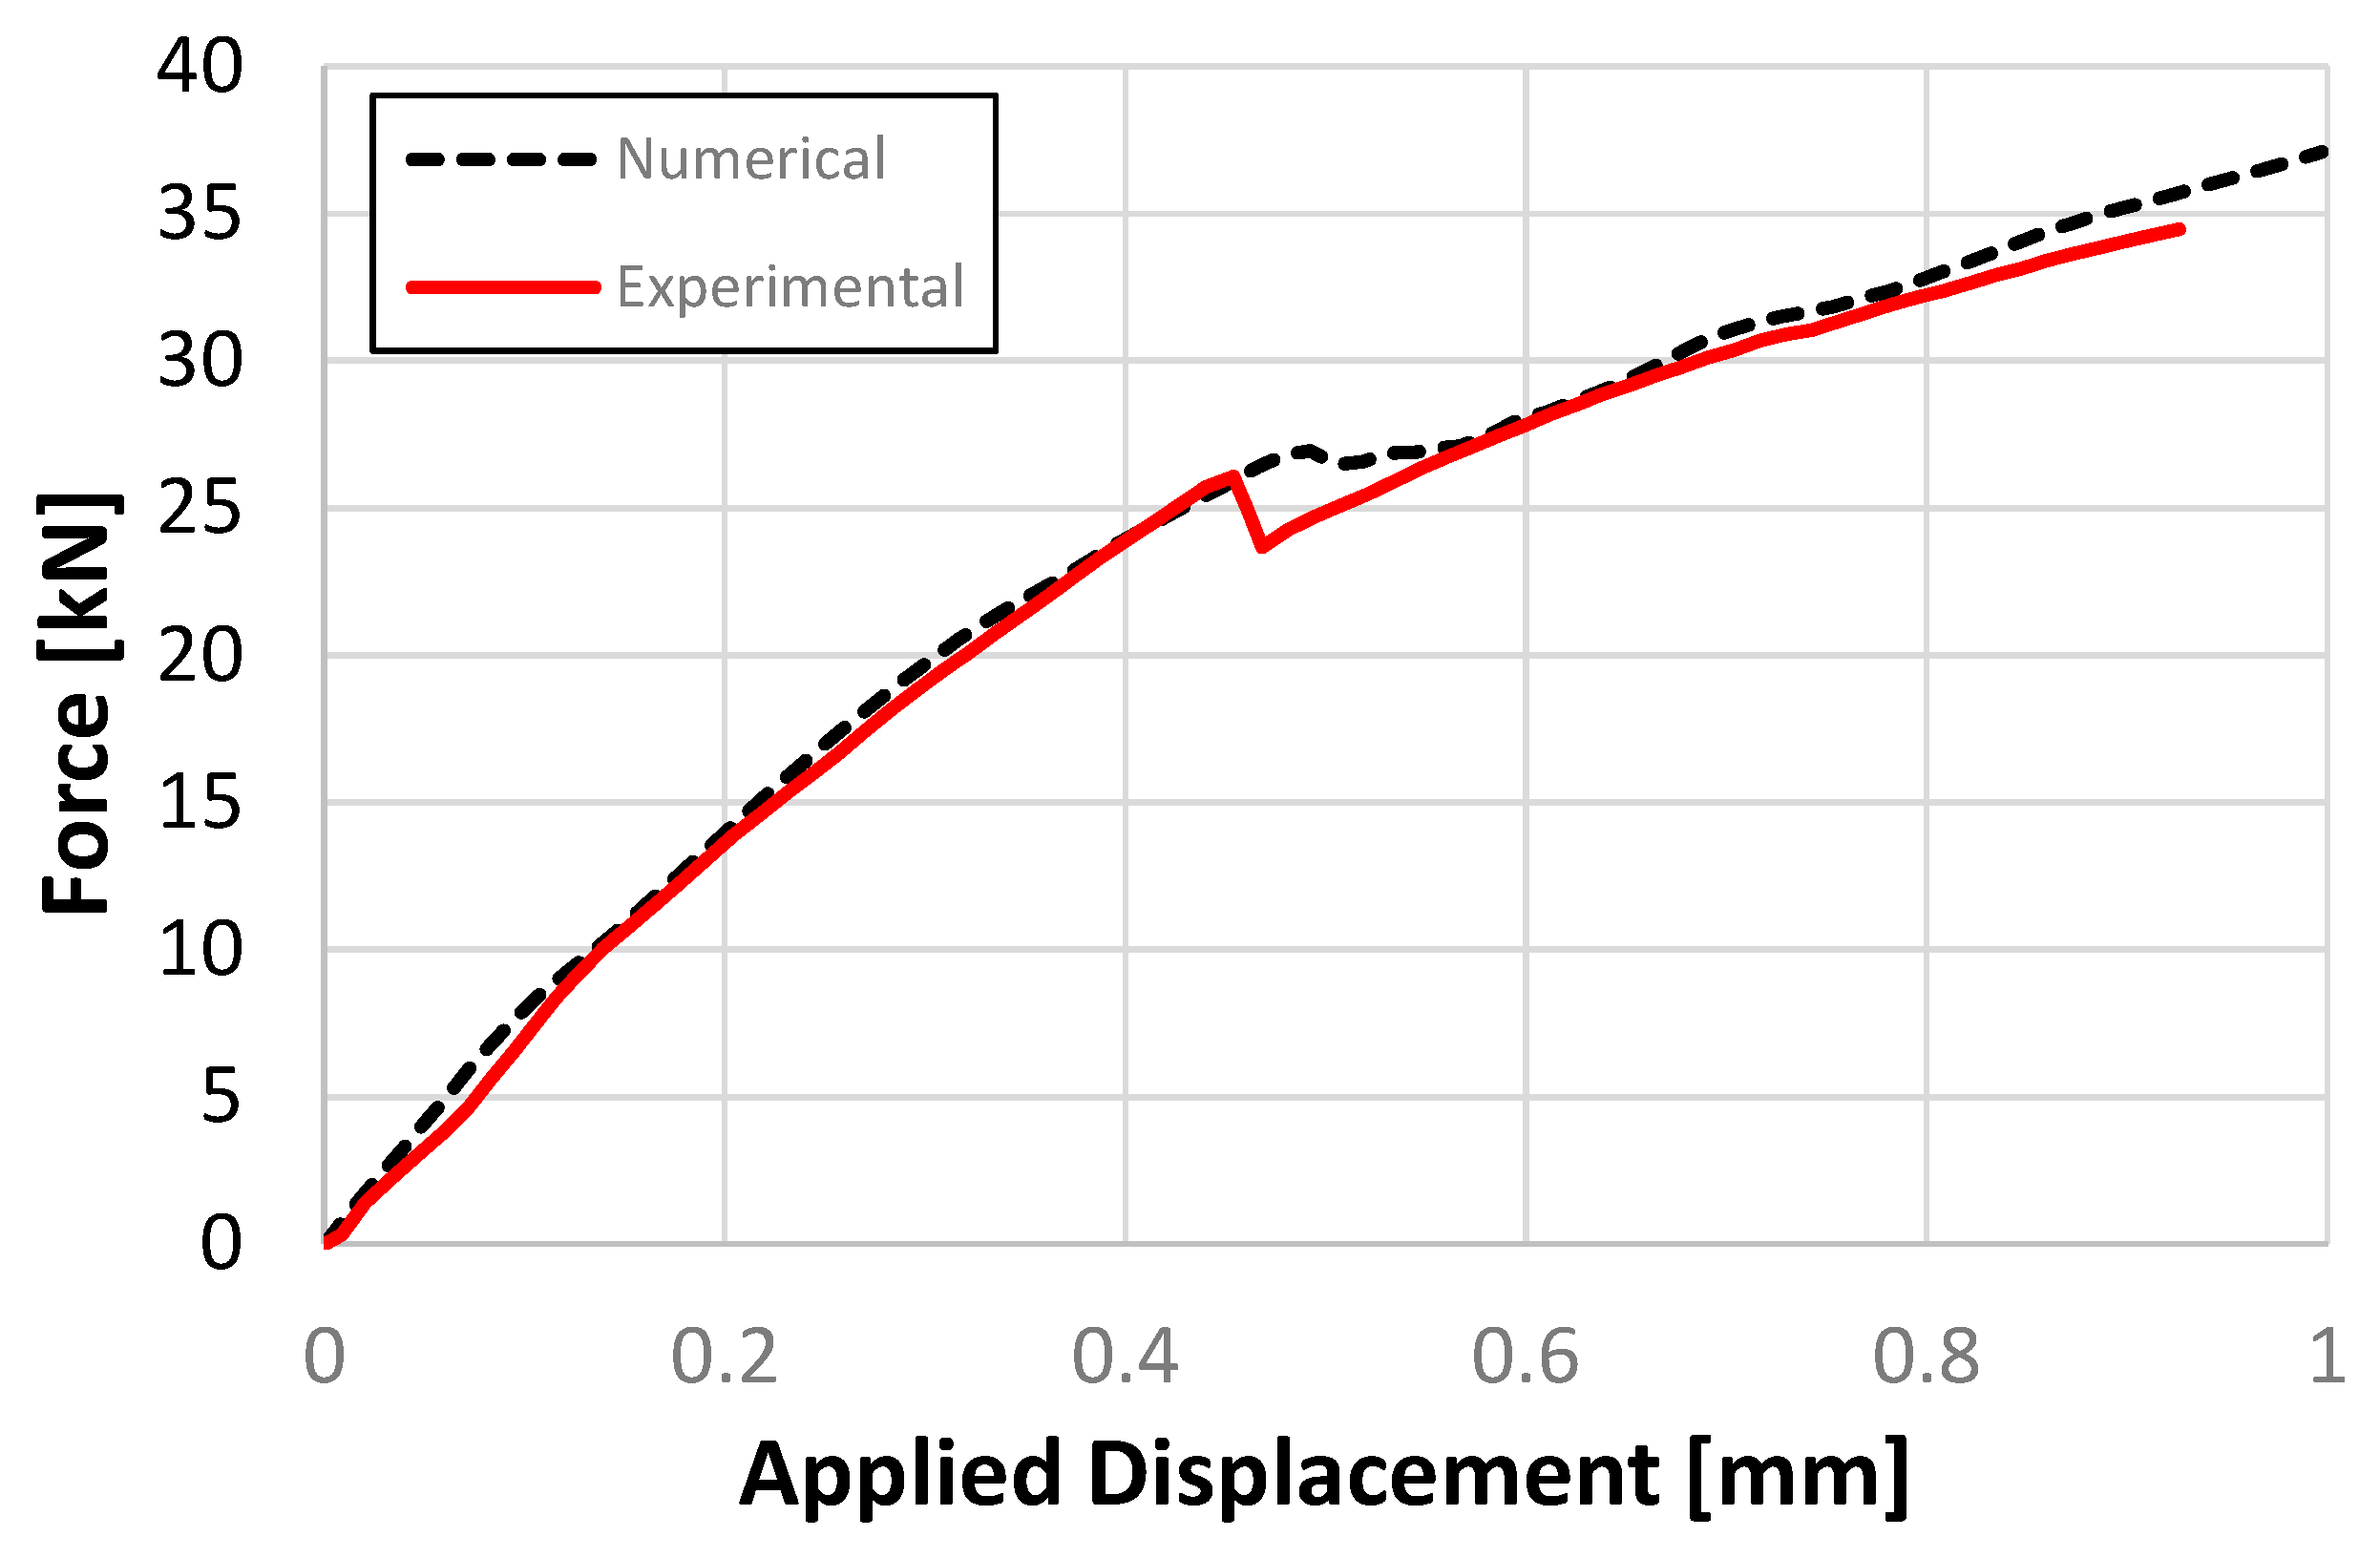
The quasi-static analysis is performed using the dynamic implicit solver under displacement-controlled conditions to replicate the tests. In the dynamic implicit solver, inertia effects are introduced to regularize the model’s unstable behavior resulting from post-buckling phenomena and to enhance the convergence rate of the solver. The test campaign included two specimens subjected to quasi-static compressive loads with a loading rate of 0.1 mm/min. The numerical results in terms of load vs. applied displacement are shown in
Figure 9, compared with the results of the experimental quasi-static test [
24].
The numerical results in
Figure 9 are in good agreement with the experimental data in terms of initial stiffness, buckling load and skin–stringer separation opening load and displacement. It must be noted that the model cannot predict the global collapse of the specimen that occurs during the experimental test at an applied displacement of about 0.92 mm due to the failure of the stringer, as the numerical model does not consider fiber/matrix failure.
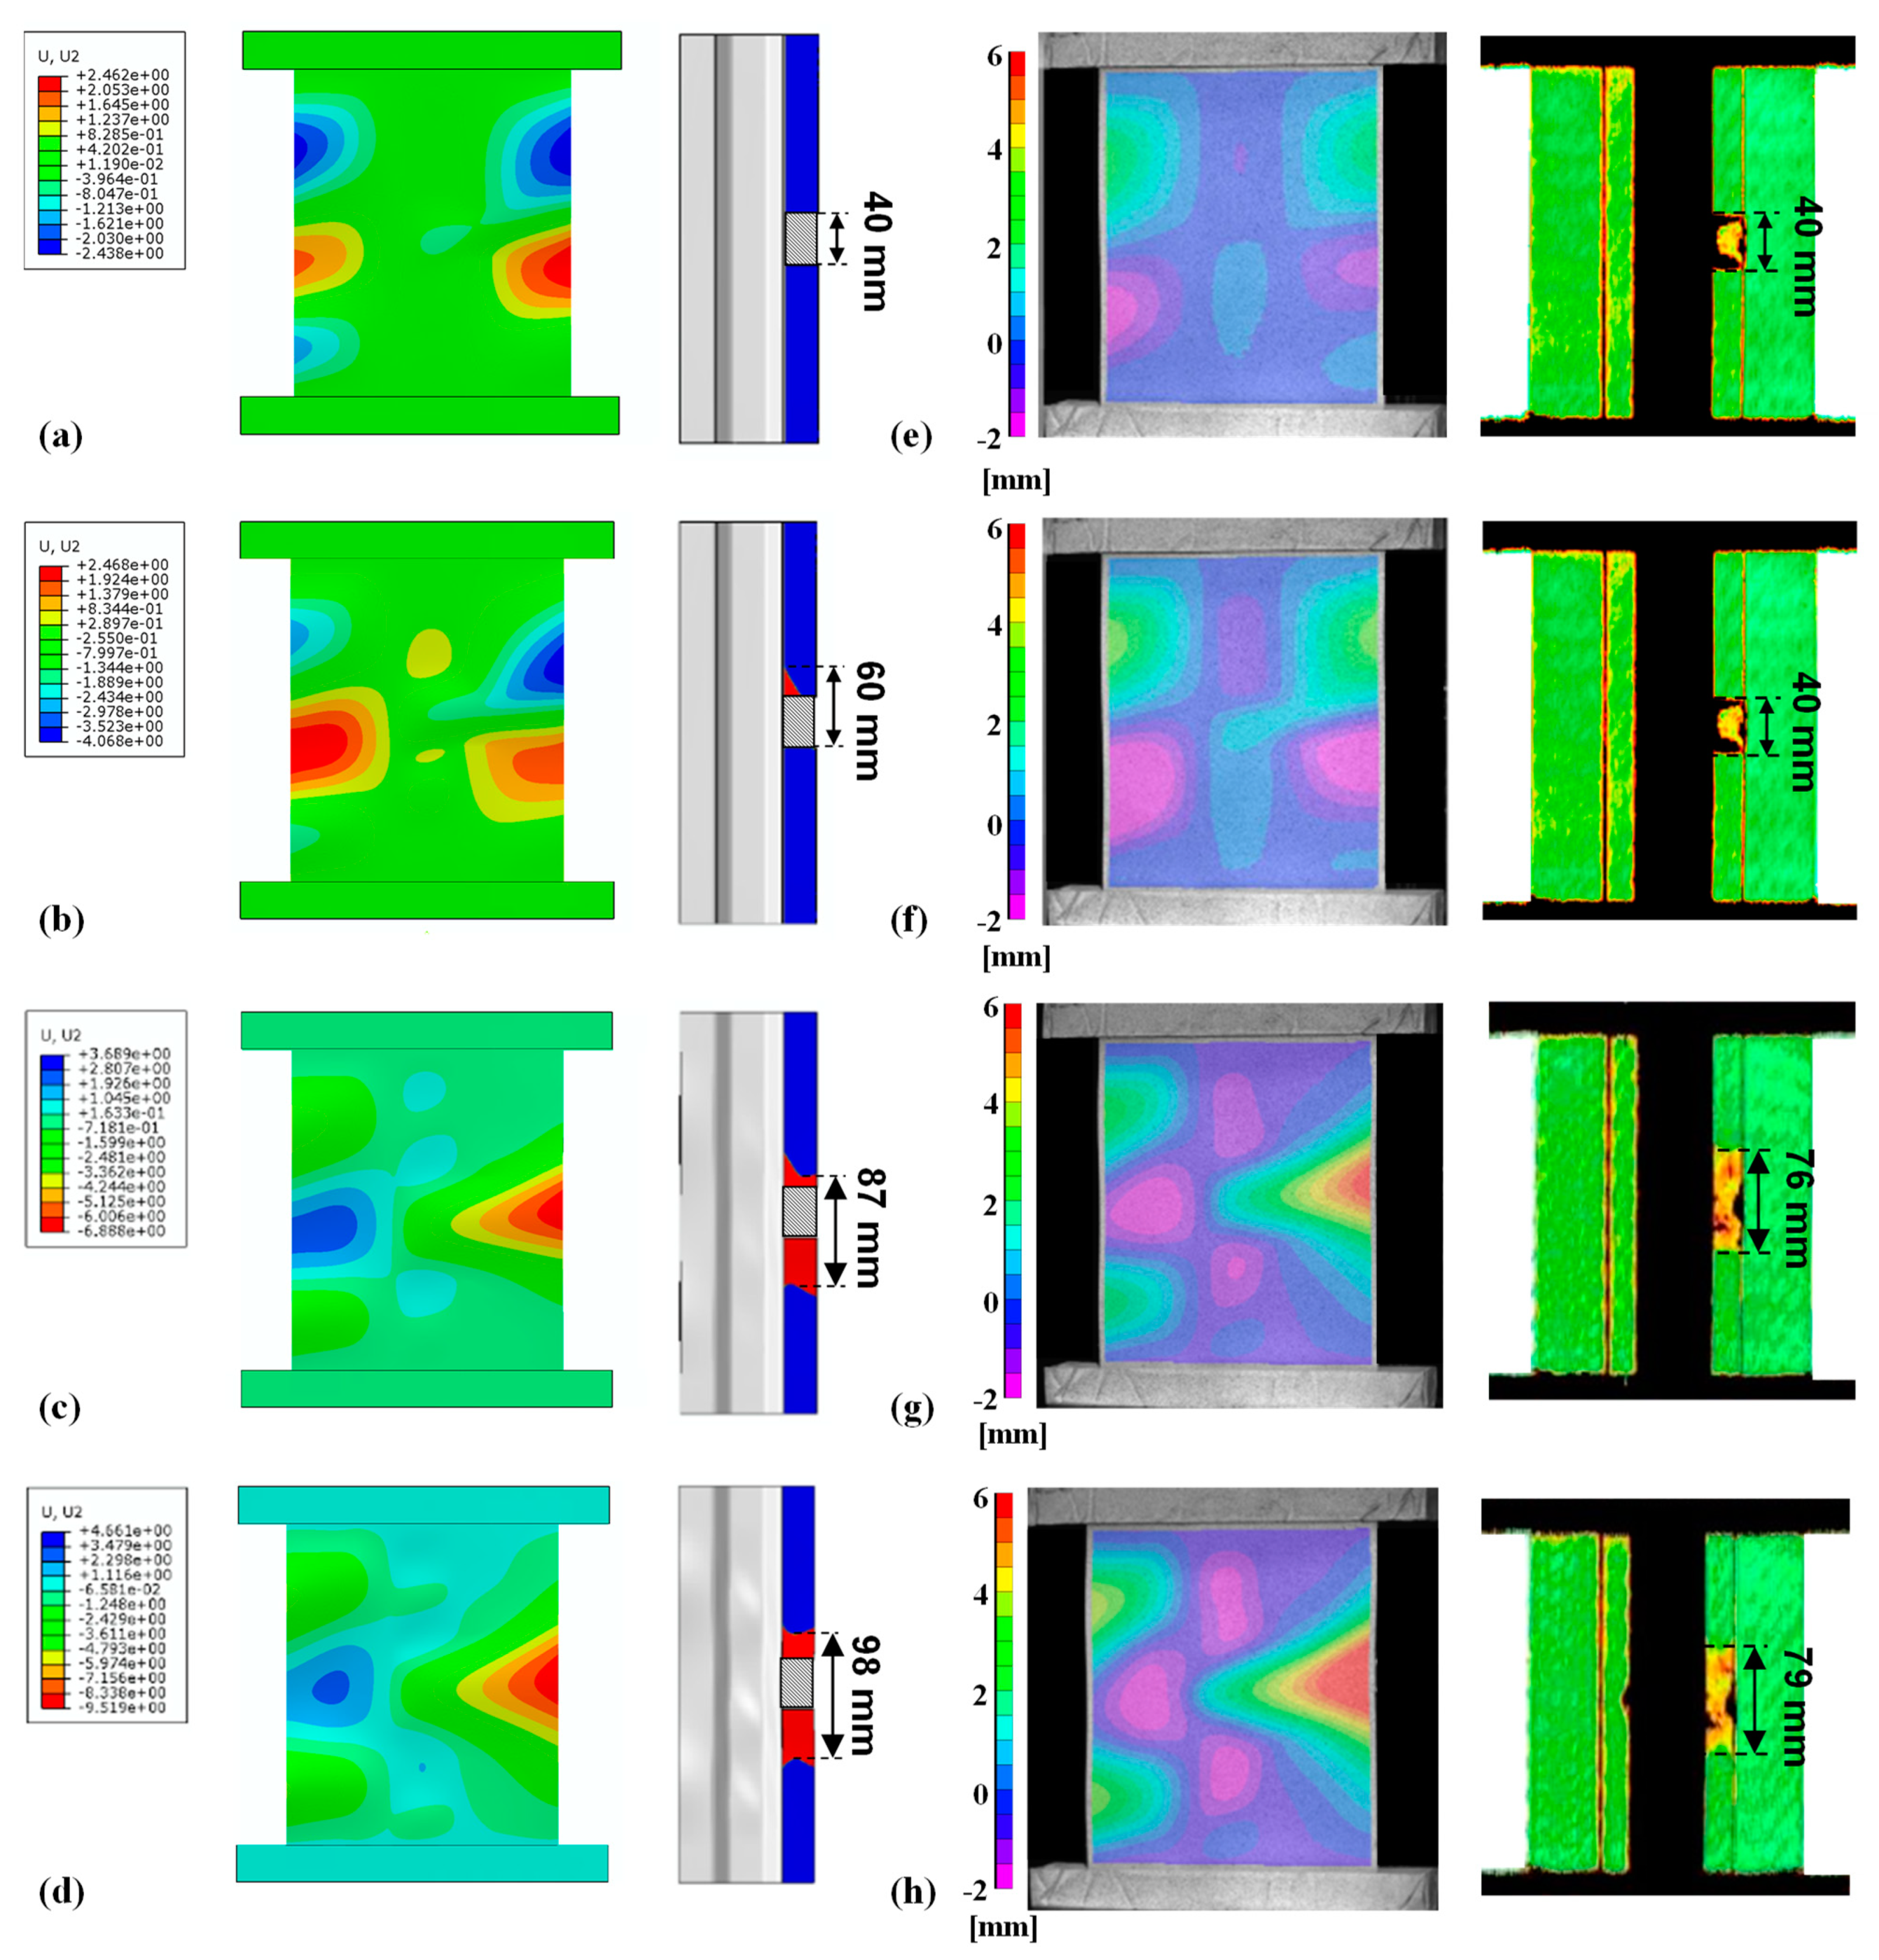
Figure 10 shows the contour plot of the out-of-plane displacements at four different values of the applied load with the corresponding evolution of the skin–stringer separation compared with the DIC images and ultrasonic C-scan acquired during the quasi-static test.
The evolution of the out-of-plane displacements predicted by the numerical model is in agreement with the DIC images from a qualitative point of view. Initially, the global buckling of the specimen starts in the skin with two half-waves on the side of the delamination and three on the opposite (
Figure 10a,e). As the load increases, it is possible to observe the effect of the skin–stringer separation on the buckling shape with an increase in the out-of-plane displacements in the delamination area (
Figure 10b,f). At an applied load of 27.4 kN the skin–stringer separation suddenly opened, causing a shift in the post-buckling shape with one half-wave observed on the delamination side and three half-waves on the opposite side (
Figure 10c,g). The change in the post-buckling shape and the onset of the delamination during the experimental test are associated with the load drop observed in the load-displacement curve shown in
Figure 9. In the experimental test, the load drop is steeper since the opening of the delamination occurs suddenly, while in the numerical model, the buckling shape transition and the delamination opening are more gradual. After this point, the post-buckling shape no longer changes, and the delamination keeps growing until it reaches the end of the refined cohesive zone (
Figure 10d,h). It can be noted from
Figure 10h that during the experimental test, the delamination propagates on the opposite flange before the collapse. The numerical model cannot simulate this phenomenon since no cohesive elements were placed there. It would have been possible to place cohesive elements underneath the undamaged flange; however, this would have resulted in a substantial increase in computational time. Anyway, it would not have been possible to use the same model for the fatigue analyses since the damage model based on Paris’ law allows one only to simulate the propagation of an existing damage and not the damage initiation in a pristine area.
From the comparison in
Figure 10, it can be observed that the skin–stringer separation in the numerical model propagates faster than in the experimental tests. One of the main reasons for this discrepancy are the interface properties adopted in the numerical analysis which are obtained from the standard DCB and MMB specimens with a delamination positioned between 0° plies, while in the SSC the skin–stringer separation is positioned between −45° and 45° plies. Previous work [
34] has shown that delamination between differently oriented plies results in a large increase of the fracture toughness as the delamination propagates due to the presence of fiber-bridging and delamination migration to adjacent plies, phenomena which were both observed during the performed experimental tests.
6. Fatigue Analysis and Experimental Comparison
The “Min–Max Load Approach” is implemented to study fatigue behavior by discretizing two identical models in the same analysis, as shown in
Figure 7. The two models are subjected to different constant loads, one to the maximum load and the other to the minimum load of the fatigue cycle. During the analysis, the two models exchange information to perform the fatigue calculation following the operations described in
Figure 5. The boundary conditions applied to each model are identical to those used in quasi-static analysis and are enforced through reference nodes associated with the degrees of freedom of the nodes on the external faces of the two specimens. An image of the FE model before the analysis is shown in
Figure 11.
To replicate the experimental testing conditions, a load-controlled analysis is performed using the dynamic implicit solver with the specimen cycling between 25.2 kN and 2.52 kN. The analysis is divided into two steps: in the first quasi-static step, the load is increased up to the minimum and maximum values; then, in the second step, the load is kept constant.
The growth of the delamination, as the number of cycles increases, affects the post-buckling shape of the specimen, as shown in
Figure 12, where the post-buckling shape with the out-of-plane displacements distribution and the damage propagation predicted by the numerical model can be qualitatively compared to the DIC and C-scan images captured during the experimental test. The DIC images are slightly tilted since the two cameras used for the VIC3D were not perfectly aligned perpendicular to the specimen.
At the beginning of the fatigue test, the post-buckling shape consists of two half-waves on the delamination side and three half-waves on the opposite side (
Figure 12a,d). The growth of the skin–stringer separation results in a change of the post-buckling shape with one half-wave on the delamination side and three half-waves on the opposite side (
Figure 12b,e). As the number of cycles increases, the post-buckling shape remains stable and the half-wave on the delamination side slowly moves towards the center while the out-of-plane displacements increase (
Figure 12c,f). The analysis is terminated after 990 cycles, when the delamination reaches the end of the refined cohesive zone.
It can be observed that there is an agreement between the sequence of events observed during the experimental fatigue tests and the numerical analysis. On the other hand, a quantitative comparison of the propagation of the delamination with the number of cycles shows that the numerical model tends to overestimate the growth of the delamination, similar to the findings of the quasi-static analysis. The same considerations made in the previous section regarding the increase of fracture toughness as the delamination propagates can be extended to the fatigue analysis. Indeed, the Paris’ law parameters adopted in the numerical model were obtained from unidirectional specimens where the effect of fiber bridging and delamination migration are negligible.
In the numerical analysis, the skin–stringer separation starts to propagate already during the first cycle (
Figure 12a). The delamination starts to grow from the top left corner, influenced by the post-buckling shape of the panel. As the number of cycles increases, the skin–stringer separation rapidly grows (
Figure 12b), resulting in the delamination fronts taking on a progressively straighter configuration. After 990 cycles, the damage reaches the end of the refined cohesive zone, and the analysis is stopped (
Figure 12c).
On the other hand, the experimental C-scan images show that the delamination remains closed during the first cycle (
Figure 12d); it opens around 7000 cycles, resulting in the change in the buckling shape observed in
Figure 12e, and finally slowly grows, reaching 77 mm after 50,000 cycles (
Figure 12f). The progression of the skin–stringer separation is clearly influenced by the sequence of buckling events, which in turn is affected by the growth of the delamination. During the experimental test, the delamination length stabilized after 50,000 cycles. Subsequently, the specimen was able to endure 150,000 cycles without experiencing a global collapse of the structure, prompting the termination of the test.
7. Analysis of Local Stress Ratio
As stated in
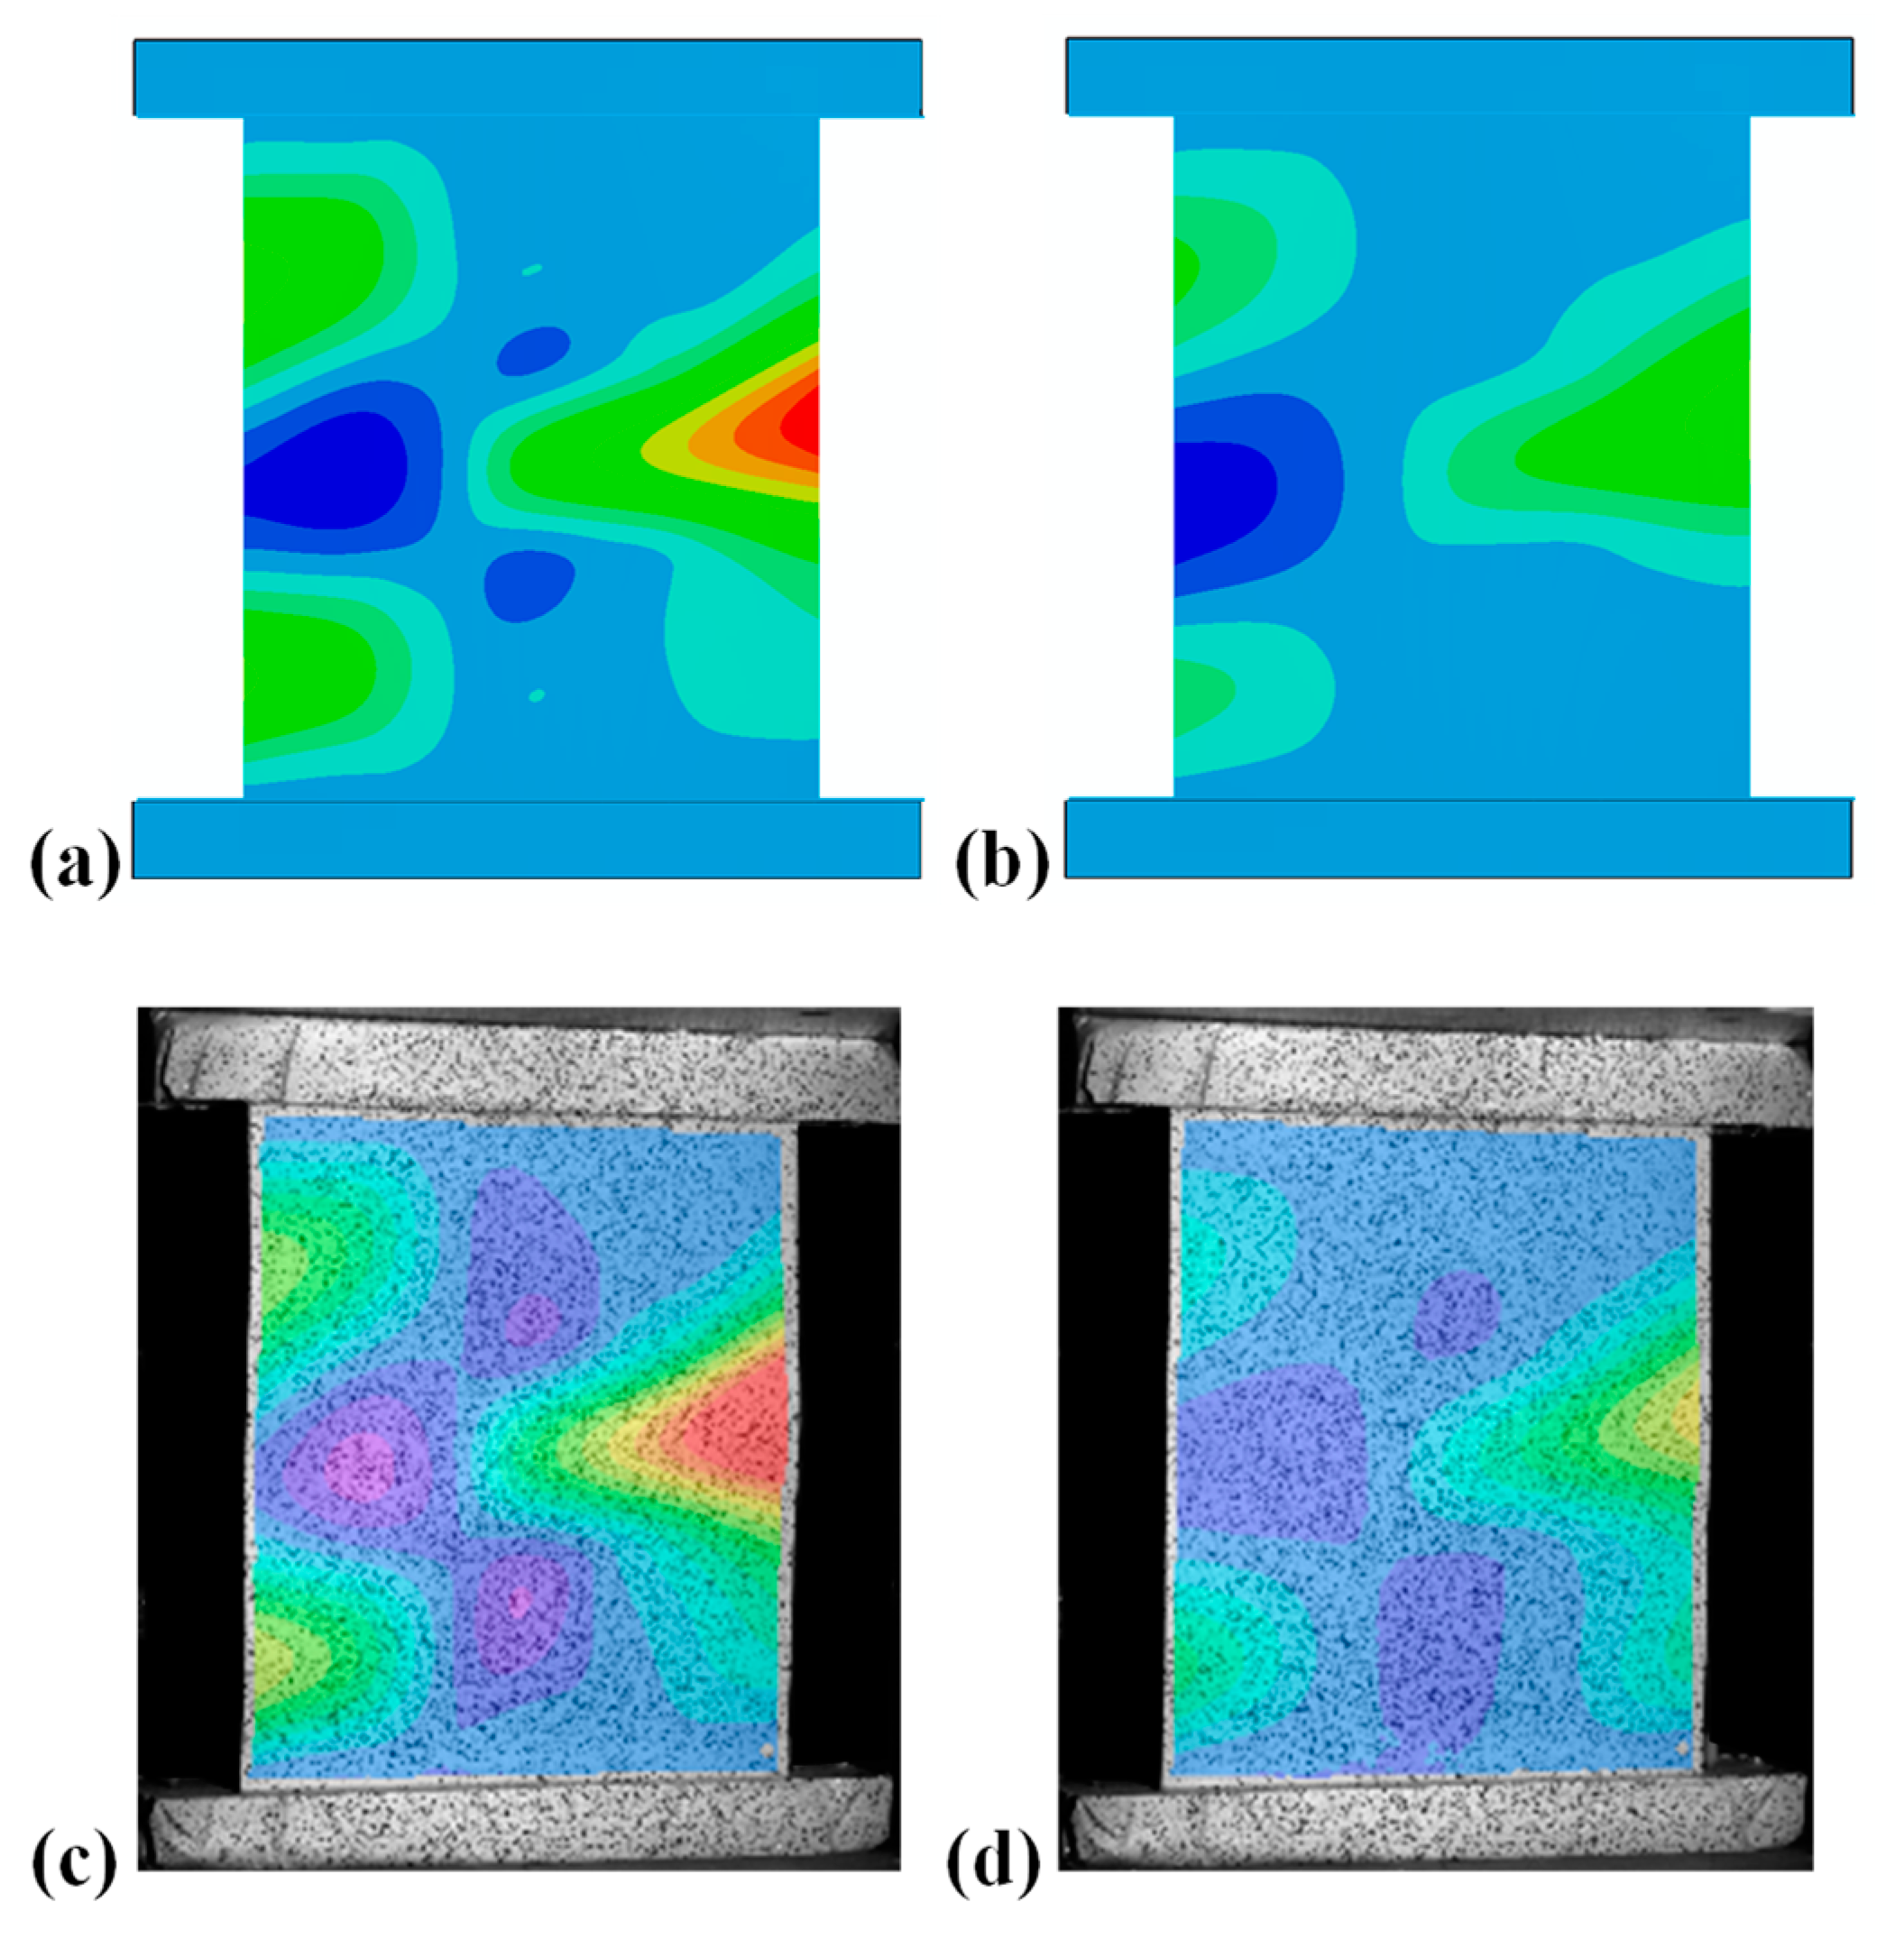
Section 2, the “Min–Max Load Approach” provides insight into the deformed shape of the structure when subjected to the minimum load during each fatigue cycle. To illustrate the significance of this knowledge,
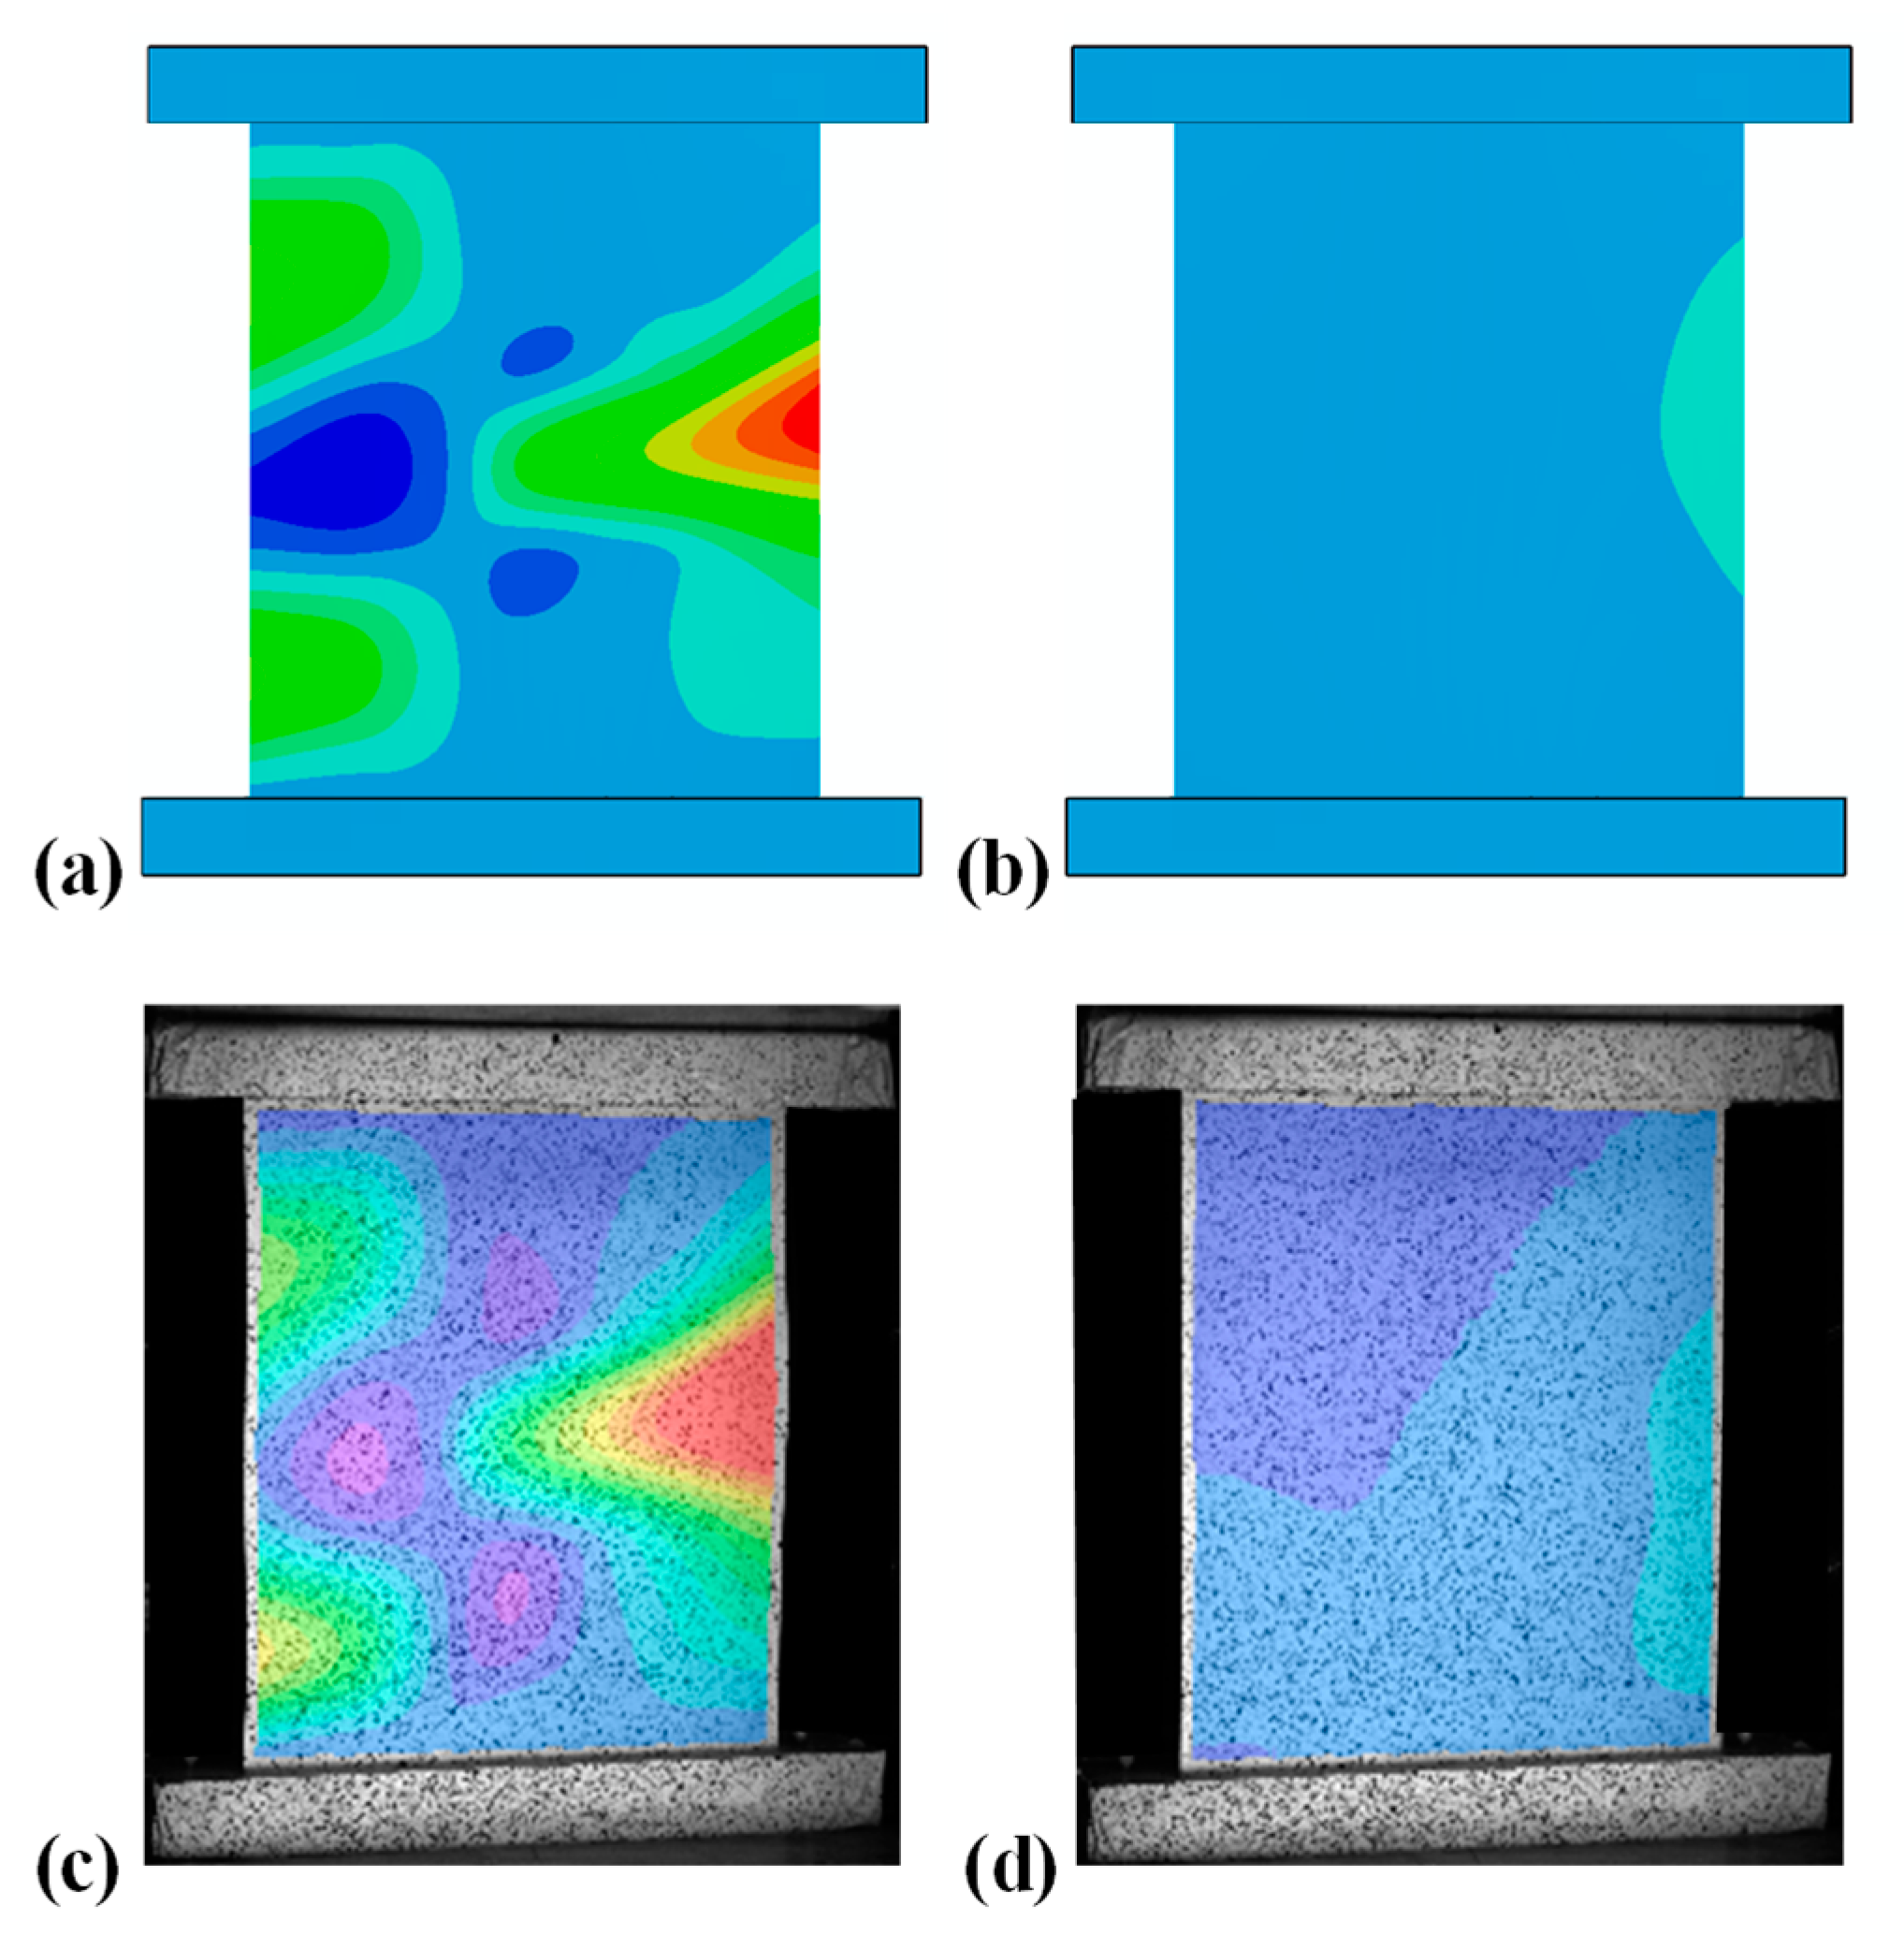
Figure 13 and
Figure 14 compare the numerical deformed shapes with the out-of-plane displacements contour plot at the minimum and maximum load with the experimental DIC images during the first cycle for an analysis with a maximum load of 29.2 kN and a load ratio of 0.1 and 0.5, respectively. From both the numerical and experimental images of the specimen subjected to an applied load ratio of 0.1, shown in
Figure 13, it is possible to observe that the specimen oscillates between pre- and post-buckling conditions during each fatigue cycle. On the other hand, from the images related to the specimen subjected to an applied load ratio of 0.5 in
Figure 14, the specimen remains in post-buckling at both the minimum and maximum loads. This phenomenon would not have been captured using traditional load envelope approaches since the deformed shape of the structure at the minimum load is assumed to be equal to the one at the maximum load with the displacements scaled by the applied load ratio.
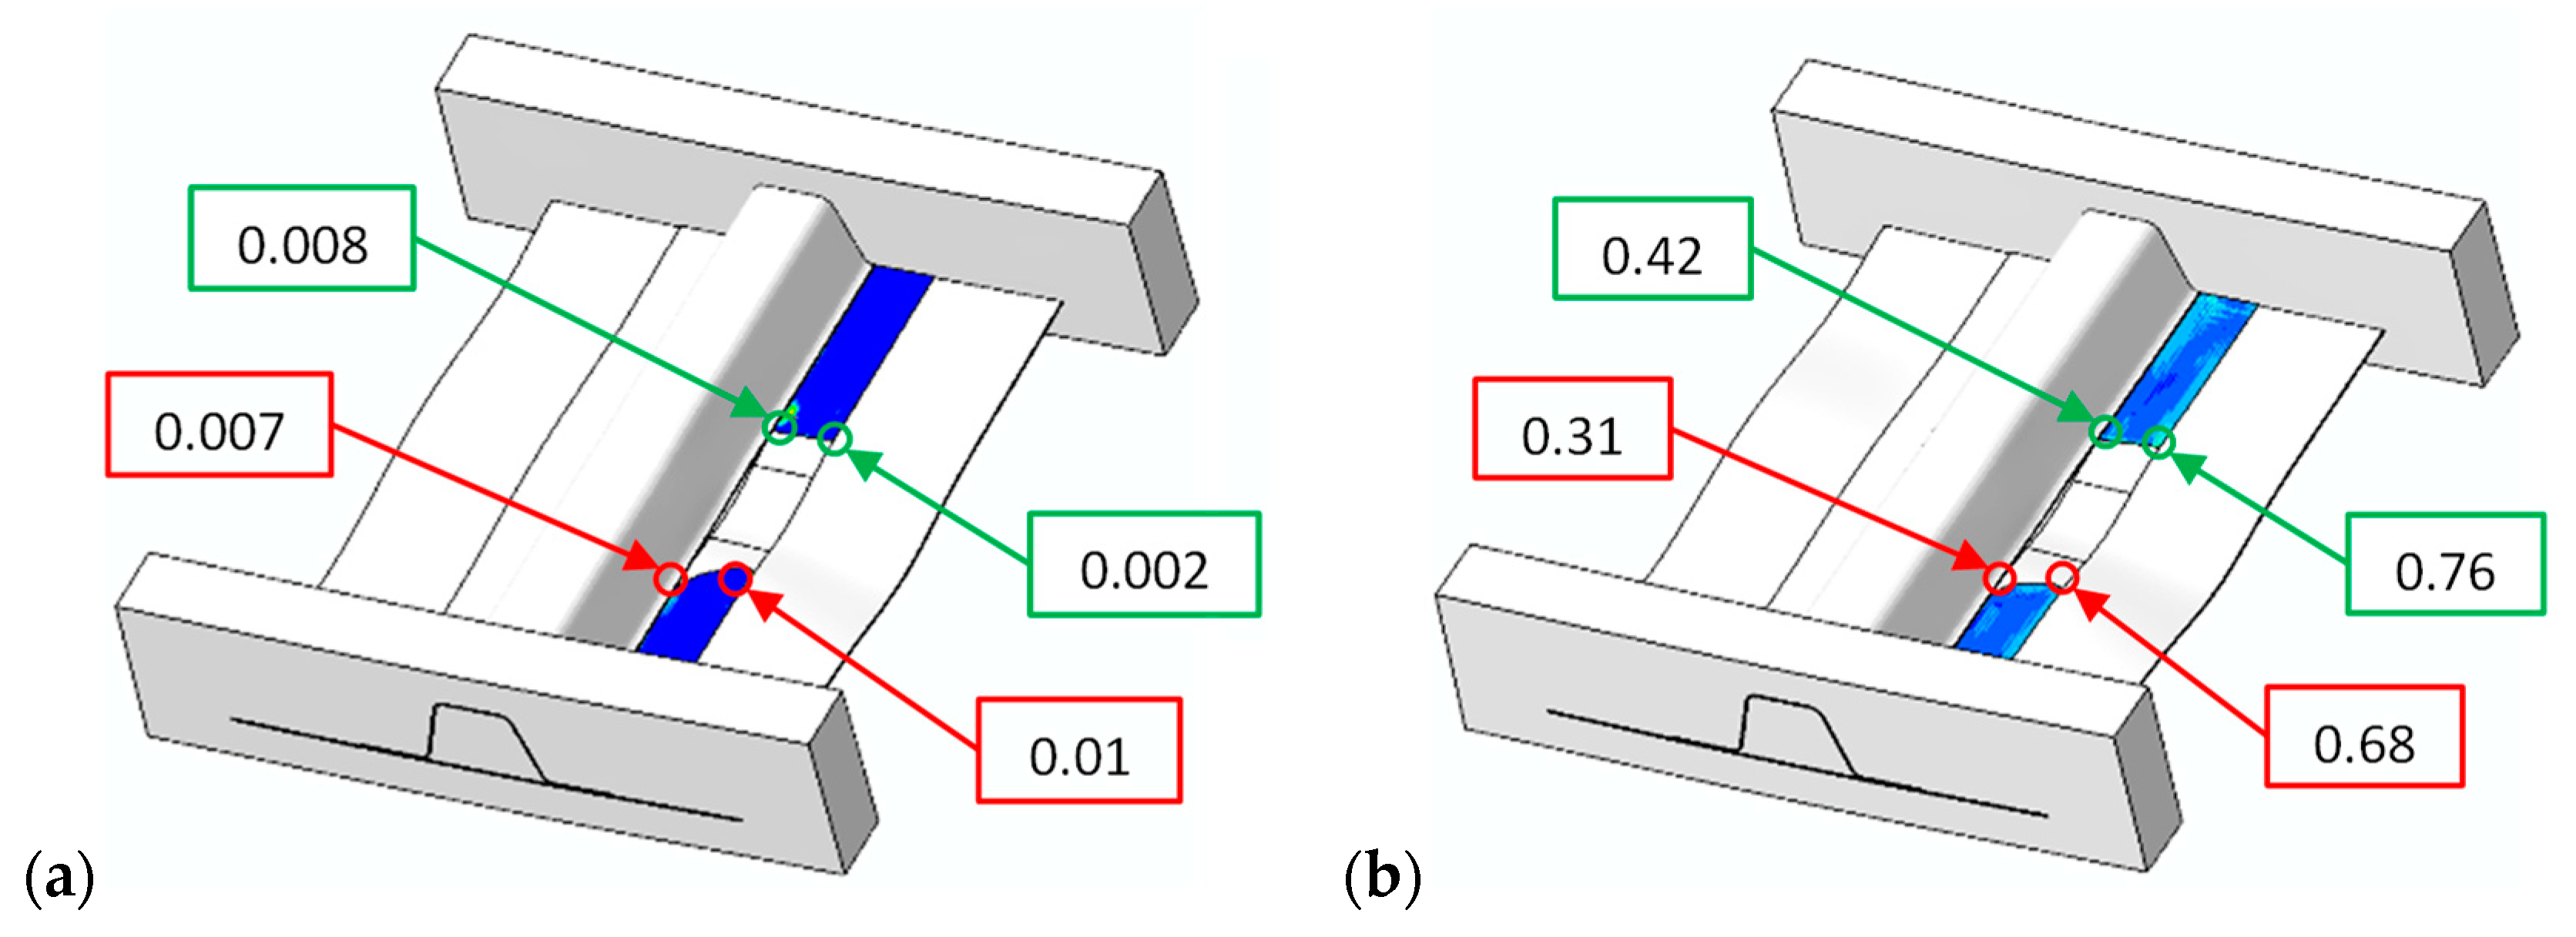
During the numerical analysis, within the UMAT, the value of the local stress ratio is calculated for each integration point of the cohesive elements for each increment of the non-linear analysis and stored in a state variable. In
Figure 15a,b the contour plots of the state variable related to the local stress ratio are presented for the analyses with an applied load ratio of 0.1 and 0.5, respectively. As expected by observing the numerical deformed shapes of the analysis with an applied load ratio of 0.1 shown in
Figure 15a, the value of the local stress ratio is almost zero along the delamination front because the structure at the minimum load is only slightly deformed, resulting in almost zero opening stresses in all the points. On the other hand, for the analysis with an applied load ratio of 0.5, shown in
Figure 15b, the local stress ratio varies along the delamination front from zero to values close to one. Additionally, the local stress ratio changes as the delamination propagates since the post-buckling shapes at the minimum and maximum load may differ. The significance of the developed “Min–Max Load Approach” in simulating fatigue delamination growth in the post-buckling regime lies in its ability to use the actual values of the local stress ratio in all the points to calculate the delamination propagation rate, whereas traditional load envelope approaches would have assumed a local stress ratio equal to 0.1 and 0.5 everywhere on the delamination front.
8. Conclusions
The fatigue behavior of composite stiffened structures in post-buckling conditions has been numerically investigated. This study has focused on validating, using in-house experimental data, a numerical approach for simulating fatigue delamination propagation on single-stringer composite specimens. The numerical methodology, called the “Min–Max Load Approach”, based on the Cohesive Zone Model technique, is able to dynamically capture the local stress ratio during the damage evolution.
The response of a single-stringer composite specimen with an initial delamination under post-buckling compressive fatigue load was numerically investigated. The numerical results have proven to be consistent with the data of the experimental campaign, demonstrating both the potential and limitations of the proposed approach. The delamination opening load obtained from the quasi-static analysis (27.4 kN) is around 5% higher than the experimental value (26 kN); however, both the quasi-static and the fatigue analyses overestimated the delamination propagation. During the fatigue analysis, with the specimen cycling between 25.2 kN and 2.52 kN, the delamination exhibited rapid growth, extending to the end of the refined cohesive zone (94 mm) after 990 cycles, while in the experimental tests it reached 77 mm after 50,000 cycles. The analysis of the local stress ratio revealed that for an applied load ratio of 0.1, the local stress ratio remains almost zero across the delamination front. In contrast, at an applied load ratio of 0.5, significant fluctuations in the local stress ratio are evident across the delamination front, with values ranging between 0.3 and 0.8. Further studies are needed on the fracture material properties adopted as the input of the numerical model. Specifically, in this work, the material properties are obtained from standard unidirectional specimens where the delamination is positioned between 0° plies and no R-curve effect has been considered. A fully static and fatigue material characterization in terms of fracture toughness and R-curve for all mode mixities is necessary to further improve the numerical results. Despite these limitations, the proposed numerical methodology represents a step forward towards developing numerical tools for accurately simulating delamination growth under fatigue loading conditions in complex structural problems compared to the current state of the art, which is mostly limited at the coupon level. The methodology has the potential to be scaled up for larger structures representing components or subassemblies of aeronautical structures. Enlarging the structure would lead to a substantial increase in computational cost, as the structure needs to be modeled twice. Nevertheless, applying a constant load would facilitate the convergence of the nonlinear algorithm since at each load increment the deformed state of the structures does not deviate significantly from the previous equilibrium state.


